Abstract
Spring frost damage (SFD), defined as the disaster during the period of newly formed tea buds in spring caused by lower temperature and frost damage, is a particular challenge for tea plants (Camellia sinensis), whose capacity to adapt to extreme weather and climate impacts is limited. In this paper, the region of the Middle and Lower Reaches of the Yangtze River (MLRYR) in China was selected as the major tea plantation study area, and the study period was focused on the concentrated occurrence of SFD, i.e., from March to April. By employing the standard lapse rate of air temperature with elevation, a minimum temperature (Tmin) estimation model that had been previously established was used based on reconstructed MYD11A1 nighttime LST values for 3 × 3 pixel windows and digital elevation model data. Combined with satellite-based Tmin estimates and ground-based Tmin observations, the spatiotemporal characteristics of SFD for tea plants were systematically analyzed from 2003 to 2020 in the MLRYR. The SFD risks at three scales (temporal, spatial, and terrain) were then evaluated for tea plants over the MLRYR. The results show that both SFD days at the annual scale and SFD areas at the daily scale exhibited a decreasing trend at a rate of 2.7 days/decade and 2.45 × 10⁴ ha/day, respectively (significant rates at the 0.05 and 0.01 levels, respectively). The period with the highest SFD risk appeared mainly in the first twenty days of March. However, more attention should be given to the mid-to-late April time period due to the occurrence of late SFD from time to time. Spatially, areas with relatively higher SFD days and SFD risks were predominantly concentrated in the higher altitude areas of northwestern parts of MLRYR for both multi-year averages and individual years. Fortunately, in regions with a higher risk of SFD, the distribution of tea plants was relatively scattered and the area was small. These findings will provide helpful guidance for all kinds of people, including government agencies, agricultural insurance agencies, and tea farmers, in order that reasonable and effective strategies to reduce losses caused by spring frost damage to tea plants may be recommended and implemented.
1. Introduction
In early spring, herbaceous and woody plant species begin to sprout. It is well known that the meteorological conditions during the flowering and fruit setting periods for economic fruit trees are critical for determining the output and economic income. Similarly, the meteorological conditions are also important for tea (Camellia sinensis) plant production during both the newly formed tea bud period and the spring tea picking period, because the economic benefits of spring tea have accounted for more than 70% of the total tea revenue in recent years in the middle and lower reaches of the Yangtze River region (MLRYR), China [1]. As one of the major tea plantation areas in China, the MLRYR tea plantation accounted for up to 1.04 × 10⁶ ha in 2019 with a production of 0.97 × 10⁹ kg, achieving for 34.0% of the tea area and 34.6% of the tea production in all of China (available at https://www.puercn.com/news/84437/. Last visited on 8 July 2021).
With the climate warming, the global average air temperature is likely to increase by 0.3–4.8 °C at the end of this century [2]. The ground-based observations of leaf unfolding dates over 31 sites in China have demonstrated a significant advancement, with values of 2.62 and 2.45 days for forest and grassland ecosystems, respectively, due to an increased mean annual temperature of 1 °C [3]. Additionally, both in-situ and NDVI observations indicated that the leaf-out date of temperature forest trees in western Central Europe has advanced during the period of 1982–2011 at an average rate of 0.45 days yr−1 [4]. Recent studies have revealed that the frequency, intensity, and duration of extremely low temperature events, especially spring frost damage (SFD) risk, are also likely to continuously increase under 21st-century warming scenarios [5,6]. Therefore, the threats of SFD to herbaceous and woody plant species, especially to vulnerable plant organs (newly formed buds and young leaves for tea plants; flowers and young fruits for orchards), are increasing under an earlier growing season onset in the temperate zone [6,7,8,9,10,11].
Spring tea, harvested from March to early May, is an important segment of the tea market owing to its high economic benefits. As a result of climate variability, spring frost is becoming a common occurrence during the period of newly formed tea buds over hilly regions in China. According to historical records (Yearbook of Meteorological Disasters in China), tea gardens in MLRYZ have suffered early spring frost damage almost annually since 2005, and this frost damage has seriously affected tea production and economic benefits. For example, an occurrence of strong cold air in northern China in early April 2013 caused the minimum air temperature on April 7 in Zhejiang Province to drop by 5 to 7 °C. In most areas, air temperature was below 4 °C, and in some hilly tea gardens it dropped to −2 to 0 °C. This cooling process caused serious damage to spring tea production as tea was in the full-picking period. The loss in famous tea production was more than 1140 t, and the direct economic loss reached about 720 million yuan in Zhejiang Province in early April 2013 [12].
The term “frost” technically refers to the development of ice on surfaces, either by the solidifying of dew or a phase change from vapor to ice resulting from either land surface temperatures (ground frost) or air temperatures (air frost) below 0 °C [13]. Among tea farmers in Kenya [14] and agrometeorological researchers in China [12], the term frost is colloquially used to describe a phenomenon involving damage to crops by low temperatures. During clear and windless nights, radiative cooling will reduce ambient air temperatures in near ground positions and plant tissues, which may become 4 to 8 °C lower than those measured with thermometers under the sheltered conditions of a standard Stevenson Screen at a height of 2 m above the ground surface [15]. Ground-based meteorological observations showed that when daily minimum air temperature is less than 4 °C in spring, newly formed tea buds were affected by spring frost [16], and the commodity value of the tea declined correspondingly. The Chinese Meteorological Industry Standard also regards 4 °C air temperature as the trigger temperature of spring frost damage for tea plants [17]. Numerous studies regarding spring frost effects on tea plants have been conducted to identify the spatiotemporal distribution characteristics [18], to assess the damage impacts [19], and to evaluate risk [20] at provincial or county scale based on the minimum air temperature observations at ground-based meteorological stations. Limited by weather station network location and distribution, meteorological observations at site scales cannot effectively capture spatial variation, especially in rural, undeveloped, and less populated areas where the distribution of meteorological stations is very sparse [21,22], and in complex terrain areas where elevation changes drastically [23]. Great efforts have been taken to resolve this lack of high spatial resolution air temperature (Ta) data by interpolation of Ta readings between known meteorological sites. Thin Plate Smoothing Splines (TPSS) and Kriging (ordinary and cokriging) are considered better interpolation methods with relatively high accuracy and low bias compared with other interpolation methods [24,25]. These methods have been proven to be successful in estimating temperatures near meteorological stations. However, the spatial variability of temperature may be sensitive to latitude, longitude, elevation, and season. A useful interpolation method should be able to capture characteristics in different research regions and periods by adding appropriate variables [26]. Unfortunately, such a universal interpolation method has not been effectively developed yet.
Satellite remote sensing provides unprecedented globally continuous coverage of critical land surface parameters at high spatial resolution. These parameters include vegetation indices, leaf area index, surface temperature, etc. Land surface temperature (LST) is the radiative skin temperature of the land surface [27] as retrieved from top-of-atmosphere brightness temperatures in the infrared spectral channels of a remote sensor. Spatial estimates of temperature at high temporal (daily) and spatial resolution (1 km) appeared in 1981 with the launch of the Advanced Very High-Resolution Radiometer (AVHRR) on board a National Oceanic and Atmospheric Administration (NOAA) satellite, and later with the Moderate Resolution Imaging Spectroradiometer (MODIS) on board NOAA’s Aqua and Terra satellites in 2000 [28]. Therefore, methods regarding air temperature (Ta) estimation with spatial patterns have been widely researched based on MODIS LST products and some auxiliary data over wide areas, such as the mixed bootstrap and jackknife resampling method in Portugal [29], the stepwise linear regression method in east Africa [30], the temperature-vegetation index (TVX) method in the north Tibetan Plateau [21], the random forest machine learning approach in urban landscapes [31].
Methods for estimating maximum (Tmax), minimum (Tmin), and average (Tavg) air temperature have been successfully developed in recent years. However, applications of spatially continuous Ta patterns from remote sensing data have rarely been reported in publications. Wang et al. took three cooling periods in 2006 as examples to identify the spatial distribution of SFD for tea plants with estimated Tmin based on MODIS LST products and the standard lapse rate of air temperature with elevation [32]. Results showed that three cooling periods were exactly identified, especially for several highlighted cities and counties recorded in the “Yearbook of Meteorological Disasters in China”.
The major objective of this study was to further analyze the spatiotemporal distribution characteristics of SFD on tea plants with spatially continuous satellite-based Tmin estimates at high temporal scale over the MLRYR in China from 2003 to 2020 based on a previous publication [32], and then to clarify the temporal, spatial, and terrain risks of SFD. To reach this goal, the study area and data are first described in Section 2. The Tmin estimation method based on satellite-based reconstructed LST values and elevation products is then briefly introduced in Section 3. Next, the spatiotemporal distribution characteristics and risks of SFD for tea plants are systematically analyzed at 1 km resolution over the MLRYR in China in Section 4. Finally, some limitations are discussed and conclusions are summarized at the end of this paper.
2. Study Area and Data
2.1. Study Area
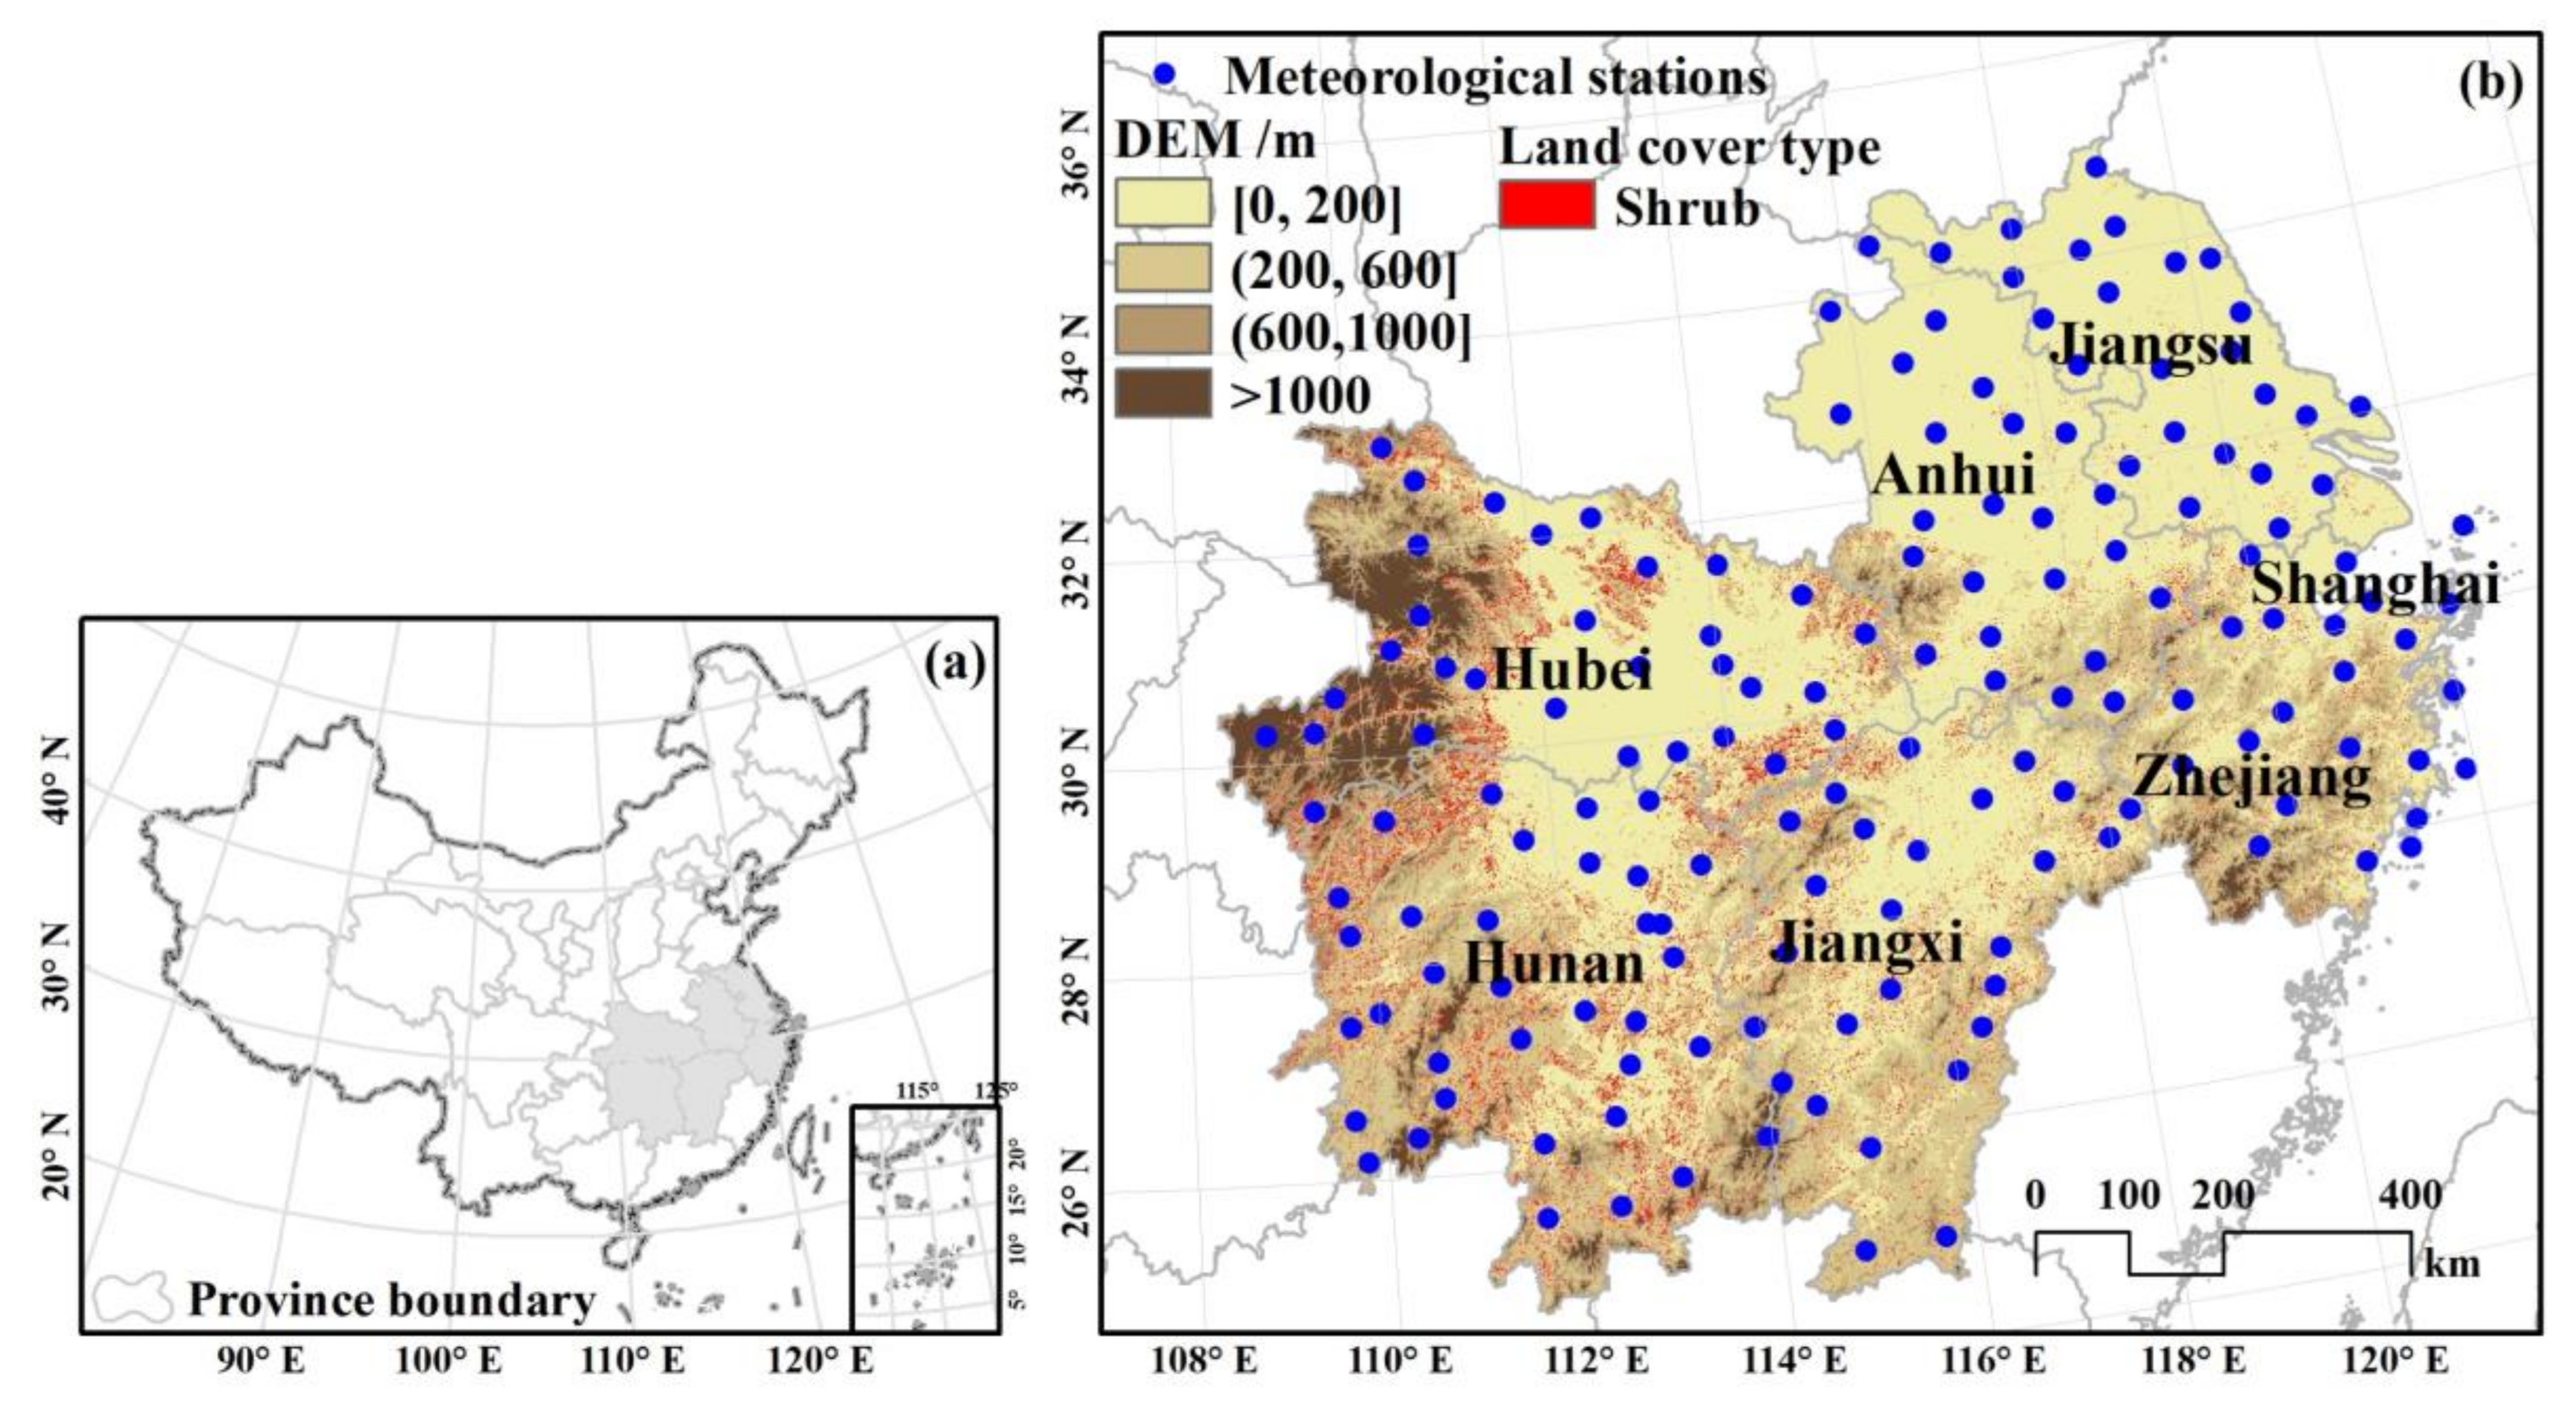
The MLRYR (Figure 1) is across six provinces (Jiangsu Province, Zhejiang Province, Anhui Province, Jiangxi Province, Hubei Province, Hunan Province) and one municipality (Shanghai Municipality). The MLRYR is the most important tea-production area in China, and its annual tea output accounts for about two thirds of the country’s total output [12]. The tea gardens in the MLRYR are mainly distributed in hills and low mountain areas, and a few are scattered in high mountain areas with the elevation being more than 1000 m above sea level (Figure 1). The climatic characteristics are seasonally distinguishable in the MLRYR, and are characterized as warm in spring, hot in summer, cool in autumn, and cold in winter.
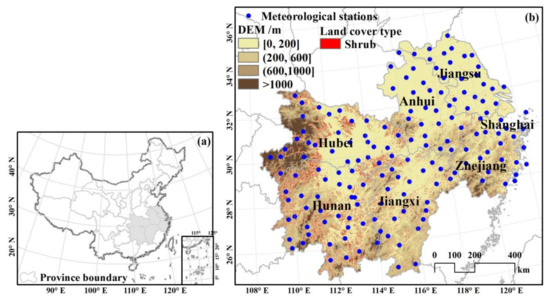
Figure 1.
Study area (a) and its meteorological stations shown as blue circles (b) in the middle and lower reaches of the Yangtze River region, China. In panel (b), the elevation in four levels was mapped with different shades of yellow, and the land cover type of shrub was denoted with red dots.
2.2. Data
2.2.1. Ground-Based Meteorological Data
Ground-based daily Tmin observations at 163 meteorological stations from March to April (the period when SFD occurs for tea in the MLRYR) in 2003–2020 were downloaded from the China Meteorological Administration Meteorological Data Network (http://data.cma.cn/site/index.html. Last visited on 25 April 2021). All data were quality checked, and there were no missing temperature records during the study period in the MLRYR.
2.2.2. Remotely Sensed Products
(1) MODIS LST products
MODIS products are available for public download via the Earth Observing System Data and Information System (EOSDIS) of the National Aeronautics and Space Administration (NASA (https://earthdata.nasa.gov/. Last visited on 26 April 2021). In this study, daily MODIS LST products (MYD11A1) at a spatial resolution of 1 km on board the Aqua satellite platform were used. To cover the entire study area, the LST products of four tiles in a 1200 by 1200 grid (h27v05, h27v06, h28v05, and h28v06) were downloaded from March to April in 2003–2020. A previous study demonstrated that nighttime MYD11A1 LST averaged at 3 × 3 pixel-window resolution was the best proxy for daily Tmin estimation [32]. Therefore, four tiles each day were re-projected to Albers Conical Equal Area (ACEA) projection, and then merged, resized, and mosaicked to get a nighttime LST dataset that was exactly consistent with the study area. Then daily good retrieval LST values recognized by quality control (QC) flags within a moving window of 3 × 3 pixels were averaged for estimating daily Tmin.
(2) MODIS Land Cover Type products
The MODIS Land Cover Type Product (MCD12Q1) was created using a hierarchical classification model that ingested a full year of 8-day MODIS Nadir BRDF-Adjusted Reflectance (NBAR) data [33]. The MCD12Q1 product provides six different legacy classification schemes, including IGBP (International Geosphere-Biosphere Programme), UMD (University of Maryland), LAI (Leaf Area Index), BGC (BIOME Biogeochemical Cycles), PFT (Plant Functional Types), and LCCS (Land Cover Classification System), at annual time steps and 500 m spatial resolution for 2001–present [33]. In this study, the PFT scheme was used to extract the shrub classification that corresponded to the tea planting area in the MLRYR (red color dots in Figure 1b).
(3) Aster global digital elevation model
The Terra Advanced Spaceborne Thermal Emission and Reflection Radiometer Global Digital Elevation Model (ASTER GDEM) Version 3 was developed jointly by the Ministry of Economy, Trade, and Industry (METI) of Japan and NASA of the United States. ASTER GDEM provides a global digital elevation model (DEM) of land areas on Earth at a spatial resolution of approximately 30 m horizontal posting at the equator (https://doi.org/10.5067/ASTER/ASTGTM_NC.003 release Date: 5 August 2019, Last visited on 9 July 2021). Data can be freely downloaded at a 1° × 1° tile for convenience of distribution and handling by users. The total 168 tiles covering from 24° to 35°N latitude and from 109° to 122°E longitude were merged, resized, and mosaicked, and the elevation values within a moving window at 3 × 3 km grid cells were aggregated up to get a DEM image with the same spatial resolution of 1 km for all remotely sensed data.
All remotely sensed products were converted to *.tif format files by MODIS Reprojection Tools (MRT). Spatial calculation in pixel-by-pixel was done in Interactive Data Language (IDL), and spatial exhibition and mapping were drawn in ArcGIS. Additionally, the excel software was also used in statistical analysis.
3. Methodology
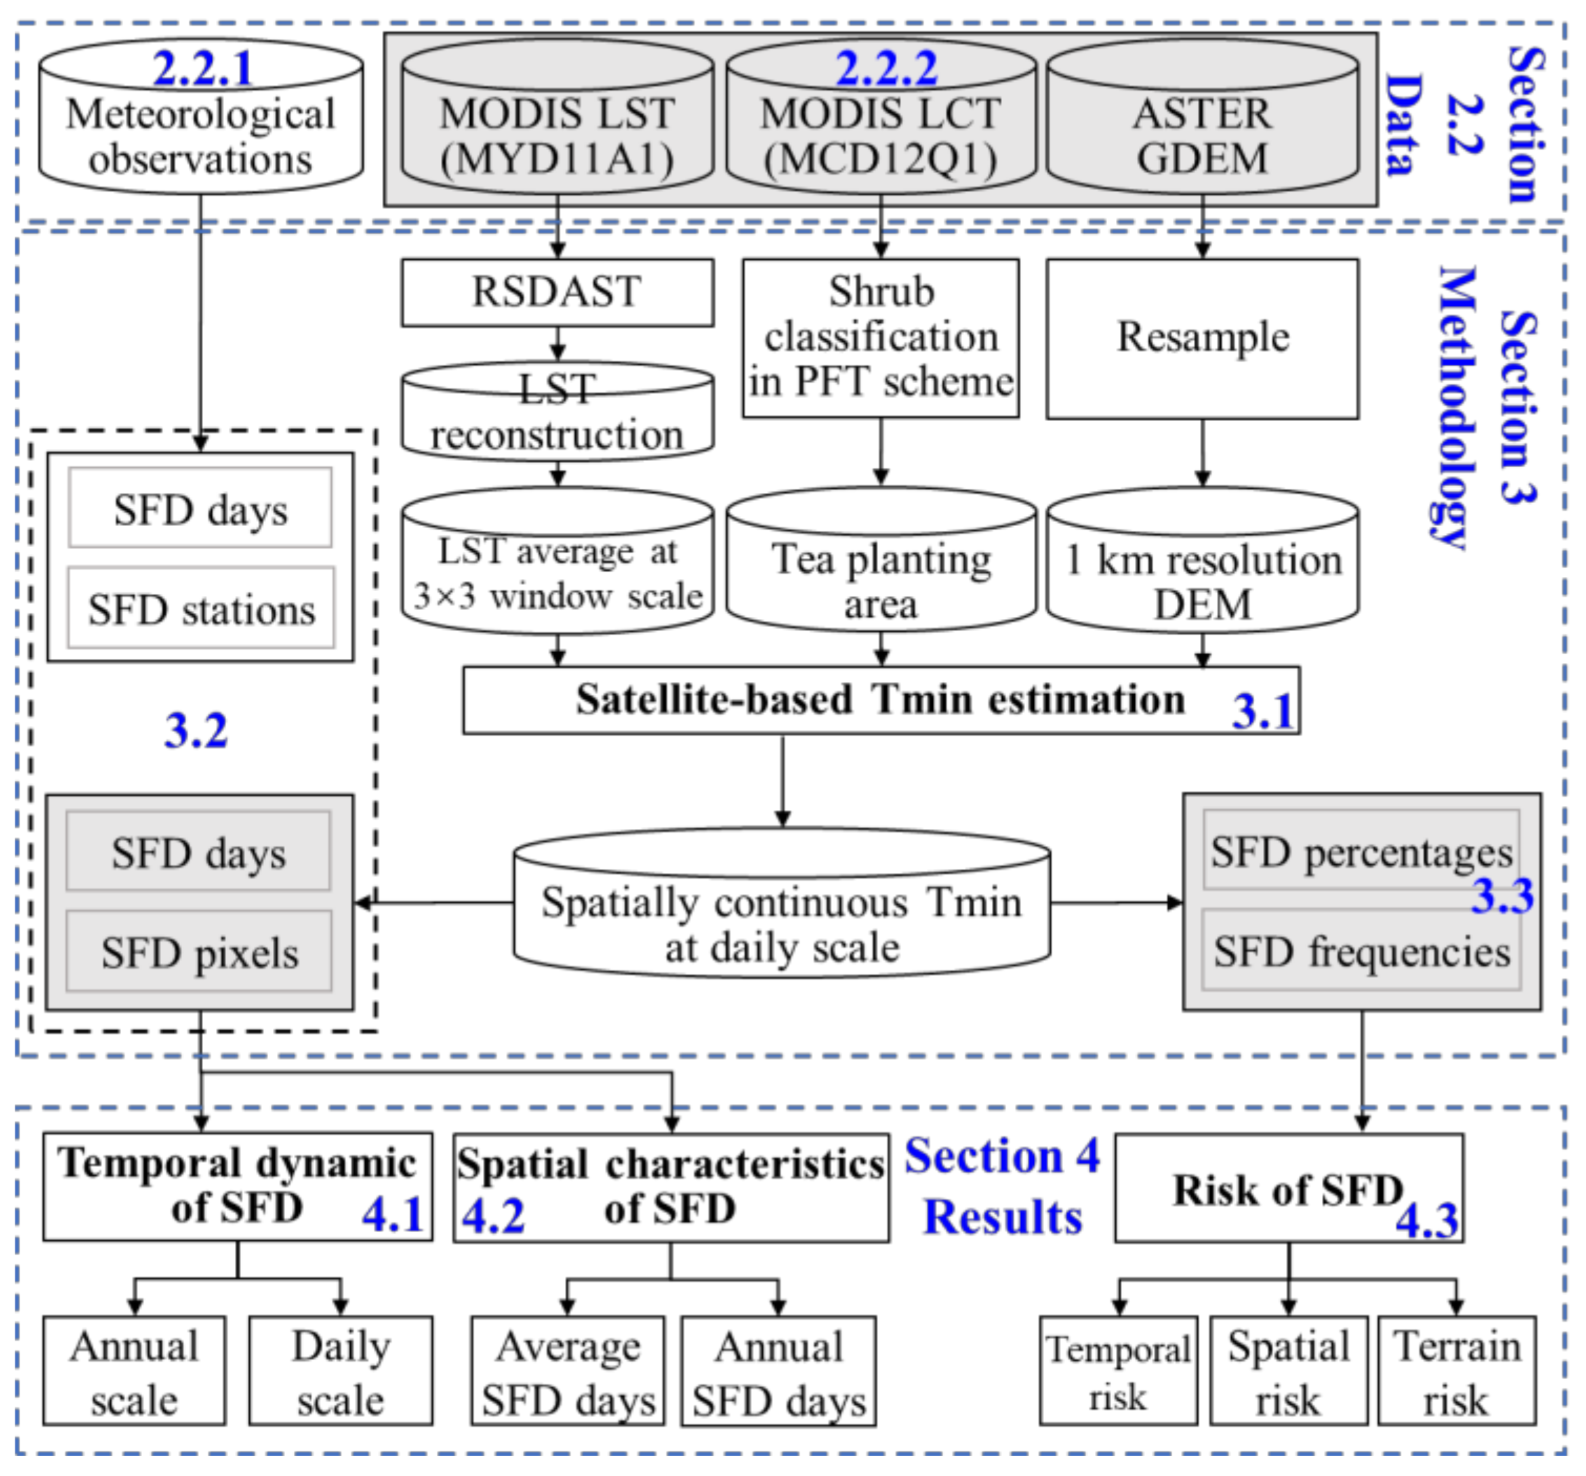
The threats of SFD to tea plants were mapped using satellite-based Tmin estimation in the MLRYR in China, and its pipeline was shown in Figure 2.
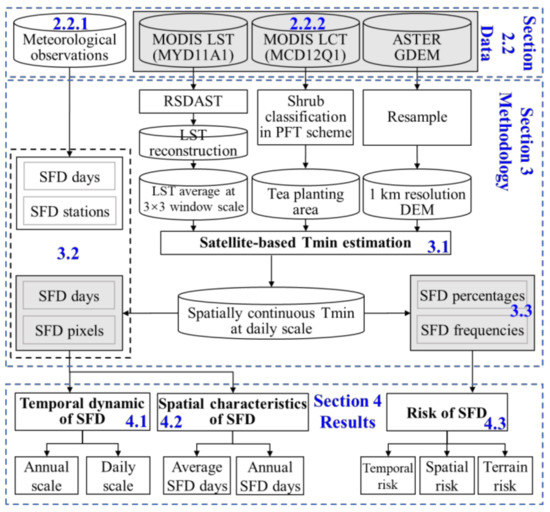
Figure 2.
The pipeline of spring frost damage (SFD) to tea plants using satellite-based Tmin estimation. The data used in this study includes ground-based meteorological observations (describes in Section 2.2.1) and remotely sensed products (in Section 2.2.2). The methodology mainly concerns three parts in this pipeline: (i) satellite-based Tmin estimation (in Section 3.1); (ii) spatiotemporal characteristics of SFD expressed as SFD days and SFD stations with ground-based Tmin observations, and SFD days and SFD pixels with satellite-based Tmin estimations (in Section 3.2); and (iii) three-dimensional risks of SFD with pixel-based SFD percentages and SFD frequencies (in Section 3.3). The spatiotemporal characteristics of SFD (in Sections 4.1 and 4.2) and its risk (in Section 4.3) to tea plants were exhibited in the bottom of the pipeline. Here, three gray boxes represent satellite-based data or method to distinguish them from the ground, and the blue number signs (such as Sections 2.2.1, 3.2 and 4.1, etc.) were the section labels in the manuscript.
3.1. Satellite-Based Tmin Estimation
A Tmin estimation model had been established based on MYD11A1 nighttime LST averages for 3 × 3 pixel windows and DEM data, employing the standard lapse rate of air temperature with elevation [32]. Due to limitations encountered from cloud contamination or other reasons, daily inconsistent LST pixels labeled by QC values of 2 or 3 were gap-filled. In this study, a clear sky MODIS LST reconstruction method (RSDAST) [34] was used. RSDAST requires only one parameter (the MODIS LST product itself) to reconstruct missing LST values based on the assumption that differences in LST between nearby pixels are relatively stable during a short time period [34]. Validation on remotely sensed Tmin estimation with 145,210 ground-based Tmin observations showed that the accuracy of this method was acceptable with a relatively high coefficient of determination (R2 = 0.841), low root mean square error (RMSE = 2.15 °C) and mean absolute error (MAE = 1.66 °C), and reasonable normalized RMSE (NRMSE = 25.4%) and Nash–Sutcliffe model efficiency (EF = 0.12) [32].
Spatially continuous Tmin patterns at a daily scale were produced based on remotely sensed MODIS LST and ASTER GDEM products by employing the previously established Tmin estimation model and RSDAST method. Shrub classification in PFT scheme was extracted as tea planting area with MODIS land cover type products.
3.2. Spatiotemporal Characteristics of SFD
According to the Chinese Meteorological Industry Standard, daily Tmin of 4 °C was selected as the trigger temperature of SFD for tea plants in the MLRYR [17]. In this paper, the temporal dynamics and spatial characteristics of spring frost damage to tea plants were analyzed in the MLRYR based on the estimated Tmin below 4 °C.
For the temporal dynamics of SFD, the analysis focused on two temporal scales: (i) Annual dynamics. The SFD days for each pixel in the tea planting areas over the MLRYR were counted from March to April in 2003–2020, and then the average days of SFD in the total tea planting pixels were calculated for each year. (ii) Daily dynamics. The SFD pixels for each day in the tea planting areas over the MLRYR were counted from March to April in 2003–2020, and daily pixels of SFD were averaged from 2003 to 2020. Meanwhile, the SFD days for each station and the SFD stations for each day at 163 ground-based meteorological stations over the MLRYR were also counted from March to April in 2003–2020, in order to further illustrate the consistency of Tmin between ground-based meteorological observations and remotely sensed estimations at the two temporal scales.
For the spatial characteristics of SFD, the SFD days for each pixel in the tea planting areas over the MLRYR were counted from March to April in 2003–2020, and then the average days of SFD were calculated in 2003–2020. Additionally, annual SFD days at 163 ground-based meteorological stations were also used to analyze the spatial characteristics of SFD during the past two decades at the multi-year average scale and the individual year scale.
3.3. Multidimensional Risk of SFD
Three scales of risks of SFD, including temporal, spatial (latitude and longitude), and terrain scales, were analyzed. For temporal risk, daily pixel-based SFD percentage from March to April was calculated as the ratio of daily SFD pixels in every year to the total tea planting pixels. For spatial and terrain risks, the pixel-based SFD frequencies were averaged by grouping different latitude, longitude, and elevation over the total tea planting pixels in the MLRYR from March to April in 2003–2020.
3.4. Mann-Kendall Test
The Mann-Kendall (M-K) statistical test [35,36] is a rank-based nonparametric test, and it has been widely used to detect monotonic trends in series of environmental, climate, or hydrological data [37,38,39].
The sequential version of the M-K test [40] was used to test the start time of a trend within the sample X1, X2, ……, Xn from a set of random variable X based on rank series of progressive and retrograde rows of the sample. The sequential values of the test statistic were calculated with the mean () and variance () of the test statistic () as done by Gerstengarbe and Werner [41] and Zhao et al. [42]:
where is the cumulative number in which is greater than (1 ≤ j ≤ i), is the forward sequence, and is denoted as . The backward sequence was calculated using the same equation but in the reverse data series, and is denoted as in this paper.
When the test statistic UF is greater than 0, the monotonic trend is increasing, while a negative UF value indicates a decreasing trend [39]. Additionally, the M-K test can be used to detect whether the trend is statistically significant or not by checking the critical value of UF from the standard normal table. For instance, the critical limit is ±1.96 when the significance level is 0.05 [38], and the limit is ±2.56 when the significance level is 0.01. The M-K test can also be used to detect cross points (also called mutation points) in temporal trends when two statistics, UF and UB, intersect within the range of ±1.96 [43,44].
4. Results
4.1. Temporal Dynamics of SFD for Tea Plants in 2003–2020
4.1.1. Annual Dynamics
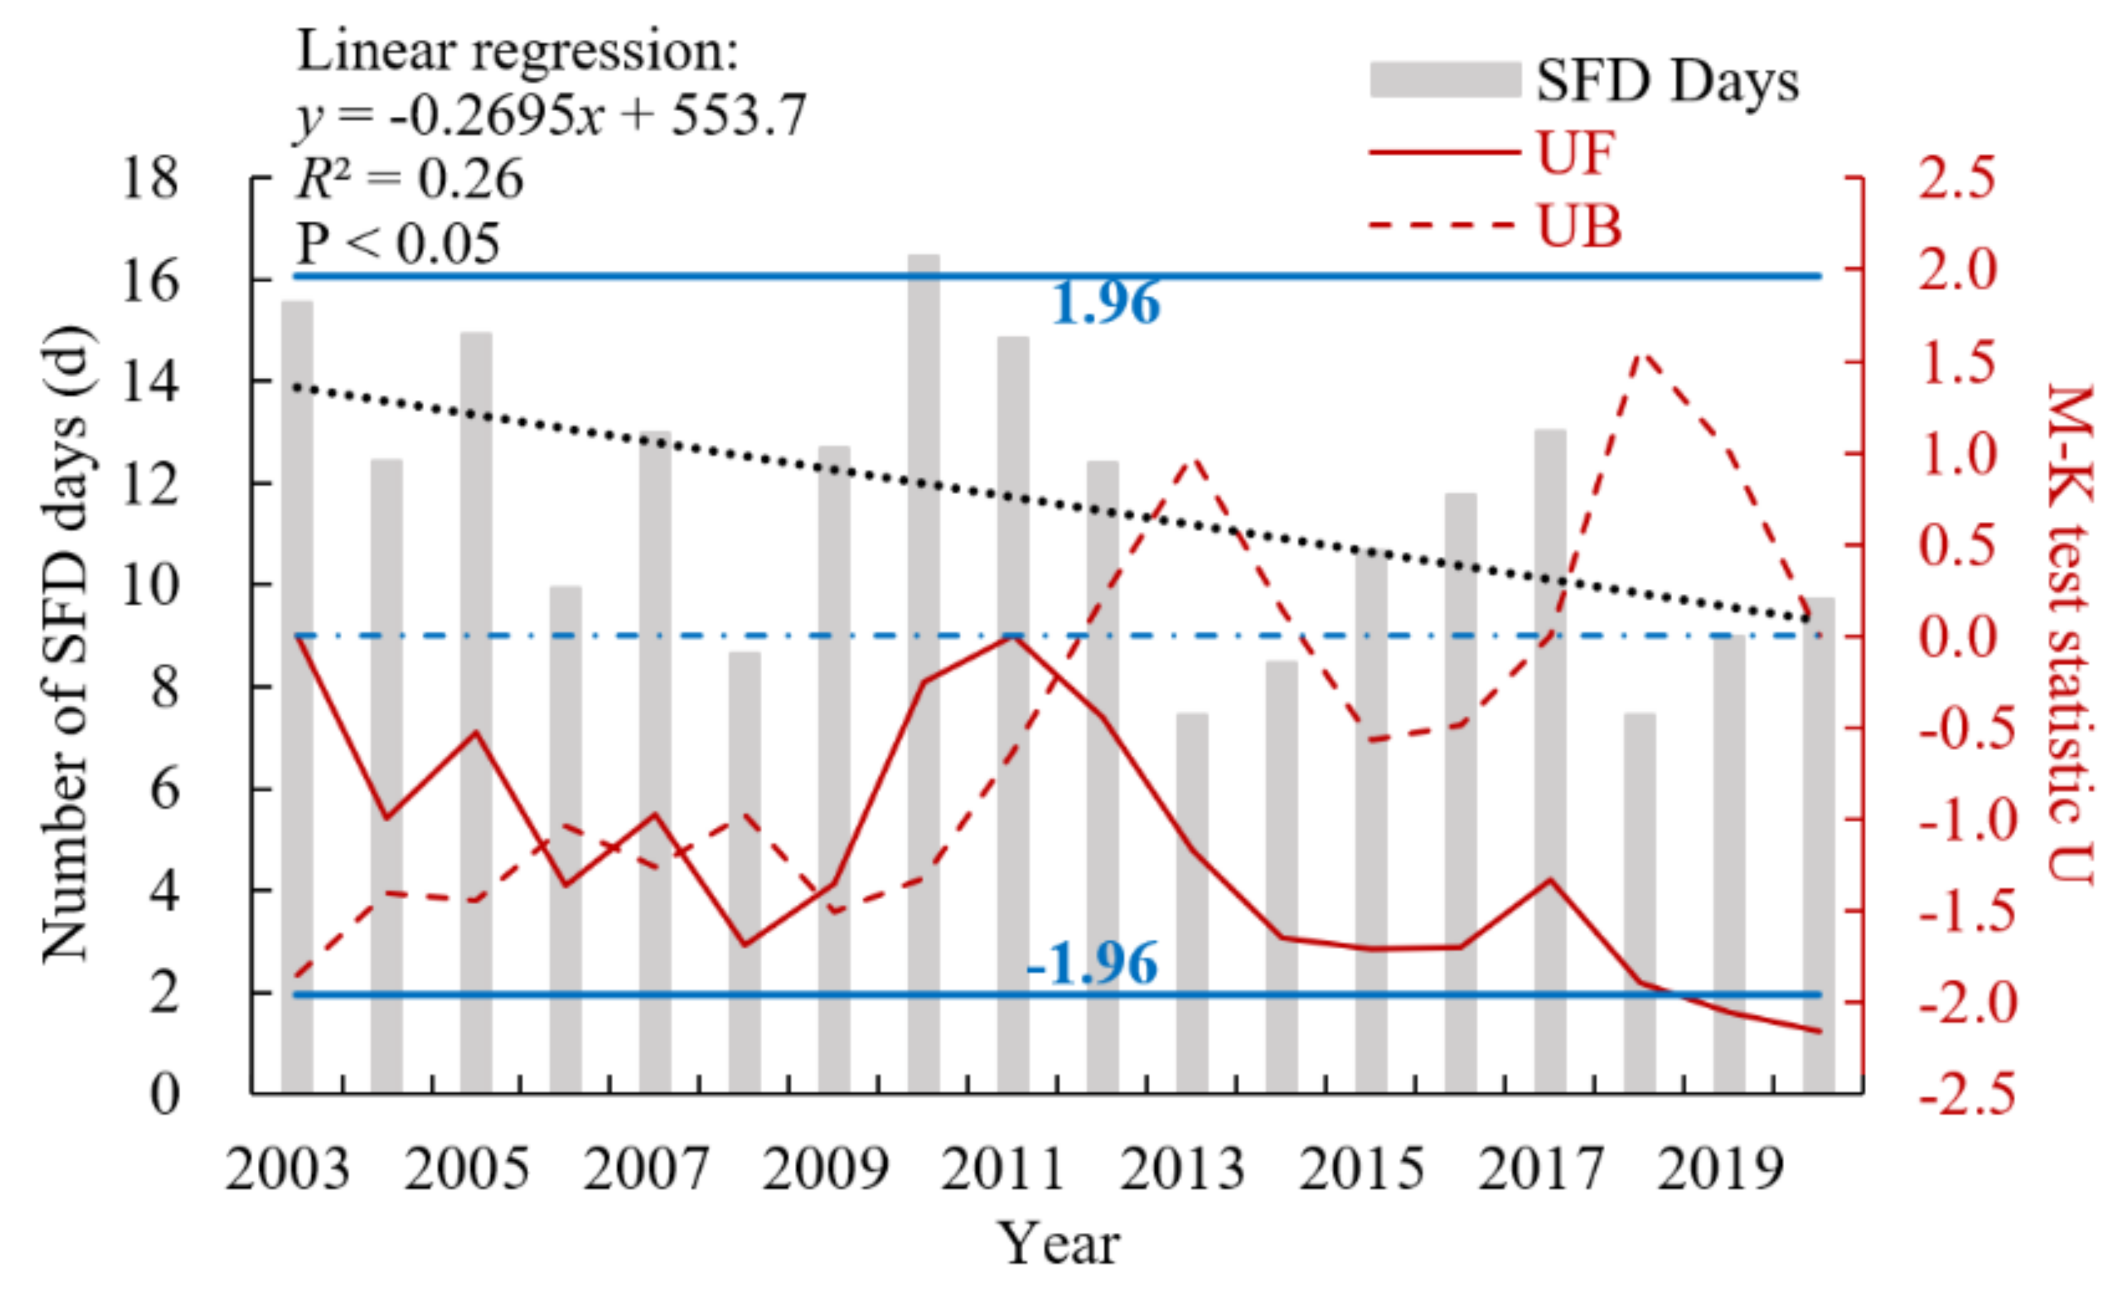
The inter-annual SFD days for tea plants from 2003 to 2020 were analyzed using regional average SFD days over total tea planting pixels in the MLRYR (Figure 3). During the past two decades, SFD days exhibited a fluctuating but significantly (p < 0.05) decreasing trend (2.7 days per ten years). The maximum SFD days appeared in 2010 with a value of 16.5 d, and the minimum SFD days occurred in 2013 with a value of 7.5 d. Furthermore, annual standard errors (SE) and 95% confidence intervals (CI) of SFD days were also calculated over total tea planting pixels. The results showed that annual SEs were between 0.03 and 0.04 d, and 95% CIs were between 7.40 and 16.56 d (not show on Figure 3).
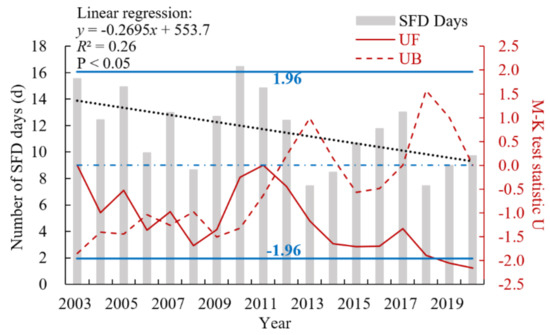
Figure 3.
Annual dynamics of SFD days derived from the satellite data for tea plants and the sequential Mann-Kendall (M-K) test results during 2003–2020. The gray histogram and black dotted line are annual SFD days and its linear regression (left y-axis), respectively. The solid and dashed dark red lines are the M-K test statistics (right y-axis) for forward (UF) and backward (UB). The dash-dotted blue line is statistic value 0, and the solid horizontal dark blue lines represent the upper and lower limits of the 95% confidence interval.
The M-K test was used to check whether a mutation year for SFD existed during 2003–2020. The M-K test results (UF denoted with the solid red line (Figure 3)), showed that there was a fluctuating decreasing trend in SFD days with no UF values greater than 0 from 2003–2020. Additionally, a series of continuous gentle negative mutation points was observed during 2006–2009, followed by an approximately neutral mutation in 2011. In subsequent years, the decreasing trend of annual SFD days for tea plants accelerated drastically, until it became statistically significant in 2019.
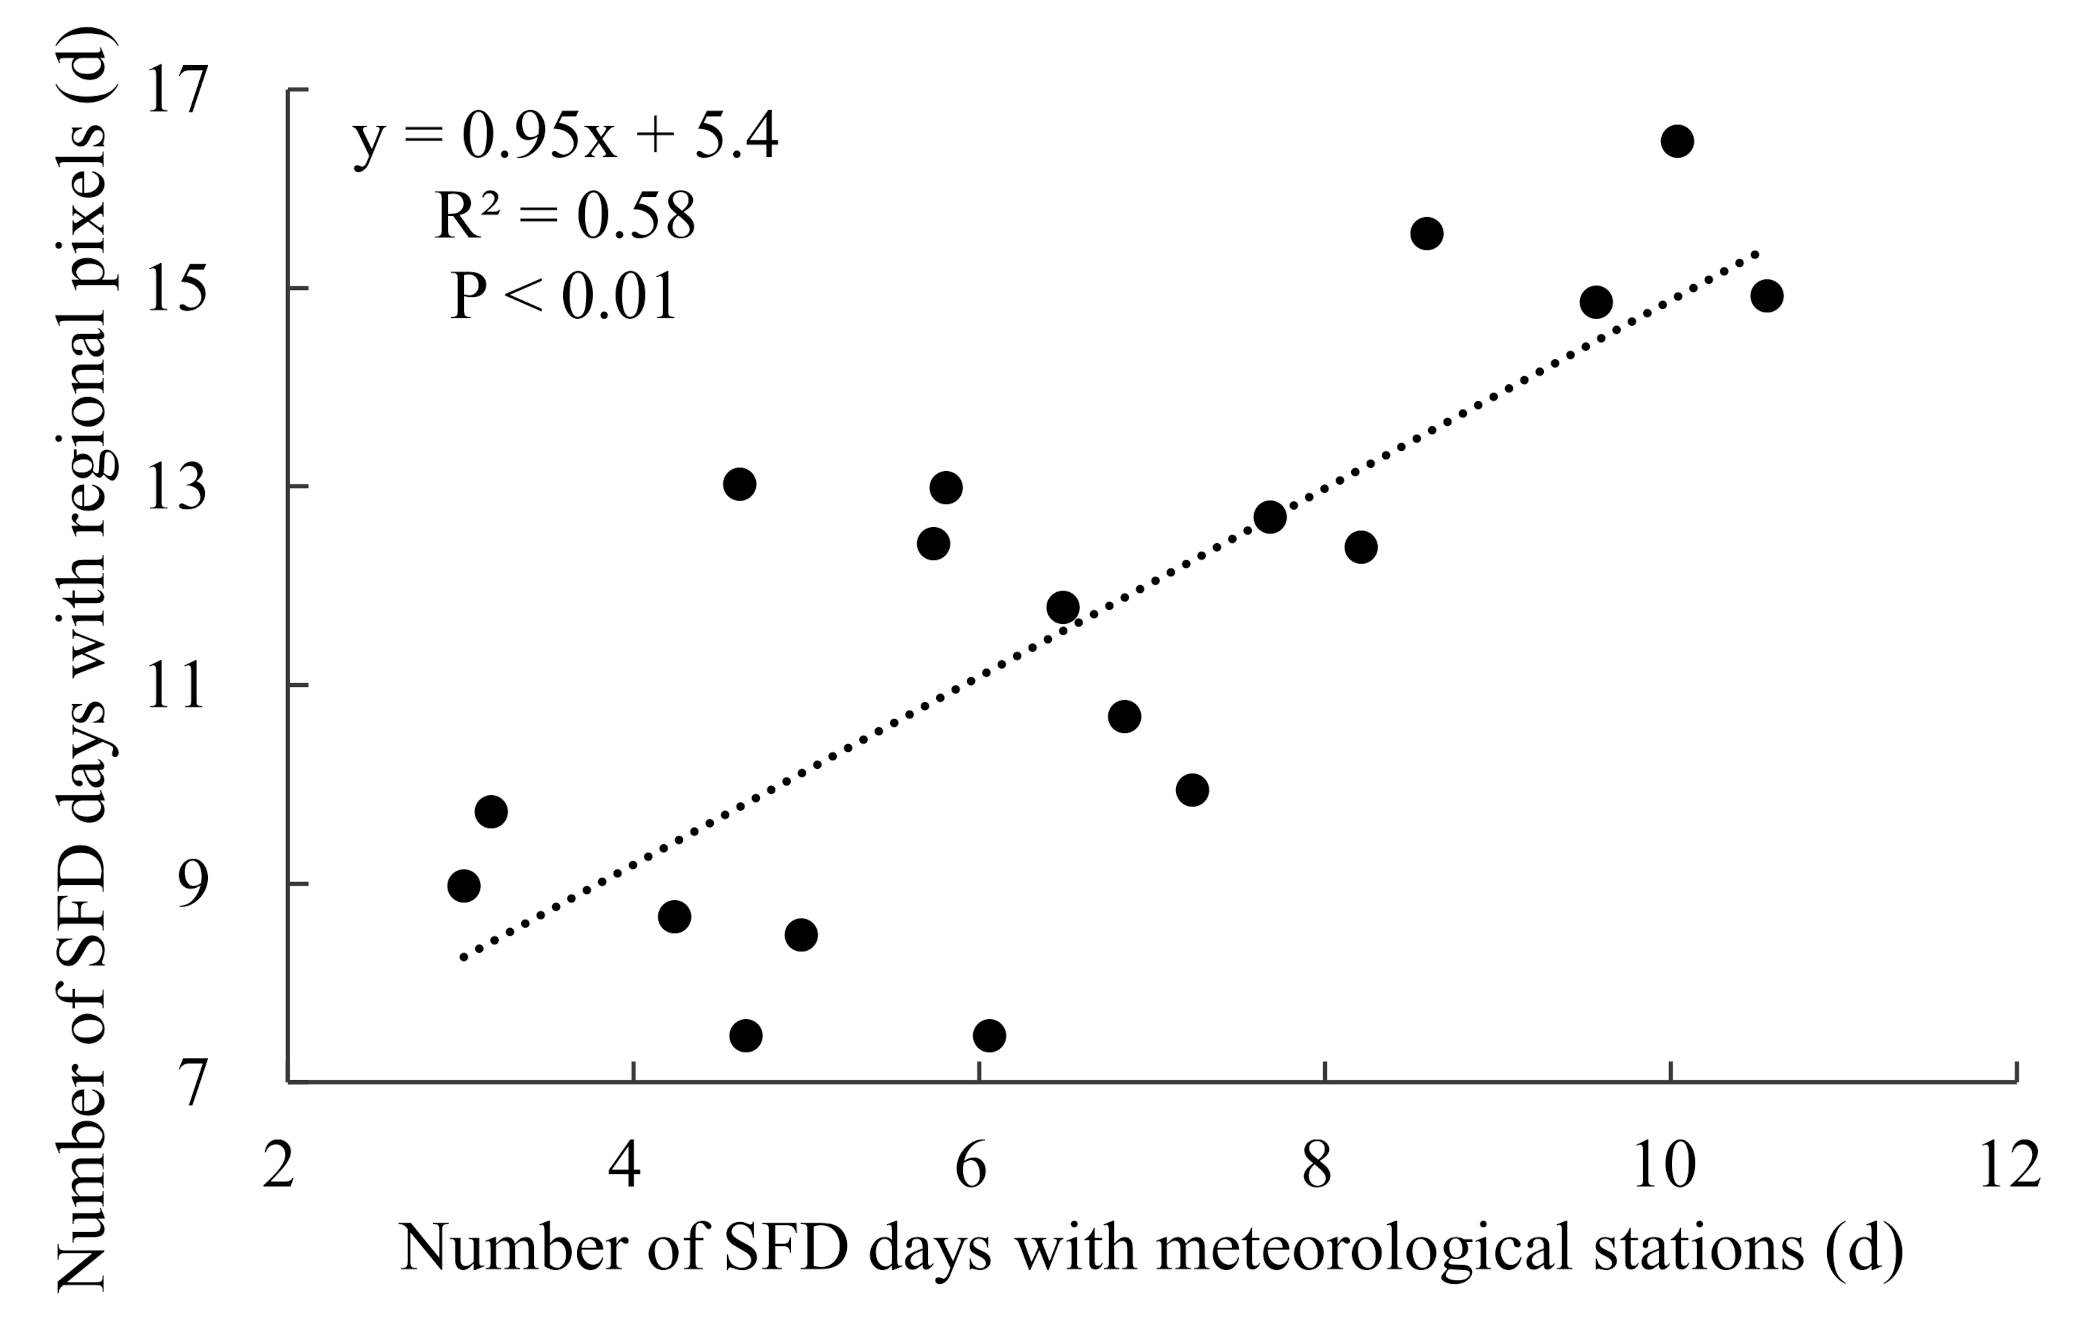
The inter-annual SFD days for tea plants from 2003 to 2020 obtained from regional pixels were plotted against ground-based average SFD days from 163 meteorological stations in the MLRYR (Figure 4). From the scatter plot, we can see that annual SFD days averaged from all regional tea-planting pixels were systematically consistent with the annual averages obtained from ground-based meteorological observations during the 18-year study period. The linear regression coefficient and the coefficient of determination (R2) were 0.95 and 0.58, respectively, and were significant at p < 0.01. However, the linear regression intercept was greater than 0 (5.4), indicating that systematic deviation still existed.
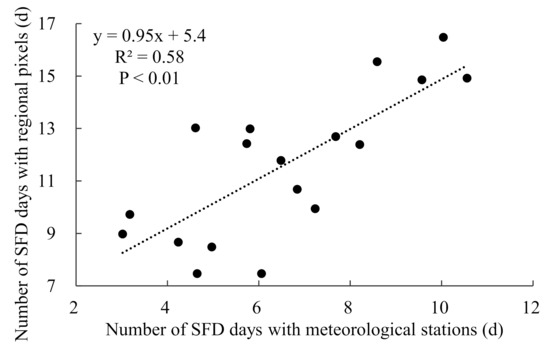
Figure 4.
Scatter plot of SFD days retrieved from regional pixels and meteorological stations in 2003–2020.
4.1.2. Daily Dynamics
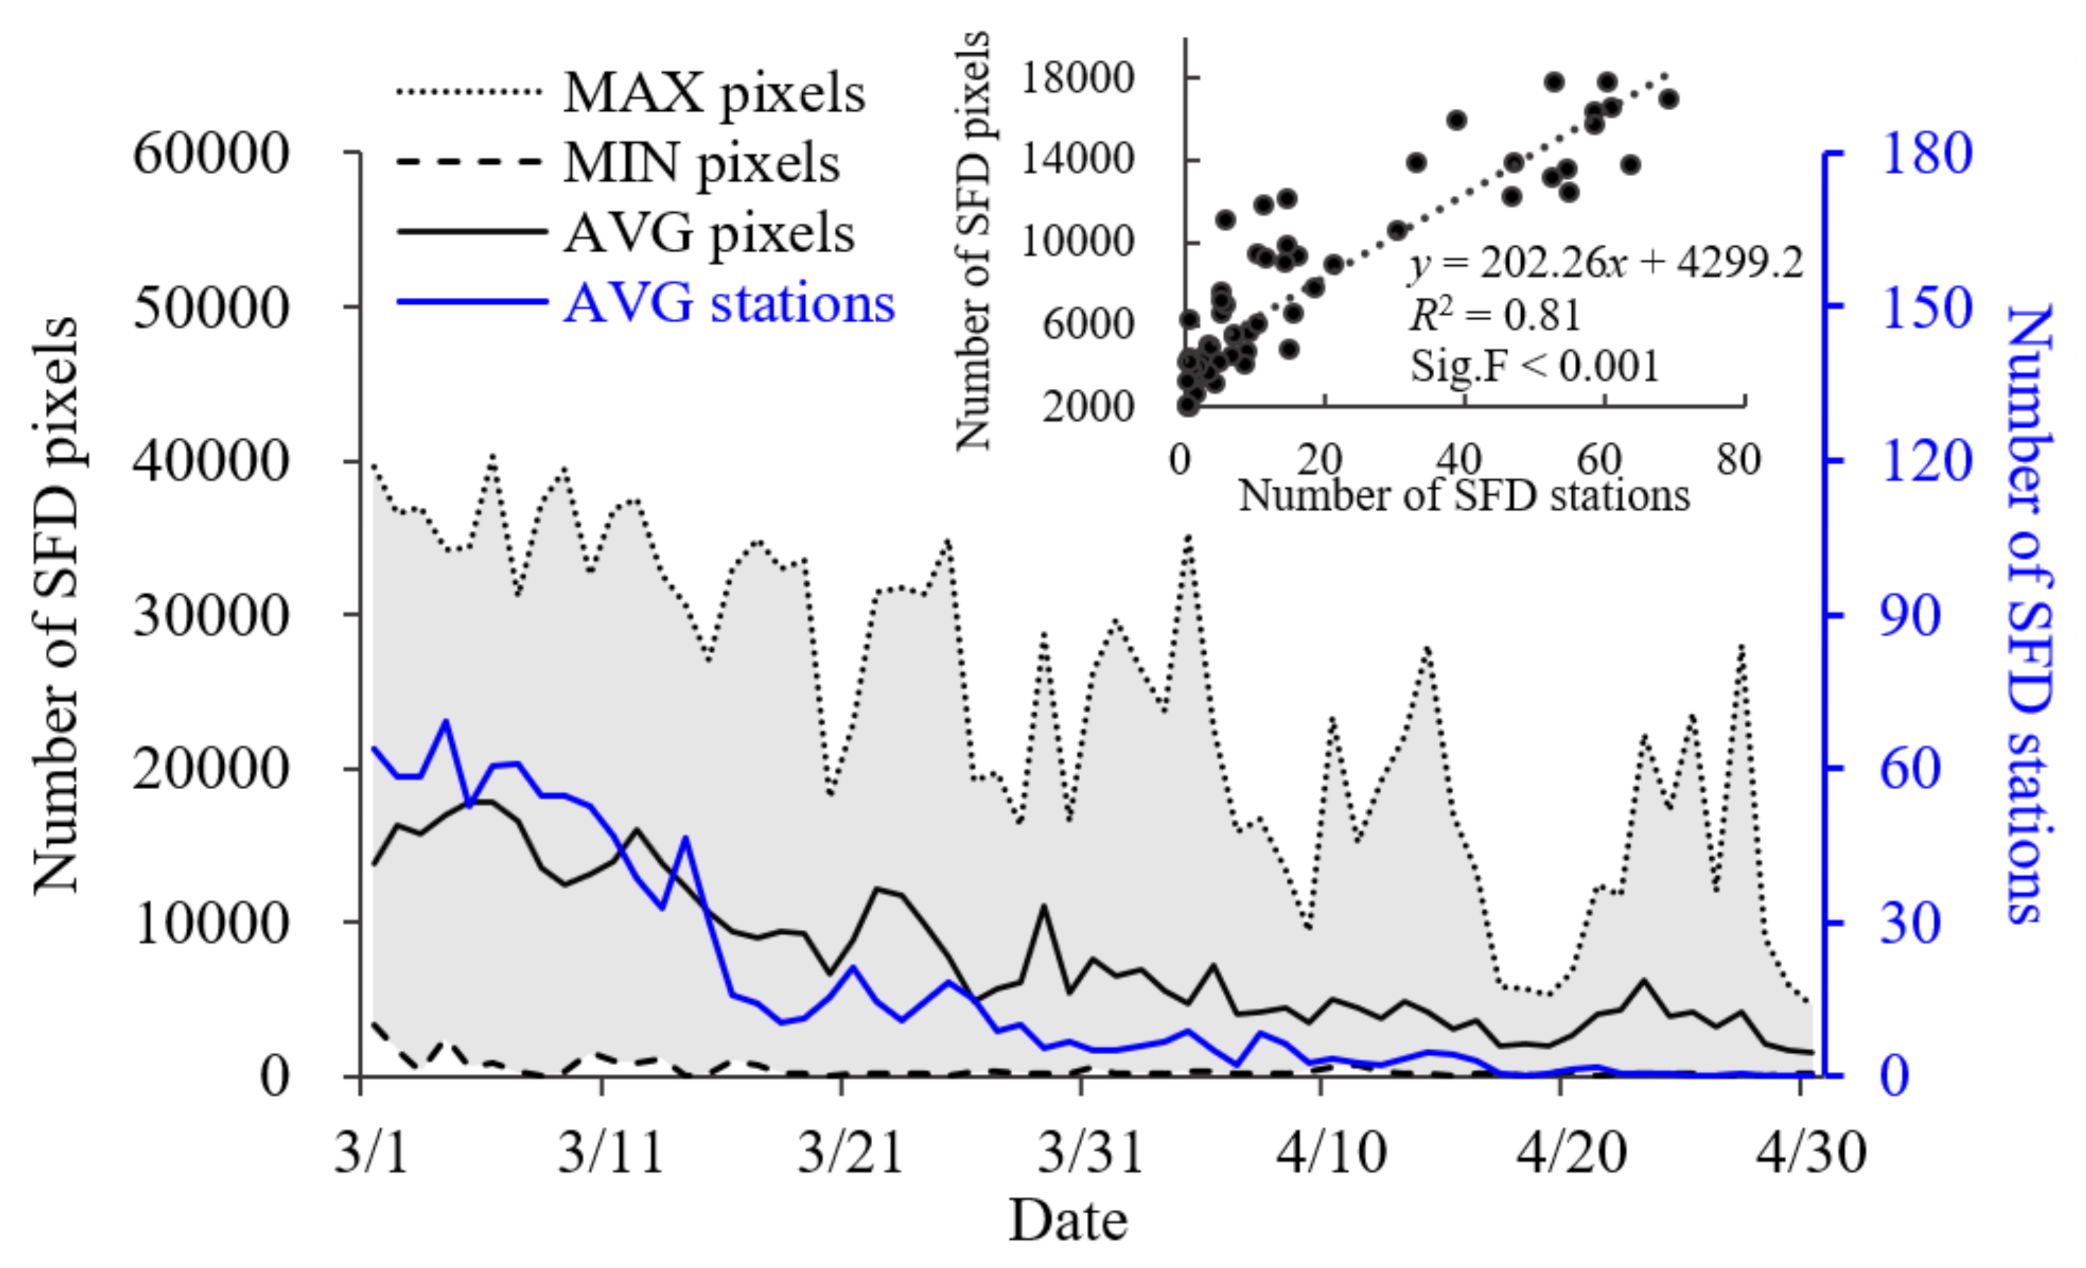
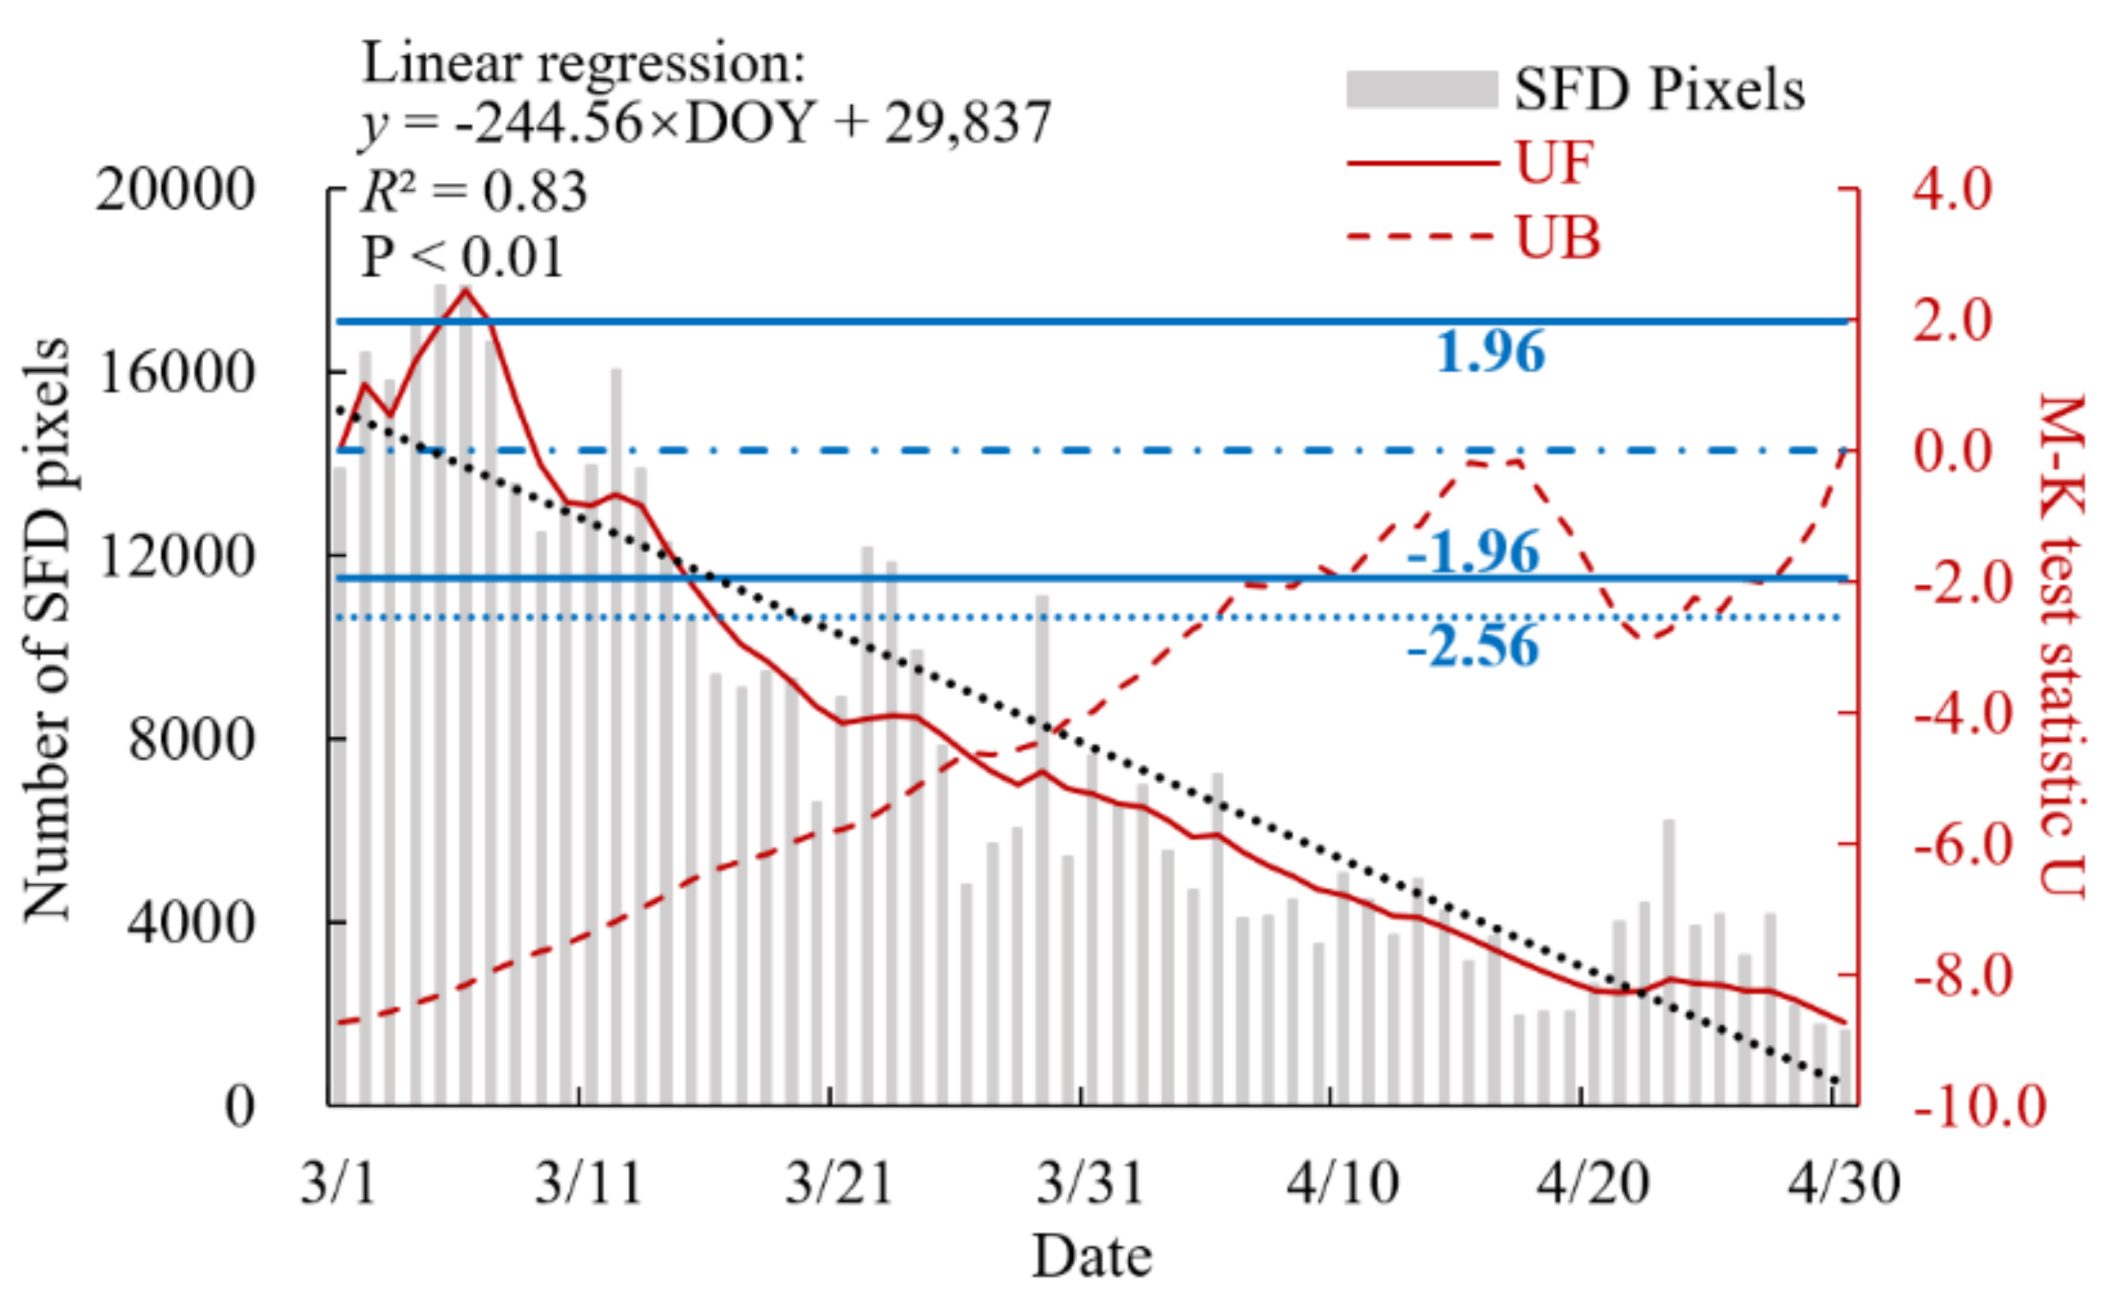
Daily dynamics of regional pixels and meteorological stations affected by SFD from March to April are shown in Figure 5. The regional pixels and meteorological stations affected by SFD, to some extent, can represent SFD coverage. Generally, SFD coverage decreased with increasing date at a rate of 244.56 pixels/day, which was equivalent to 2.45 × 10⁴ ha/day. The highest coverage occurred in the first half of March, followed by a sharp decrease in coverage during the next 30 days, and then the coverage dropped to the lowest values at the end of April. The largest SFD coverage denoted with regional pixels appeared on March 6 with 17,862 pixels, accounting for 43.4% of the entire tea planting area in the MLRYR. Correspondingly, the maximum number of SFD stations occurred on March 4, and this date was very close to the date of the largest number of regional pixels. The number of SFD stations on March 4 was 69, accounting for 42.3% of the total 163 ground-based meteorological stations. The two percentages (regional pixels and meteorological stations) were similar, indicating that the area influenced by SFD was basically identical by the two assessments. The consistency between the two datasets of regional pixels and meteorological stations was further checked by linear regression. The regression results revealed that the two datasets were highly correlated, with R2 of 0.81 for the regression (significant at p < 0.01) (in the small inset panel in Figure 5).
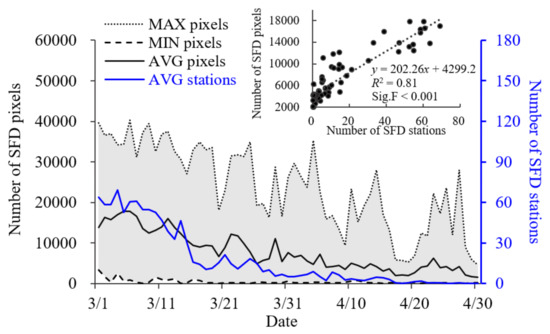
Figure 5.
Daily dynamics in 2003–2020 for regional pixels and meteorological stations affected by SFD from March to April in the middle and lower reaches of the Yangtze River region, China. The black dotted line, dash-dotted line, and solid line are the regional maximum, minimum, and average pixels (left y-axis), respectively. The blue line is the average meteorological stations (right y-axis) in the large panel. Additionally, the 18-year average daily scatter plot of pixels vs. stations for SFD from March to April is also shown in the small inset panel.
The maximum, minimum, and average SFD pixels during 2003–2020 were also shown in Figure 5. Generally, all three SFD pixels fluctuated over time, but declined with increasing date. Almost all of the daily maximum SFD pixels were greater than 20,000 before March 25, indicating that there was at least one year in which more than half of the tea planting areas (the number of pixels in the tea planting areas is 41,175) in the MLRYR suffered from SFD threats. After that date, although the maximum SFD pixels was gradually decreasing, the SFD coverage was still increasing from time to time. For example, the maximum SFD pixels dropped to 5000 around April 20. However, the SFD pixels increased again to more than 12,000 during the last several days of April, and even reached near 28,000 on April 27. The minimum SFD pixels was relatively low with values of less than 3300 from March 1 to April 30, indicating that the SFD in some years was almost none and the tea benefits may have been great.
The M-K test results demonstrated that the SFD pixels had an increasing trend during the first eight days of March, with UF values greater than 0 (Figure 6). After March 9, the decreasing trend of daily SFD pixels was obvious, and the M-K test values reached the 0.05 significance level on March 15 and the 0.01 significance level on March 17.
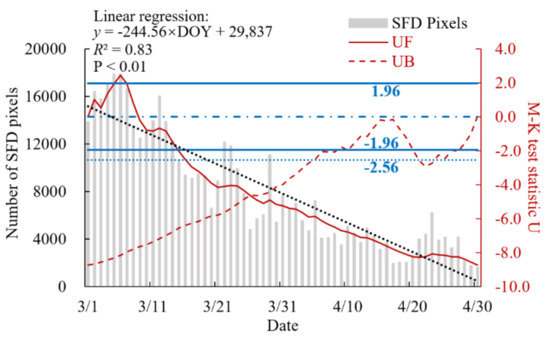
Figure 6.
The sequential Mann-Kendall (M-K) test results of SFD pixels for tea planting area from March to April in the middle and lower reaches of the Yangtze River region, China. The gray histogram and black dotted line are daily SFD pixels and its linear regression, respectively (left y-axis). The solid and dashed dark red lines are the M-K test statistics (right y-axis) for forward (UF) and backward (UB). The dash-dotted blue line is statistic value 0, the solid horizontal dark blue lines are the upper and lower limits of the 95% confidence interval, and the dark blue horizontal dotted line is the lower limit of the 99% confidence interval.
4.2. Spatial Characteristics of SFD Days for Tea Plants in 2003–2020
4.2.1. Average SFD Days
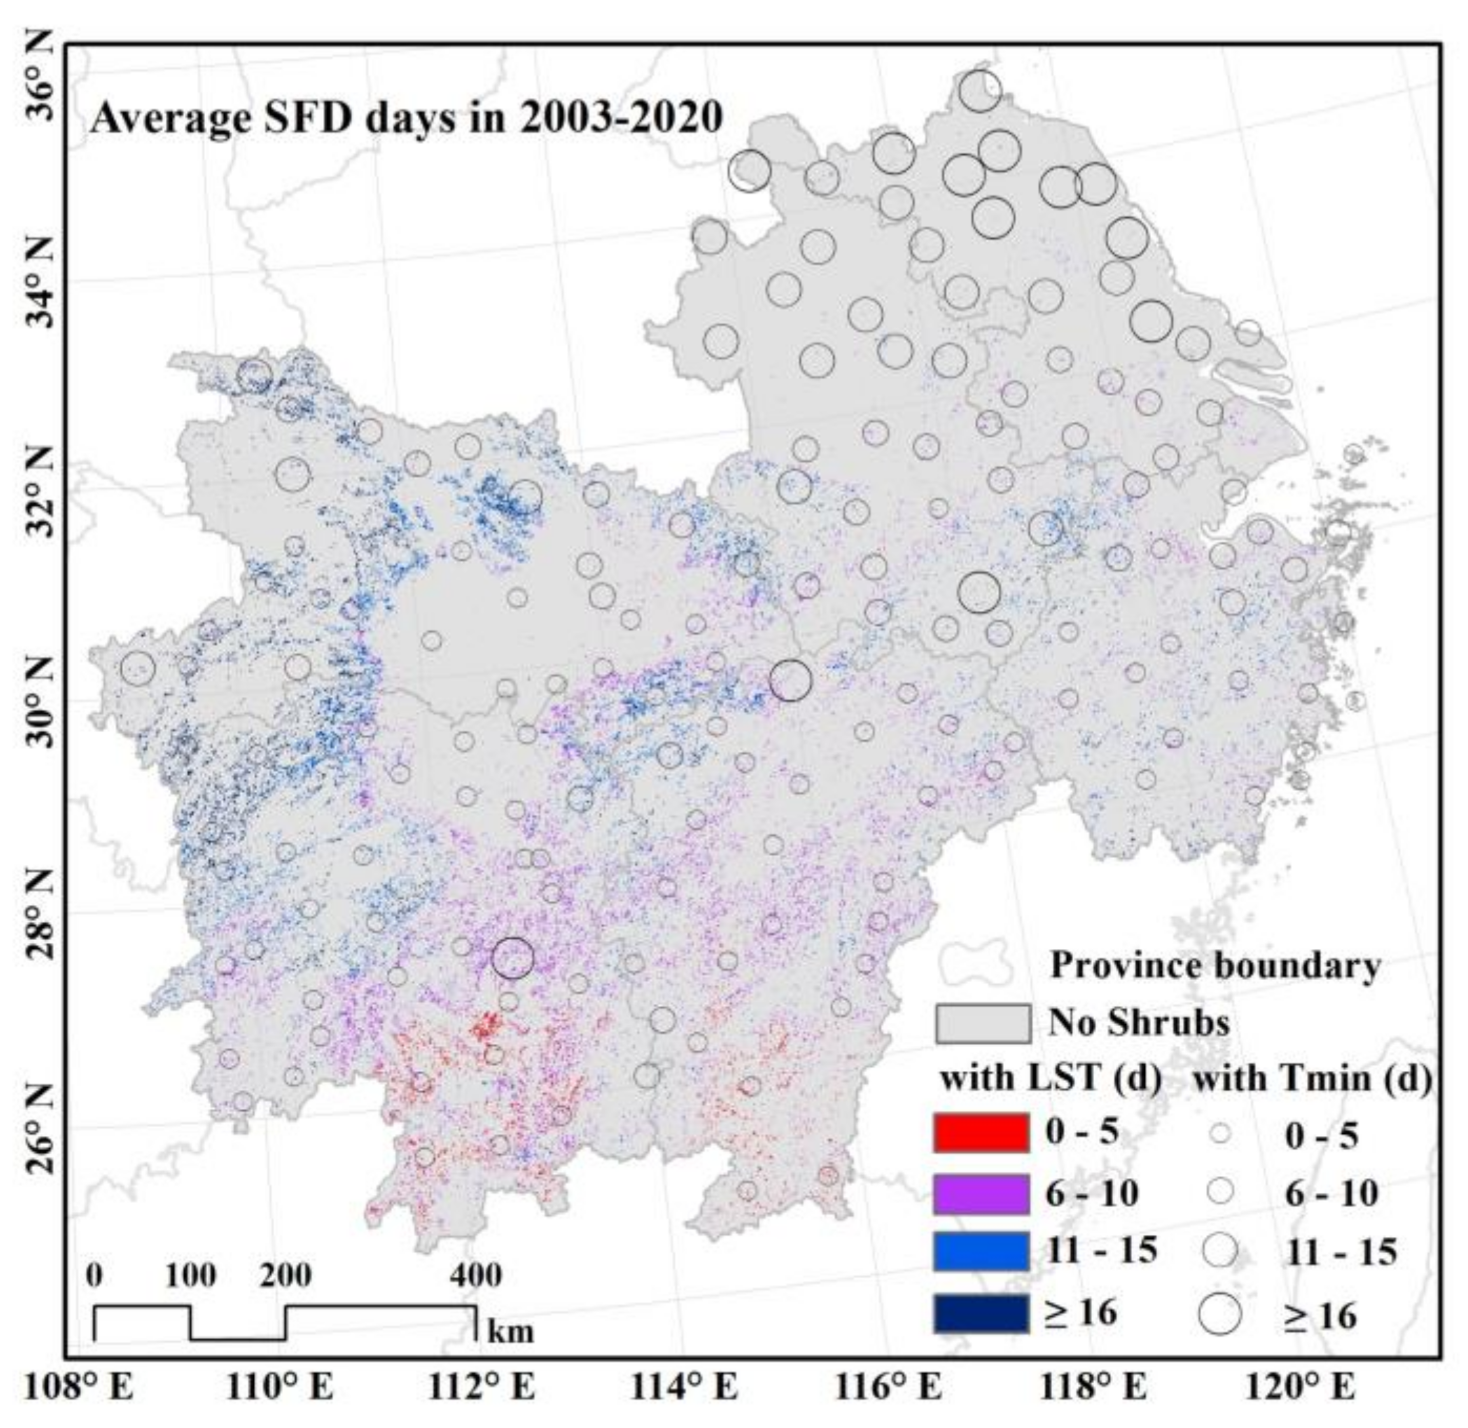
Figure 7 shows the spatial characteristics of average SFD days for tea plants from March to April in 2003–2020 in the MLRYR, China. Overall, the impact of spring frost was scattered across almost all shrub regions in the MLRYR. The regions with the greatest SFD days, denoted with the dark blue color, were distributed mainly in the northwestern part of MLRYR. The average SFD days during the past 20 years in northwestern MLRYR were not less than 16 d, accounting for more than 26% of the total days from March to April. There were many days in this area where there was severe SFD. Areas with few SFD days, expressed with red color for 5 d or less, were primarily located in the southern region of the MLRYR. The areas with SFD days between 6 and 10 d were widely distributed, and included parts of north-central Hunan and Jiangxi Provinces, parts of southern Hubei and Anhui Provinces, and the border areas of Jiangsu and Zhejiang Provinces. Those regions are also the major tea planting areas in the MLRYR.
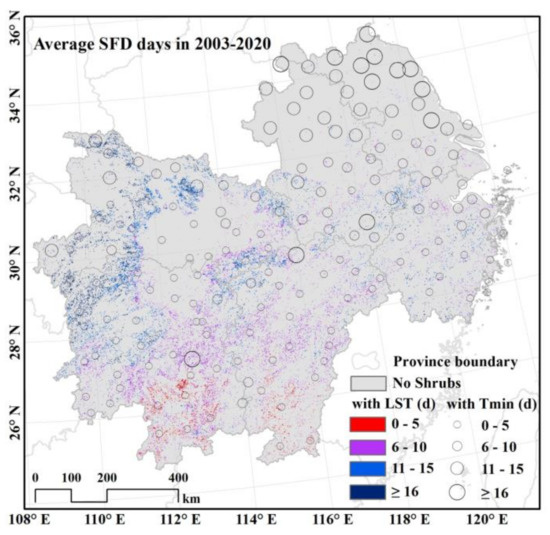
Figure 7.
Spatial characteristics of average SFD days for tea plants in 2003–2020 in the middle and lower reaches of the Yangtze River region, China. Pixels with different colors and different size circles were the average SFD days calculated from satellite-based estimates of land surface temperature (LST) and with ground-based minimum temperature (Tmin) observations, respectively.
For ground-based Tmin observations, the areas with more than 16 SFD days, represented by the largest open circles, were mainly located in the northeastern parts of the MLRYR. Because there were very few tea plantations in northeastern MLRYR, SFD days in this area was not the focus of this study. A few other larger open circles were scattered across northwestern MLRYR in the southern region of Anhui Province, the northern region of Jiangxi Province, and the central region of Hunan Province. Generally, except for the station in central Hunan Province, the larger open circles basically overlapped the blue and dark blue regions, showing a great consistency between satellite-based and ground-based SFD days. The smallest circles were widely distributed in the south-central part of MLRYR, where there were red and purple pixels. Additionally, the smaller circles were also located in the northwestern part of MLRYR, where the SFD days were 5 d less than the satellite-based results. The possible reason for this slight difference between satellite-based and ground-based SFD days in northwestern MLRYR was that the altitude at the meteorological station was relatively low compared with the tea gardens, and the SFD days determined from satellite-based Tmin estimations at the tea garden site altitude and the SFD days determined from ground-based Tmin observations at the meteorological observation site altitude were naturally different.
4.2.2. Annual SFD Days
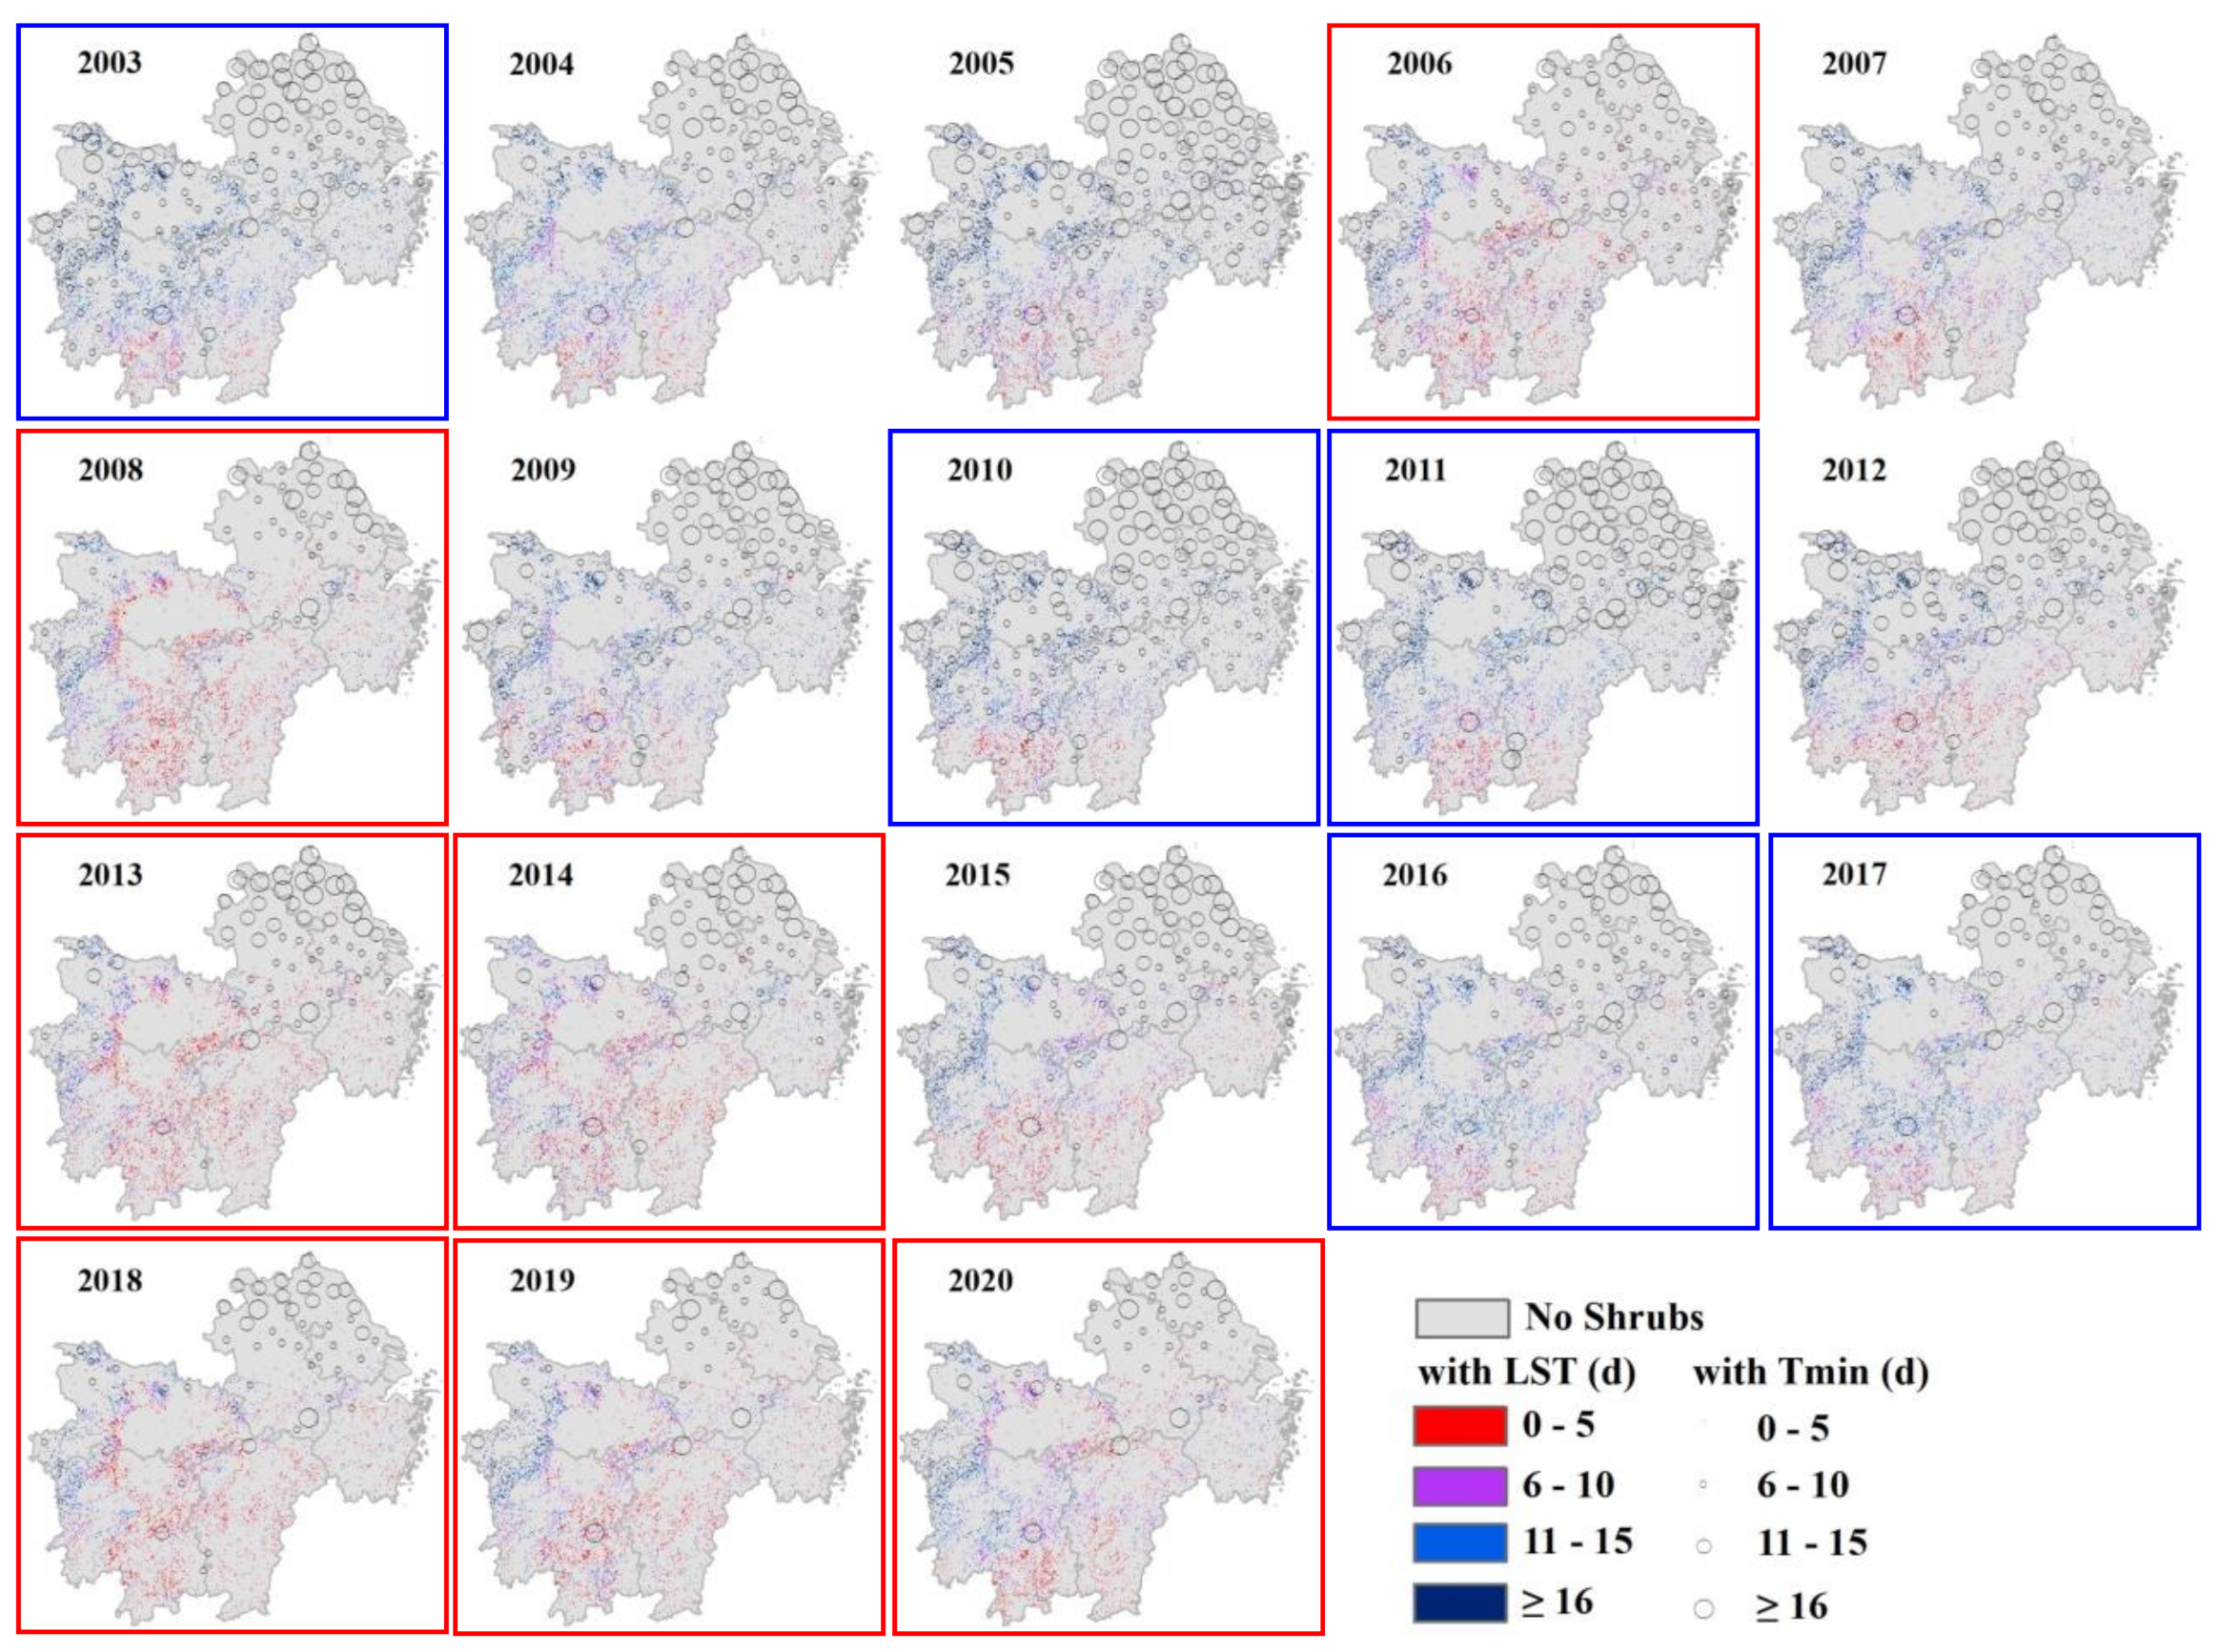
Spatial characteristics of annual SFD days, denoted by both continuous pixel-based Tmin in different colors and by discrete ground-based Tmin in different size open circles, in 2003–2020 were individually displayed for each year in Figure 8. As stated earlier, the northeastern region with larger open circles at meteorological stations had almost no tea planting, so these areas can be ignored. For other regions with many tea gardens, there were generally more SFD days in the northern region, and fewer days in the southern MLRYR. The areas with larger circles basically coincided with the scattered pixels in blue colors. On the other hand, the regions with smaller circles coincided with the red and purple pixels.
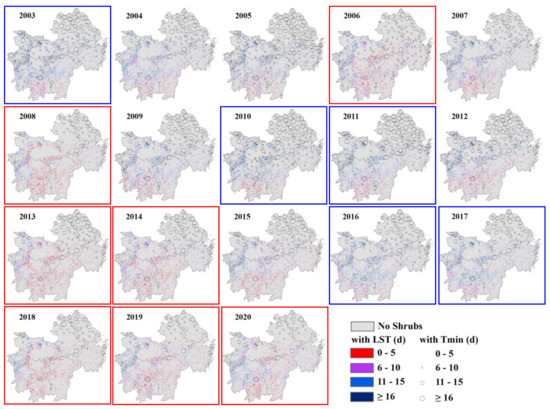
Figure 8.
Spatial characteristics of annual SFD days for tea plants in 2003–2020 in the middle and lower reaches of the Yangtze River region, China. Pixels with different colors and different size circles were the SFD days calculated from satellite-based estimates of land surface temperature (LST) and with ground-based minimum temperature (Tmin) observations, respectively. Blue frames around panels indicate years with large areas covered by more SFD days, red frames around panels indicate years with large areas covered by fewer SFD days, and no frames indicate years with nearly even areas covered by more SFD days and fewer SFD days.
The number of years with large, medium, and small areas covered by more SFD days were relatively equal in 2003–2020 (five, six, and seven years, respectively). On one hand, the years covered mostly by the blue and dark blue pixels and the large open-circle areas included 2003, 2010, 2011, 2016, and 2017 (panels framed with blue squares in Figure 8). The areas with blue and dark blue pixels signifying more SFD days and with large circles were mainly located in the northern and central MLRYR, where annual SFD days were 11 days or greater. The regions with five or fewer SFD days (red pixels and small circles) were located in the southern parts of Hunan and Jiangxi Provinces. On the other hand, the number of years having larger red-colored areas was seven, including 2006, 2008, 2013, 2014, and 2018–2020 (panels framed with red squares in Figure 8). The red and purple colored areas almost covered the entire Jiangxi and Anhui Provinces, most of Hunan, Jiangsu, and Zhejiang Provinces, and the central and eastern parts of Hubei Province. The blue and dark blue colored areas were only poorly concentrated in the northwestern parts of the MLRYR, and occasionally scattered in the other regions not mentioned above. Finally, the number of years in which the areas covered by more and fewer SFD days were nearly equivalent was six, including 2004, 2005, 2007, 2009, 2012, and 2015 (without frames in Figure 8). The areas with dark blue pixels and large circles mainly concentrated in the north of the MLRYR, the regions with blue pixels and medium circles generally distributed in the central parts of the MLRYR, and the areas with warm tones and small circles primarily clustered in the south of the MLRYR. Generally speaking, the number of years with smaller SFD areas and fewer SFD days accounted for the majority during the past twenty years, especially from 2011 to 2020.
4.3. Risk of SFD for Tea Plants
4.3.1. Temporal Risk
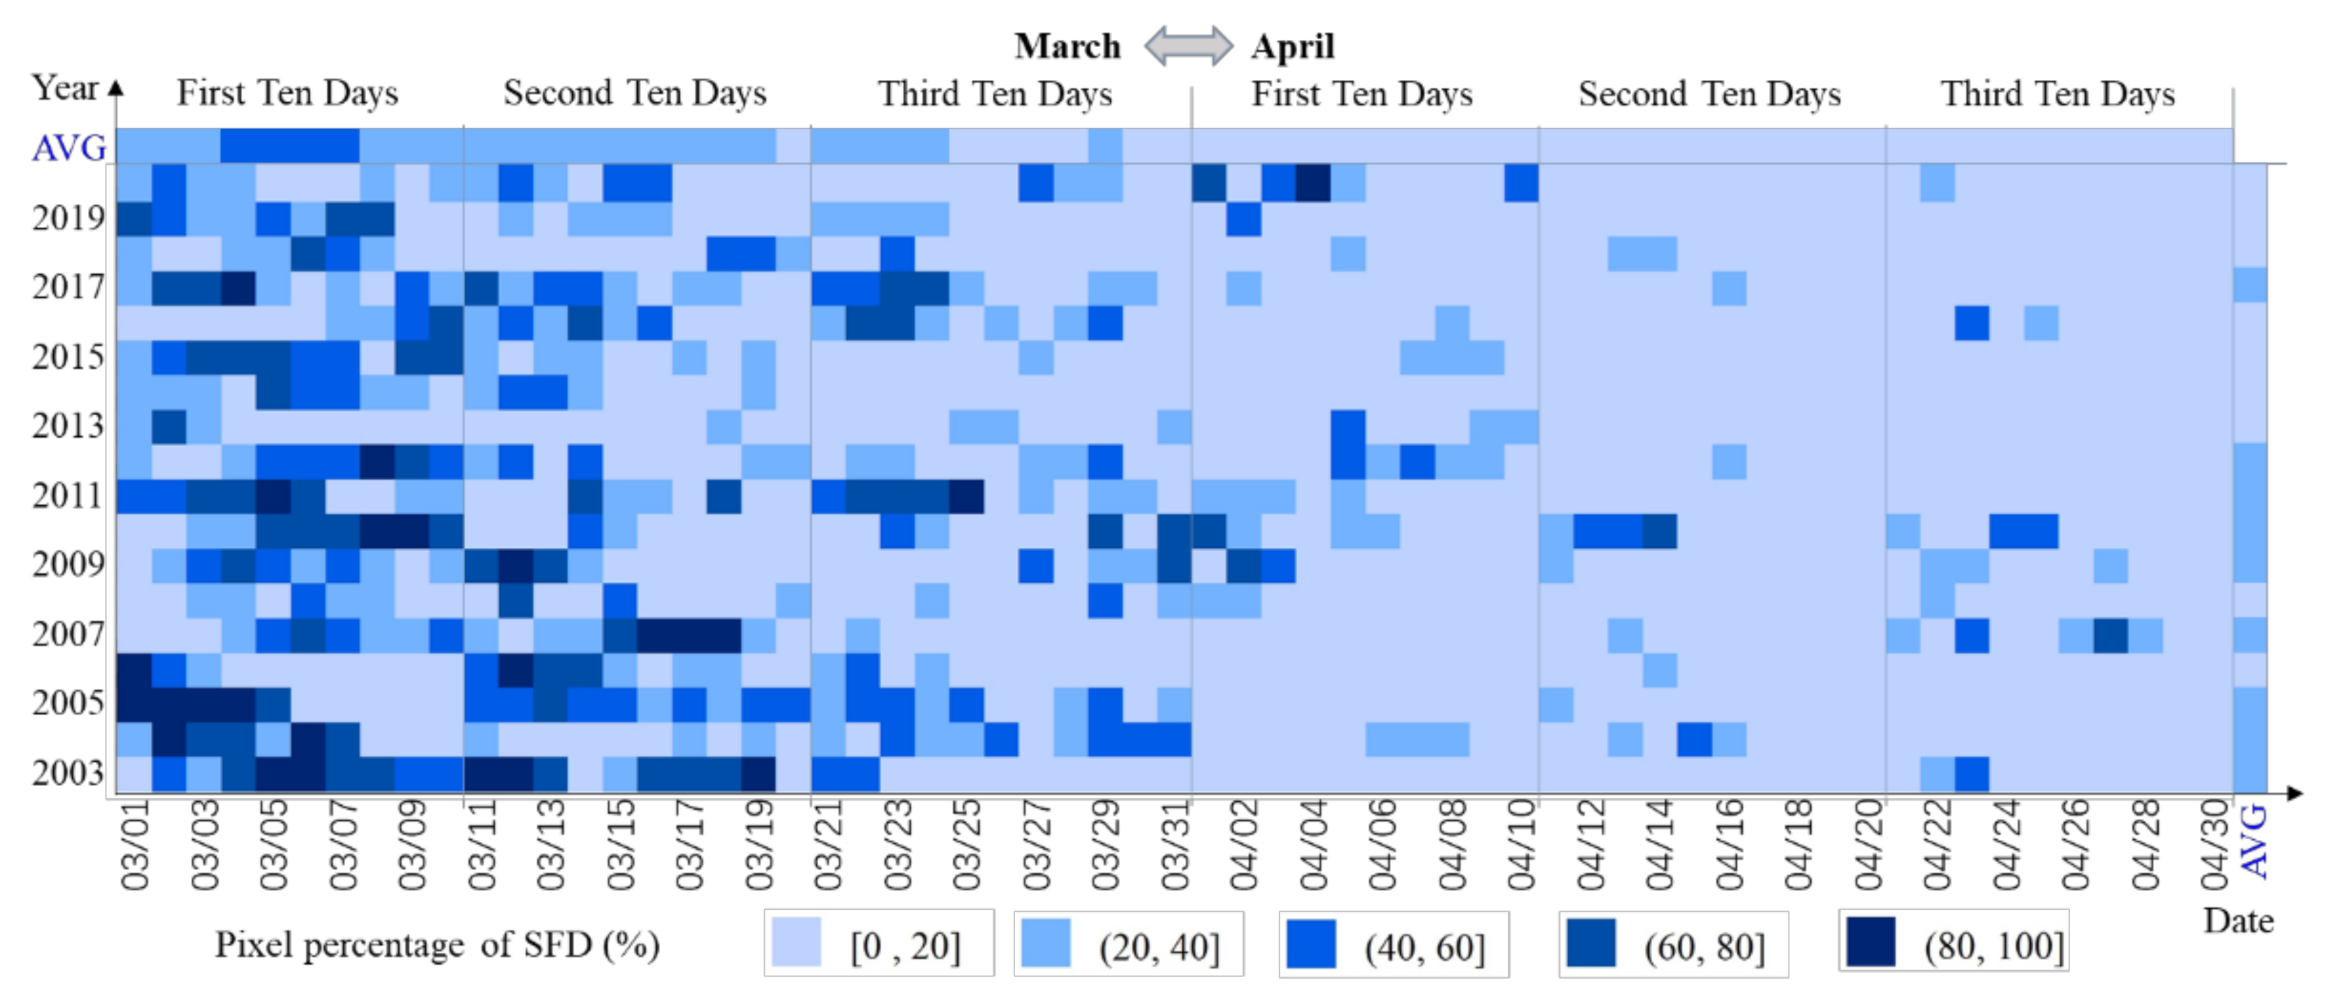
Daily risk of SFD, denoted by the pixel percentage affected by SFD, over all tea planting areas in the MLRYR from March to April in 2003–2020 is presented in Figure 9. Among the 18 years studied, there were no years in which the average pixel-based percentage of SFD exceeded 40% (see rightmost column of Figure 9), and the number of years in which this proportion was no more than 20% or between 20–40% was nine years. Furthermore, the years with the average pixel-based percentage of no more than 20% were mainly concentrated in the past 10 years. By focusing on the daily average pixel-based percentages of SFD, we can see that the days with percentages greater than 40% were mainly concentrated in the first ten days of March, and the smaller percentages of less than 20% generally occurred in April (see topmost row of Figure 9). Daily pixel percentages of SFD from March to April also decreased with increasing date at a rate of −0.59%/d.
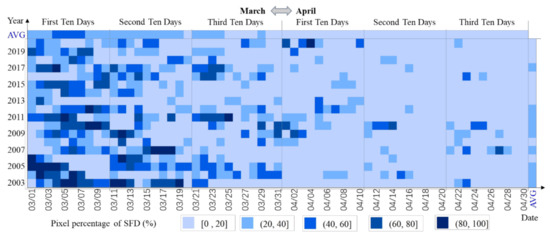
Figure 9.
Time series risk of pixel-based spring frost damage (SFD) for tea plants from March 1 to April 30 in 2003–2020 in the middle and lower reaches of the Yangtze River region, China. The average pixel-based percentages of spring frost damage at annual and daily scales are also shown in the rightmost column and topmost row, respectively.
The total of 1098 (61 days by 18 years) daily pixel-based percentages also revealed that the higher percentages were concentrated in the first twenty days of March in the earliest years, and the smaller percentages normally appeared in the last twenty days of April in the past ten years. Even so, in mid-to-late April, there were still some years when the pixel percentage of SFD exceeded 40%, and this percentage was unexpectedly up to 68% in 2007. It should be pointed out that the percentage in the first ten days of April was not too high in most years. However, the number of days with percentages exceeding 60% was one day in 2009, one day in 2010, and two days in 2020. The maximum percentage occurred on April 4, 2020 with a value of 86%, indicating that more than four fifths of the tea planting area in MLRYR was affected by SFD. Therefore, the temporal risk of SFD for tea planting areas has nearly always existed, and it cannot be ignored.
4.3.2. Spatial Risk
Spatial risk of pixel-based SFD, quantified by the frequencies of occurrence of pixel-based SFD at different latitudes and longitudes (0.1° intervals) averaged over all of the tea planting areas in the MLRYR from March to April in 2003–2020 is shown in Figure 10. When latitude was less than 33.2°N, the average frequency for SFD was raised with increasing latitude (Figure 10a). In areas with relatively higher latitudes, such as at latitudes greater than 33.2°N, the average SFD frequencies fluctuated drastically due to the smaller pixel numbers of tea gardens.

Figure 10.
The frequency (black line, left y-axis) and pixel numbers (gray bars, right y-axis) of pixel-based spring frost damage (SFD) for tea plants as influenced by latitude (a) and longitude (b) at 0.1° intervals from March to April in 2003–2020 in the middle and lower reaches of the Yangtze River region, China.
From the perspective of longitude, the average SFD frequencies in the westernmost part of the study area (the area with lower longitude), were relatively higher compared with other longitudes. SFD frequencies gradually decreased with increasing longitude, and then SFD values were basically stable for longitude greater than about 112°E (Figure 10b). The areas at relatively smaller longitudes had higher SFD frequencies, and this observation may be related to the long distance from the ocean or the higher altitude.
4.3.3. Terrain Risk
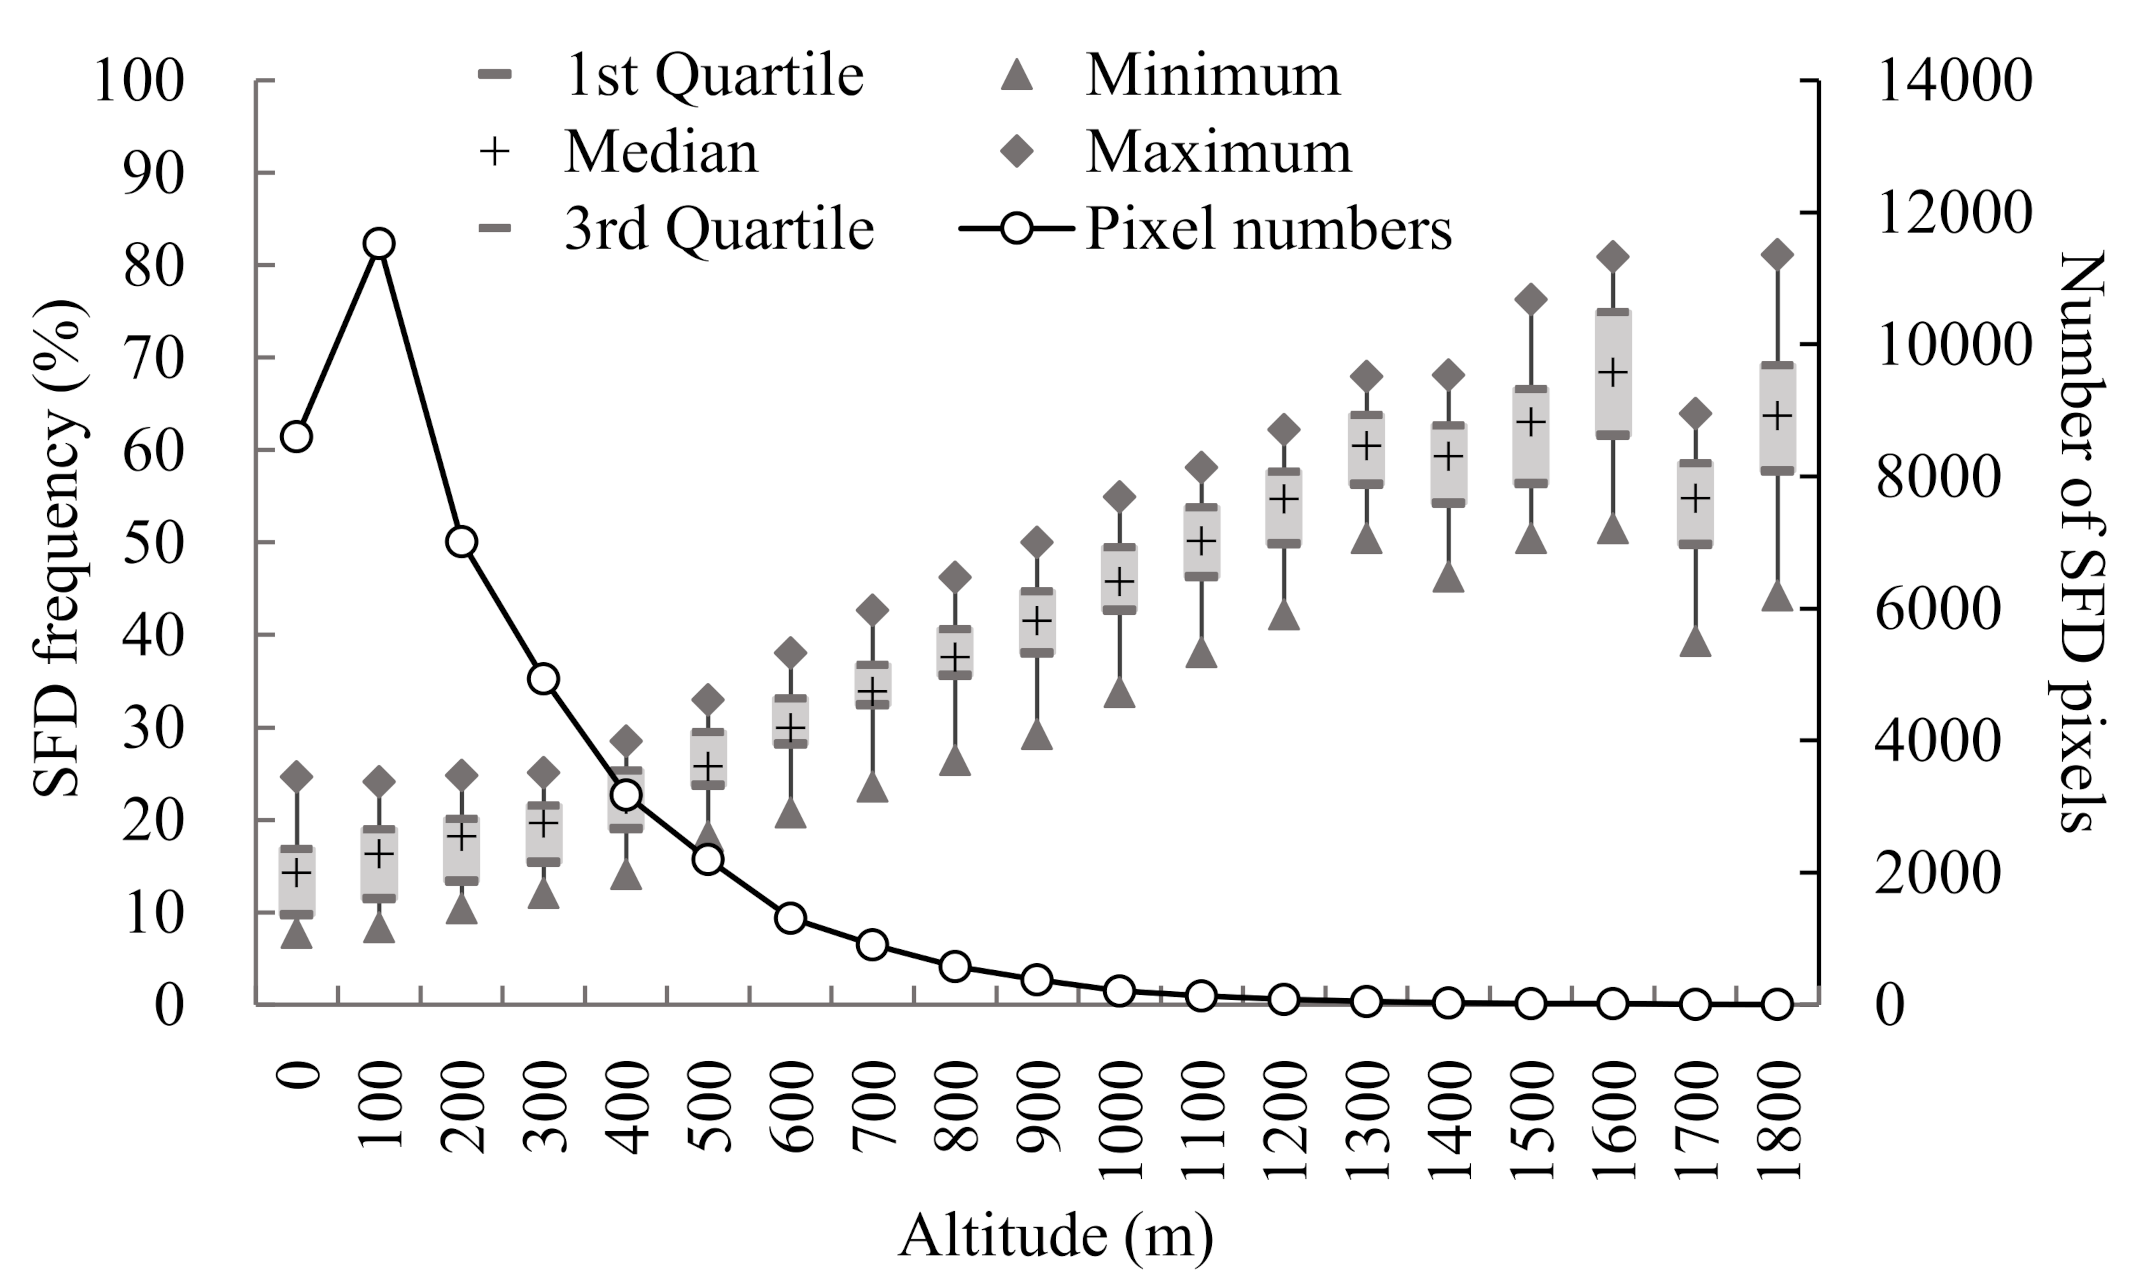
Terrain risk of pixel-based SFD, quantified by the frequencies of occurrence of pixel-based SFD at different altitudes (100 m intervals), averaged over all of the tea planting areas in the MLRYR from March to April in 2003–2020 is shown in Figure 11. The minimum values of all five statistical variances, including the maximum, the minimum, the median, the first quartile, and the third quartile, occurred for the regions where altitude was less than 100 m. The medians of all SFD frequencies for all altitudes were greater than 14.3%, and the maximum median value of 68.4% occurred at 1600 m. The increase in SFD frequency with increasing altitude was statistically significant. Only at the two highest altitudes did the SFD frequencies decrease irregularly. Furthermore, both the difference between the maximum and the minimum frequencies and the difference between the third quartile and the first quartile frequencies were relatively stable with altitude, and the differences were around 18% and 6.6%, respectively, except for the highest three altitudes. The narrow ranges within the same altitude interval indicated that the inter-annual fluctuations among different altitudes were very small. Notably, the change in SFD frequency (box plots, left y-axis) and SFD pixel number (black line with open circles, right y-axis) with altitude presented opposite patterns. Areas with higher altitudes had a higher SFD frequency, but fewer tea plantations were located in these areas. In contrast, in areas where there were more tea plantations, SFD frequency was relatively low.
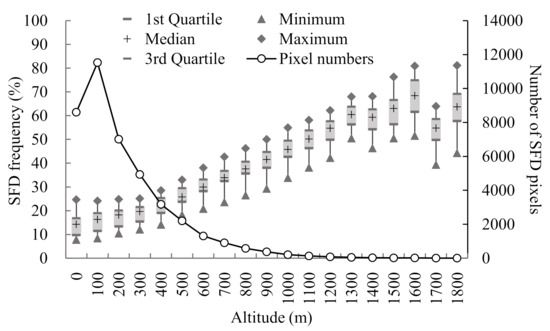
Figure 11.
Annual spring frost damage (SFD) frequency (box plots, left y-axis) and number of SFD pixels (black line with open circles, right y-axis) for tea plants as influenced by altitude at 100 m intervals in 2003–2020 in the middle and lower reaches of the Yangtze River region, China. The upper and lower boundaries of the box plots represent the 25th and 75th percentiles, the black crosses are the medians, and solid triangles and diamonds at the ends of the whiskers represent the minimum and maximum frequencies, respectively.
5. Discussion and Limitations
5.1. Advantage for Satellite-Based Tmin Estimation
Daily minimum temperature is the critical trigger threshold of SFD for crops (winter wheat [45], winter sugar beet [46], potato [47]); orchards (apple and cherry [11], tea [14]); and forests (beech [10,48,49], spruce [11]). The spatiotemporal distribution of Tmin, therefore, needs to be accurately identified in order to know whether SFD has occurred and what the extent of the impacts are. However, ground-based Tmin observations are discontinuous and heterogeneous because of limitations in the weather station network layout. The discrete distribution of weather stations will result in underestimation or overestimation for spatial SFD risk, especially in areas where the meteorological stations are themselves very sparse [21], and in areas where elevation changes drastically. Due to the availability of LST data in recent years for regions with inadequate or inaccessible weather station networks, the retrieval of minimum air temperature from remotely sensed LST has been a popular method for estimating Tmin, and good relationships have been reported between nighttime LST and Tmin [21,22,23]. By employing the standard lapse rate of air temperature with elevation, Wang et al. established a Tmin estimation model based on MODIS nighttime reconstructed LST values and DEM data [32]. This simple estimation model effectively solved the problem of spatially discontinuous and heterogeneous weather station locations, and was further confirmed to be a useful method for monitoring and evaluating SFD risk for tea plants in the MLRYR of China.
5.2. Rationality of Risk Distribution
SFD is a well-known worldwide risk for overwintering crops, tree species, and some early spring orchards in temperate climate regions [8,50,51] and Mediterranean areas [49,52] at northern latitudes, and also for tea plantations in humid areas around the equator [14]. The distribution characteristics of SFD risk were systematically analyzed at three scales, including temporal scale, spatial scale, and terrain scale, over the MLRYR in China. The results of our study demonstrated that the period with higher SFD risk for tea plants occurred primarily in early spring over the past two decades. Even so, the SFD risk during late spring (e.g., April) deserves to be given more attention due to occasionally drastic cooling events. Recent research in the Southern Apennine Mountains found that lower temperatures in May in 2019 lengthened the duration of beech leaf development (from dormant bud to leaves completely unfolded) by nine days, and the date of unfolded leaves was even delayed 11 days later compared with the number of days in 2018 [52].
Spatially, the regions with higher SFD risk in the MLRYR were concentrated in the northwestern parts of the study area where altitude was also relatively higher. The results found in this study have also been observed in other studies. For example, Laughlin found that minimum temperatures were lower at higher elevations in the absence of cloud cover and disturbances by wind speed [53]. Kotikot et al. also found that higher elevations increased the odds of a frost occurrence, even though there was only a 400 m elevation range [54]. Additionally, Laughlin and Kalma examined watershed area as a factor affecting frost occurrence, and found that it could explain 65% of the unexplained variation in minimum temperatures [55]. This result may explain the higher SFD risk appearing in the westernmost part of the study area. Kotikot et al. proved that slope aspect was an important factor for frost occurrence [54]. However, different researchers have come to inconsistent conclusions over different regions. Kotikot et al. thought that the odds of frost occurrence on a western slope in equatorial regions were reduced by a factor of 0.12 compared with an eastern slope [54]. Longstroth reported that northern facing slopes were more susceptible to frosts than southern facing slopes in North America [56]. Gurskaya et al. found that northeastern facing slopes were the most frost-prone in the southern Ural Mountains [57]. Therefore, more work should be done in the future to further evaluate SFD risk by considering more potential factors, such as land cover types, distance to water exposure, slope, aspect, etc.
5.3. Impacts of Spring Frost Types
Spring frost is a catastrophic weather event caused by the intrusion of cold air. Frosts can be classified as advection frost, radiation frost, or mixed frost [58]. Advection frost occurs when cold air accumulated at high latitudes moves southward, and consequently drops temperature drastically and is followed by strong winds. Radiation frost is caused by strong radiational cooling on the ground surface under the control of cold high pressure that produces clear and windless conditions. Radiation frosts are often very localized and site-specific [59]. They typically occur during springtime when there is a combination of cloudless nights with little or no wind, low humidity, and low temperature. Mixed frost is a combination frost arising from cold air advection from strong winds and radiational cooling. Different frost types may have different impacts on vegetation, depending on where the vegetation grows. Advection frost is mainly found on vertical exposed surfaces, and radiation frost usually occurs in valleys since cold air is heavier than warm air [60]. No matter the type of spring frost, once it occurs, it will damage newly formed buds and flowers, destroy young fruit and crops, and even devastate full trees, thereby bringing huge economic losses to local farmers. It is essential to have prior knowledge of species-specific responses to frost events [60]. The good news is that there are ways to control spring frosts and to mitigate the subsequent damage to plants. Common methods used to protect plantations from frost include smokers, wind machines, and propane burners. Naturally, there are pros and cons to each method. The proper choice depends on many factors such as topography, cost of equipment, and labor requirements (Save money on frost protection with sprinkler irrigation I Netafim (netafimuk.com. Last visited on 20 May 2021)). Effective adaptations may benefit from genetic developments and/or phenotypic plasticity, and the latter is likely to be more important [61].
5.4. Potential Migration of Risk under Climate Warming
Climate warming has been widely accepted. According to climate model projections, the global average air temperature is likely to increase by 0.3–4.8 °C by the end of this century [2]. Temperature is commonly regarded as one of the primary drivers of spring vegetation phenology [62], especially for perennial trees at middle and high latitudes of the Northern Hemisphere [63], and various vegetation types (deciduous needle-leaved forest, alpine and sub-alpine meadow, plain grassland, desert grassland) in Xinjiang in the center of the Eurasian continent [62]. A notable longitudinal change pattern for natural ecosystems has been found, with considerable increases in temperature sensitivity from inland areas to most coastal areas over the North Hemisphere [64]. On one hand, warmer conditions in winter might reduce the effective chilling accumulation, and therefore delay spring phenology [65]. On the other hand, temperature increases in early spring could advance the fulfillment of heat requirements and bring earlier spring phenology [66]. However, climate change might further expose young buds to unstable weather environments, leading to an increased risk of spring frost damage. Ideally, if spring phenology advances more slowly than late spring frost threats, SFD risk may be reduced. Recent research demonstrated that delayed blossom of apple trees was observed from 2001 to 2016 in Shaanxi, China, and late spring frosts mostly occurred before tree flowering, causing only minor frost damage to apple trees [65].
5.5. Uncertainties and Limitations
The MLRYR region, including six provinces and one municipality, was analyzed as a single area. The total land area in the MLRYR exceeds 1,010,000 km2, extending from 24° to 35°N latitude and from 109° to 122°E longitude. The trigger threshold of spring frost for tea plants was set as 4 °C based on an experimental conclusion using variety Longjing 43 as an example [67]. In fact, there are many varieties of tea plants varying over a large spatial extent, and their tolerances for frost damage, consequently, may be different. Therefore, a detailed study of trigger thresholds for frost damage should be done to precisely evaluate the SFD risk for different varieties of tea plants. Moreover, the dates of tea budding and leaf unfolding may come earlier under climate warming, and a phenology-based approach for estimating the tea picking period should be studied in order to accurately assess crop-specific frost risk.
6. Conclusions
Results in this study revealed that both SFD days at the annual scale and SFD areas at the daily scale exhibited a decreasing trend of 2.7 days/decade and 2.45 × 10⁴ ha/day, respectively. Spatially, the regions with the greatest SFD days were mainly distributed in the northwestern part of MLRYR, and the areas with few SFD days were primarily located in the south of MLRYR. Additionally, SFD risks at three scales, including temporal, spatial, and terrain scales, were also evaluated. Generally, higher SFD risks were found in the first twenty days of March at the temporal scale, in the northwestern region at the spatial scale, and in the relatively higher elevation areas at the terrain scale.
This study further confirmed that estimated Tmin based on MYD11A1 nighttime products and DEM is a useful way to map and evaluate threats and potential risks of spring frost damage to tea plantations in the MLRYR China. Our findings have important implications for government agencies to reasonably determine layouts for new tea gardens at higher elevations, for agricultural insurance agencies to draft effective tea insurance strategies at different regions, and for tea farmers to give greater attention to potential frost damage and to take appropriate frost prevention measures to reduce losses.
Author Contributions
Conceptualization, P.W. and Z.H.; methodology, P.W.; software and data curation, J.T., Y.M. and D.W.; validation, J.T., J.Y. and Z.J.; writing—original draft preparation, P.W.; writing—review and editing, P.W. and Z.H.; funding acquisition, P.W. All authors have read and agreed to the published version of the manuscript.
Funding
The research was financially supported by the National Key Research and Development Program of China (2019YFD1002203) and the National Natural Science Foundation of China (31771672).
Institutional Review Board Statement
Not applicable.
Informed Consent Statement
Not applicable.
Data Availability Statement
All data used during the study area available at http://data.cma.cn/site/index.html, https://earthdata.nasa.gov/, and https://doi.org/10.5067/ASTER/ASTGTM_NC.003 (accessed on 25 April 2021).
Conflicts of Interest
The authors declare no conflict of interest.
References
- Jin, J.; Diao, X.G.; Feng, H.Q. The status and development trend forecast of Zhejiang tea industry in 2019. China Tea 2020, 3, 53–57. [Google Scholar]
- IPCC. Summary for policymakers. In Climate Change 2013. In The Physical Science Basis. Contribution of Working Group I to the Fifth Assessment Report of the Intergovernmental Panel on Climate Change; Stocker, T.F., Qin, D., Plattner, G.-K., Tignor, M., Allen, S.K., Boschung, J., Nauels, A., Xia, Y., Bex, V., Midgley, P.M., Eds.; Cambridge University Press: Cambridge, UK; New York, NY, USA, 2013; p. 1535. [Google Scholar]
- Shen, R.Q.; Chen, X.Z.; Chen, L.; He, B.; Yuan, W.P. Regional evaluation of satellite-based methods for identifying leaf unfolding date. ISPRS J. Photogramm. Remote Sens. 2021, 175, 88–98. [Google Scholar] [CrossRef]
- Fu, Y.H.; Piao, S.L.; de Beeck, M.O.; Cong, N.; Zhao, H.F.; Zhang, Y.; Menzel, A.; Janssens, I.A. Recent spring phenology shifts in western Central Europe based on multiscale observations. Glob. Ecol. Biogeogr. 2014, 23, 1255–1263. [Google Scholar] [CrossRef]
- Kodra, E.; Steinhaeuser, K.; Ganguly, A.R. Persisting cold extremes under 21st-century warming scenarios. Geophys. Res. Lett. 2011, 38, 99–106. [Google Scholar] [CrossRef]
- Augspurger, C.K. Reconstructing patterns of temperature, phenology, and frost damage over 124 years: Spring damage risk is increasing. Ecology 2013, 94, 41–50. [Google Scholar] [CrossRef] [PubMed]
- Inouye, D.W. The ecological and evolutionary significance of frost in the context of climate change. Ecol. Lett. 2000, 3, 457–463. [Google Scholar] [CrossRef]
- Hufkens, K.; Friedl, M.A.; Keenan, T.F.; Sonnentag, O.; Bailey, A.; O’Keefe, J.; Richardson, A.D. Ecological impacts of a widespread frost event following early spring leafout. Glob. Chang. Biol. 2012, 18, 2365–2377. [Google Scholar] [CrossRef]
- Muffler, L.; Beierkuhnlein, C.; Aas, G.; Jentsch, A.; Schweiger, A.H.; Zohner, C.; Kreyling, J. Distribution ranges and spring phenology explain late frost sensitivity in 170 woody plants from the Northern Hemisphere. Glob. Ecol. Biogeogr. 2016, 25, 1061–1071. [Google Scholar] [CrossRef]
- Bascietto, M.; Bajocco, S.; Mazzenga, F.; Matteucci, G. Assessing spring frost effects on beech forests in Central Apennines from remotely-sensed data. Agric. For. Meteorol. 2018, 248, 240–250. [Google Scholar] [CrossRef]
- Vitasse, Y.; Schneider, L.; Rixen, C.; Christen, D.; Rebetez, M. Increase in the risk of exposure of forest and fruit trees to spring frosts at higher elevations in Switzerland over the last four decades. Agric. For. Meteorol. 2018, 248, 60–69. [Google Scholar] [CrossRef]
- Jin, Z.F.; Yao, Y.P. Research on Key Technique of Meteorological Support for the Tea Production in Regions South of the Yangtze River; China Meteorological Press: Beijing, China, 2017. (In Chinese) [Google Scholar]
- Snyder, R.; de Melo-Abreu, J.P.; Matulich, S. Frost Protection: Fundamentals, Practice and Economics volume 1 and 2; Environment and Natural Resources Service Publications: Roma, Italy, 2005. [Google Scholar]
- Kotikot, S.M.; Flores, A.; Griffin, R.E.; Sedah, A.; Nyaga, J.; Mugo, R.; Limaye, A.; Irwin, D.E. Mapping threats to agriculture in East Africa: Performance of MODIS derived LST for frost identification in Kenya’s tea plantations. Int. J. Appl. Earth Obs. Geoinf. 2018, 72, 131–139. [Google Scholar] [CrossRef]
- Ducrey, M. Aspects Écophysiologiques de la Réponse et de L’adaptation des Sapins Méditerranéens aux Extrêmes Climatiques: Gelées Printanières et Sécheresse Estivale. 1998. Available online: https://core.ac.uk/reader/15518378 (accessed on 9 July 2021).
- Jin, Z.F.; Ye, J.G.; Yang, Z.Q.; Sun, R.; Hu, B.; Li, R.Z. Climate suitability for tea growing in Zhejiang Province. Chin. J. Appl. Ecol. 2014, 25, 967–973. Available online: http://www.cjae.net/CN/Y2014/V25/I4/967 (accessed on 9 July 2021). (In Chinese with English Abstract).
- Jin, Z.F.; Yao, Y.P.; Gao, L.; Wang, Z.H.; Yu, L.Y.; Chen, H.; Li, R.Z. Grade of Frost Damage to Tea Plant; QX/T 410—2017; China Meteorological Administration: Beijing, China, 2017. (In Chinese) [Google Scholar]
- Hu, B.; Jin, Z.F.; Yan, J.Z.; Li, R.Z. Temporal and spatial distribution of early spring frost of Camellia Sinensic in Zhejiang Province based on FastICA. Chin. Agric. Sci. Bull. 2014, 30, 190–196, (In Chinese with English Abstract). [Google Scholar]
- Lou, W.P.; Wu, L.H.; Ji, Z.W. The contribution of climate change to economic output of Wuniuzao spring tea in Shaoxing. Chin. J. Ecol. 2014, 33, 3358–3367, (In Chinese with English Abstract). [Google Scholar] [CrossRef]
- Jin, Z.F.; Hu, B.; Yan, J.Z.; Yang, Z.Q.; Li, R.Z.; Ye, J.G. Agro-meteorological disaster risk evaluation of tea planting in Zhejiang Province. Chin. J. Ecol. 2014, 33, 771–777, (In Chinese with English Abstract). [Google Scholar] [CrossRef]
- Zhu, W.B.; Lv, A.F.; Jia, S.F. Estimation of daily maximum and minimum air temperature using MODIS land surface temperature products. Remote Sens. Environ. 2013, 130, 62–73. [Google Scholar] [CrossRef]
- Rosenfeld, A.; Dorman, M.; Schwartz, J.; Novack, V.; Just, A.C.; Kloog, T. Estimating daily minimum, maximum, and mean near surface air temperature using hybrid satellite models across Isreal. Environ. Res. 2017, 159, 297–312. [Google Scholar] [CrossRef]
- Rao, Y.H.; Liang, S.L.; Wang, S.D.; Yu, Y.Y.; Song, Z.; Zhou, Y.; Shen, M.G.; Xu, B.Q. Estimating daily average surface air temperature using satellite land surface temperature and top-of-atmosphere radiation products over the Tibetan Plateau. Remote Sens. Environ. 2019, 234, 111462. [Google Scholar] [CrossRef]
- Yang, J.S.; Wang, Y.Q.; August, P.V. Estimation of Land Surface Temperature Using Spatial Interpolation and Satellite-Derived Surface Emissivity. J. Environ. Inform. 2004, 4, 37–44. [Google Scholar] [CrossRef]
- Mahdian, M.H.; Bandarabady, S.R.; Sokouti, R.; Norouzi Banis, Y. Appraisal of the geostatistical methods to estimate monthly and annual Temperature. J. Appl. Sci. 2009, 9, 128–134. [Google Scholar] [CrossRef]
- Wu, T.T.; Li, Y.R. Spatial interpolation of temperature in the United States suing residual kriging. Appl. Geogr. 2013, 44, 112–120. [Google Scholar] [CrossRef]
- Jin, M.L.; Dickinson, R.E. Land surface skin temperature climatology: Benefitting from the strengths of satellite observations. Environ. Res. Lett. 2010, 5, 044004. [Google Scholar] [CrossRef]
- Vancutsem, C.; Ceccato, P.; Dunku, T.; Connor, S.J. Evaluation of MODIS land surface temperature data to estimate air temperature in different ecosystems over Africa. Remote Sens. Environ. 2010, 114, 449–465. [Google Scholar] [CrossRef]
- Benali, A.; Carvalho, A.C.; Nunes, J.P.; Carvalhais, N.; Santos, A. Estimating air surface temperature in Portugal using MODIS LST data. Remote Sens. Environ. 2012, 124, 108–121. [Google Scholar] [CrossRef]
- Lin, S.P.; Moore, N.J.; Messina, J.P.; DeVisser, M.H.; Wu, J.P. Evaluation of estimating daily maximum and minimum air temperature with MODIS data in east Africa. Int. J. Appl. Earth Obs. Geoinf. 2012, 18, 128–140. [Google Scholar] [CrossRef]
- Yoo, C.; Im, J.; Park, S.; Quakenhush, L.J. Estimation of daily maximum and minimum air temperatures in urban landscapes using MODIS time series satellite data. ISPRS J. Photogramm. Remote Sens. 2018, 137, 149–162. [Google Scholar] [CrossRef]
- Wang, P.J.; Ma, Y.P.; Tang, J.X.; Wu, D.R.; Chen, H.; Jin, Z.F.; Huo, Z.G. Spring frost damage to tea plants can be identified with daily minimum air temperatures estimated by MODIS land surface temperature products. Remote Sens. 2021, 13, 1177. [Google Scholar] [CrossRef]
- Sulla-Menashe, D.; Friedl, M.A. User Guide to Collection 6 MODIS Land Cover (MCD12Q1 and MCD12Q2) Product. 2018. Available online: https://lpdaac.usgs.gov/documents/101/MCD12_User_Guide_V6.pdf (accessed on 7 July 2021).
- Sun, L.; Chen, Z.X.; Gao, F.; Anderson, M.; Song, L.S.; Wang, L.M.; Hu, B.; Yang, Y. Reconstructing daily clear-sky land surface temperature for cloudy regions from MODIS data. Comput. Geosci. 2017, 105, 10–20. [Google Scholar] [CrossRef]
- Mann, H.B. Nonparametric tests against trend. Econometrica 1945, 13, 245–259. [Google Scholar] [CrossRef]
- Kendall, M.G. Rank Correlation Measures; Charles Griffin: London, UK, 1975; p. 202. [Google Scholar]
- Yue, S.; Wang, C.Y. The Mann-Kendall test modified by effective sample size to detect trend in serially correlated hydrological series. Water Resour. Manag. 2004, 18, 201–218. [Google Scholar] [CrossRef]
- Shadmani, M.; Marofi, S.; Roknian, M. Trend analysis in reference evapotranspiration using Mann-Kendall and Spearman’s Rho tests in arid regions of Iran. Water Resour. Manag. 2012, 26, 211–224. [Google Scholar] [CrossRef]
- Asfaw, A.; Simane, B.; Hassen, A.; Bantider, A. Variability and time series trend analysis of rainfall and temperature in northcentral Ethiopia: A case study in Woleka sub-basin. Weather Clim. Extrem. 2018, 19, 29–41. [Google Scholar] [CrossRef]
- Sneyers, R. Sur l’analyse Statistique des Series d’Observations; Tech Note; OMM: Geneva, Switzerland, 1975. [Google Scholar]
- Gerstengarbe, F.W.; Werner, P.C. Estimation of the beginning and end of recurrent events within a climate regime. Clim. Res. 1999, 11, 97–107. Available online: https://www.int-res.com/articles/cr/11/c011p097.pdf (accessed on 9 July 2021). [CrossRef]
- Zhao, J.; Huang, Q.; Chang, J.X.; Liu, D.F.; Huang, S.Z.; Shi, X.Y. Analysis of temporal and spatial trends of hydro-climatic variables in the Wei River Basin. Environ. Res. 2015, 139, 55–64. [Google Scholar] [CrossRef]
- Ullah, S.; You, Q.L.; Ali, A.; Ullah, W.; Jan, M.A.; Zhang, Y.Q.; Xie, W.X.; Xie, X.R. Observed changes in maximum and minimum temperatures over China-Pakistan economic corridor during 1980–2016. Atmos. Res. 2019, 216, 37–51. [Google Scholar] [CrossRef]
- Wu, C.G.; Ning, S.W.; Jin, J.L.; Zhou, Y.L.; Zhou, L.Y.; Bai, X.; Zhang, L.B.; Cui, Y. Construction and application of comprehensive drought index based on uncertainty cloud reasoning algorithm. Sci. Total Environ. 2021, 779, 146533. [Google Scholar] [CrossRef]
- Zhao, L.C.; Li, Q.Z.; Zhang, Y.; Wang, H.Y.; Du, X. Normalized NDVI valley area index (NNVAI)-based framework for quantitative and timely monitoring of winter wheat frost damage on the Huang-Huai-Hai Plain, China. Agric. Ecosyst. Environ. 2020, 292, 106793. [Google Scholar] [CrossRef]
- Reinsdorf, E.; Koch, H.J. Modeling crown temperature of winter sugar beet and its application in risk assessment for frost killing in Central Europe. Agric. For. Meteorol. 2013, 182–183, 21–30. [Google Scholar] [CrossRef]
- Pulatov, B.; Linderson, M.; Hall, K.; Jönsson, A.M. Modeling climate change impact on potato crop phenology, and risk of frost damage and heat stress in northern Europe. Agric. For. Meteorol. 2015, 214–215, 281–292. [Google Scholar] [CrossRef]
- Awaya, Y.; Tanaka, K.; Kodani, E.; Nishizono, T. Responses of a beech (Fagus crenata Blume) stand to late spring frost damage in Morioka, Japan. For. Ecol. Manag. 2009, 257, 2359–2369. [Google Scholar] [CrossRef]
- Allevato, E.; Saulino, L.; Cesarano, G.; Chirico, G.B.; D’Urso, G.; Bolognesi, S.F.; Rita, A.; Rossi, S.; Saracino, A.; Bonanomi, G. Canopy damage by spring frost in European beech along the Apennines: Effect of latitude, altitude and aspect. Remote Sens. Environ. 2019, 225, 431–440. [Google Scholar] [CrossRef]
- Hänninen, H. Climate warming and the risk of frost damage to boreal forest trees: Identification of critical ecophysiological traits. Tree Physiol. 2006, 26, 889–898. [Google Scholar] [CrossRef]
- Parker, L.; Pathak, T.; Ostoja, S. Climate change reduces frost exposure for high-value California orchard crops. Sci. Total Environ. 2021, 762, 143971. [Google Scholar] [CrossRef]
- Proietti, R.; Antonucci, S.; Monteverdi, M.C.; Garfi, V.; Marchetti, M.; Plutino, M.; Di Carlo, M.; Germani, A.; Santopuoli, G.; Castaldi, C.; et al. Monitoring spring phenology in Mediterranean beech populations through in situ observation and Synthetic Aperture Radar methods. Remote Sens. Environ. 2020, 248, 111978. [Google Scholar] [CrossRef]
- Laughlin, G.P. Minimum temperature and lapse rate in complex terrain: Influencing factors and prediction. Arch. Meteorol. Geophys. Bioclimatol. Ser. B 1982, 30, 141–152. [Google Scholar] [CrossRef]
- Kotikot, S.M.; Flores, A.; Griffin, R.E.; Nyaga, J.; Case, J.L.; Mugo, R.; Sedah, A.; Adams, E.; Limaye, A.; Irwin, D.E. Statistical characterization of frost zones: Case of tea freeze damage in the Kenyan highlands. Int. J. Appl. Earth Obs. Geoinf. 2020, 84, 101971. [Google Scholar] [CrossRef]
- Laughlin, G.P.; Kalma, J.D. Frost risk mapping for landscape planning: A methodology. Theor. Appl. Climatol. 1990, 42, 41–51. [Google Scholar] [CrossRef]
- Longstroth, M. Analyzing and Improving Your Farm’s Air Drainage. 2012. Available online: http://msue.anr.msu.edu/news/analyzing_and_improving_your_farms_air_drainage (accessed on 22 May 2021).
- Gurskaya, M.; Moiseev, P.; Wilmking, M. Does slope exposure affect frost ring formation in Picea obovata growing at treeline in the Southern Urals? Silva Fenn. 2016, 50, 1560. [Google Scholar] [CrossRef][Green Version]
- Wang, P.J.; Tang, J.X.; Jin, Z.F.; Ma, Y.P.; Chen, H. Review on spring frost disaster for tea plant in China. J. Appl. Meteorol. Sci. 2021, 32, 129–145, (In Chinese with English Abstract). [Google Scholar]
- Svystun, T.; Lundströmer, J.; Berlin, M.; Westin, J.; Jönsson, A.M. Model analysis of temperature impact on the Norway spruce provenance specific bud burst and associated risk of frost damage. For. Ecol. Manag. 2021, 493, 119252. [Google Scholar] [CrossRef]
- Diniz, É.S.; Lorenzon, A.S.; de Castro, N.L.M.; Marcatto, G.E.; dos Santos, O.P.; de Deus, J.C., Jr.; Cavalcante, R.B.L.; Fernandes-Filho, E.I.; Amaral, C.H. Forecasting frost risk in forest plantations by the combination of spatial data and machine learning algorithms. Agric. For. Meteorol. 2021, 306, 108450. [Google Scholar] [CrossRef]
- Hoffmann, A.A.; Sgrò, C.M. Climate change and evolutionary adaptation. Nature 2011, 470, 479–485. [Google Scholar] [CrossRef]
- Li, C.; Wang, R.H.; Cui, X.F.; Wu, F.; Yan, Y.; Pang, Q.; Qian, Z.H.; Xu, Y. Responses of vegetation spring phenology to climatic factors in Xinjiang, China. Ecol. Ind. 2021, 124, 107286. [Google Scholar] [CrossRef]
- Hänninen, H.; Kramer, K. A framework for modelling the annual cycle of trees in boreal and temperate regions. Silva Fenn. 2007, 41, 167–205. [Google Scholar] [CrossRef]
- Wang, C.; Cao, R.Y.; Chen, J.; Rao, Y.H.; Tang, Y.H. Temperature sensitivity of spring vegetation phenology correlates to within-spring warming speed over the Northern Hemisphere. Ecol. Ind. 2015, 50, 62–68. [Google Scholar] [CrossRef]
- Guo, L.; Wang, J.H.; Li, M.J.; Liu, L.; Xu, J.C.; Cheng, J.M.; Gang, C.C.; Yu, Q.; Chen, J.; Peng, C.H.; et al. Distribution margins as natural laboratories to infer species’ flowering responses to climate warming and implications for frost risk. Agric. For. Meteorol. 2019, 268, 299–307. [Google Scholar] [CrossRef]
- Shi, P.J.; Chen, Z.H.; Reddy, G.V.P.; Hui, G.; Huang, J.G.; Xiao, M. Timing of cherry tree blooming: Contrasting effects of rising winter low temperatures and early spring temperatures. Agric. For. Meteorol. 2017, 240, 78–89. [Google Scholar] [CrossRef]
- Wang, X.L. Risk Evaluation Technology Research of Spring frost Injury in Southern Yangtze Tea Areas. Master’s Thesis, Nanjing University of Information Science & Technology, Nanjing, China, 2015. [Google Scholar]
Publisher’s Note: MDPI stays neutral with regard to jurisdictional claims in published maps and institutional affiliations. |
© 2021 by the authors. Licensee MDPI, Basel, Switzerland. This article is an open access article distributed under the terms and conditions of the Creative Commons Attribution (CC BY) license (https://creativecommons.org/licenses/by/4.0/).

