
Sparse Label Assignment for Oriented Object Detection in Aerial Images


1
School of Automation, Beijing Institute of Technology, Beijing 100081, China
2
Department of Computer Science and Engineering, Shanghai Jiao Tong University, Shanghai 200240, China
*
Author to whom correspondence should be addressed.
Remote Sens. 2021, 13(14), 2664; https://doi.org/10.3390/rs13142664
Submission received: 4 June 2021
/
Revised: 30 June 2021
/
Accepted: 1 July 2021
/
Published: 7 July 2021
(This article belongs to the Section Remote Sensing Image Processing)
Abstract
:Object detection in aerial images has received extensive attention in recent years. The current mainstream anchor-based methods directly divide the training samples into positives and negatives according to the intersection-over-unit (IoU) of the preset anchors. This label assignment strategy assigns densely arranged samples for training, which leads to a suboptimal learning process and cause the model to suffer serious duplicate detections and missed detections. In this paper, we propose a sparse label assignment strategy (SLA) to select high-quality sparse anchors based on the posterior IoU of detections. In this way, the inconsistency between classification and regression is alleviated, and better performance can be achieved through balanced training. Next, to accurately detect small and densely arranged objects, we use a position-sensitive feature pyramid network (PS-FPN) with a coordinate attention module to extract position-sensitive features for accurate localization. Finally, the distance rotated IoU loss is proposed to eliminate the inconsistency between the training loss and the evaluation metric for better bounding box regression. Extensive experiments on the DOTA, HRSC2016, and UCAS-AOD datasets demonstrate the superiority of the proposed approach.
1. Introduction
Object detection is an important and challenging task in the field of computer vision. With the rapid development of deep learning, a series of models based on convolutional neural networks (CNN) have been proposed to achieve accurate object detection [1,2,3,4,5,6,7]. Different from the objects in the natural scenes, the objects in aerial images are often densely arranged and have large variation in scales, aspect ratios, and orientations, which makes it difficult to achieve accurate detection.
In recent years, many rotation detectors have been proposed to introduce the additional orientation prediction to detect arbitrary-oriented objects in aerial images [8,9,10,11,12,13,14,15]. These detectors first densely preset a large number of prior boxes (also called anchors) to align with the ground-truth (GT) objects. Then positive samples are selected according to the intersection-over-union (IoU) for bounding box regression. This process is also called label assignment. Due to the fact that the objects in the aerial images have large variation in scale, shape, and orientation, more anchors need to be laid to match the objects well. Therefore, this dense training sample selection strategy is denoted as dense label assignment in the paper.
Dense label assignment brings many intractable problems to object detection in aerial images. Firstly, most of the massive predefined anchors are backgrounds, which aggravates the foreground-background imbalance during training [16], especially for one-stage detectors. Secondly, the dense prediction suffers from inconsistency between classification and regression in object detection, thereby degrading detection performance. Specifically, the dense arranged anchors often lead to the case where multiple positive samples predict the same object. However, the detections with high classification scores of these positives cannot guarantee precise localization results, which has been proved in many previous work [17,18,19,20]. Therefore, false duplicate detections may occur after the non-maximum suppression (NMS) process. For example, as shown in Figure 1, the upper part of the illustration shows the local duplicate detection of large object. It can be seen that the high-quality detection (blue) is suppressed by the low-quality detection (green) due to its relative low classification score (0.94 vs. 0.96). Besides, the local false detection box cannot be suppressed (The detection box with a score of 0.91).
Moreover, dense object detection in aerial images suffers from missed detections due to dense label assignment. The bottom of Figure 1 shows the example of missed detection of densely arranged ships. The output detection box (green box with score of 0.93) with poor localization accuracy suppresses the more accurate predictions (blue boxes with scores of 0.90 and 0.76), leading to missed detection of ships. In the above cases, dense positive samples lead to high-overlapping detections. However, the corresponding classification scores are not effective in distinguishing their localization accuracy, thereby resulting in poor detection performance.
Due to the problems mentioned above, we suggest that dense label assignment is not conducive to object detection in aerial images. In this article, we propose a sparse label assignment (SLA) strategy to achieve superior training sample selection and improve densely arranged oriented object detection in aerial images. Firstly, we perform forward propagation to obtain the posterior detections corresponding to the preset anchors. Next, posterior non-maximum suppression (P-NMS) is conducted on the detection boxes according to the localization accuracy. For the remaining detections, their corresponding initial anchors are the high-quality positives and can be used for loss calculation. These selected anchors have varying IoU distributions with limited overlap with each other, which can reduce the misjudgments caused by the weak correlation between the classification and regression. Besides, we performed IoU-balanced representative sampling for negatives to alleviate the imbalance between foreground and background in the one-stage detector.
Since there is generally no large overlap between objects in aerial images, the posterior non-maximum suppression works well in this case. Therefore, sparse label assignment for object detection in aerial images is more suitable.
For accurate detection of densely arranged independent objects, we further propose a position-sensitive feature pyramid network (PS-FPN) to improve the localization performance. PS-FPN uses the coordinate attention module to encode localization information into multi-scale features. The position-sensitive feature maps are then used for high-quality object detection. Finally, a novel distance rotated IoU (D-RIoU) loss function is adopted for rotated bounding box regression for faster convergency and to achieve the consistency between the training loss and the localization accuracy.
The proposed sparse label assignment strategy is conducive to high-precision object detection with little additional overhead. Our proposed methods can be applied to existing models to achieve better detection performance. Extensive experiments on public benchmark datasets of aerial images, HRSC2016 [21] and DOTA [22] prove the superiority of our model.
The contribution of this article can be summarized as follows:
- We suggest that the dense label assignment strategy causes serious false duplicate detections and missed detections in aerial images, which degrades the detection performance;
- A novel sparse label assignment (SLA) strategy is proposed to achieve training sample selection based on their posterior IoU distribution. The posterior non-maximum suppression and representative sampling are used for the selection of positives and negatives, respectively, to improve detection performance;
- The position-sensitive feature pyramid network (PS-FPN) is adopted to extract feature maps for better localization performance. Besides, a novel distance rotated IoU (D-RIoU) loss is proposed to solve the misalignment between training loss and localization accuracy.
The rest of this paper is organized as follows. Section 2 reviews the related work of generic object detection and object detection in aerial images. Section 3 introduces our method in detail. Section 4 shows the ablation experiments of the proposed methods and the performance on different datasets. Section 5 concludes the paper.
2. Related Work
2.1. Generic Object Detection
In recent years, methods based on convolutional neural networks have greatly improved the performance of object detection. A series of CNN-based detectors are proposed to achieve high-quality object detection [1,2,3,6,7]. These methods can be divided into two categories: two-stage detectors and one-stage detectors. The two-stage detectors first generate some candidate regions, and then perform classification and regression on these regions to obtain the final detections, such as faster R-CNN [1], and R-FCN [2]. Two-stage detectors often have high accuracy, but the inference speed is slow. The single-stage detector achieves the object detection by one-step prediction, such as YOLO series [3,5,6], SSD [7]. The inference speed of the single-stage detector is faster, but the detection accuracy is often slightly lower than that of the two-stage framework.
To achieve better detection performance, the current detectors tend to densely preset lots of anchor boxes to achieve good spatial alignment with ground-truth (GT) objects. Then the samples with high IoU with the GT boxes are selected as positive samples for training. This offset-based regression method effectively constrains the search space of parameters and accelerates the network convergence [1]. However, a large number of predefined anchors are required to achieve good spatial alignment with the GT boxes for sufficient prior semantic knowledge. It causes serious imbalances during training and leads to performance degradation. To solve the problems, a series of sampling methods have been proposed to alleviate this imbalance between training samples. For example, focal loss [16] reduces the weight of easy samples to avoid loss being dominated by a large number of simple negative samples. Li et al. [23] utilizes a gradient harmonizing mechanism to balance the gradient flow from different samples. Libra R-CNN [24] proposed IoU-balanced sampling for reducing the imbalance during label assignment.
2.2. Object Detection in Aerial Images
Object detection in aerial images has received extensive attention due to its wide range of application scenarios. With the great breakthrough made by CNN methods, object detection in aerial images has also made considerable progress.
Different from objects in natural images, objects in aerial images often have large variations in scale, aspect ratio, orientation, and there are many scenes that contains densely arranged small objects. Therefore, it is hard to detect objects in aerial images. Some previous detectors directly introduced additional angle prediction based on the generic detectors to locate oriented objects in aerial images [8,25,26]. Although progress has been achieved, these methods do not consider the large variation in scale, shape, and orientation of object in the aerial images, and, therefore, cannot further improve the detection performance.
Recently, a series of works have been proposed to improve the performance of rotation detectors from many aspects. Some studies designed better features to improve detection accuracy [27,28,29,30]. For example, CAD-Net [27] constructs attention-modulated features, as well as global and local contexts to detect objects of different scales. Wang et al. [28] proposed a unified feature-merged network to aggregate the context information in multiple scales for better small object detection. CFC-Net [29] improves performance by building features suitable for classification and regression tasks, respectively. Fu et al. [30] proposed a feature-fusion architecture to handle the problem of multi-scale objects by generating a multi-scale feature hierarchy. The combination of the features of shallow layers with semantic representations and the feature maps of top layers with low-level information helps to detect objects with different scales.
The representation of oriented objects is a unique problem for objects detection in aerial images, which has been discussed in some recent works [31,32,33,34,35,36]. Yang et al. [31] suggested that rotated rectangle representation is subject to boundary problems that make the network hard to converge. To solve the problem, circular smooth label [31], and densely coded labels [32] are proposed to convert angle regression into fine-grained angle classification to avoid the out-of-bounds angles. Qian et al. [33] and Ming et al. [34] construct multiple representations of oriented objects to unify boundary conditions for better bounding box regression optimization. Yang et al. [35] discussed the inconsistency between the localization accuracy and loss caused by the boundary problems of the oriented rectangle, and proposed the Gaussian Wasserstein distance loss to achieve consistent regression optimization.
There are also some works that improve object detection in aerial images from the label assignment. Object detection methods in aerial images often follow the label assignment methods of generic object detection. That is, the positives and negatives are selected according to the preset IoU threshold [4]. Although some novel methods have been proposed to improve the label assignment strategy [37,38,39], these works do not take into account the characteristics of aerial image targets. Recently, some label assignment methods have been proposed for rotating aerial object detection [10,20,40]. Ming et al. [20] observed the inconsistency of localization ability before and after bounding box regression, and proposed a dynamic anchor learning strategy to adaptively select the optimal anchors for the rotation object detection. Zhong et al. [10] decoupled the rotating bounding box into a horizontal bounding box to reduce the instability of the angle during anchor matching process. Xiao et al. [40] used a adaptive IoU threshold for training sample selection to keep a balance between positive and negative anchors.
3. The Proposed Method
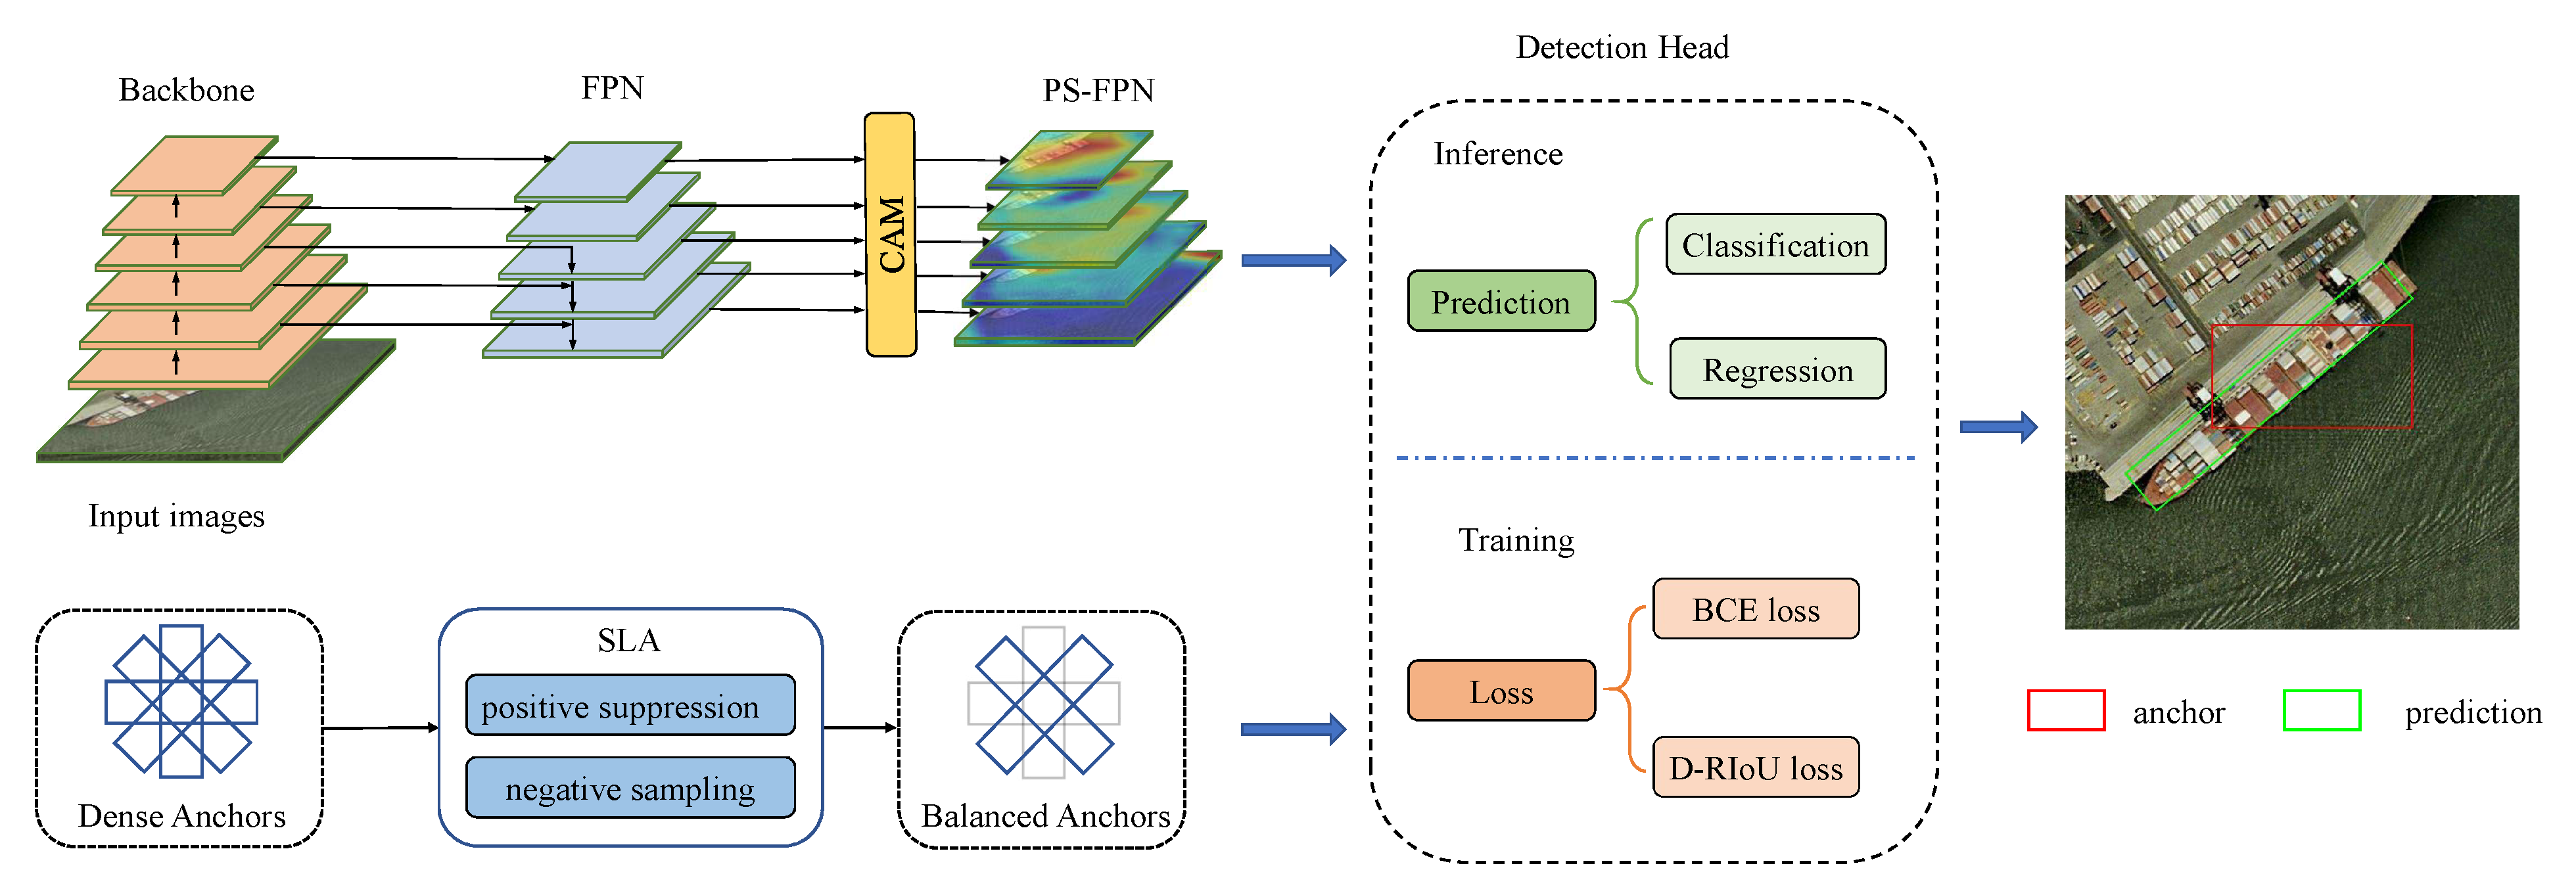
The overall framework of our method is shown in Figure 2. Our proposed model consists of three parts: sparse label assignment strategy (SLA) for training sample selection, position-sensitive feature pyramid network (PS-FPN) for feature extraction, and distance rotated IoU loss (D-RIoU) for network training. The following sections will introduce these modules in detail.
3.1. Sparse Label Assignment for Efficient Training Sample Selection
The current rotation detectors use densely arranged anchors to achieve object detection in aerial images. However, the massive preset anchors are redundant for the detection task. On the one hand, the redundant negatives cause the training loss to be dominated by low-quality background. On the other hand, redundant positives induce the misaligned classification scores and regression accuracy as discussed in Section 1 and shown in Figure 3a. The redundancy and imbalance of training samples are of the crucial factors that restrict the performance of the one-stage detector.
It has been proved in some previous work that the detector can achieve good performance without using dense anchors during training [6,41,42]. For example, YOLOv3 [6] only uses one anchor with the highest IoU as the positive sample for training. Multiple anchor learning method [42] constructs anchor bags and selects the most representative anchors from each bag as training samples.
Inspired by these work, we introduce the sparse label assignment strategy to use the sparse anchor to alleviate the problem of duplicate detection and missed detection in aerial images. Sparse label assignment includes two parts: posterior suppression for positives and IoU-balanced representative sampling for negatives.
For positive samples, densely arranged anchors produce dense predictions. However, the inconsistency between classification and regression interferes with selecting accurate detections from dense predictions. The posterior non-maximum suppression (P-NMS) is proposed to select high-quality positives according to the localization accuracy of detections. The algorithm is shown in Algorithm 1. Specifically, we first select anchors whose IoUs with GT are higher than the threshold (usually 0.5) as preliminary positive samples. Next, we calculate the posterior IoU between the GT boxes and the detection boxes regressed from initial positives. Finally, the IoU score is regarded as the confidence of the detections, and non-maximum suppression is performed on the detections. For the remaining detection boxes after P-NMS, we treat the corresponding initial anchors as positive samples for training.
| Algorithm 1. Posterior non-maximum suppression. |
| Input: is a matrix of initially selected positive anchors. is a matrix of detection boxes corresponding to . is a matrix of GT boxes assigned to the corresponding anchors in . calculates the IoU between rotated boxes. is the NMS threshold. t denotes the training process, and . dynamically schedules the NMS threshold according to the training process. |
| Output: is a matrix of final selected positive samples. while do for do if then ; end if end for end while return |
Note that the detection results are unstable in the early stage of training [20]. Therefore, the IoU scores are also unreliable in this phase. We adopted a dynamically scheduling NMS threshold to increase the suppression intensity gradually. The threshold adjustment strategy of NMS is as follows:
in which is the predefined NMS threshold. t denotes the training process, and . Through Equation (1), the threshold of the posterior NMS in the training process gradually decreases, and, thus, the suppression intensity is gradually increased. In this way, we not only ensure a stable training process but also improve the detection performance by suppressing redundant positive samples. For example, as shown in Figure 3a, the model trained with DLA predicts two highly overlapped detections. However, we cannot guarantee the more accurate one (blue box) can be output. As shown in Figure 3b, this issue can be resolved through SLA by suppressing the positives with suboptimal predictions. SLA ensures the sparse valid predictions for each location on feature maps.
Since P-NMS further reduces the number of positives and aggravates the imbalance between foreground and background samples. It is also vital to conduct sparse sampling for negatives. The intuitive method is to perform NMS operations on negative samples, but it is not feasible in practice for the following two reasons:
- Firstly, the number of negatives is much larger than that of positives, and the implementation of NMS on them requires huge memory and is very time-consuming;
- Secondly, the detector does not perform regression supervision on negative samples, so the IoU between the GT boxes and the predictions of negatives is meaningless.
We use the representative sampling for negative samples to achieve balanced training. The algorithm is shown in Algorithm 2. We first divide the anchors into three categories: positive samples, hard samples, and background samples. Positive samples are obtained from initial positives via Algorithm 1. Background samples are anchors that contain a lot of backgrounds. These negatives have the IoU less than the threshold (set to 0.1 in our experiments). The hard samples contain part of objects and are hard to be classified, whose IoUs are in ( is set to 0.4 in our experiments). Next, random sampling is carried out in different types of samples according to the number of positive samples at a ratio of . For example, there are positives after P-NMS, then we randomly select samples in hard samples, and samples in background samples. The total number of negatives used for training is . On the one hand, representative sampling ensures that the number of negative samples changes dynamically according to positive samples, which help to avoid the training loss being dominated by massive negatives. On the other hand, the sampling of hard examples enhances the robustness of classifier to reduce false detections.
| Algorithm 2. Representative sampling for negative samples. |
| Input:: is a matrix of initially selected positive anchors. is a matrix of GT boxes assigned to the corresponding anchors in . calculates the IoU between rotated boxes. is the number of positive samples obtained through P-NMS. and are the thresholds for defining negative and background samples, respectively. and are the constant coefficients of sampling strategy, respectively. is a sampling function that randomly selects t elements from the set . |
| Output:: is a matrix of final selected negative samples. for do end for for do end for return |
3.2. Position-Sensitive Feature Pyramid Network
The aerial images often contain many small and densely arranged objects. For these objects, a slight deviation in coordinate prediction may cause severe performance degradation, so accurate localization is particularly important. We propose the position-sensitive feature pyramid network (PS-FPN) to embed the localization information into the feature pyramid through the coordinate attention module (CAM) (see Figure 2).
The attention mechanism has been widely used in the field of computer vision with great success [43,44,45]. However, many attention methods use global average pooling (GAP), which is harmful to the encoding of positioning information. For example, SE block [44] and CBAM [45] adopt GAP and GAM to compress the feature tensor into the channel-wise vector to capture the dependence of the channel direction, as shown in Figure 4. Motivated by Hou et al. [43] that built spatially selective attention maps for the backbone of the mobile networks, we embed the coordinate attention module (CAM) into the feature pyramid to extract position-sensitive feature maps. The structure of CAM is shown in Figure 4.
Given the input feature map , we first construct the direction-sensitive features as follows:
in which and are the average pooling kernels with size of and , respectively. and are the direction-sensitive features. For example, for the given input feature with the size of , the conducts pooling with the kerenl of on , then we obtain the output feature with size of .
Next, we concatenate the tensors and squeeze it to reduce the parameters:
The concatenation of and is of . Then it is squeezed via a convolution operation to reduce the channels to , The generated is further split into and to encode the position information and then re-weight to the input feature as follows:
in which is the sigmoid function. Directional attention maps are then weighted to the original feature to obtain a direction-sensitive feature map . CAM uses horizontal and vertical pooling to encode spatial coordinate information into features. Therefore, compared with the attention mechanisms that use the global average pooling, the feature pyramid encoded by CAM can more accurately extract the localization information of the objects and achieve accurate bounding box prediction.
Note that the receptive fields of different feature maps of FPN are various. It is not suitable to use the shared weights to learn the localization coding of multi-scale objects. Therefore, we use independent CAM modules for position coding for each level of the multi-scale features. Different from many heavy non-local or self-attention method that brings a massive amount of computational cost, CAM is lightweight and only introduces a few convolutional layers, but achieves substantial performance gains.
3.3. Distance Rotated IoU Loss for Bounding Box Regression
Another thorny issue in object detection in aerial images is the inconsistency between training loss and localization accuracy. The current mainstream regression loss function is the smooth-L loss, which uses the offsets of the prediction box and GT box relative to the anchor for training. However, the smooth-L cannot accurately represent the localization accuracy of the detections. For example, as shown in Figure 5, the two different detection boxes have the same rotated IoU (RIoU) with GT box, but their regression losses are different. Under the supervision of the smooth-L loss, the detector pays more attention to the case on the right in the Figure 5. However, the detection box on the left has only a tiny angle offset relative to the GT box, which is easy to optimize. The inconsistency between the regression loss function and the localization accuracy of the detections hinders the optimization of the regression, making it hard for the network to converge.
IoU loss has achieved great success in generic object detection [46,47]. It is feasible to directly use the rotated IoU to guide the regression in oriented object detection, but it is not optimal. Aerial images contain many objects with large aspect ratios, such as bridges, large vehicles, and ships. A slight deviation between the center of the detection box and that of the GT box will result in a sharp drop in rotated IoU. Therefore, the accurate prediction of the center point is critical in aerial image object detection.
We propose the distance rotated IoU (D-RIoU) loss to solve the above problems. D-RIoU loss uses rotated IoU to guide the regression process while taking into account the deviation of the center point. The formula is as follows:
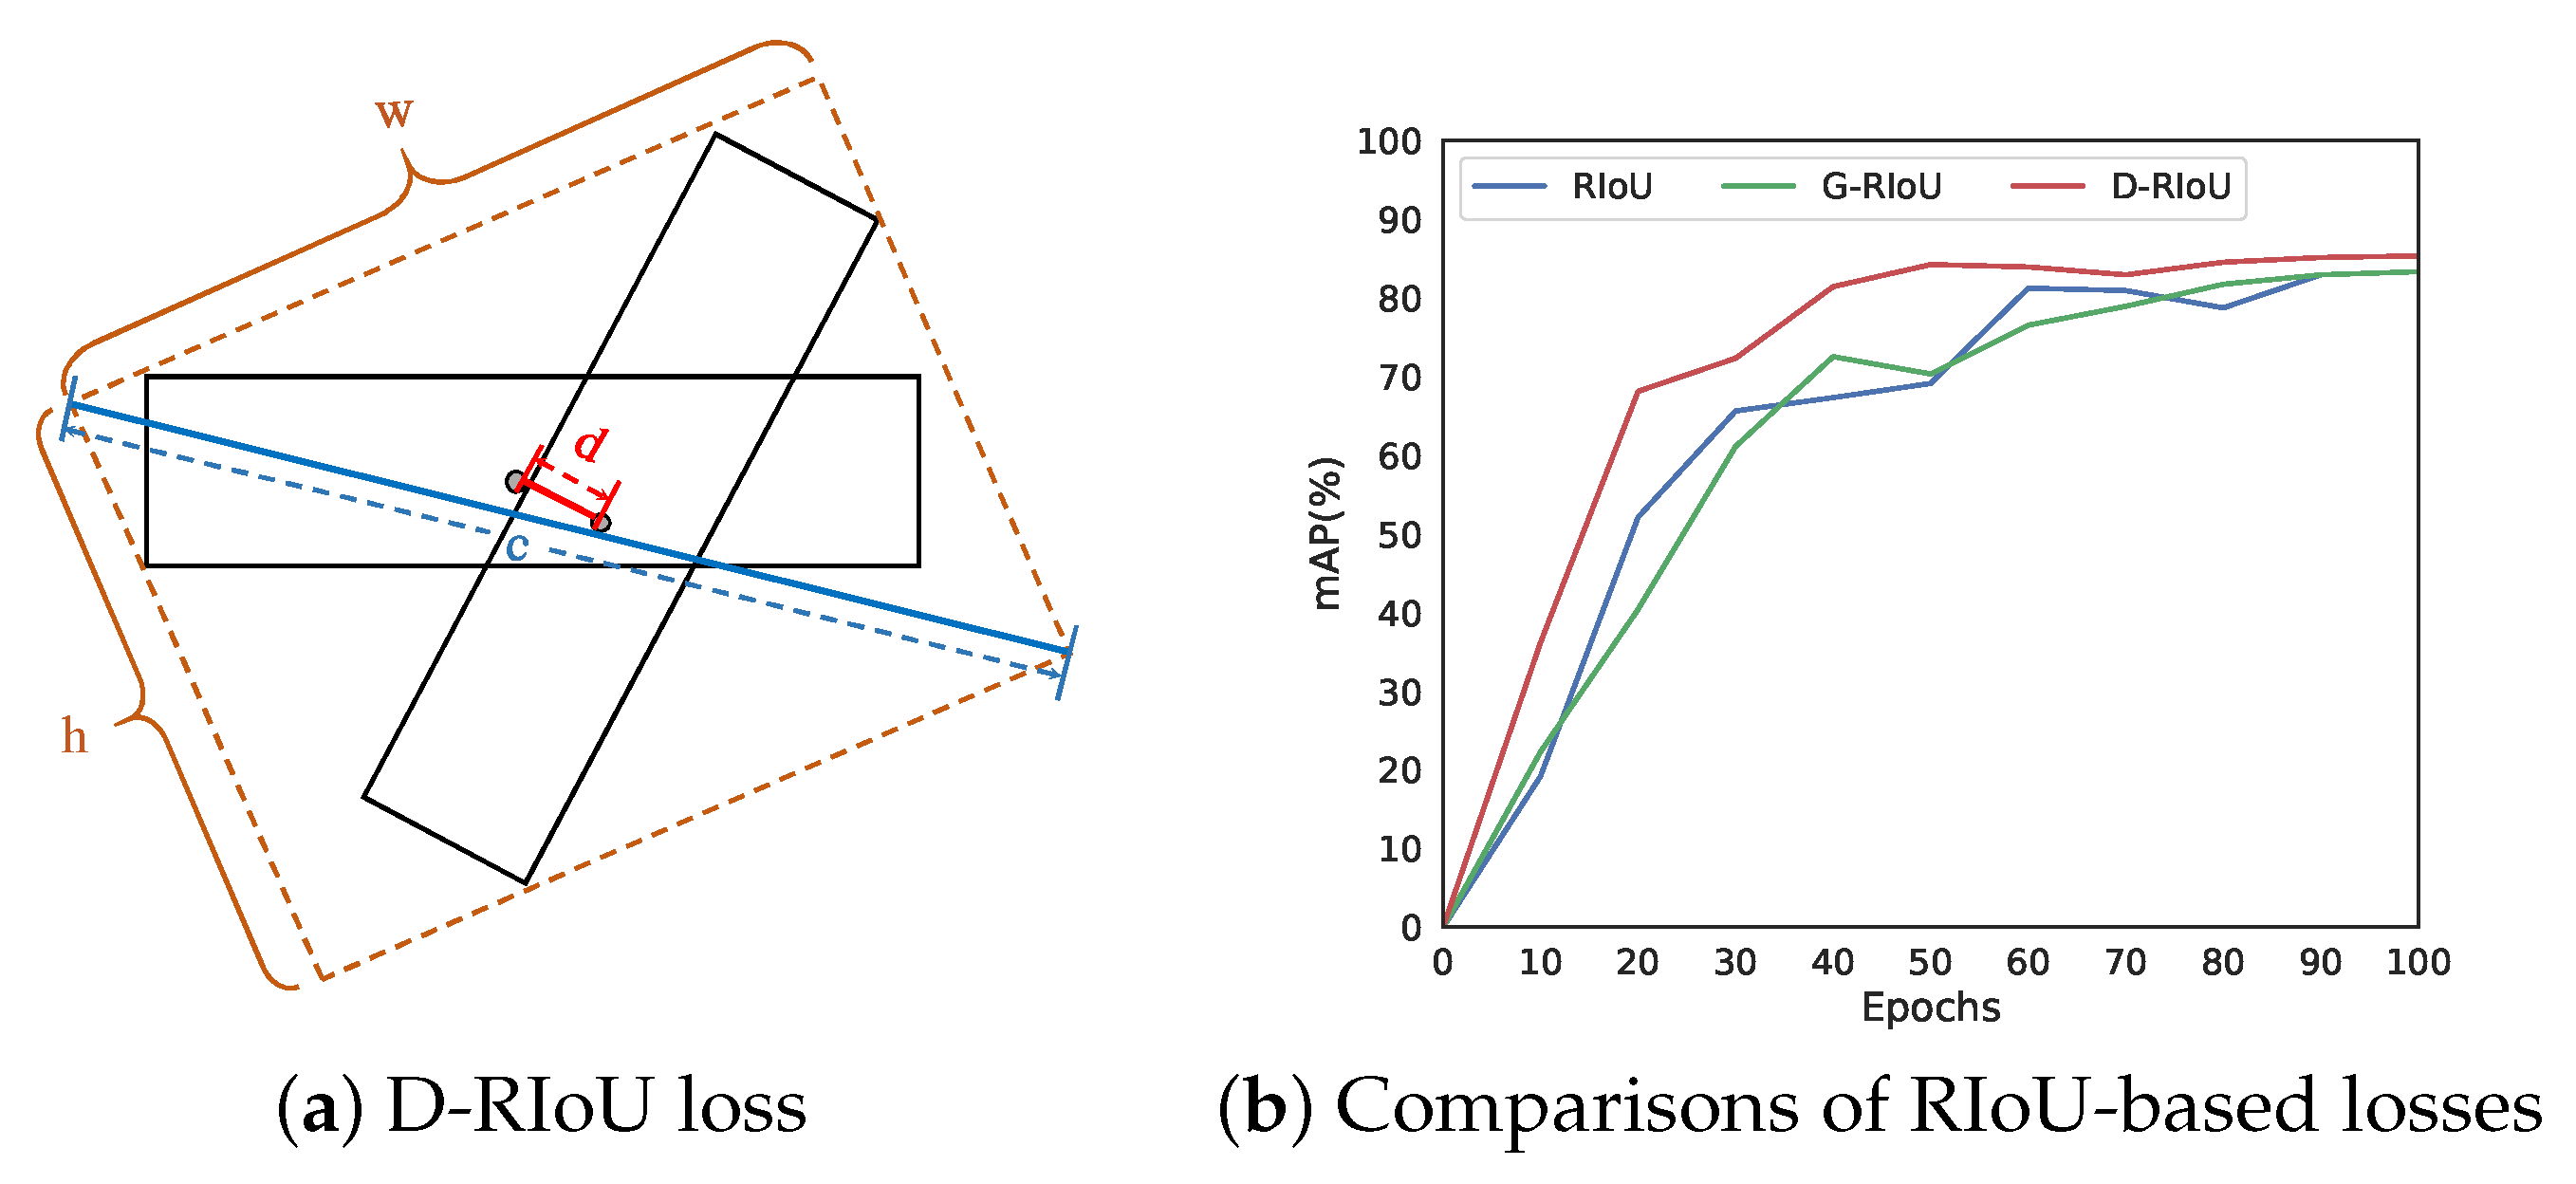
in which and denote prediction box and GT box, respectively. calculates the rotated IoU between and . calculates the distance between the center points of and . c is the diagonal of the smallest enclosing rectangle of and . The smallest enclosing rectangle of two oriented bounding boxes is shown in Figure 6a.
The performance evaluation of D-RIoU loss is shown in Figure 6b. G-RIoU loss is extended from GIoU loss [46] in generic object detection and is as follows:
in which is the smallest enclosing box of . G-RIoU helps to optimize the anchors that have no intersection area with the GT boxes. It can be seen that the model trained with D-RIoU loss achieves faster network convergence and better performance. This is because that D-RIoU loss focuses on the convergence of the center point of the object, which is vital for oriented object detection.
With the proposed D-RIoU loss, the training loss for the model is as follows:
in which is the binary cross entropy (BCE) loss for classification. t and are the predicted score and classification label, respectively. is D-RIoU loss for bounding box regression as defined in Equation (5).
4. Experiments
4.1. Datasets and Implementation Details
4.1.1. HRSC2016
HRSC2016 [21] is a challenging high resolution ship detection dataset with a total of 1061 images. The image sizes range from 300 × 300 to 1500 × 900. The dataset contains a large number of rotated ships with large aspect ratios. All objects are annotated with oriented bounding boxes. The total dataset is divided into training set, validation set, and test set, including 436, 181, and 444 images, respectively.
We conducted ablation study and main experiments on the HRSC2016 dataset. The images are resized to 384 × 384 and 768 × 768 for training and testing. We use Adam optimizer for training, and the learning rate is set to . We trained the model for 25,000 iterations on RTX 2080Ti GPU with the batch size set to 8.
4.1.2. UCAS-AOD
UCAS-AOD [48] is an aerial plane and car dataset detection dataset. It contains 1510 images, including 1000 images for planes and 510 images for cars. The objects are annotated with both oriented bounding boxes and horizontal bounding boxes. Since there is no official division of the dataset, we randomly divide the total dataset into training set, validation set, and test set with the ratios of 5:2:3.
The images are resized to 768 × 768. We use Adam optimizer for training, and the learning rate is set to . We trained the model for 20,000 iterations on RTX 2080Ti GPU with the batch size set to 8.
4.1.3. DOTA
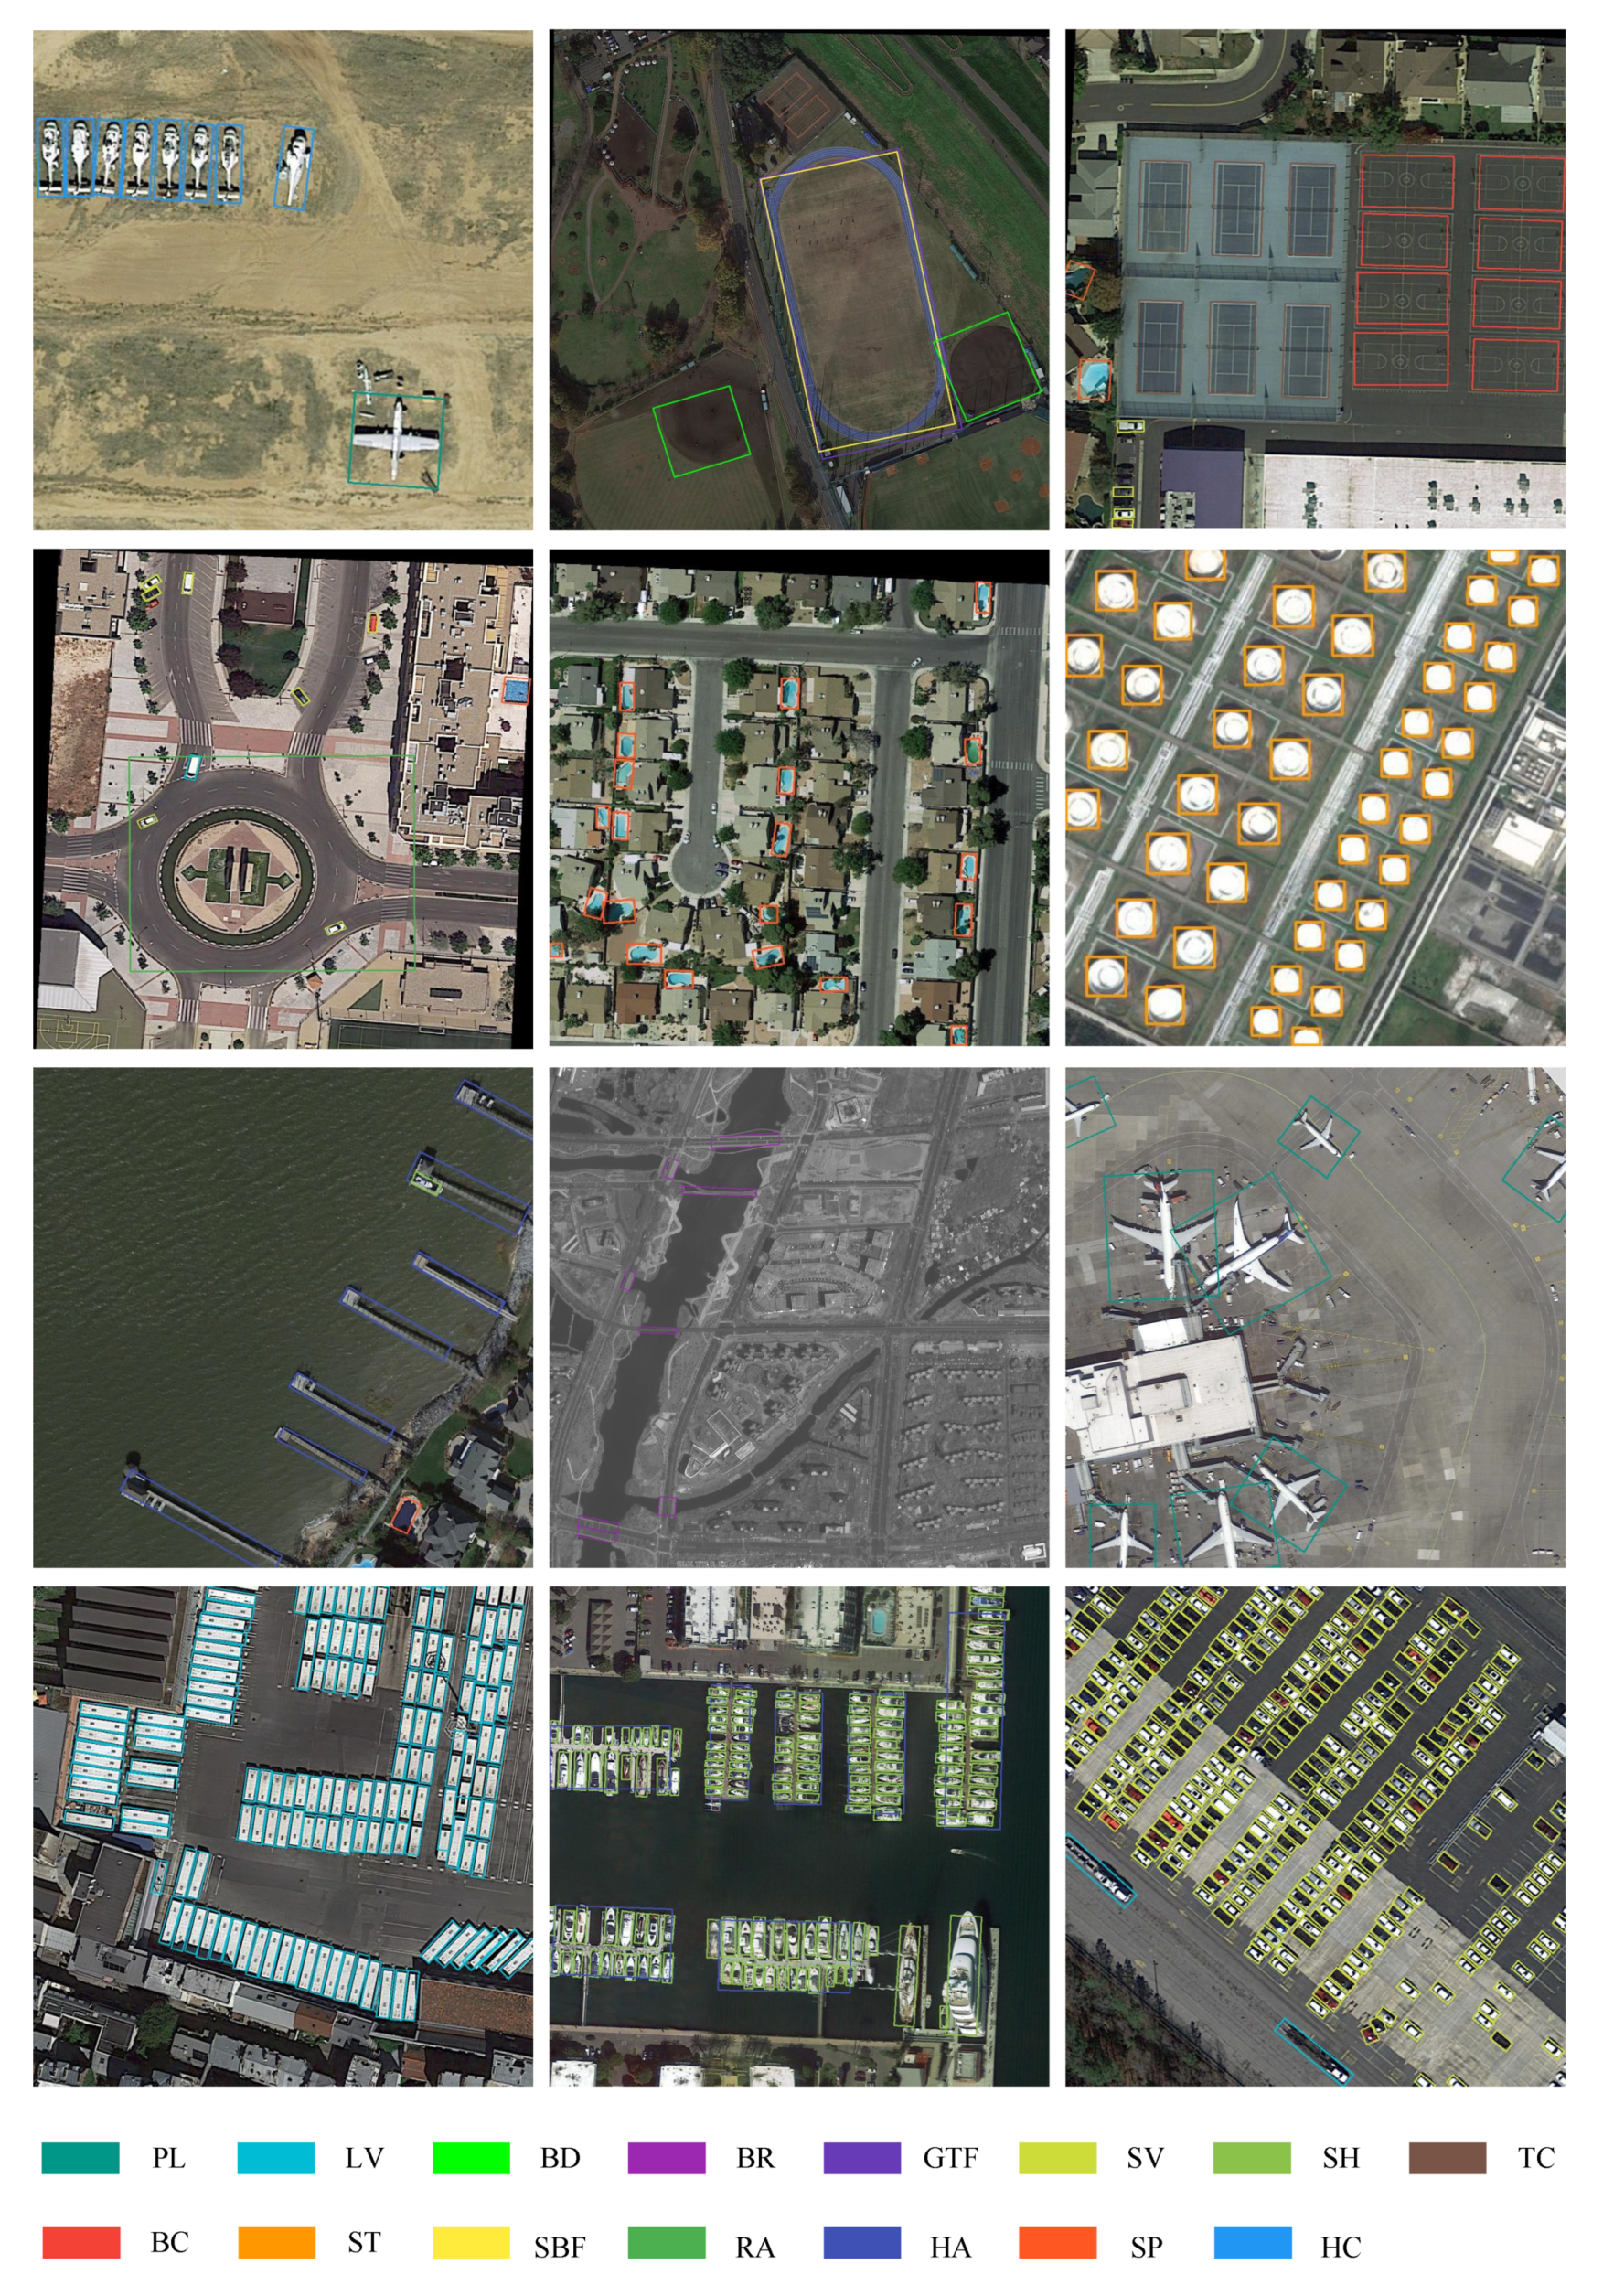
DOTA [22] is the largest public dataset for oriented object detection in aerial images. The images in DOTA are of the size in the range from 800 × 800 to 20,000 × 20,000 pixels and contains objects with a wide variety of scales, orientations, and shapes. It includes 2806 aerial images with 188,282 annotated instances. There are 15 categories in total, including plane (PL), baseball diamond (BD), bridge (BR), ground track field (GTF), small vehicle (SV), large vehicle (LV), ship (SH), tennis court (TC), basketball court (BC), storage tank (ST), soccer ball field (SBF), roundabout (RA), harbor (HA), swimming pool (SP), and helicopter (HC). The total dataset is divided into training set, validation set, and testing set with the proportions of 1/2, 1/6, and 1/3, respectively.
Note that images in DOTA are too large, we crop the original images into 768 × 768 patches with the stride 200 for training and testing. Adam optimizer is used for training, and the learning rate is set to . We trained the model on RTX 2080Ti GPU for 500,000 iterations with the batch size set to 8.
4.2. Ablation Study
4.2.1. Evaluation of the Proposed Modules
We conducted experiments on the HRSC2016 dataset to prove the effectiveness of the proposed modules. We used the RetinaNet with ResNet50 as the baseline model. The images are resized to 384 × 384, and no data augmentation is adopted. The experimental results are shown in Table 1.
The proposed SLA strategy significantly improves the high-precision detection performance, achieving an increase of 7.49% in AP. It indicates that the dense samples are harmful for high-quality detection performance and the sparse training samples can achieve better performance via SLA. The PS-FPN extracts position-sensitive features for precise localization. It extracts the boundary features of the object by CAM, thus improving the detection performance. As a result, PS-FPN improves AP and AP by 0.65% and 3.28%, respectively. Our model further improves the AP by 4.04% when trained with the novel D-RIoU loss. It proves that the D-RIoU guidance contributes to high-precision detections compared with smooth-L loss. D-RIoU loss achieves the consistency between the training loss and the evaluation performance through the rotated IoU. Besides, it additionally considers the importance of the center point for high-performance oriented object detection in the aerial images.
4.2.2. Evaluation of Sparse Label Assignment
We conducted experiments to evaluate the effect of sparse label assignment, and the results are shown in Table 2. The best performance is obtained with P-NMS and sampling ratio of 1:2:100, which achieves the AP of 86.08% and AP of 55.60%. It can be found that the representative sampling of negatives and the suppression of positives can effectively improve the high-precision detection performance represented by AP. However, unsuitable hyperparameters may lead to a slight decrease in the recall, resulting in a decrease in AP. For example, the model that does not consider the hard samples (ID1–ID5) achieve the higher AP than baseline, but their AP are slightly lower.
The performance comparison of ID13 (85.72%) and ID15 (86.08%) shows that posterior NMS (adaptive threshold is obtained by Equation (1)) can avoid the instability in the early training stage and optimize high-quality detection. NMS with a fixed posterior threshold may lead to the neglect of high-quality positives and reduce the recall (such as 85.09% for ID12).
For the representative sampling of negatives, the IoU interval division and sampling ratio are both important. Training with hard samples helps to improve the robustness of the classification network and avoids giving high confidence to low-quality detections. It can be seen from Table 2 that the model not trained with hard samples (ID1-ID5) have lower detection performance than the model that used (ID6-ID15). Besides, the model can achieve better performance when the sampling ratio is 1:2:100, since this ratio is more consistent with the real IoU distribution of the anchors.
4.2.3. Evaluation of Position-Sensitive Feature Pyramid Network
The ablation study on PS-FPN is shown in Table 3. PS-FPN can further improve the detection performance based on SLA. The best performance of the compared parameters reaches 86.73% on HRSC2016 dataset with the channel compression ratio . Note that if the feature maps of different levels adopt the CAM that uses the shared parameters, the performance drops by 0.32%. Position coding is sensitive to the scale of objects, and thus parameter-independent CAM can better adapt to the features of different scales, thereby achieving more accurate coordinate coding.
4.2.4. Evaluation of Distance Rotated IoU
We compared the performance of different RIoU-based loss functions, and the results are shown in Table 4. The baseline model is RetinaNet trained with smooth-L loss, and the images are resized into 768 × 768 here. RIoU (linear) and RIoU (log) are as follows:
It can be seen that most RIoU-based loss can improve high-quality detection performance compared with smooth-L. For example, AP of RIoU(log) is 2.76% higher than that of smooth-L. However, G-RIoU does not perform well in oriented object detection. AP of G-RIoU is even lower than smooth-L by 3.64%. We conclude that it is caused by the following two problems: 1. When assigning positive labels for training, we ensure that each object is assigned at least one anchor with the largest IoU. Therefore, anchors with no intersection with the objects will not be used for regression at all, and thus G-RIoU loss is similar to RIoU loss (linear); 2. The intersection between two rotated rectangles is very sensitive to the angles and aspect ratios, and thus the smallest enclosing rectangle is difficult to converge during the training process. The model trained with our D-RIoU loss achieves the AP of 87.92% and AP of 59.15%, which outperform the mainstream smooth-L loss by 1.53% and 4.27%, respectively. It is also superior to other RIoU-based losses, which proved that the supervision of center distance is beneficial to oriented object detection.
We visualized some detection results from the models trained with different loss functions on DOTA as shown in Figure 7. The tiny position deviation will result in a worse localization result for small objects compared to large objects, but the smooth-L loss will treat them equally, leading to poor detection performance for small object detection. As shown in the first row of Figure 7, the model trained with smooth-L loss for regression suffers from missed detections and inaccurate localization when detecting densely arranged objects. In contrast, D-RIoU loss uses rotated IoU to normalize the regression loss of objects of different scales, so the performance of small target detection is excellent (see the second and third columns of the second row in Figure 7). Moreover, the D-RIoU loss also imposes additional center point supervision, which is conducive to the regression of objects with large aspect ratios (see the second row and the first column of Figure 7).
4.3. Main Results
4.3.1. Results on HRSC2016
Table 5 shows the performance comparison of different methods on the HRSC2016 dataset. Our method outperforms other compared methods, achieving the mAP of 89.51%. Even with a smaller input size of 384 × 384 and a lightweight ResNet-50 as the backbone, our model can still achieve the mAP of 87.14%.
We also compare high-quality detection performance as shown in Table 6. Due to the sparse label assignment method effectively alleviates the performance degradation caused by redundant training samples, our method performs well on high-precision detection. The proposed model achieves the highest AP of 68.12% among the compared single-stage detectors, which proves the superiority of our method.
We further visualized some detection results, as shown in the Figure 8. Our model can accurately detect the remote sensing ship in complex scenes in the images. Even for densely arranged long narrow ships that are difficult to detect, our method still performs well and outputs high-quality detection results. (see the third row in Figure 8).
4.3.2. Results on UCAS-AOD
Table 7 shows the experimental results on UCAS-AOD dataset. Our method achieves the best performance among the compared methods, reaching the mAP of 89.44%. Our method outperforms the advanced two stage detector RoI transformer [50] by 0.49%. RIDet [34] is also a recent high-quality oriented detector with anchor refinement module. It can be seen that we have achieved better performance compared with the proposal refinement approach (such as RoI transformer and RIDet here), which proves the superiority of our method.
We visualized some of the detection results, as shown in the Figure 9. Sparse label assignment is suitable for oriented object detection due to there is generally no large overlap between objects in aerial images. It can be seen that our method outputs high-quality detections even for densely arranged small objects (such as small vehicles and planes in Figure 9).
4.3.3. Results on DOTA
We conduct performance comparisons with some advanced algorithms on the DOTA dataset, and the results are shown in Table 8. Our method achieves the mAP of 76.36%, which is the highest among the compared models. Our baseline model is the one-stage detector RetinaNet, but it achieves better performance than some advanced two-stage methods after adopting the proposed modules.
The visualization of some detections is shown in Figure 10. It can be seen that the objects in the DOTA dataset have large variation in scales, and there are many scenes where the objects are densely arranged. Our model does not suffer from duplicate detections of large objects, and achieves accurate detection (see soccer ball field in the first row and second column, and roundabout in the second row and first column in Figure 10). It can be attributed to the SLA that alleviates the inconsistency between classification and regression and helps suppress redundant detections. Moreover, densely arranged small objects in aerial images are also difficult to detect, such as small vehicles and small ships. Owing to the localization features extracted by PS-FPN and the efficient supervision of D-RIoU loss, our method achieves superior detection performance for dense object detection. As shown in the last row of Figure 10, our model accurately detects dense small objects in aerial images, with almost no missed detections.
5. Conclusions
In this paper, we analyzed the drawbacks of the current dense label assignment strategy of object detection in aerial images and proposed a sparse label assignment strategy (SLA). SLA uses the posterior IoU of the detections to perform posterior non-maximum suppression (P-NMS), to select sparse and high-quality anchors for training. In this way, the inconsistency between the classification and regression is alleviated, and the imbalance of the training samples is resolved. In order to further improve the detection performance of densely arranged small objects in aerial images, we propose a position-sensitive feature pyramid network (PS-FPN). PS-FPN uses the coordinate attention module to extract position-sensitive features via direction-specific pooling for accurate localization. Finally, the distance rotated IoU loss function (D-RIoU) is proposed for training to normalize the loss contribution of objects with different scales. In addition, the additional center point constraint in D-RIoU loss is beneficial to achieve accurate detection for objects with large aspect ratios. Extensive ablation experiments on aerial image datasets have confirmed the superiority of our method. We achieved the mAP of 76.36% on DOTA dataset, 89.51% on HRSC2016 dataset and 89.43% on UCAS-AOD dataset based on the simple RetinaNet, which are superior to many advanced rotation detectors. In the future, we will further study the optimization process of anchor during regression to explore the distribution of high-quality anchors, which helps to achieve better bounding box regression for high detection performance.
Author Contributions
Conceptualization, Q.M.; methodology, Q.M.; software, Q.M.; validation, Q.M., L.M. and Z.Z.; formal analysis, Q.M. and X.Y.; investigation, J.S. and X.Y.; resources, L.M. and Z.Z.; data curation, Q.M., L.M. and Z.Z.; writing—original draft preparation, Q.M.; writing—review and editing, Q.M.; visualization, Q.M. and J.S.; supervision, L.M. and Z.Z.; project administration, Q.M. All authors have read and agreed to the published version of the manuscript.
Funding
This research received no external funding.
Data Availability Statement
The source code of the paper is available at https://github.com/ming71/SLA, accessed on 3 July 2021.
Conflicts of Interest
The authors declare no conflict of interest.
References
- Ren, S.; He, K.; Girshick, R.; Sun, J. Faster r-cnn: Towards real-time object detection with region proposal networks. IEEE Trans. Pattern Anal. Mach. Intell. 2016, 39, 1137–1149. [Google Scholar] [CrossRef] [Green Version]
- Dai, J.; Li, Y.; He, K.; Sun, J. R-fcn: Object detection via region-based fully convolutional networks. arXiv 2016, arXiv:1605.06409. [Google Scholar]
- Redmon, J.; Divvala, S.; Girshick, R.; Farhadi, A. You only look once: Unified, real-time object detection. In Proceedings of the IEEE Conference on Computer Vision and Pattern Recognition, Las Vegas, NV, USA, 27–30 June 2016; pp. 779–788. [Google Scholar]
- Girshick, R. Fast r-cnn. In Proceedings of the IEEE International Conference on Computer Vision, Santiago, Chile, 7–13 December 2015; pp. 1440–1448. [Google Scholar]
- Redmon, J.; Farhadi, A. YOLO9000: Better, faster, stronger. In Proceedings of the IEEE Conference on Computer Vision and Pattern Recognition, Honolulu, HI, USA, 21–26 July 2017; pp. 7263–7271. [Google Scholar]
- Redmon, J.; Farhadi, A. Yolov3: An incremental improvement. arXiv 2018, arXiv:1804.02767. [Google Scholar]
- Liu, W.; Anguelov, D.; Erhan, D.; Szegedy, C.; Reed, S.; Fu, C.Y.; Berg, A.C. Ssd: Single shot multibox detector. In Proceedings of the European Conference on Computer Vision, Amsterdam, The Netherlands, 11–14 October 2016; Springer: Berlin/Heidelberg, Germany, 2016; pp. 21–37. [Google Scholar]
- Chen, C.; Zhong, J.; Tan, Y. Multiple-oriented and small object detection with convolutional neural networks for aerial image. Remote Sens. 2019, 11, 2176. [Google Scholar] [CrossRef] [Green Version]
- Qian, X.; Lin, S.; Cheng, G.; Yao, X.; Ren, H.; Wang, W. Object Detection in Remote Sensing Images Based on Improved Bounding Box Regression and Multi-Level Features Fusion. Remote Sens. 2020, 12, 143. [Google Scholar] [CrossRef] [Green Version]
- Zhong, B.; Ao, K. Single-Stage Rotation-Decoupled Detector for Oriented Object. Remote Sens. 2020, 12, 3262. [Google Scholar] [CrossRef]
- Yang, X.; Li, X.; Ye, Y.; Lau, R.Y.; Zhang, X.; Huang, X. Road detection and centerline extraction via deep recurrent convolutional neural network U-Net. IEEE Trans. Geosci. Remote Sens. 2019, 57, 7209–7220. [Google Scholar] [CrossRef]
- Zhang, X.; Wang, G.; Zhu, P.; Zhang, T.; Li, C.; Jiao, L. GRS-Det: An Anchor-Free Rotation Ship Detector Based on Gaussian-Mask in Remote Sensing Images. IEEE Trans. Geosci. Remot. Sens. 2020, 59, 3518–3531. [Google Scholar] [CrossRef]
- Zhang, Z.; Guo, W.; Zhu, S.; Yu, W. Toward arbitrary-oriented ship detection with rotated region proposal and discrimination networks. IEEE Geosci. Remote Sens. Lett. 2018, 15, 1745–1749. [Google Scholar] [CrossRef]
- Deng, Z.; Sun, H.; Zhou, S.; Zhao, J.; Lei, L.; Zou, H. Multi-scale object detection in remote sensing imagery with convolutional neural networks. ISPRS J. Photogramm. Remote Sens. 2018, 145, 3–22. [Google Scholar] [CrossRef]
- Li, L.; Zhou, Z.; Wang, B.; Miao, L.; Zong, H. A Novel CNN-Based Method for Accurate Ship Detection in HR Optical Remote Sensing Images via Rotated Bounding Box. IEEE Trans. Geosci. Remote Sens. 2020, 59, 686–699. [Google Scholar] [CrossRef]
- Lin, T.Y.; Goyal, P.; Girshick, R.; He, K.; Dollár, P. Focal loss for dense object detection. In Proceedings of the IEEE International Conference on Computer Vision, Venice, Italy, 22–29 October 2017; pp. 2980–2988. [Google Scholar]
- Jiang, B.; Luo, R.; Mao, J.; Xiao, T.; Jiang, Y. Acquisition of localization confidence for accurate object detection. In Proceedings of the European Conference on Computer Vision (ECCV), Munich, Germany, 8–14 September 2018; pp. 784–799. [Google Scholar]
- He, Y.; Zhu, C.; Wang, J.; Savvides, M.; Zhang, X. Bounding box regression with uncertainty for accurate object detection. In Proceedings of the IEEE Conference on Computer Vision and Pattern Recognition, Long Beach, CA, USA, 15–19 June 2019; pp. 2888–2897. [Google Scholar]
- Choi, J.; Chun, D.; Kim, H.; Lee, H.J. Gaussian yolov3: An accurate and fast object detector using localization uncertainty for autonomous driving. In Proceedings of the 2019 IEEE/CVF International Conference on Computer Vision (ICCV), Seoul, Korea, 27 October–2 November 2019; pp. 502–511. [Google Scholar]
- Ming, Q.; Zhou, Z.; Miao, L.; Zhang, H.; Li, L. Dynamic Anchor Learning for Arbitrary-Oriented Object Detection. In Proceedings of the AAAI Conference on Artificial Intelligence, Palo Alto, CA, USA, 2–9 February 2021. [Google Scholar]
- Liu, Z.; Yuan, L.; Weng, L.; Yang, Y. A high resolution optical satellite image dataset for ship recognition and some new baselines. In Proceedings of the International Conference on Pattern Recognition Applications and Methods, Porto, Portugal, 24–26 February 2017; Volume 2, pp. 324–331. [Google Scholar]
- Xia, G.S.; Bai, X.; Ding, J.; Zhu, Z.; Belongie, S.; Luo, J.; Datcu, M.; Pelillo, M.; Zhang, L. DOTA: A large-scale dataset for object detection in aerial images. In Proceedings of the IEEE Conference on Computer Vision and Pattern Recognition, Salt Lake City, UT, USA, 18–23 June 2018; pp. 3974–3983. [Google Scholar]
- Li, B.; Liu, Y.; Wang, X. Gradient harmonized single-stage detector. In Proceedings of the AAAI Conference on Artificial Intelligence, Honolulu, HI, USA, 27 January–1 February 2019; Volume 33, pp. 8577–8584. [Google Scholar]
- Pang, J.; Chen, K.; Shi, J.; Feng, H.; Ouyang, W.; Lin, D. Libra r-cnn: Towards balanced learning for object detection. In Proceedings of the IEEE/CVF Conference on Computer Vision and Pattern Recognition, Long Beach, CA, USA, 15–20 June 2019; pp. 821–830. [Google Scholar]
- Yang, X.; Sun, H.; Fu, K.; Yang, J.; Sun, X.; Yan, M.; Guo, Z. Automatic ship detection in remote sensing images from google earth of complex scenes based on multiscale rotation dense feature pyramid networks. Remote Sens. 2018, 10, 132. [Google Scholar] [CrossRef] [Green Version]
- Feng, Y.; Diao, W.; Sun, X.; Yan, M.; Gao, X. Towards automated ship detection and category recognition from high-resolution aerial images. Remote Sens. 2019, 11, 1901. [Google Scholar] [CrossRef] [Green Version]
- Zhang, G.; Lu, S.; Zhang, W. CAD-Net: A context-aware detection network for objects in remote sensing imagery. IEEE Trans. Geosci. Remote Sens. 2019, 57, 10015–10024. [Google Scholar] [CrossRef] [Green Version]
- Wang, P.; Sun, X.; Diao, W.; Fu, K. FMSSD: Feature-merged single-shot detection for multiscale objects in large-scale remote sensing imagery. IEEE Trans. Geosci. Remote Sens. 2019, 58, 3377–3390. [Google Scholar] [CrossRef]
- Ming, Q.; Miao, L.; Zhou, Z.; Dong, Y. CFC-Net: A Critical Feature Capturing Network for Arbitrary-Oriented Object Detection in Remote Sensing Images. arXiv 2021, arXiv:2101.06849. [Google Scholar]
- Fu, K.; Chang, Z.; Zhang, Y.; Xu, G.; Zhang, K.; Sun, X. Rotation-aware and multi-scale convolutional neural network for object detection in remote sensing images. ISPRS J. Photogramm. Remote Sens. 2020, 161, 294–308. [Google Scholar] [CrossRef]
- Yang, X.; Yan, J. Arbitrary-Oriented Object Detection with Circular Smooth Label. arXiv 2020, arXiv:2003.05597. [Google Scholar]
- Yang, X.; Hou, L.; Zhou, Y.; Wang, W.; Yan, J. Dense Label Encoding for Boundary Discontinuity Free Rotation Detection. arXiv 2020, arXiv:2011.09670. [Google Scholar]
- Qian, W.; Yang, X.; Peng, S.; Guo, Y.; Yan, J. Learning modulated loss for rotated object detection. arXiv 2019, arXiv:1911.08299. [Google Scholar]
- Ming, Q.; Zhou, Z.; Miao, L.; Yang, X.; Dong, Y. Optimization for Oriented Object Detection via Representation Invariance Loss. arXiv 2021, arXiv:2103.11636. [Google Scholar]
- Yang, X.; Yan, J.; Ming, Q.; Wang, W.; Zhang, X.; Tian, Q. Rethinking Rotated Object Detection with Gaussian Wasserstein Distance Loss. arXiv 2021, arXiv:2101.11952. [Google Scholar]
- Zhu, Y.; Du, J.; Wu, X. Adaptive period embedding for representing oriented objects in aerial images. IEEE Trans. Geosci. Remote Sens. 2020, 58, 7247–7257. [Google Scholar] [CrossRef] [Green Version]
- Zhang, X.; Wan, F.; Liu, C.; Ji, R.; Ye, Q. Freeanchor: Learning to match anchors for visual object detection. arXiv 2019, arXiv:1909.02466. pp. 147–155. [Google Scholar]
- Zhang, S.; Chi, C.; Yao, Y.; Lei, Z.; Li, S.Z. Bridging the gap between anchor-based and anchor-free detection via adaptive training sample selection. In Proceedings of the IEEE/CVF Conference on Computer Vision and Pattern Recognition, Seattle, WA, USA, 13–19 June 2020; pp. 9759–9768. [Google Scholar]
- Cao, Y.; Chen, K.; Loy, C.C.; Lin, D. Prime sample attention in object detection. In Proceedings of the IEEE/CVF Conference on Computer Vision and Pattern Recognition, Seattle, WA, USA, 13–19 June 2020; pp. 11583–11591. [Google Scholar]
- Xiao, Z.; Wang, K.; Wan, Q.; Tan, X.; Xu, C.; Xia, F. A2S-Det: Efficiency Anchor Matching in Aerial Image Oriented Object Detection. Remote Sens. 2021, 13, 73. [Google Scholar] [CrossRef]
- Ke, W.; Zhang, T.; Huang, Z.; Ye, Q.; Liu, J.; Huang, D. Multiple anchor learning for visual object detection. In Proceedings of the IEEE/CVF Conference on Computer Vision and Pattern Recognition, Seattle, WA, USA, 13–19 June 2020; pp. 10206–10215. [Google Scholar]
- Zhang, X.; Wan, F.; Liu, C.; Ji, X.; Ye, Q. Learning to match anchors for visual object detection. IEEE Trans. Pattern Anal. Mach. Intell. 2021. [Google Scholar] [CrossRef]
- Hou, Q.; Zhou, D.; Feng, J. Coordinate attention for efficient mobile network design. arXiv 2021, arXiv:2103.02907. [Google Scholar]
- Hu, J.; Shen, L.; Sun, G. Squeeze-and-excitation networks. In Proceedings of the IEEE Conference on Computer Vision and Pattern Recognition, Salt Lake City, UT, USA, 18–23 June 2018; pp. 7132–7141. [Google Scholar]
- Woo, S.; Park, J.; Lee, J.Y.; Kweon, I.S. Cbam: Convolutional block attention module. In Proceedings of the European Conference on Computer Vision (ECCV), Munich, Germany, 8–14 September 2018; pp. 3–19. [Google Scholar]
- Rezatofighi, H.; Tsoi, N.; Gwak, J.; Sadeghian, A.; Reid, I.; Savarese, S. Generalized intersection over union: A metric and a loss for bounding box regression. In Proceedings of the IEEE/CVF Conference on Computer Vision and Pattern Recognition, Long Beach, CA, USA, 15–20 June 2019; pp. 658–666. [Google Scholar]
- Zheng, Z.; Wang, P.; Liu, W.; Li, J.; Ye, R.; Ren, D. Distance-IoU loss: Faster and better learning for bounding box regression. In Proceedings of the AAAI Conference on Artificial Intelligence, New York, NY, USA, 7–12 February 2020; Volume 34, pp. 12993–13000. [Google Scholar]
- Zhu, H.; Chen, X.; Dai, W.; Fu, K.; Ye, Q.; Jiao, J. Orientation robust object detection in aerial images using deep convolutional neural network. In Proceedings of the 2015 IEEE International Conference on Image Processing (ICIP), Quebec City, QC, Canada, 27–30 September 2015; pp. 3735–3739. [Google Scholar]
- Ma, J.; Shao, W.; Ye, H.; Wang, L.; Wang, H.; Zheng, Y.; Xue, X. Arbitrary-oriented scene text detection via rotation proposals. IEEE Trans. Multimed. 2018, 20, 3111–3122. [Google Scholar] [CrossRef] [Green Version]
- Ding, J.; Xue, N.; Long, Y.; Xia, G.S.; Lu, Q. Learning RoI transformer for oriented object detection in aerial images. In Proceedings of the IEEE Conference on Computer Vision and Pattern Recognition, Long Beach, CA, USA, 15–20 June 2019; pp. 2849–2858. [Google Scholar]
- Xu, Y.; Fu, M.; Wang, Q.; Wang, Y.; Chen, K.; Xia, G.S.; Bai, X. Gliding vertex on the horizontal bounding box for multi-oriented object detection. IEEE Trans. Pattern Anal. Mach. Intell. 2020, 43, 1452–1459. [Google Scholar] [CrossRef] [Green Version]
- Song, Q.; Yang, F.; Yang, L.; Liu, C.; Hu, M.; Xia, L. Learning Point-guided Localization for Detection in Remote Sensing Images. IEEE J. Sel. Top. Appl. Earth Obs. Remote. Sens. 2020, 14, 1084–1094. [Google Scholar] [CrossRef]
- Liao, M.; Zhu, Z.; Shi, B.; Xia, G.s.; Bai, X. Rotation-sensitive regression for oriented scene text detection. In Proceedings of the IEEE Conference on Computer Vision and Pattern Recognition, Salt Lake City, UT, USA, 18–23 June 2018; pp. 5909–5918. [Google Scholar]
- Yi, J.; Wu, P.; Liu, B.; Huang, Q.; Qu, H.; Metaxas, D. Oriented object detection in aerial images with box boundary-aware vectors. In Proceedings of the IEEE/CVF Winter Conference on Applications of Computer Vision, Waikoloa, HI, USA, 3–8 January 2021; pp. 2150–2159. [Google Scholar]
- Yang, X.; Liu, Q.; Yan, J.; Li, A.; Zhang, Z.; Yu, G. R3det: Refined Single-Stage Detector with Feature Refinement for Rotating Object. arXiv 2019, arXiv:1908.05612. [Google Scholar]
- Yang, X.; Yang, J.; Yan, J.; Zhang, Y.; Zhang, T.; Guo, Z.; Sun, X.; Fu, K. Scrdet: Towards more robust detection for small, cluttered and rotated objects. In Proceedings of the IEEE International Conference on Computer Vision, Seoul, Korea, 27 October–2 November 2019; pp. 8232–8241. [Google Scholar]
- Wei, H.; Zhang, Y.; Chang, Z.; Li, H.; Wang, H.; Sun, X. Oriented objects as pairs of middle lines. ISPRS J. Photogramm. Remote Sens. 2020, 169, 268–279. [Google Scholar] [CrossRef]
- Pan, X.; Ren, Y.; Sheng, K.; Dong, W.; Yuan, H.; Guo, X.; Ma, C.; Xu, C. Dynamic Refinement Network for Oriented and Densely Packed Object Detection. In Proceedings of the IEEE/CVF Conference on Computer Vision and Pattern Recognition, Seattle, WA, USA, 13–19 June 2020; pp. 11207–11216. [Google Scholar]
Figure 1.
Visualization of the duplicate detections and missed detections in aerial images.
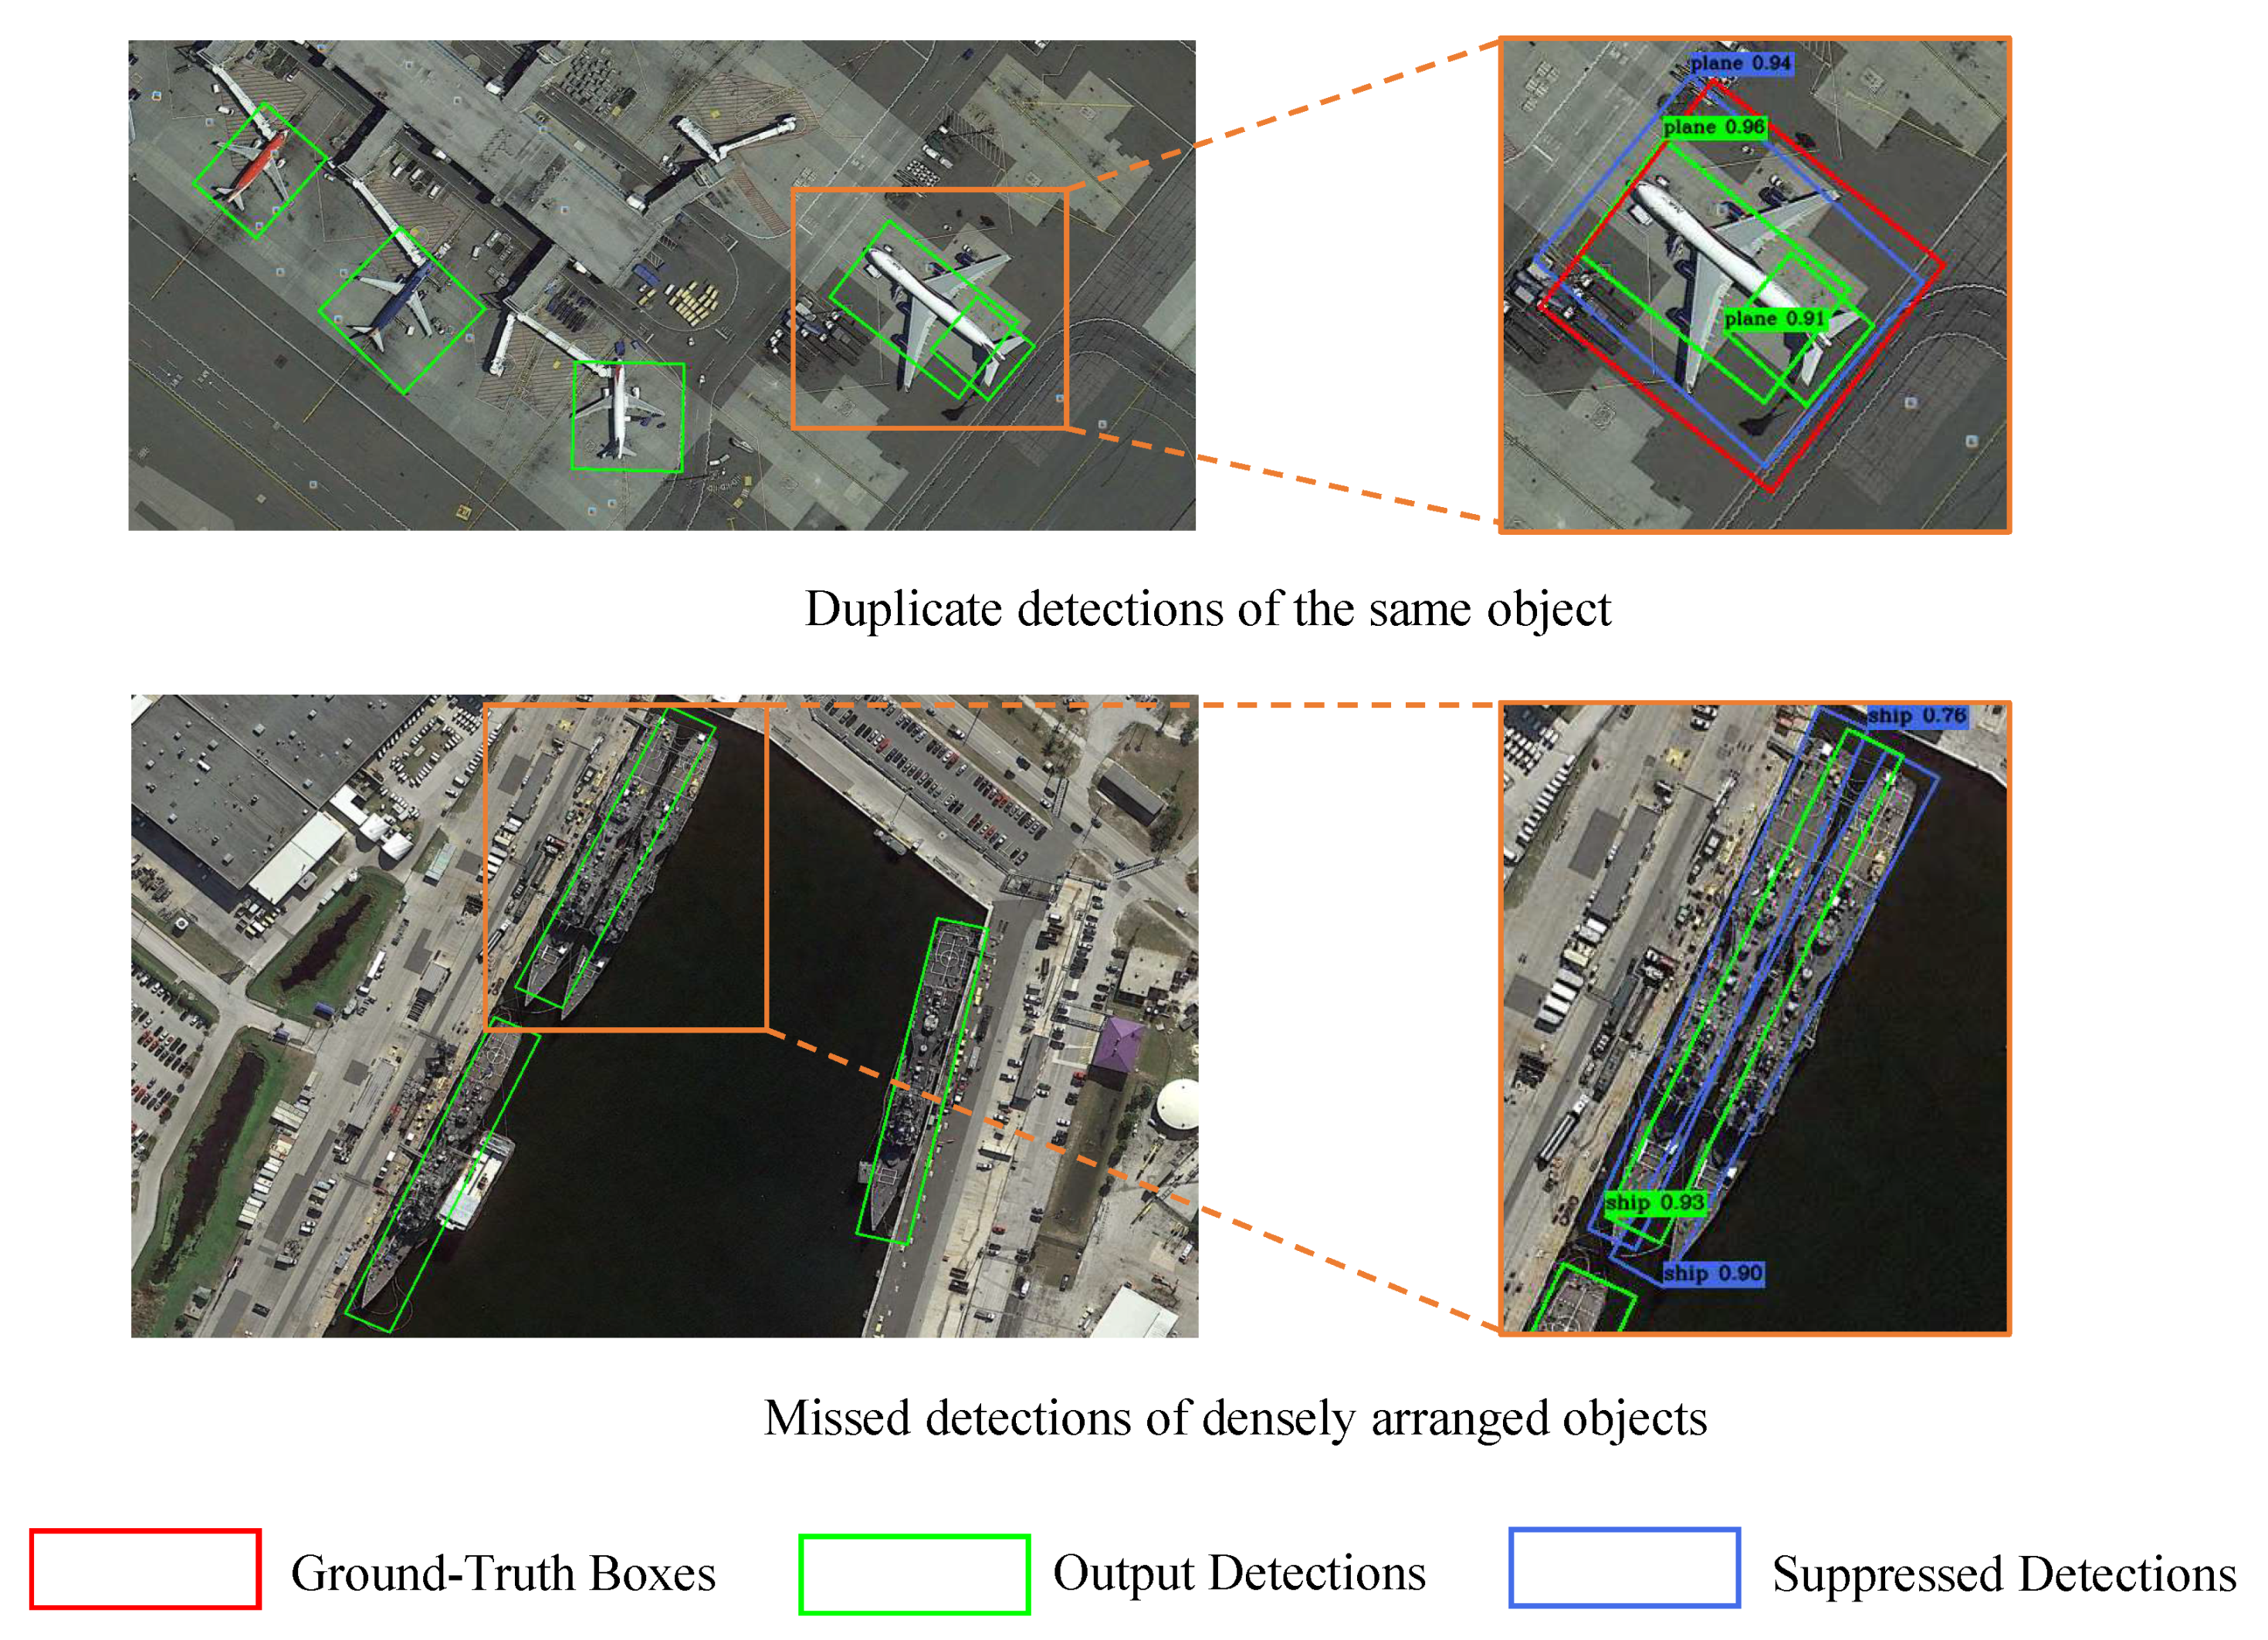
Figure 2.
The overall framework of our model.

Figure 3.
Display of the different label assignment strategy, including (a) dense label assignment (DLA) and (b) sparse label assignment (SLA). SLA alleviates the false detections caused by misaligned classification and regression by performing posterior NMS on the posterior predictions.
Figure 3.
Display of the different label assignment strategy, including (a) dense label assignment (DLA) and (b) sparse label assignment (SLA). SLA alleviates the false detections caused by misaligned classification and regression by performing posterior NMS on the posterior predictions.
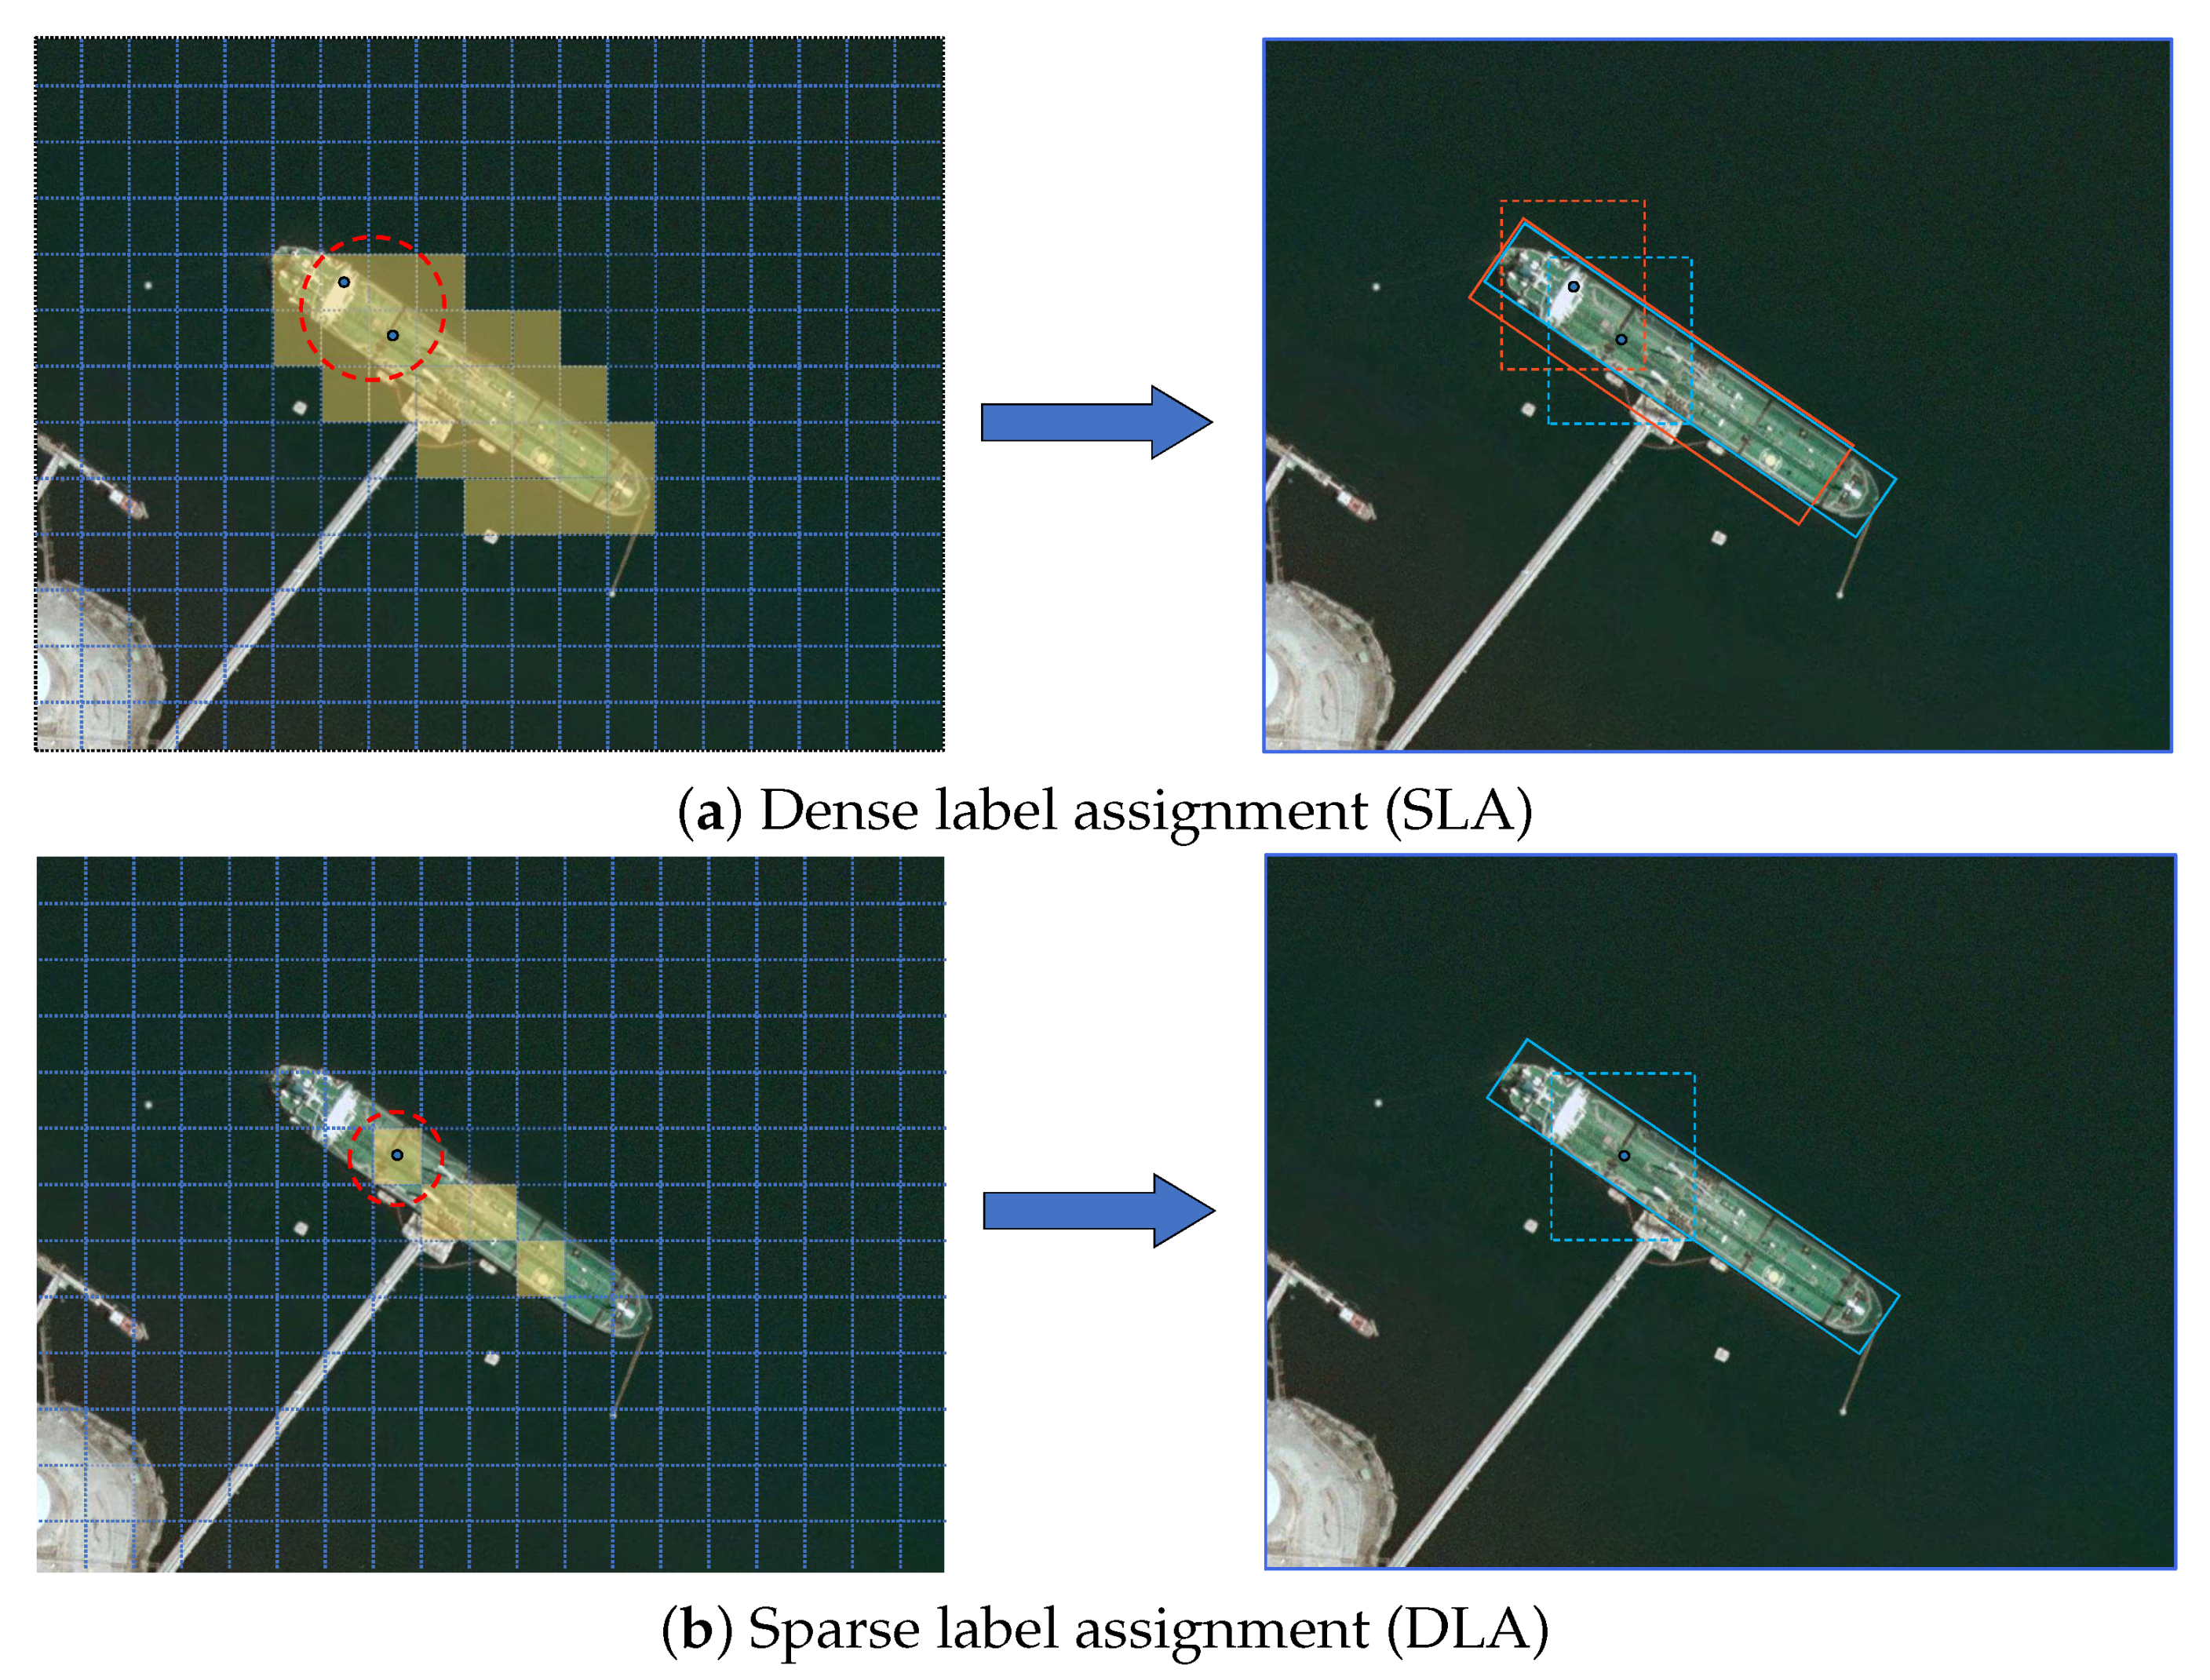
Figure 4.
Structures of different attention mechanisms. X-GAP and Y-GAP are mean pooling in the x and y directions, respectively.
Figure 4.
Structures of different attention mechanisms. X-GAP and Y-GAP are mean pooling in the x and y directions, respectively.
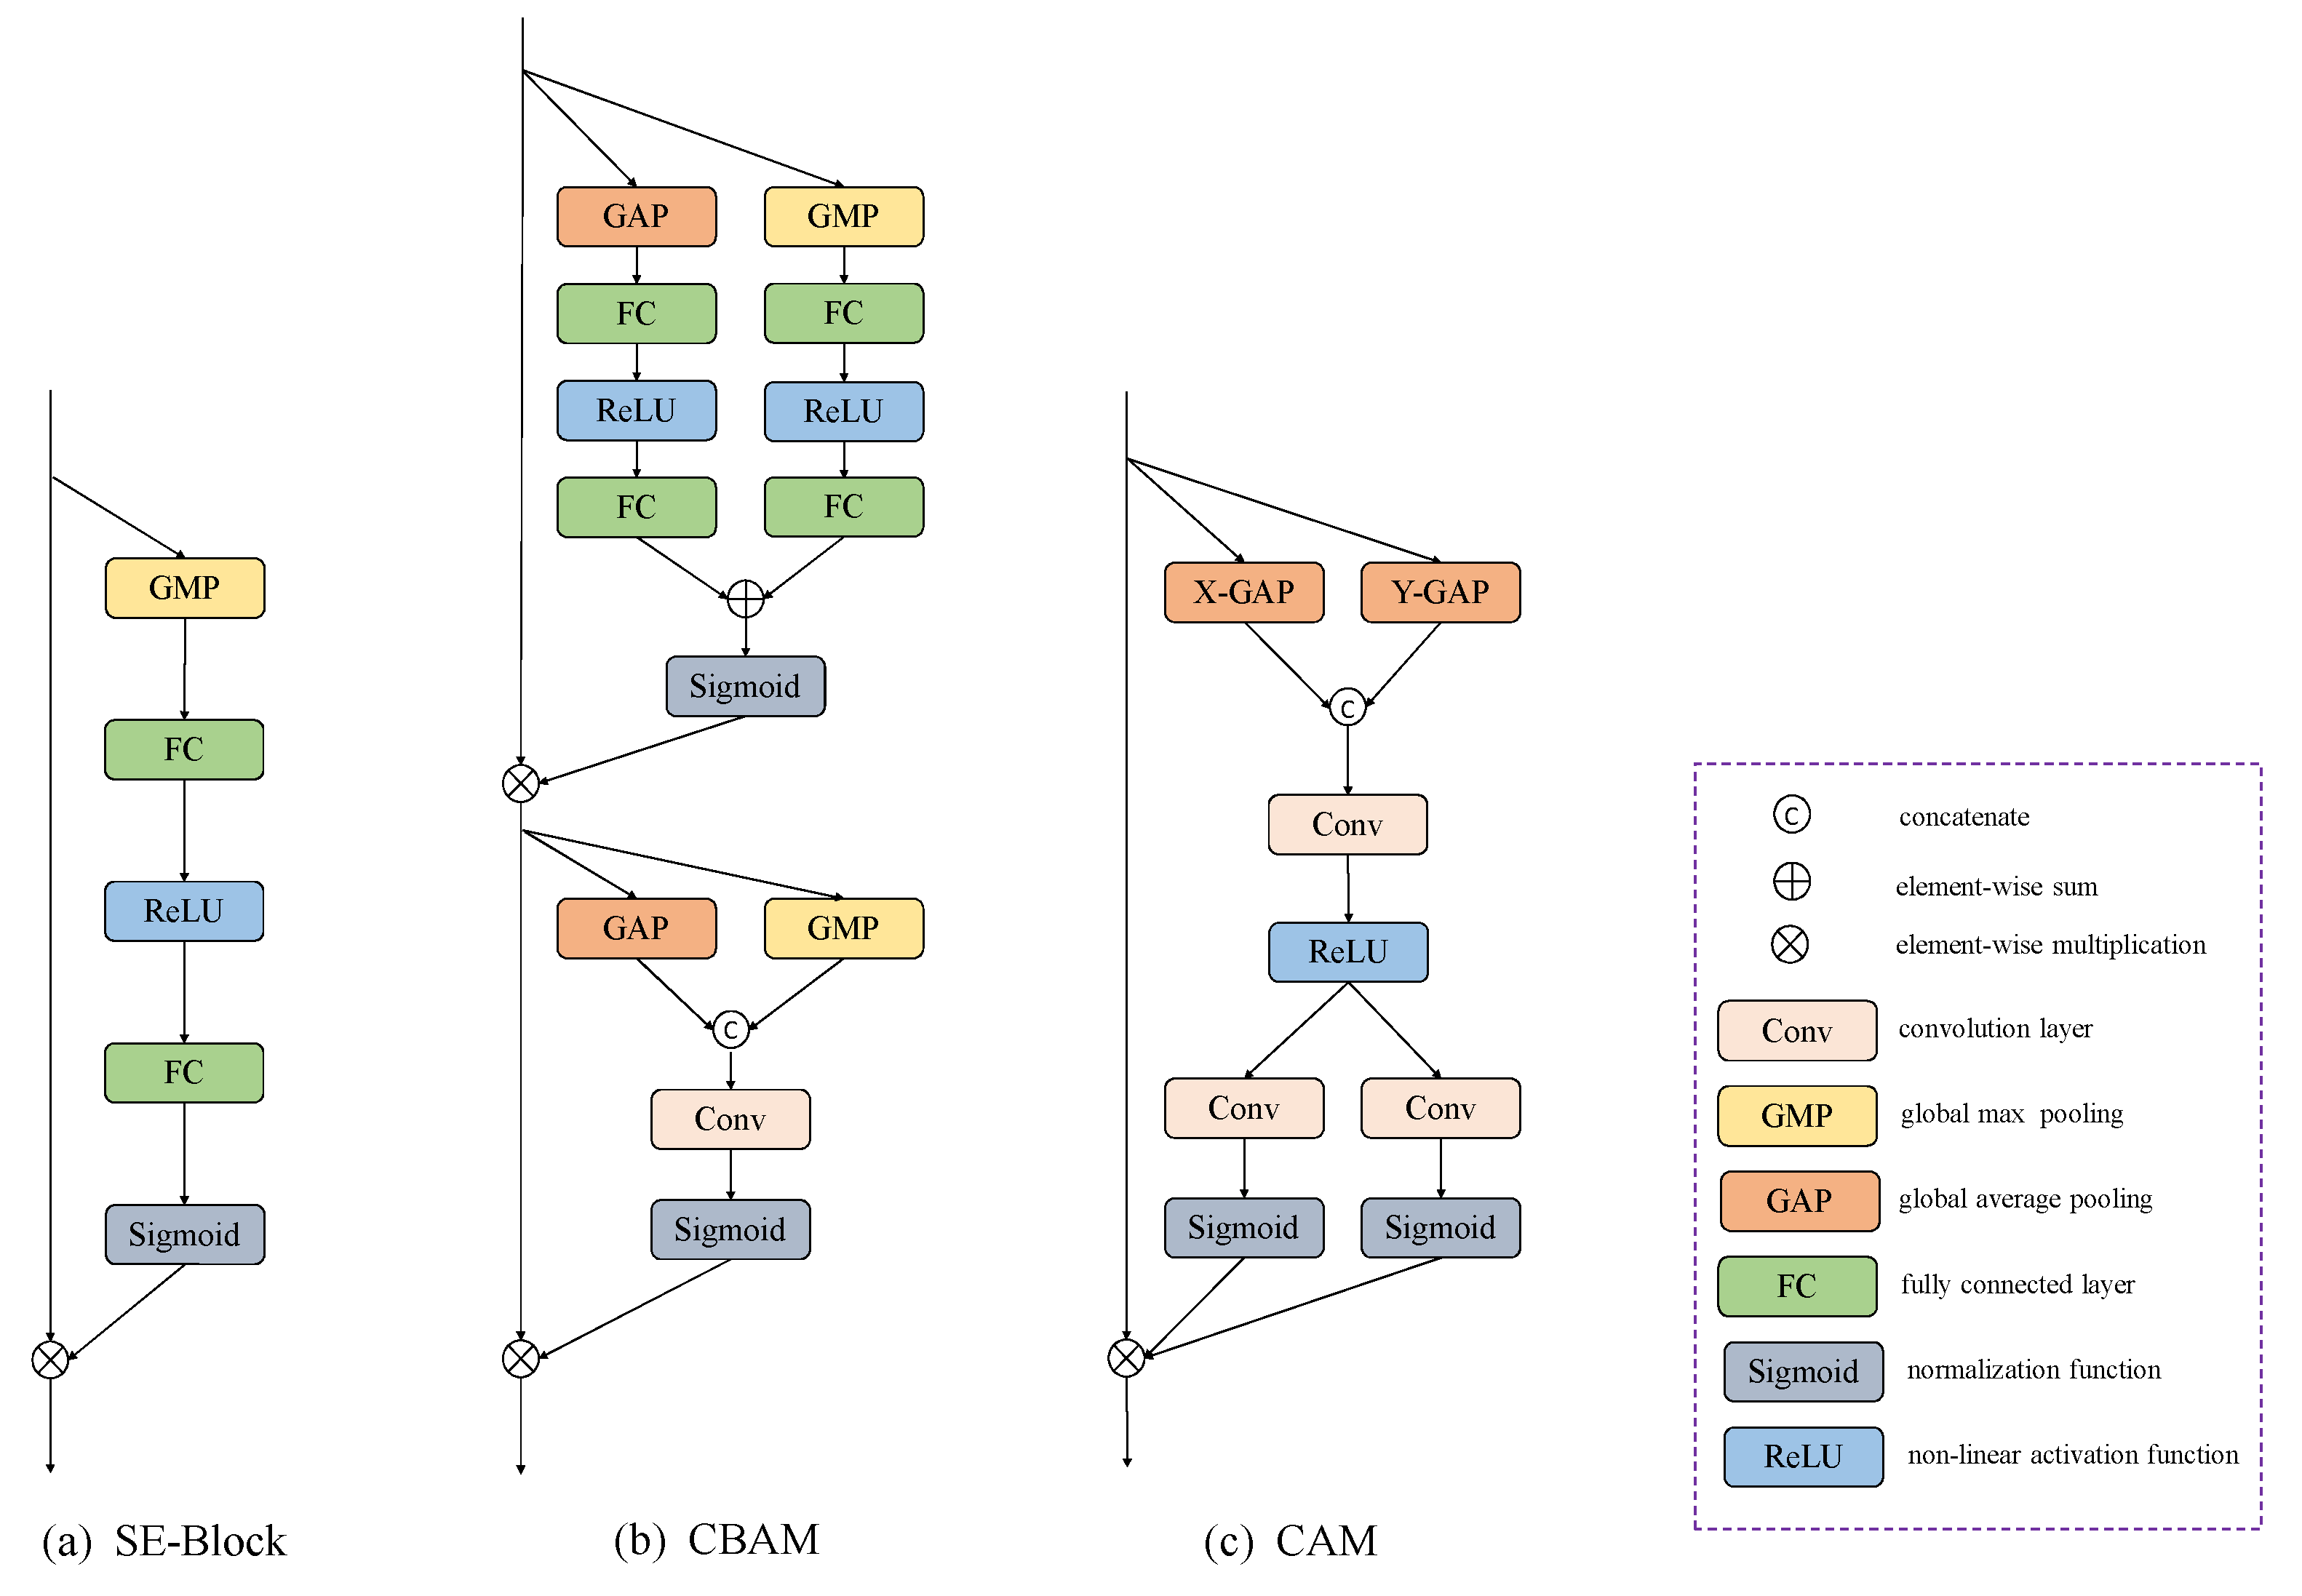
Figure 5.
Examples of inconsistency between smooth-L loss and localization accuracy. The two detection boxes with the same rotated IoUs have different losses, which leads to a suboptimal optimization process for training.
Figure 5.
Examples of inconsistency between smooth-L loss and localization accuracy. The two detection boxes with the same rotated IoUs have different losses, which leads to a suboptimal optimization process for training.
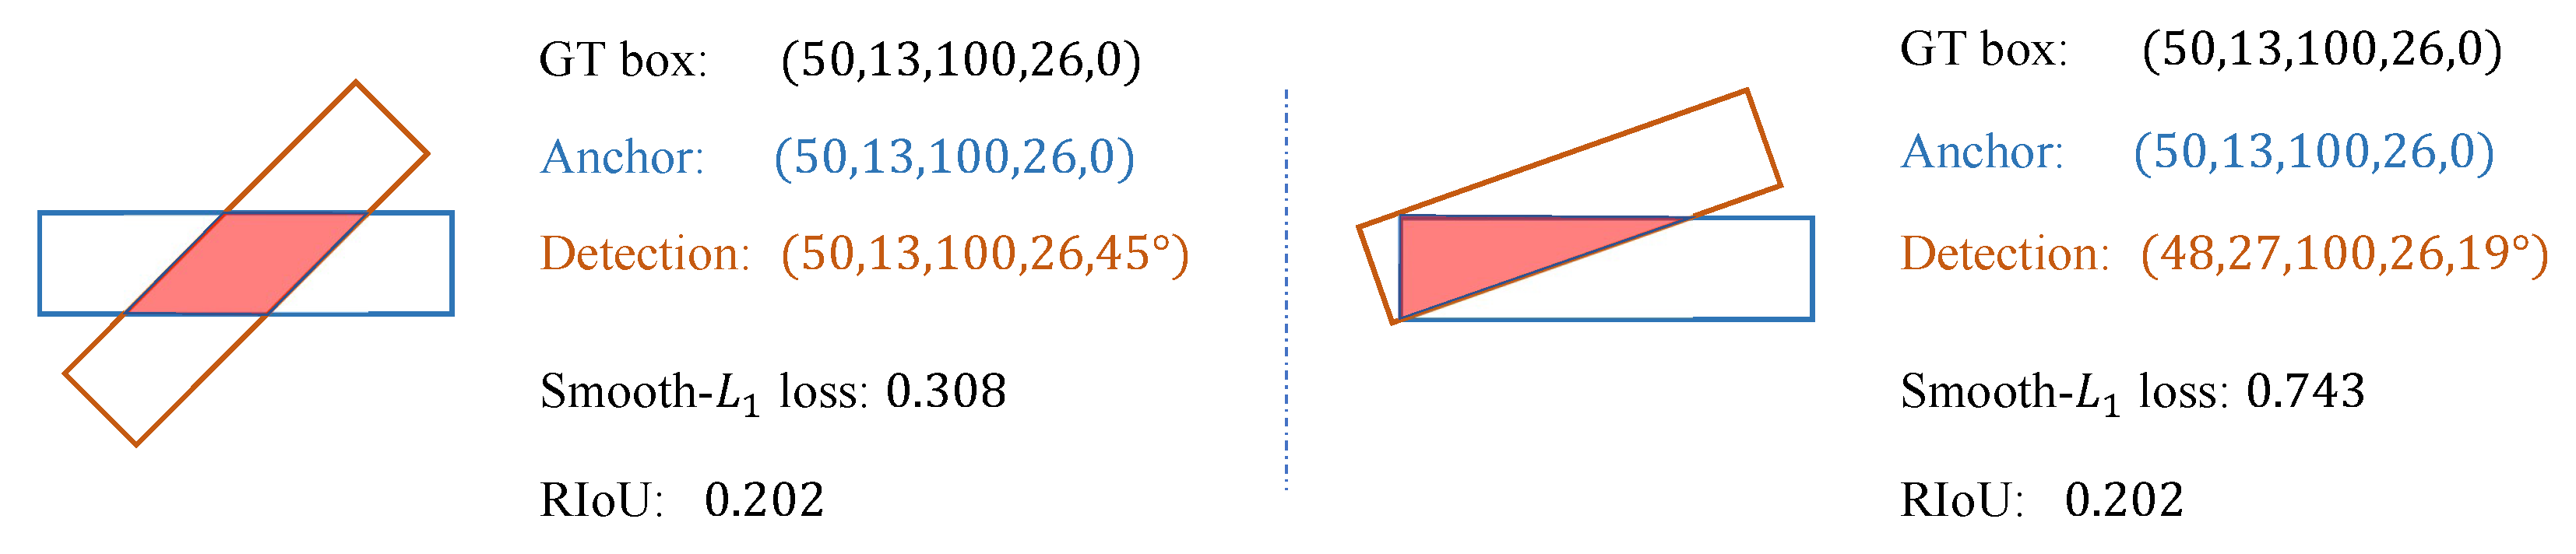
Figure 6.
Distance RIoU (D-RIoU) loss for oriented bounding box regression. (a) illustrates the detail of D-RIoU. (b) shows the performance evaluation of different RIoU-based losses.
Figure 6.
Distance RIoU (D-RIoU) loss for oriented bounding box regression. (a) illustrates the detail of D-RIoU. (b) shows the performance evaluation of different RIoU-based losses.

Figure 7.
Detection results of models trained with different loss functions.
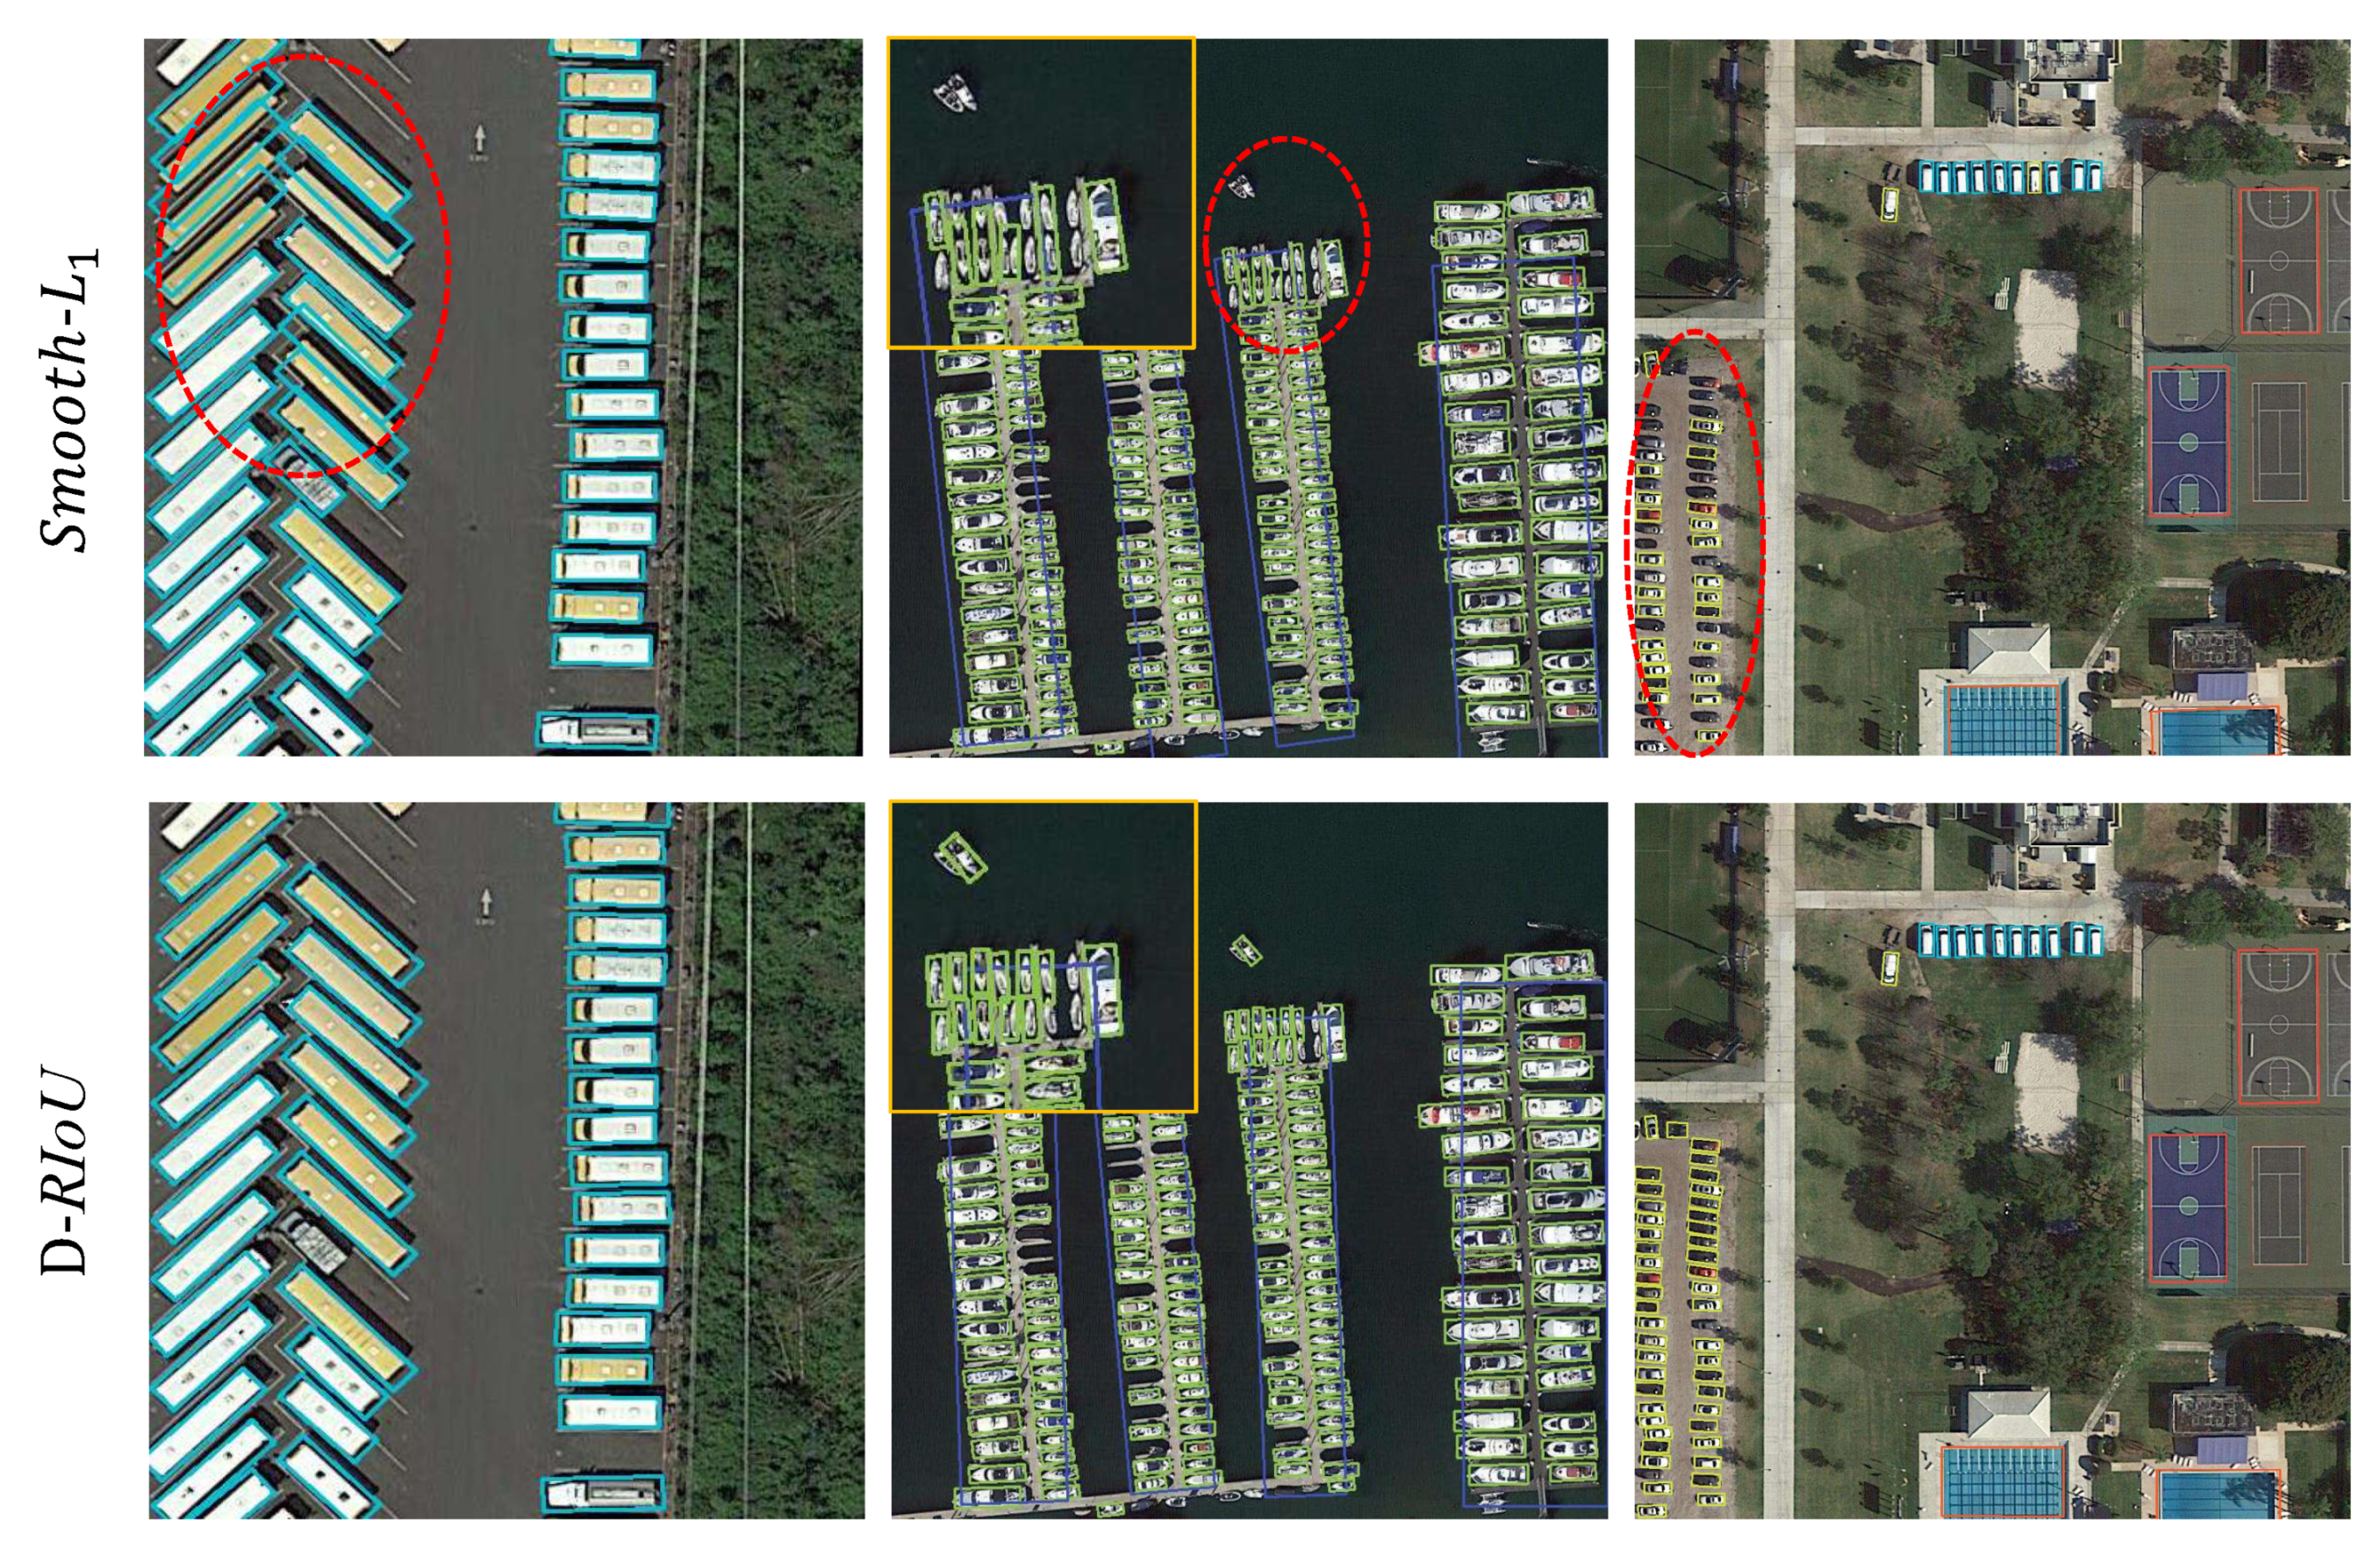
Figure 8.
Visualization of some detection results on HRSC2016 dataset.
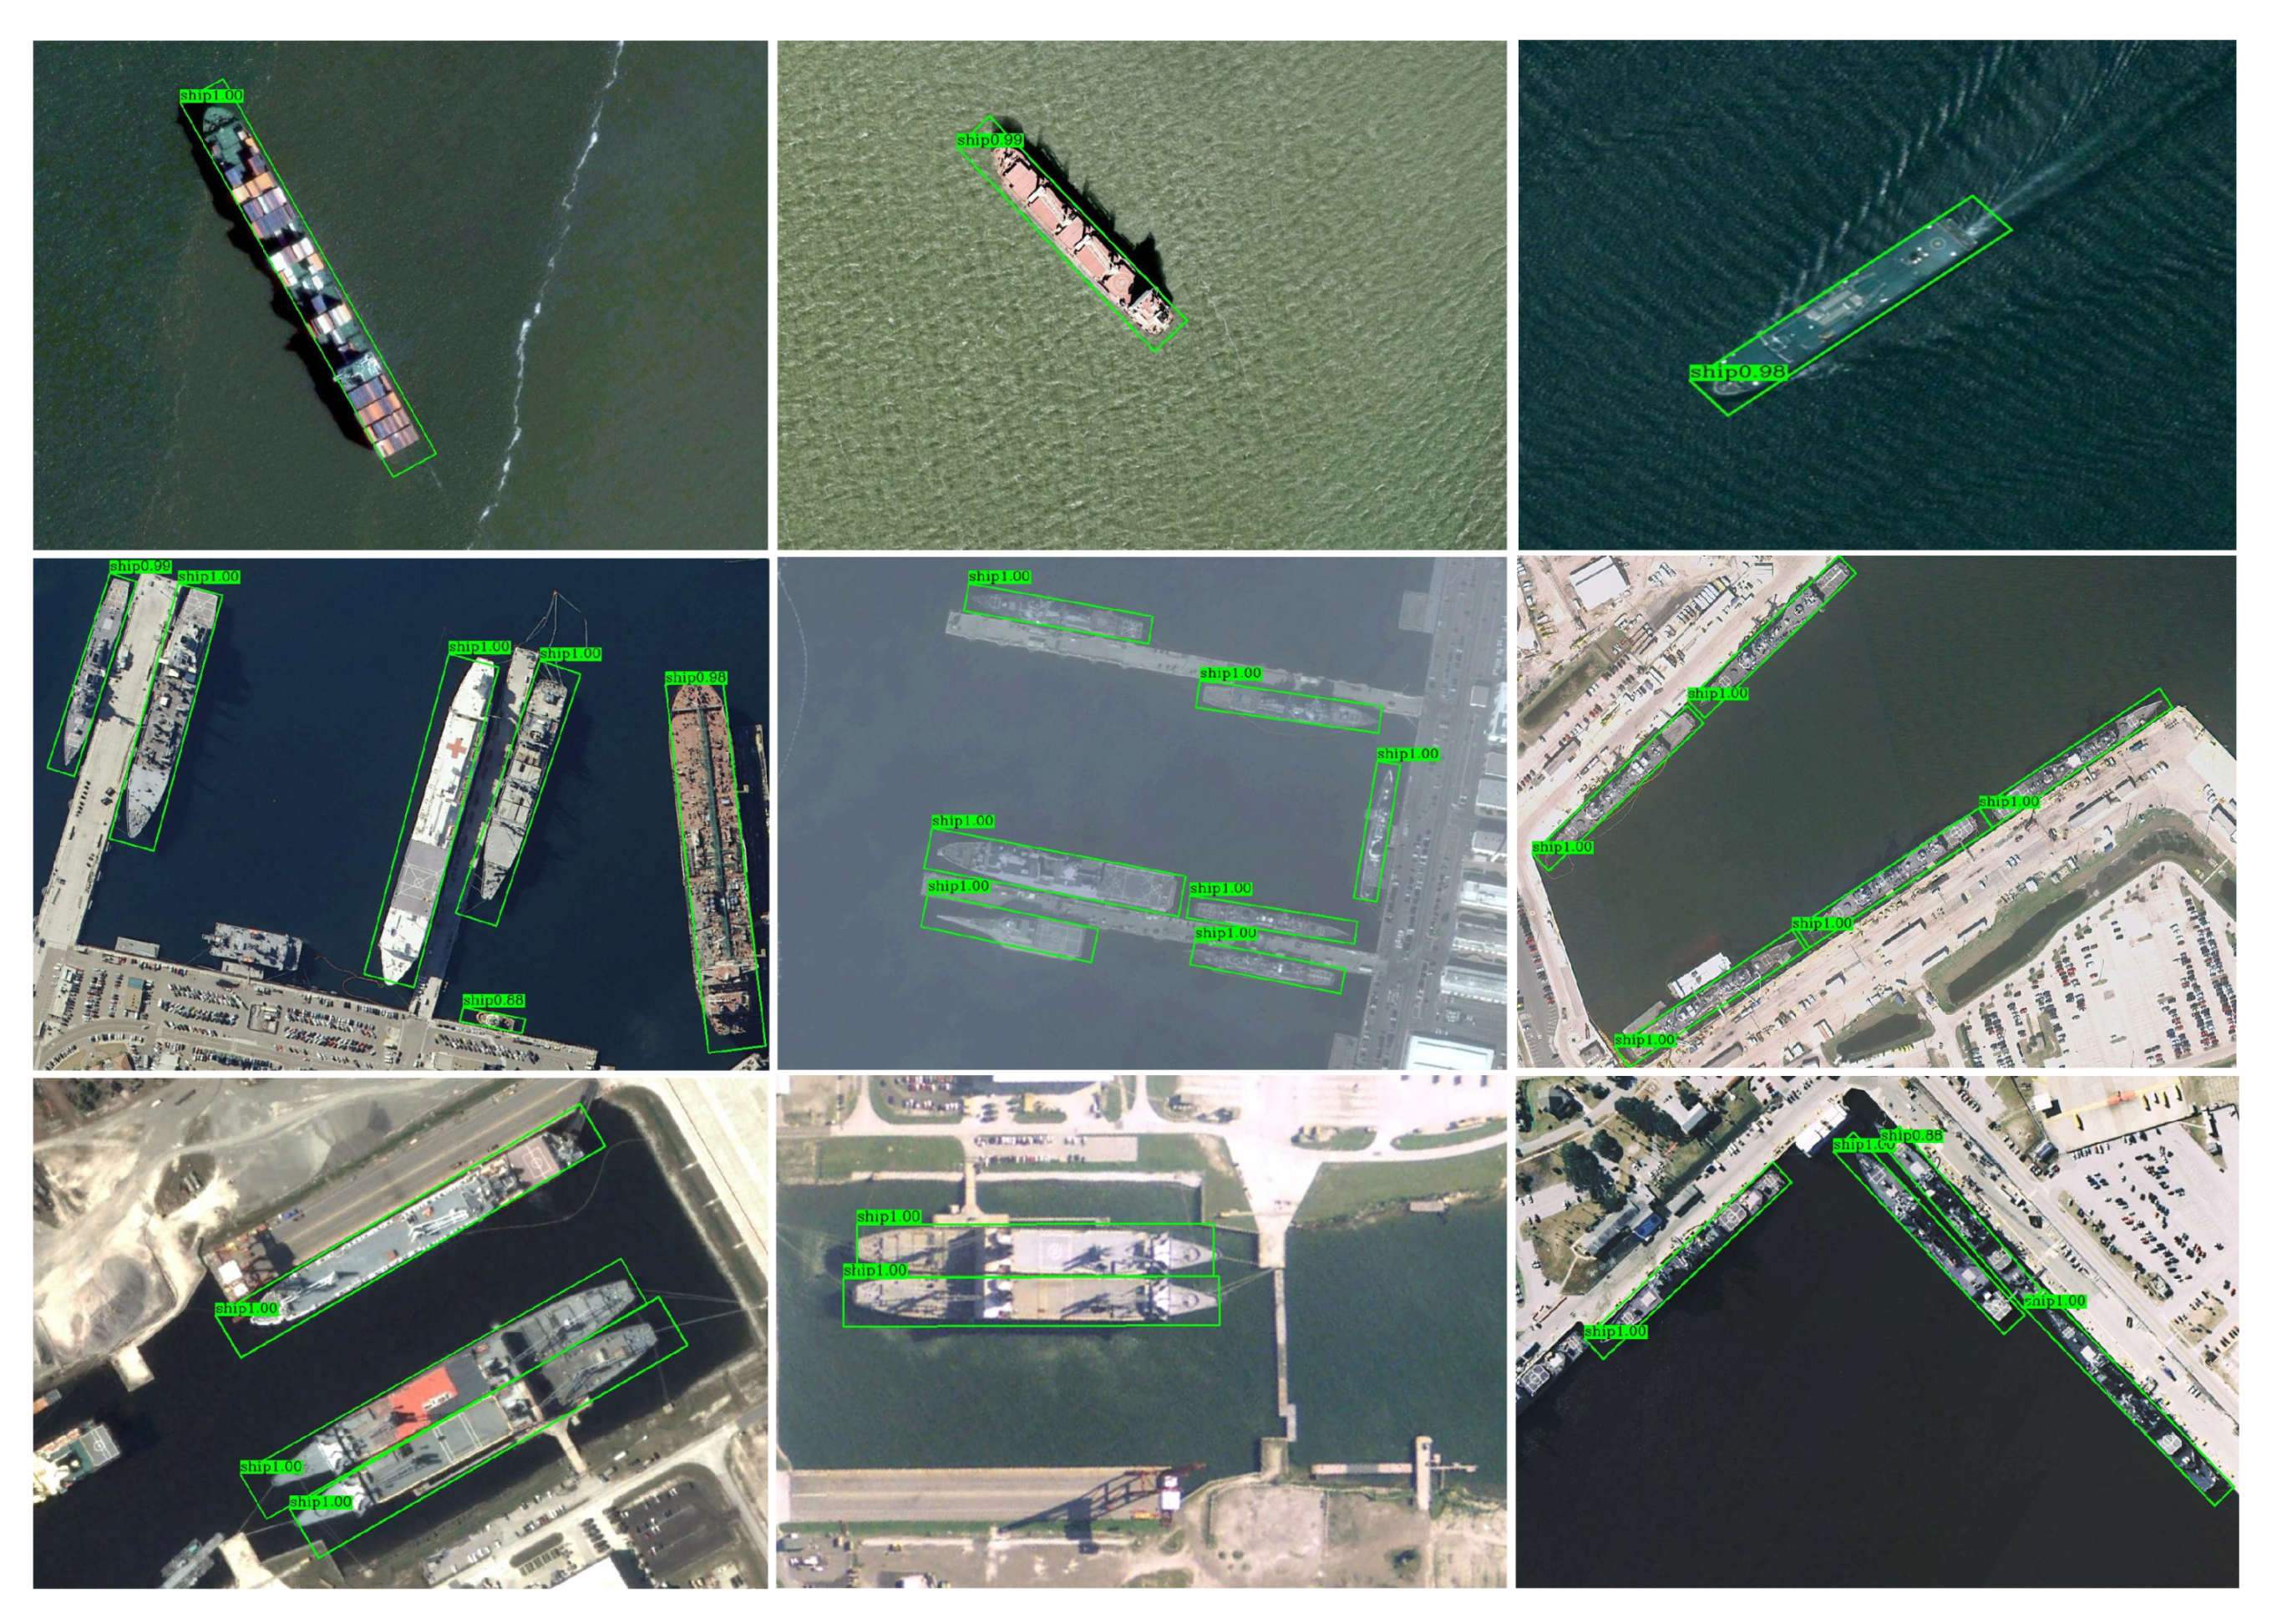
Figure 9.
Visualization of detections on UCAS-AOD dataset.
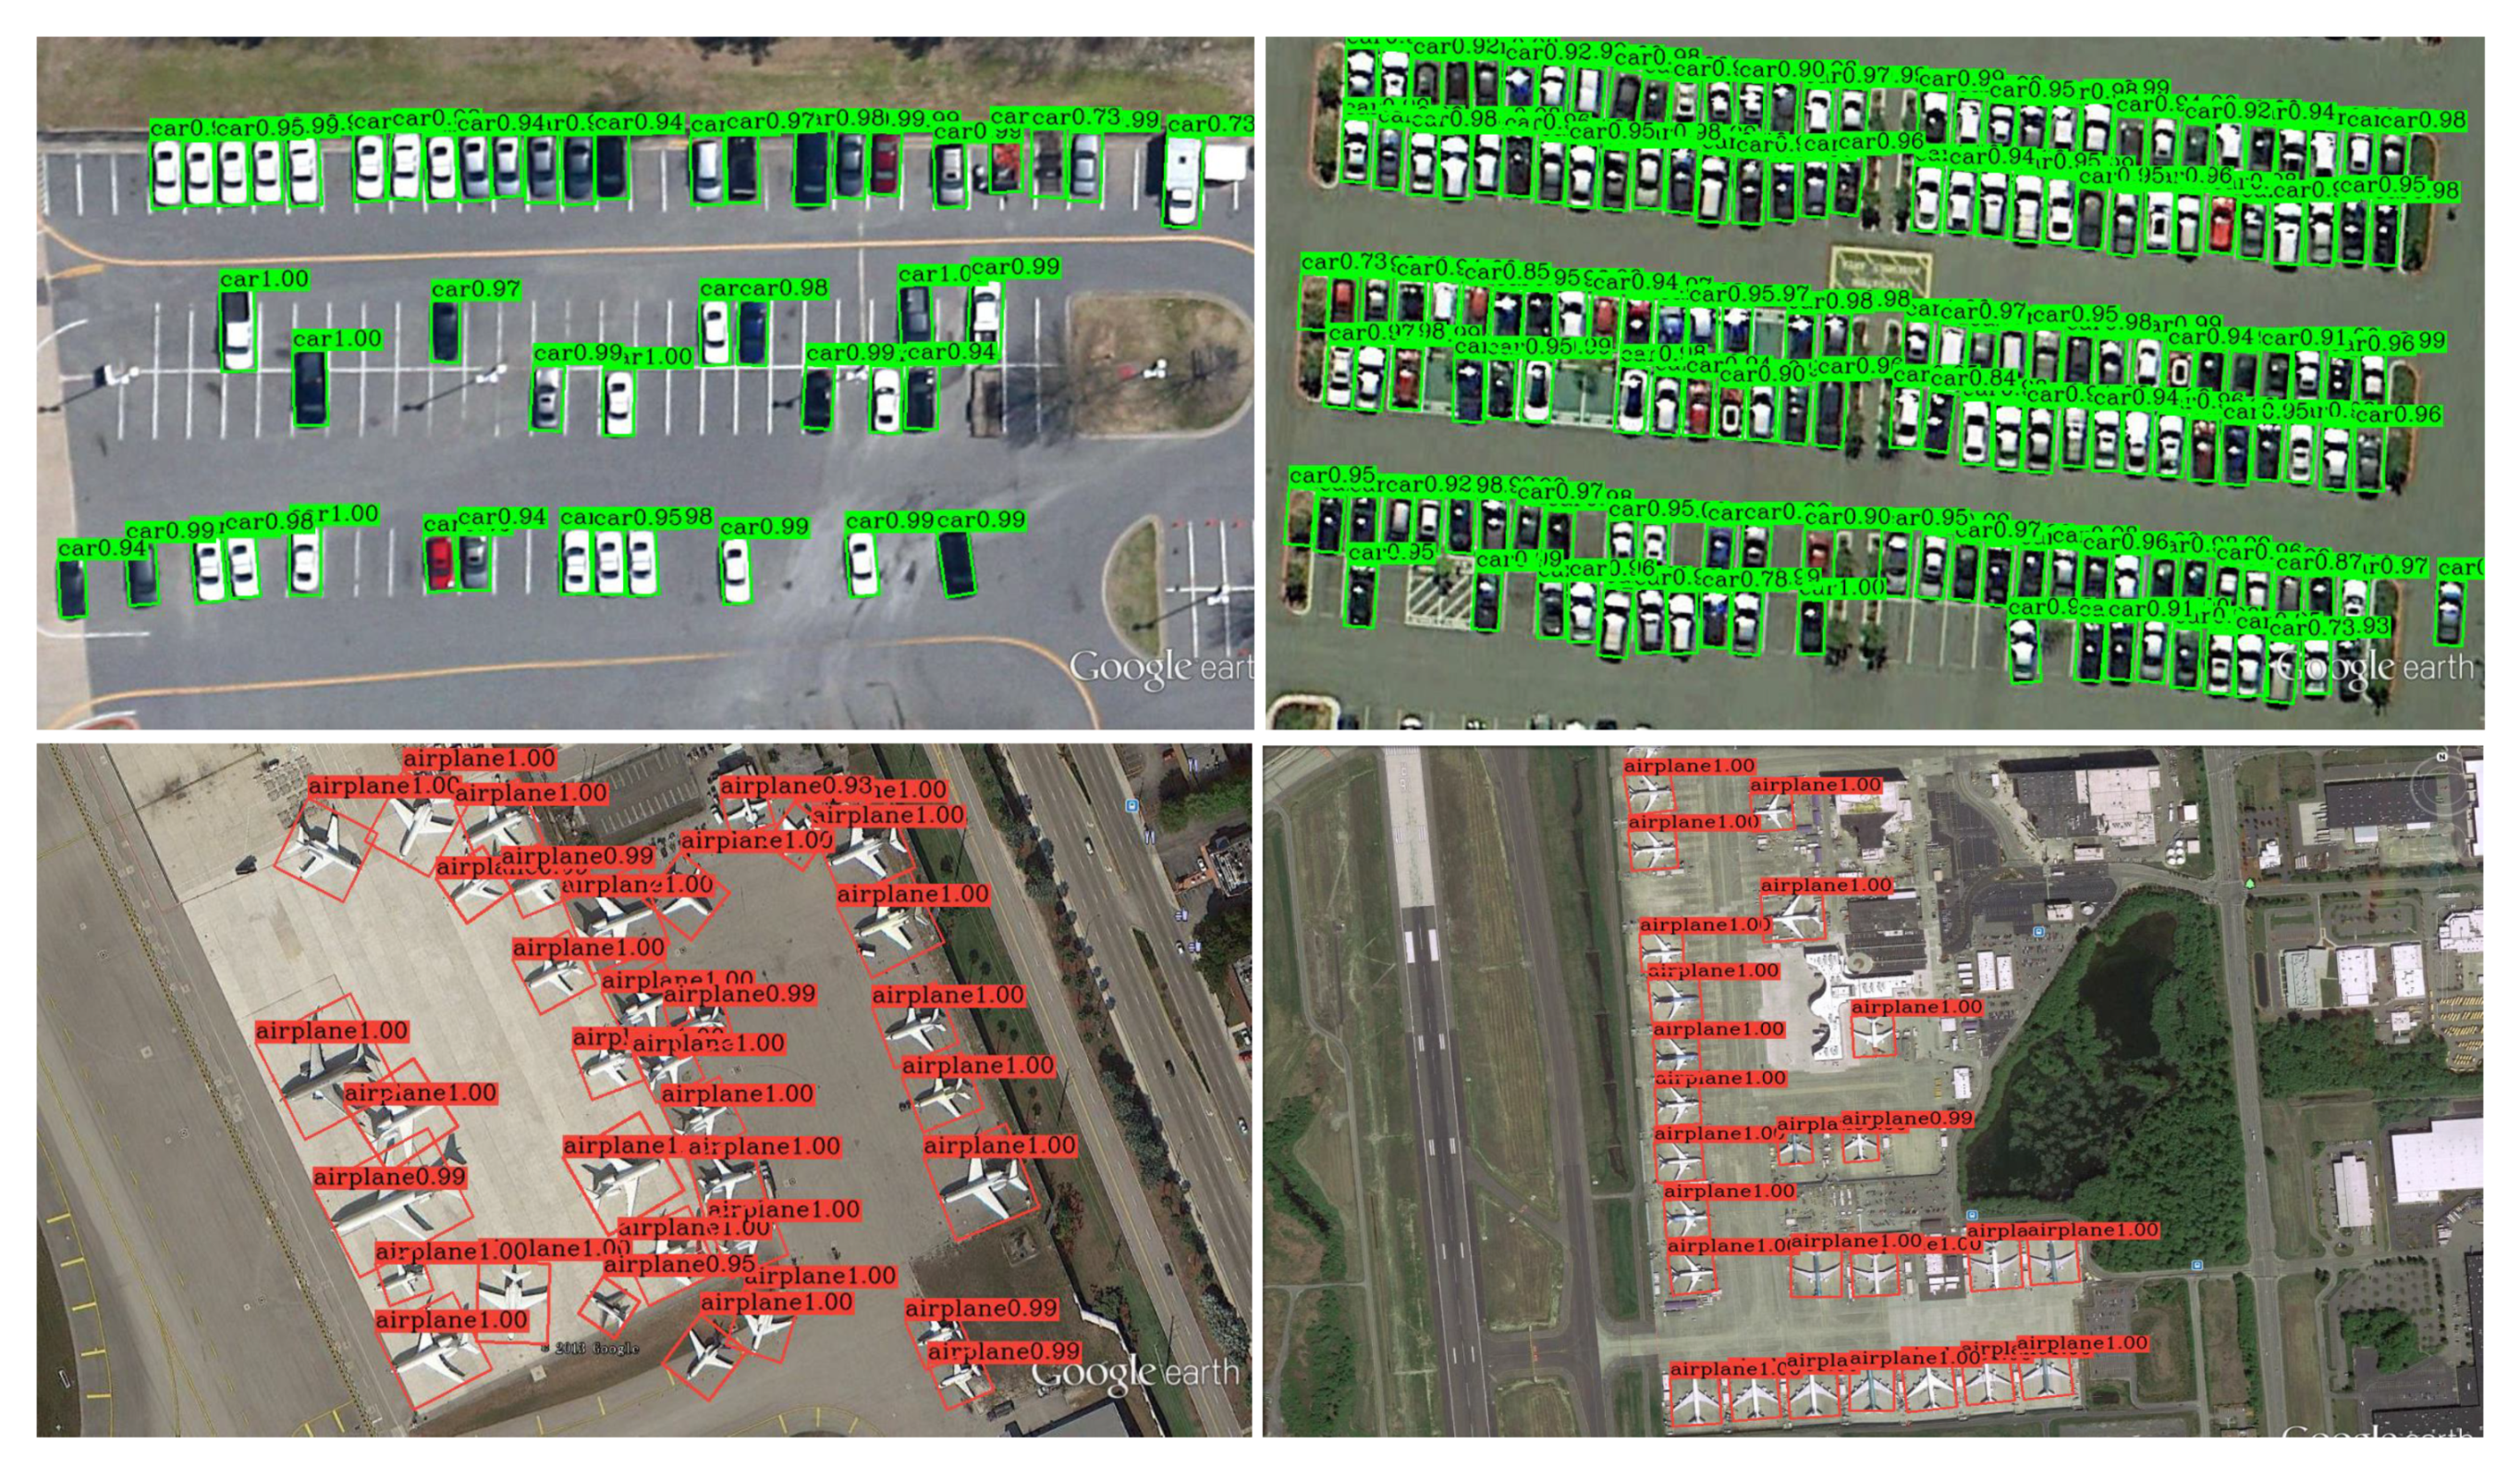
Figure 10.
Visualization of some detection results on DOTA dataset.

Table 1.
Effects of the proposed components on HRSC2016 dataset.
| Different Variants | ||||
|---|---|---|---|---|
| with SLA | × | ✔ | ✔ | ✔ |
| with PS-FPN | × | × | ✔ | ✔ |
| with D-RIoU loss | × | × | × | ✔ |
| 85.34 | 86.08 | 86.73 | 87.14 | |
| 48.11 | 55.60 | 58.88 | 62.92 | |
Table 2.
Analysis of sparse label assignment on HRSC2016 dataset.
| ID | Balanced Sampling | Sampling Ratio | P-NMS | NMS Threshold | AP | AP |
|---|---|---|---|---|---|---|
| 0 | - | - | - | - | 85.34 | 48.11 |
| 1 | pos/neg | 1:1 | - | - | 83.70 | 50.82 |
| 2 | - | 0.7 | 82.75 | 47.26 | ||
| 3 | - | 0.8 | 83.91 | 50.74 | ||
| 4 | - | 0.9 | 83.58 | 50.96 | ||
| 5 | ✔ | adaptive | 84.09 | 51.28 | ||
| 6 | pos/hard/neg | 1:1:10 | - | - | 84.27 | 52.44 |
| 7 | - | 0.7 | 84.03 | 51.84 | ||
| 8 | - | 0.8 | 84.47 | 52.73 | ||
| 9 | - | 0.9 | 84.58 | 52.15 | ||
| 10 | ✔ | adaptive | 85.60 | 54.07 | ||
| 11 | pos/hard/neg | 1:2:100 | - | - | 86.05 | 52.26 |
| 12 | - | 0.7 | 85.09 | 51.20 | ||
| 13 | - | 0.8 | 85.72 | 54.50 | ||
| 14 | - | 0.9 | 85.21 | 53.19 | ||
| 15 | ✔ | adaptive | 86.08 | 55.60 |
Table 3.
Analysis of position-sensitive feature pyramid network on HRSC2016 dataset.
| Backbone | PS-FPN | Param. Share | Reduction | mAP |
|---|---|---|---|---|
| ResNet-50 | - | - | - | 86.08 |
| ResNet-50 | ✔ | ✔ | 32 | 86.41 |
| ResNet-50 | × | 16 | 86.13 | |
| ResNet-50 | × | 24 | 86.01 | |
| ResNet-50 | × | 32 | 86.73 |
Table 4.
Analysis of different training losses on HRSC2016 dataset.
| Losses | Smooth-L | RIoU (Linear) | RIoU (log) | G-RIoU | D-RIoU |
|---|---|---|---|---|---|
| AP | 86.39 | 86.11 | 86.85 | 86.21 | 87.92 |
| AP | 54.88 | 55.21 | 57.64 | 51.24 | 59.15 |
Table 5.
Comparisons with other methods on HRSC2016 dataset.
| Methods | Backbone | Size | mAP |
|---|---|---|---|
| Two-stage: | |||
| RRPN [49] | ResNet101 | 800 × 800 | 79.08 |
| RPN [13] | VGG16 | — | 79.60 |
| RoI Trans. [50] | ResNet101 | 512 × 800 | 86.20 |
| Gliding Vertex [51] | ResNet101 | 512 × 800 | 88.20 |
| OPLD [52] | ResNet50 | 1024 × 1333 | 88.44 |
| DCL [32] | ResNet101 | 800 × 800 | 89.46 |
| Single-stage: | |||
| RetinaNet [16] | ResNet50 | 416 × 416 | 80.81 |
| RRD [53] | VGG16 | 384 × 384 | 84.30 |
| RSDet [33] | ResNet50 | 800 × 800 | 86.50 |
| BBAVector [54] | ResNet101 | 608 × 608 | 88.60 |
| DAL [20] | ResNet101 | 416 × 416 | 88.95 |
| R3Det [55] | ResNet101 | 800 × 800 | 89.26 |
| SLA (Ours) | ResNet50 | 384 × 384 | 87.14 |
| SLA (Ours) | ResNet101 | 768 × 768 | 89.51 |
Table 6.
Comparisons with high-quality detection performance on HRSC2016 dataset.
| Methods | RetinaNet [16] | ATSS [38] | RIDet-O [34] | DAL [20] | SLA(Ours) |
|---|---|---|---|---|---|
| 83.49 | 86.67 | 88.35 | 89.42 | 89.51 | |
| 49.11 | 59.10 | 54.94 | 66.56 | 68.12 |
Table 7.
Comparisons with high-quality detection performance on HRSC2016 dataset.
| Methods | Car | Airplane | mAP |
|---|---|---|---|
| YOLOv3 [6] | 74.63 | 89.52 | 82.08 |
| RetinaNet [16] | 84.64 | 90.51 | 87.57 |
| FR-O [22] | 86.87 | 89.86 | 88.36 |
| RoI Transformer [50] | 87.99 | 89.90 | 88.95 |
| RIDet-Q [34] | 88.50 | 89.96 | 89.23 |
| SLA(ours) | 88.57 | 90.30 | 89.44 |
Table 8.
Comparisons with other state of the art methods on DOTA dataset. * denotes using multi-scale testing.
Table 8.
Comparisons with other state of the art methods on DOTA dataset. * denotes using multi-scale testing.
| Methods | Backbone | PL | BD | BR | GTF | SV | LV | SH | TC | BC | ST | SBF | RA | HA | SP | HC | mAP |
|---|---|---|---|---|---|---|---|---|---|---|---|---|---|---|---|---|---|
| Two-stage: | |||||||||||||||||
| RRPN [49] | R-101 | 88.52 | 71.20 | 31.66 | 59.30 | 51.85 | 56.19 | 57.25 | 90.81 | 72.84 | 67.38 | 56.69 | 52.84 | 53.08 | 51.94 | 53.58 | 61.01 |
| RoI Trans. [50] | R-101 | 88.64 | 78.52 | 43.44 | 75.92 | 68.81 | 73.68 | 83.59 | 90.74 | 77.27 | 81.46 | 58.39 | 53.54 | 62.83 | 58.93 | 47.67 | 69.56 |
| CAD-Net [27] | R-101 | 87.80 | 82.40 | 49.40 | 73.50 | 71.10 | 63.50 | 76.70 | 90.90 | 79.20 | 73.30 | 48.40 | 60.90 | 62.00 | 67.00 | 62.20 | 69.90 |
| SCRDet [56] | R-101 | 89.98 | 80.65 | 52.09 | 68.36 | 68.36 | 60.32 | 72.41 | 90.85 | 87.94 | 86.86 | 65.02 | 66.68 | 66.25 | 68.24 | 65.21 | 72.61 |
| Gliding Vertex [51] | R-101 | 89.64 | 85.00 | 52.26 | 77.34 | 73.01 | 73.14 | 86.82 | 90.74 | 79.02 | 86.81 | 59.55 | 70.91 | 72.94 | 70.86 | 57.32 | 75.02 |
| CSL [31] | R-152 | 90.25 | 85.53 | 54.64 | 75.31 | 70.44 | 73.51 | 77.62 | 90.84 | 86.15 | 86.69 | 69.60 | 68.04 | 73.83 | 71.10 | 68.93 | 76.17 |
| Single-stage: | |||||||||||||||||
| A-Det [40] | R-101 | 89.59 | 77.89 | 46.37 | 56.47 | 75.86 | 74.83 | 86.07 | 90.58 | 81.09 | 83.71 | 50.21 | 60.94 | 65.29 | 69.77 | 50.93 | 70.64 |
| O-DNet [57] | H-104 | 89.31 | 82.14 | 47.33 | 61.21 | 71.32 | 74.03 | 78.62 | 90.76 | 82.23 | 81.36 | 60.93 | 60.17 | 58.21 | 66.98 | 61.03 | 71.04 |
| DAL [20] | R-101 | 88.61 | 79.69 | 46.27 | 70.37 | 65.89 | 76.10 | 78.53 | 90.84 | 79.98 | 78.41 | 58.71 | 62.02 | 69.23 | 71.32 | 60.65 | 71.78 |
| RSDet [33] | R-101 | 89.80 | 82.90 | 48.60 | 65.20 | 69.50 | 70.10 | 70.20 | 90.50 | 85.60 | 83.40 | 62.50 | 63.90 | 65.60 | 67.20 | 68.00 | 72.20 |
| DRN [58] | H-104 | 89.71 | 82.34 | 47.22 | 64.10 | 76.22 | 74.43 | 85.84 | 90.57 | 86.18 | 84.89 | 57.65 | 61.93 | 69.30 | 69.63 | 58.48 | 73.23 |
| BBAVector [54] | R-101 | 88.35 | 79.96 | 50.69 | 62.18 | 78.43 | 78.98 | 87.94 | 90.85 | 83.58 | 84.35 | 54.13 | 60.24 | 65.22 | 64.28 | 55.70 | 72.32 |
| CFC-Net [29] | R-50 | 89.08 | 80.41 | 52.41 | 70.02 | 76.28 | 78.11 | 87.21 | 90.89 | 84.47 | 85.64 | 60.51 | 61.52 | 67.82 | 68.02 | 50.09 | 73.50 |
| RDet [55] | R-152 | 89.49 | 81.17 | 50.53 | 66.10 | 70.92 | 78.66 | 78.21 | 90.81 | 85.26 | 84.23 | 61.81 | 63.77 | 68.16 | 69.83 | 67.17 | 73.74 |
| SLA (Ours) | R-50 | 85.23 | 83.78 | 48.89 | 71.65 | 76.43 | 76.80 | 86.83 | 90.62 | 88.17 | 86.88 | 49.67 | 66.13 | 75.34 | 72.11 | 64.88 | 74.89 |
| SLA (Ours) | R-50 | 88.33 | 84.67 | 48.78 | 73.34 | 77.47 | 77.82 | 86.53 | 90.72 | 86.98 | 86.43 | 58.86 | 68.27 | 74.10 | 73.09 | 69.30 | 76.36 |
Publisher’s Note: MDPI stays neutral with regard to jurisdictional claims in published maps and institutional affiliations. |
© 2021 by the authors. Licensee MDPI, Basel, Switzerland. This article is an open access article distributed under the terms and conditions of the Creative Commons Attribution (CC BY) license (https://creativecommons.org/licenses/by/4.0/).
Share and Cite
MDPI and ACS Style
Ming, Q.; Miao, L.; Zhou, Z.; Song, J.; Yang, X. Sparse Label Assignment for Oriented Object Detection in Aerial Images. Remote Sens. 2021, 13, 2664. https://doi.org/10.3390/rs13142664
AMA Style
Ming Q, Miao L, Zhou Z, Song J, Yang X. Sparse Label Assignment for Oriented Object Detection in Aerial Images. Remote Sensing. 2021; 13(14):2664. https://doi.org/10.3390/rs13142664
Chicago/Turabian StyleMing, Qi, Lingjuan Miao, Zhiqiang Zhou, Junjie Song, and Xue Yang. 2021. "Sparse Label Assignment for Oriented Object Detection in Aerial Images" Remote Sensing 13, no. 14: 2664. https://doi.org/10.3390/rs13142664
Note that from the first issue of 2016, this journal uses article numbers instead of page numbers. See further details here.