Technical Note

A GPR-Based Pavement Density Profiler: Operating Principles and Applications

1
Department of Geophysics, Aristotle University of Thessaloniki, 541 24 Thessaloniki, Greece
2
Sensors & Software Inc., Mississauga, ON L4W 2X8, Canada
*
Author to whom correspondence should be addressed.
Remote Sens. 2021, 13(13), 2613; https://doi.org/10.3390/rs13132613
Submission received: 11 June 2021 / Revised: 25 June 2021 / Accepted: 27 June 2021 / Published: 3 July 2021
(This article belongs to the Special Issue Trends in GPR and Other NDTs for Transport Infrastructure Assessment)

Abstract

:
Density is one of the most important parameters in the construction of asphalt mixtures and pavement engineering. When a mixture is properly designed and compacted, it will contain enough air voids to prevent plastic deformation but will have low enough air void content to prevent water ingress and moisture damage. By mapping asphalt pavement density, areas with air void content outside of the acceptable range can be identified to predict its future life and performance. We describe a new instrument, the pavement density profiler (PDP) that has evolved from many years of making measurements of asphalt pavement properties. This instrument measures the electromagnetic (EM) wave impedance to infer the asphalt pavement density (or air void content) locally and over profiles.

1. Introduction

Hot mix asphalt (HMA) pavement industry best practices state that asphalt density (or compaction) is a key indicator in the quality and longevity of pavement in new and refinished HMA driving surfaces. Previous work has shown that improper asphalt compaction during pavement construction can lead to early pavement degradation through excessive rutting, cracking, raveling, potholes, and water infiltration [1,2,3,4,5,6,7,8,9].
The current methodologies for assessing pavement asphalt density/compaction have a number of shortfalls [10] which include:
  • Coring at several locations and conducting air void tests in the laboratory as indicated in [11] is a time consuming, costly, and destructive process;
  • Desire for real-time feedback on compaction with devices that would increase productivity of the construction, facilitate shorter construction times, and reduce construction costs;
  • Existing methods for density measurements such as nuclear gauges have added complexities relative to licensing, equipment handling, and storage;
  • Existing methods all provide only point measurements at spatial limited pavement locations;
  • Safety concerns for any operator in trafficked areas.
These shortfalls could be mitigated by new technologies integrated onto asphalt rollers incorporating real-time asphalt density/compaction measurement data. The American Association of State Highway and Transportation Officials (AASHTO) has published preliminary standard practice for using ground penetrating radar (GPR) to measure asphalt surface dielectric—a proxy for density—profiles [12].
An example of such a technology is the pavement density profiler (PDP), a new asphalt density measuring instrument recently launched by Sensors & Software Inc. [13,14]. The concept behind this instrument is to automatically and non-destructively determine asphalt pavement density (or void content). PDP provides either continuous density profiles as a function of the distance traversed over the pavement, as well as local density measurements at specific points. PDP can also produce area mapping coverage providing that PDP profiles are collected with controlled positioning such as geo-referenced data obtained from GPS. Continuous profile data can be acquired when PDP is vehicle mounted (Figure 1, top-right) or when the instrument is cart mounted (Figure 1, top-left). The speed of traverse is normally slow (walking speed is typical) since the device is normally used to measure at the speed of the paving train machinery. While measurements can be made at higher traverse speeds on open areas days or weeks after pavement placement, this approach defeats the ability to obtain immediate feedback to the paving operation.
The PDP sensor is cableless and completely self-contained including the data acquisition hardware, software, data storage, a rechargeable lithium-ion battery, built-in GPS, and Wi-Fi communications (through which the system is controlled, and data are displayed with common devices—for example, laptops, tablets, smartphones, etc.). There is also a height sensor embedded into the PDP unit which records the system height above the pavement surface. The height sensor data are logged and synchronized with PDP data and could be used in the automatic data processing procedure to compensate for height variations if significant variations occur. The device is factory calibrated and has long-term stability eliminating the need for user calibration. The system electronic components use dynamic temperature compensation over a wide range of temperatures (i.e., from −50 to +50 °C). Factory calibration is performed over controlled materials such as large metal sheets and thick layers of high density polyethylene (HDPE). The metal sheet is a perfect reflector, while the HDPE is effectively a half-space with relative permittivity ( k r ) equal to 2.3. In many follow-up tests over HDPE, the PDP obtained an average k r of 2.301 and a standard deviation of 0.017 using data sets with ~1000 measurements.
PDP provides immediate on-site feedback through a simple, user-friendly software interface which delivers a real-time graphical display of the selected density indicator (relative permittivity, normalized density, air-void ratio, etc.; Figure 1, bottom) while the user collects data over a profile. This methodology reduces (or eliminates) the time consuming, expensive, and most importantly invasive testing methods of coring and laboratory density measurements which are currently used for pavement quality assurance and quality control (QA/QC).

2. Asphalt Pavement Overview

Paving asphalt—bitumen or tar—is a petroleum product and it is used as a binder —called asphalt binder—to create mixtures which are then used to form driving surfaces such as roads, runways, and parking lots. The goal is to provide a smooth surface which can withstand substantial loads without deforming or fracturing. These mixtures also contain aggregate (which is typically crushed rock, clean gravel or possibly even crushed glass—the key aspect of the aggregate is that it should be impermeable and have long-term chemical stability). The asphalt binder and aggregate are combined in different proportions to create the hot mix asphalt (HMA) which is a very pliable, hot material and can be poured as a viscous fluid during construction. This hot mixture is placed into a paving machine which then extrudes the pliable material in a uniform layer on the road or area to be covered. After laying a uniform, relatively flat HMA layer, a roller or similar compacting device compresses the malleable, pliable material. As the material eventually cools, a solid impermeable surface forms—the asphalt pavement [15].
Two critical factors impacting the quality of asphalt pavements are surface smoothness and life expectancy. A smooth surface generally produces low vibration noise from passing vehicles and decreases the amount of hammering and impacting on the surface when high-speed vehicles move over undulations. Life expectancy is an important factor of pavement engineering as the fewer times paving materials must be replaced, the better. Construction design and material stability are the two controlling factors of asphalt pavement life expectancy. At the construction stage, the asphalt mix must be properly selected for the expected environment and loading conditions and then, properly installed. The material stability for the long-term variation depends on the construction practice as well as the material itself. The asphalt mixture is usually comprised by some volatile materials that burn off with time and exposure to weathering conditions. Moreover, brittleness or friability of the material heavily depends on how well the asphalt mix has been compacted during construction. Compaction depends on the mixture temperature (which controls malleability) and the compaction method. When the HMA is poorly (under) compacted, it becomes friable and crumbles and also, there is the risk of water intrusion. When it is over compacted, it becomes brittle and will crack under heavy loading. Over-compaction can also lead to early pavement degradation through excessive rutting. There is an optimal level of compaction which is expected to provide the best asphalt pavement life expectancy.

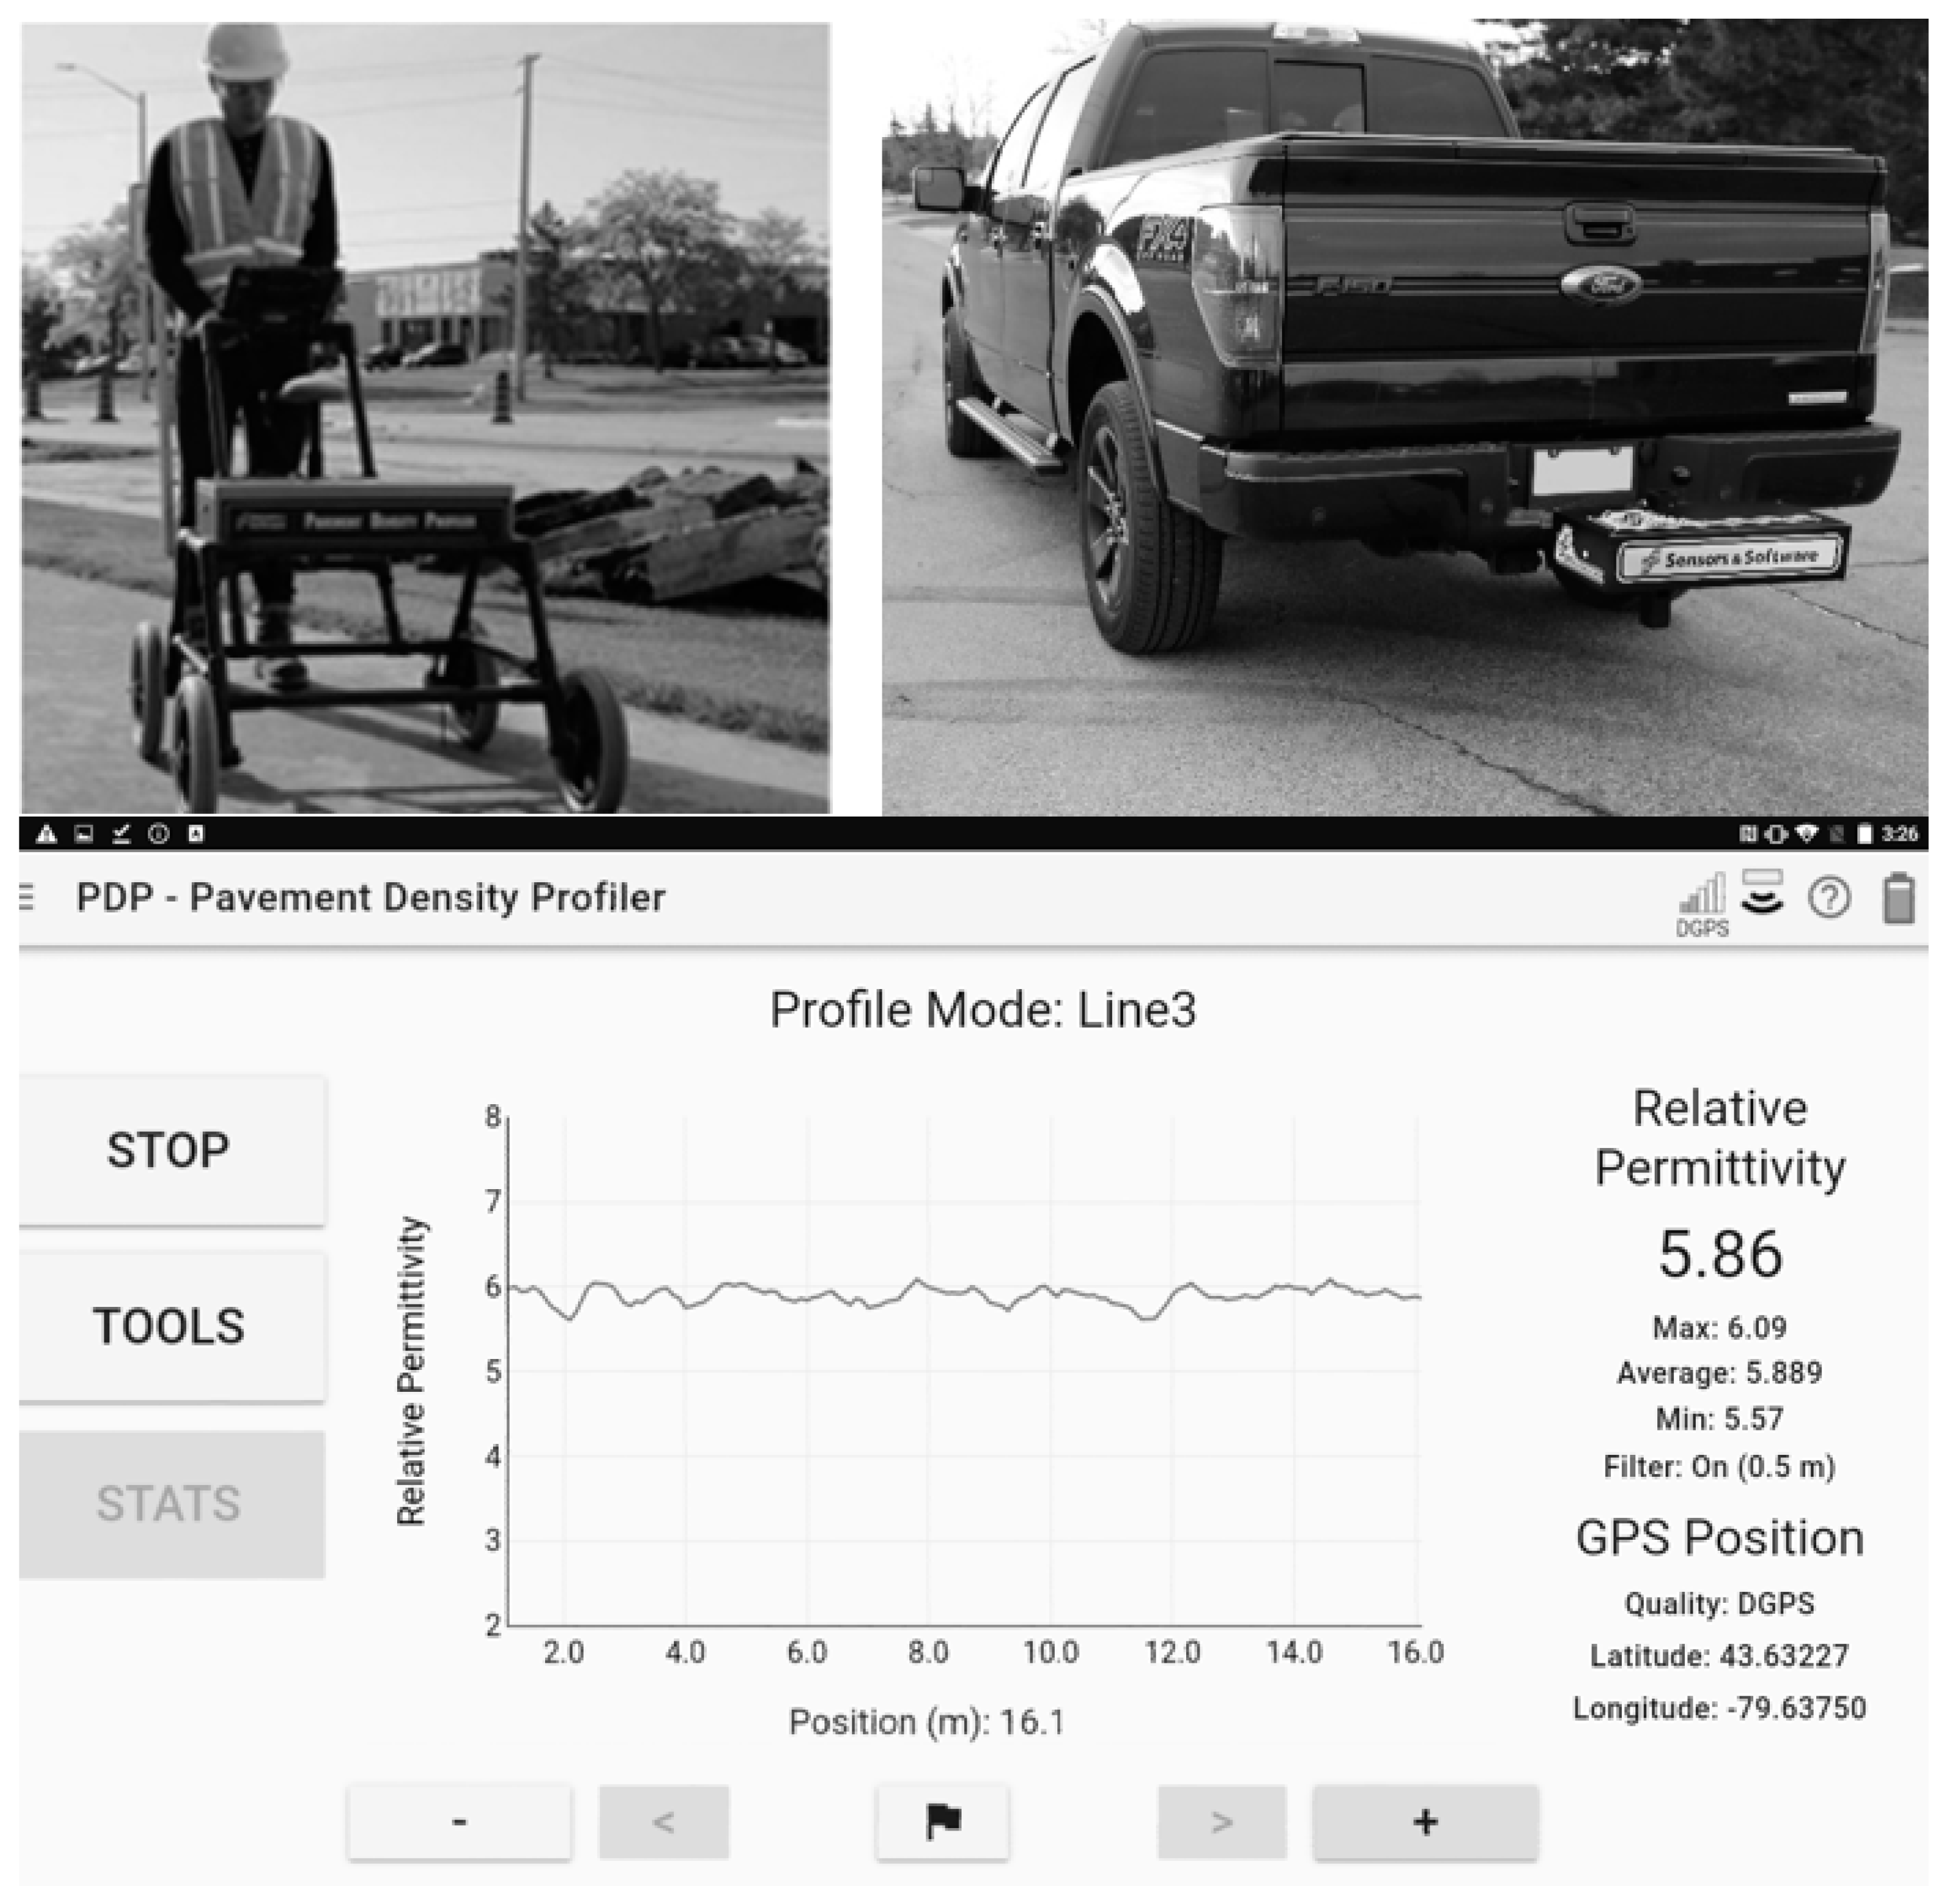
3. PDP Operating Principles and Technical Specifications

PDP belongs to the group of indirect methods for measuring density, as opposed to the direct methods that require acquiring material samples from the road surface via physical coring. The main challenges when employing the direct methods for measuring pavement density are that: (a) They are destructive, (b) the samples are of limited number and come from specific pavement locations, and (c) performing the final density measurement at the lab is a time-consuming, expensive process that does not provide real-time results. The indirect methods for measuring density, often referred to as non-destructive testing (NDT) methods, measure a material property that is related to the density. The goal is a methodology that does not damage the road structure, can generate density estimates over points and/or continuous stretches of pavement, if needed, and immediately provide readings on site. PDP, being part of the indirect methods group, does not measure density directly. It measures the electromagnetic (EM) wave impedance which is closely correlated with density (since the EM reflectivity of an asphalt pavement road surface is an indicator of the material density). The surface reflectivity method used for deriving a physical material property from the electrical properties measured with GPR is widely used for other applications such as for soil water content estimation [16,17,18,19,20].
PDP is an air-launched GPR, which follows the established principles of operation for GPR [21]. The PDP differs from a traditional GPR in that the system does not display GPR raw data in an image form but processes the data to obtain a real-time measure of surface reflectivity which is displayed as an apparent permittivity value. The PDP is designed to be a fit for purpose system that automatically provides a real-time graphical display of the selected density indicator while the user collects data. The various PDP output display options are discussed in the next section.
The instrument is placed at a height above the road surface and the amplitude and two-way travel time of the signal reflected off that surface are recorded, as shown in Figure 2. PDP operates at a nominal height of ~0.5 m so that the travel time to the pavement surface and back allows for the direct and reflected signals to be clearly separated in time. Its maximum height limit is ~1.0 m as dictated by emissions standards and regulations [22,23]. PDP data positions are normally acquired at equal spatial intervals, using an odometer, which are georeferenced using either the internal unit GPS or a high accuracy external GPS.
The normal incident reflection coefficient R of an EM wave at the air/ground interface is described by Equation (1) and it is determined by the contrast in EM impedance Z (and hence, in kr) between the air and the ground:
R = Z Z 0 Z + Z 0 = 1 k r 1 + k r   ,
where Z 0 is the EM impedance of air, Z = Z 0 / k r   is the impedance of the ground (pavement) material, and k r is the dielectric permittivity of the ground material. It must be noted that R is always less than zero and that for this expression to be strictly valid the following assumptions are made: (a) Ground conductivity should be sufficiently small to be ignored; (b) surface should be planar and smooth; (c) subsurface should be homogeneous; and (d) EM waves should be vertically incident on the air/ground interface.
The amplitude, Ar, of the reflected wavelet from the ground surface is dependent on the magnitude of R. By comparing the reflected amplitude with the amplitude Am of a wavelet measured at the same elevation over a metal plate target, Am (which theoretically has an R equal to –1), we can calculate the dielectric permittivity (or else, relative permittivity or dielectric constant) of the material, kr, using Equation (2):
k r = ( 1 R 1 + R ) 2 = ( 1 + A r A m 1 A r A m ) 2 ,
For the kr (or else, kmix as it will be referred to later) computation, this relationship assumes normal incident signals but can be modified if non-normal incidence is a factor in system design.
A common question arising with air-launched GPR systems is the sensing depth of the surface reflection signal. We have employed numerical modelling to produce an estimate of the effective depth of investigation (or else, sampling depth) using an air-launched GPR system, which was then confirmed with field tests with the PDP [24]. For the kr estimation, our data analysis showed that with appropriate signal time gating we could obtain kr values that are closer to the top layer relative permittivity and sampling depth has its minimum value in this case. The parts of the signals arriving later in time, carry information from deeper layers and hence, the depth of investigation increases. For a physical model that resembles PDP, sampling depth varies from ~20 to 80 mm and depends on the signal analysis approach that has been employed. It should be noted that the analysis method can be altered depending on the application. Various methods are used for the amplitude quantification such as the peak signal or the RMS signal amplitude over a time window.
For PDP’s default configuration, the volume it senses is ~300 mm in diameter on the pavement surface (this is a product of the antenna beam and the zone of influence at its default operational height which is equal to 0.5 m), and ~80 mm in exploration/sampling depth. The standard spatial sampling interval is 100 mm, meaning that for every PDP footprint on the road surface (i.e., 300 mm), three samples are acquired. Consistent spatial sampling is controlled by a calibrated odometer (sometimes referred to as distance measurement indicator (DMI)). This way, footprints overlap and adequate sampling occurs so as there are no gaps in the measured data. The PDP frequency band and height were selected such that the antenna beam and the Fresnel zone or zone of influence (~300 mm in diameter) would be similar to the minimum size of pavement heterogeneity that seems to be of concern during paving jobs. All the above parameters are optimized for the instrument’s normal deployment at approximately walking speed (~1 m/s) for this specific application. However, the instrument’s core elements are extremely flexible and many are software controlled, meaning the system could be customized for other applications (such as asphalt thickness, road-base evaluation, etc.). The goal in the PDP development was to make a specific fit for purpose device. Other general-purpose GPR products already exist and are available to address other applications.
As PDP is an air-launched GPR system, surface roughness can be an important factor affecting the surface reflection amplitude data. When new pavement surfaces are rolled, their surface is considered flat (surface roughness is in the order of a few millimeters) and the PDP measurements which are in the ~1.0 to 2.0 GHz range are not greatly affected. When the asphalt pavement surface is roughly milled or pitted with age, roughness in the 10-to-20-millimeter scale is observed to affect the measured response and reflection amplitudes are substantially reduced due to the energy being scattered [16,17].
Water has a major impact on the permittivity of materials and surface water can be present during paving. Some compactors spray water on the asphalt pavement surface to avoid asphalt particles sticking to the roller. The presence of a thin layer of water on the asphalt pavement surface can affect the kr estimation and hence, the derived density value [25,26]. We have performed modelling to look at the magnitude of the water effect and the results show that the impact of surface water is very substantial (i.e., even 1 mm thick free water layer on the asphalt pavement surface alters the measured kr value more than 150%). Therefore, PDP surveys should be performed when the pavement surface is visually dry. Fortunately, asphalt is emplaced at high temperatures and surface water from compaction evaporates quickly.

4. Density Derivation from PDP Responses

At this point, it is important to stress the need to separate (a) instrument stability in providing correct dielectric permittivity values from (b) the role of the “interpretation model” that transforms kr values into density (or air void content). Regarding (a), if the individual instrument being used suffers from calibration errors or stability issues, inconsistencies will make their way into the dielectric permittivity values being measured and hence, the permittivity to density transformation process becomes instrument dependent. PDP is a factory calibrated instrument designed to make the permittivity estimate instrument independent. When it comes to (b), the permittivity to density transformation depends on the interpretation model being used. Not all asphalt mixes are the same and the relationship is to some degree mix dependent [27,28]. It is important to understand the need to avoid merging instrument errors and biases with the interpretation model differences within the permittivity to density translation and to be careful not to mix these two.
Regarding the interpretation model, there has been substantial previous work showing that the electrical properties of HMA (i.e., its electrical relative permittivity, kr) are closely related to its density, ρ or similarly, to its air void content Vair [25,26,27,28,29,30,31,32,33,34,35,36]. This conversion is referred to as the “kr to ρ” transformation and there are two main approaches to it. The first approach is using empirical relationships to connect ρ and kr (i.e., these relationships are derived from the correlation of permittivity and core density data obtained from various pavement locations and types of asphalt pavements). The second approach employs EM mixing theory according to which there is a relationship between the dielectric permittivity of a mixture and the homogeneous dielectric and the volumetric proportions of its components.
The relative permittivity to density conversion is a subject that is constantly being assessed. To demonstrate the concept of the “kr to ρ” conversion, we use a simple model which bases the computation on a geometrical mean of the components, historically known as Lichtenecker’s formula [37]. The form for predicting permittivity k r for a known density ρ is expressed as
k r = β ρ
Alternately, density can be expressed as
ρ = l n k r l n β
From the assessment of geologic materials [38], β is found to be in the range of 1.9 to 2.2. Since an asphalt mix is primarily aggregate, this model is useful for asphalt pavement. To provide some flexibility for accommodating the effects of mixtures, the value of β can be adjusted.
While such a relationship is helpful for qualitative analysis, details on a specific asphalt mix are needed to determine the maximum density, ρ m a x , when no air is present in the fully compacted material. This requires a controlled sample of material and a true density measurement. If the fully compacted pavement density is known, then, the relative (or normalized) density, ρ n , and air void ratio, V a , can be computed and displayed using the following simple relationships:
ρ n = ρ ρ m a x
V a = 1 ρ n
where ρ m a x is reduced to a value equal to ρ when there is air in the mix. Note that density prediction errors are shown to be higher when the air void content in the asphalt mix is more than ~11% and also, the density prediction accuracy greatly depends on the mix type being used (i.e., binder mix, aggregate properties, surface layer type, etc.) [27,28].
Many other alternatives for the “kr to ρ“ conversion can be employed if desired [25,26,27,28,29,30,31,32,33,34,35,36]. The complex refractive index model (CRIM) formula [39] is one of the more mainstream approaches for estimating the bulk relative permittivity of heterogeneous materials but requires more in-depth knowledge of the individual material properties. The references provided indicate the various methodologies.
More specifically, PDP can provide a display of one of the following five outputs on the fly, while the user is collecting data. The available displays and calculations described below can be found in [40], which describes the PDP toolkit, a dedicated software that allows users to import and reprocess PDP data. However, we would like to stress the ability of the instrument to provide real time feedback:
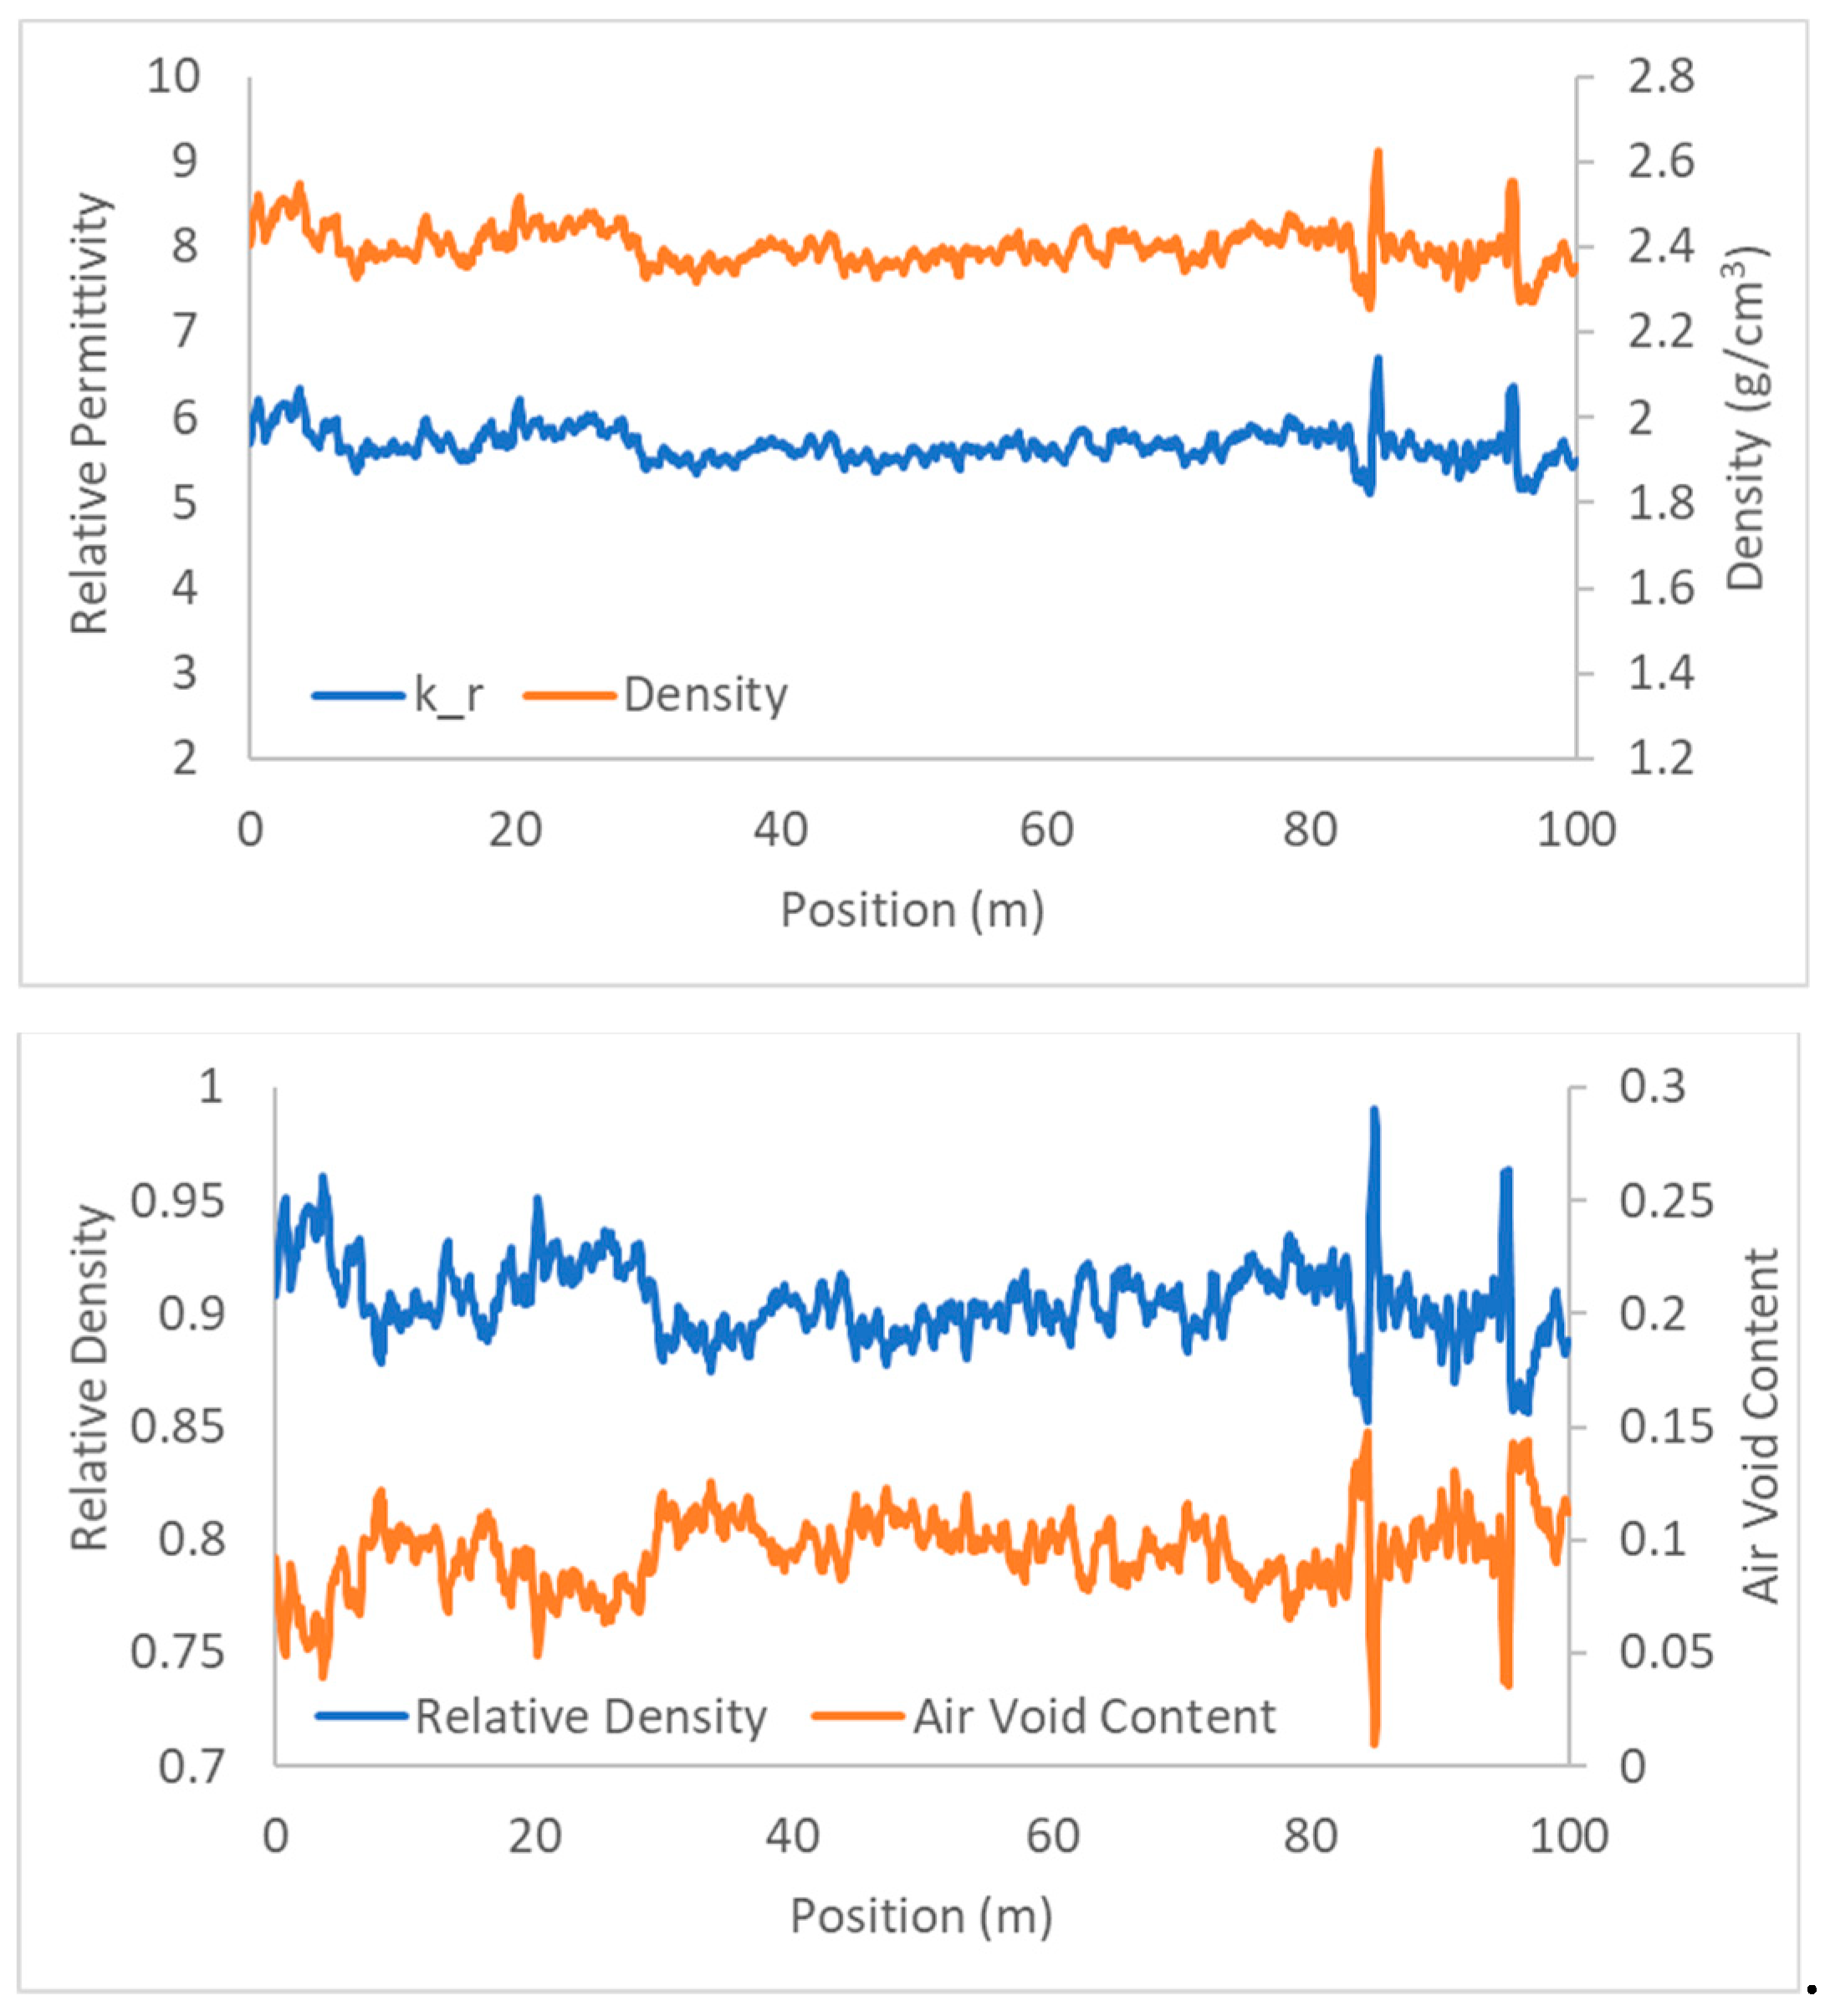
  • Relative dielectric permittivity (kr): This is the initial value calculated by PDP. kr is expressed as a unitless quantity relative to the permittivity of free space. All other parameters below are derived from the relative permittivity.
  • Density (ρ): This is a display for an absolute density of the asphalt, expressed in units of g/cm3, calculated from the observed relative permittivity. If the user has a core sample with a known density value, a density offset can be applied, such that the measured PDP parameter at the core location equals the known density of the core. This offset is then applied to all the PDP data.
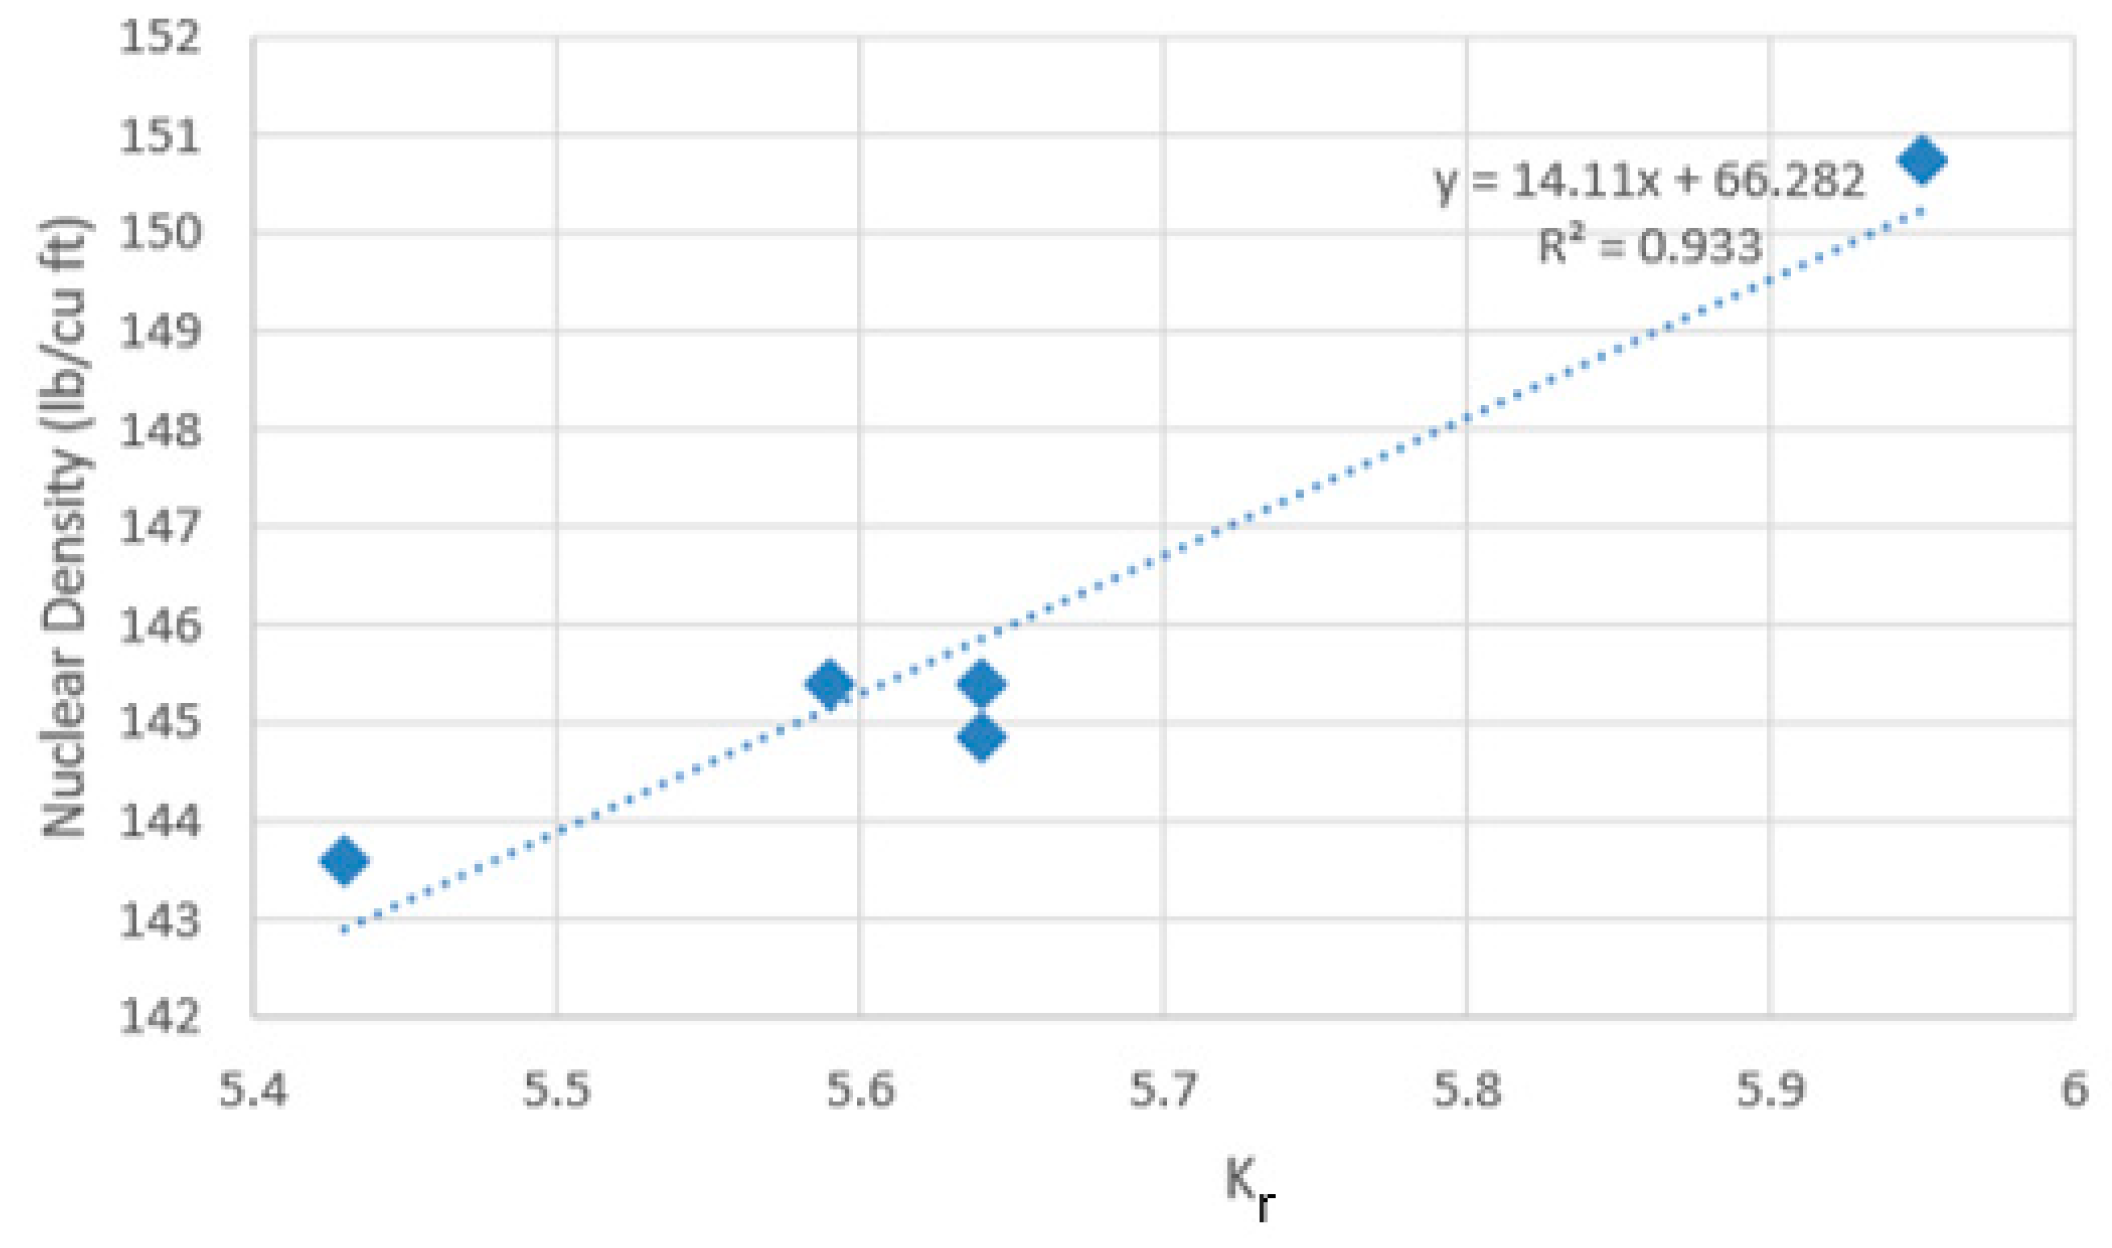
  • Density (ρ)—site specific: Measurements of the asphalt properties at the survey site are used to create a unique, site-specific means of translating relative permittivity to density. When the information is available (either from direct density measurements done on cores or from indirect measurements such as using nuclear density gauges), other parameters such as relative density can be displayed in addition to the absolute density of the asphalt, expressed in units of g/cm3. This is a more complex calculation that relies on inputting the coefficients of a parametric relationship as well as the maximum density ( ρ m a x ). These values can be obtained from a core sample. While more complex, this is a more accurate representation of the true density at the survey site.
  • Relative density ( ρ n ): As stated already, this quantity is sometimes called normalized density or percentage compaction. This output expresses the density measured as a percentage of the site-specific maximum density. To calculate ρ n , the user must provide ρ m a x . This is usually obtained from a core sample via a testing lab (note that: ρ n = 1 V a ).
  • Air void content ( V a ): It is expressed as a percentage of how much of the volume of the asphalt is air. This also requires inputting ρ m a x (note that: V a = 1 ρ n ).
Regardless of the specifics defined above, our intent here is to show the step of transitioning from the electrical property measured to the inference of density. As this subject is an area of advancement, there is no “right” or unique transition. Practical field methodologies are normally used to get to a desired result and different groups use differing end results for their asphalt compaction quality metric.

5. Field Examples

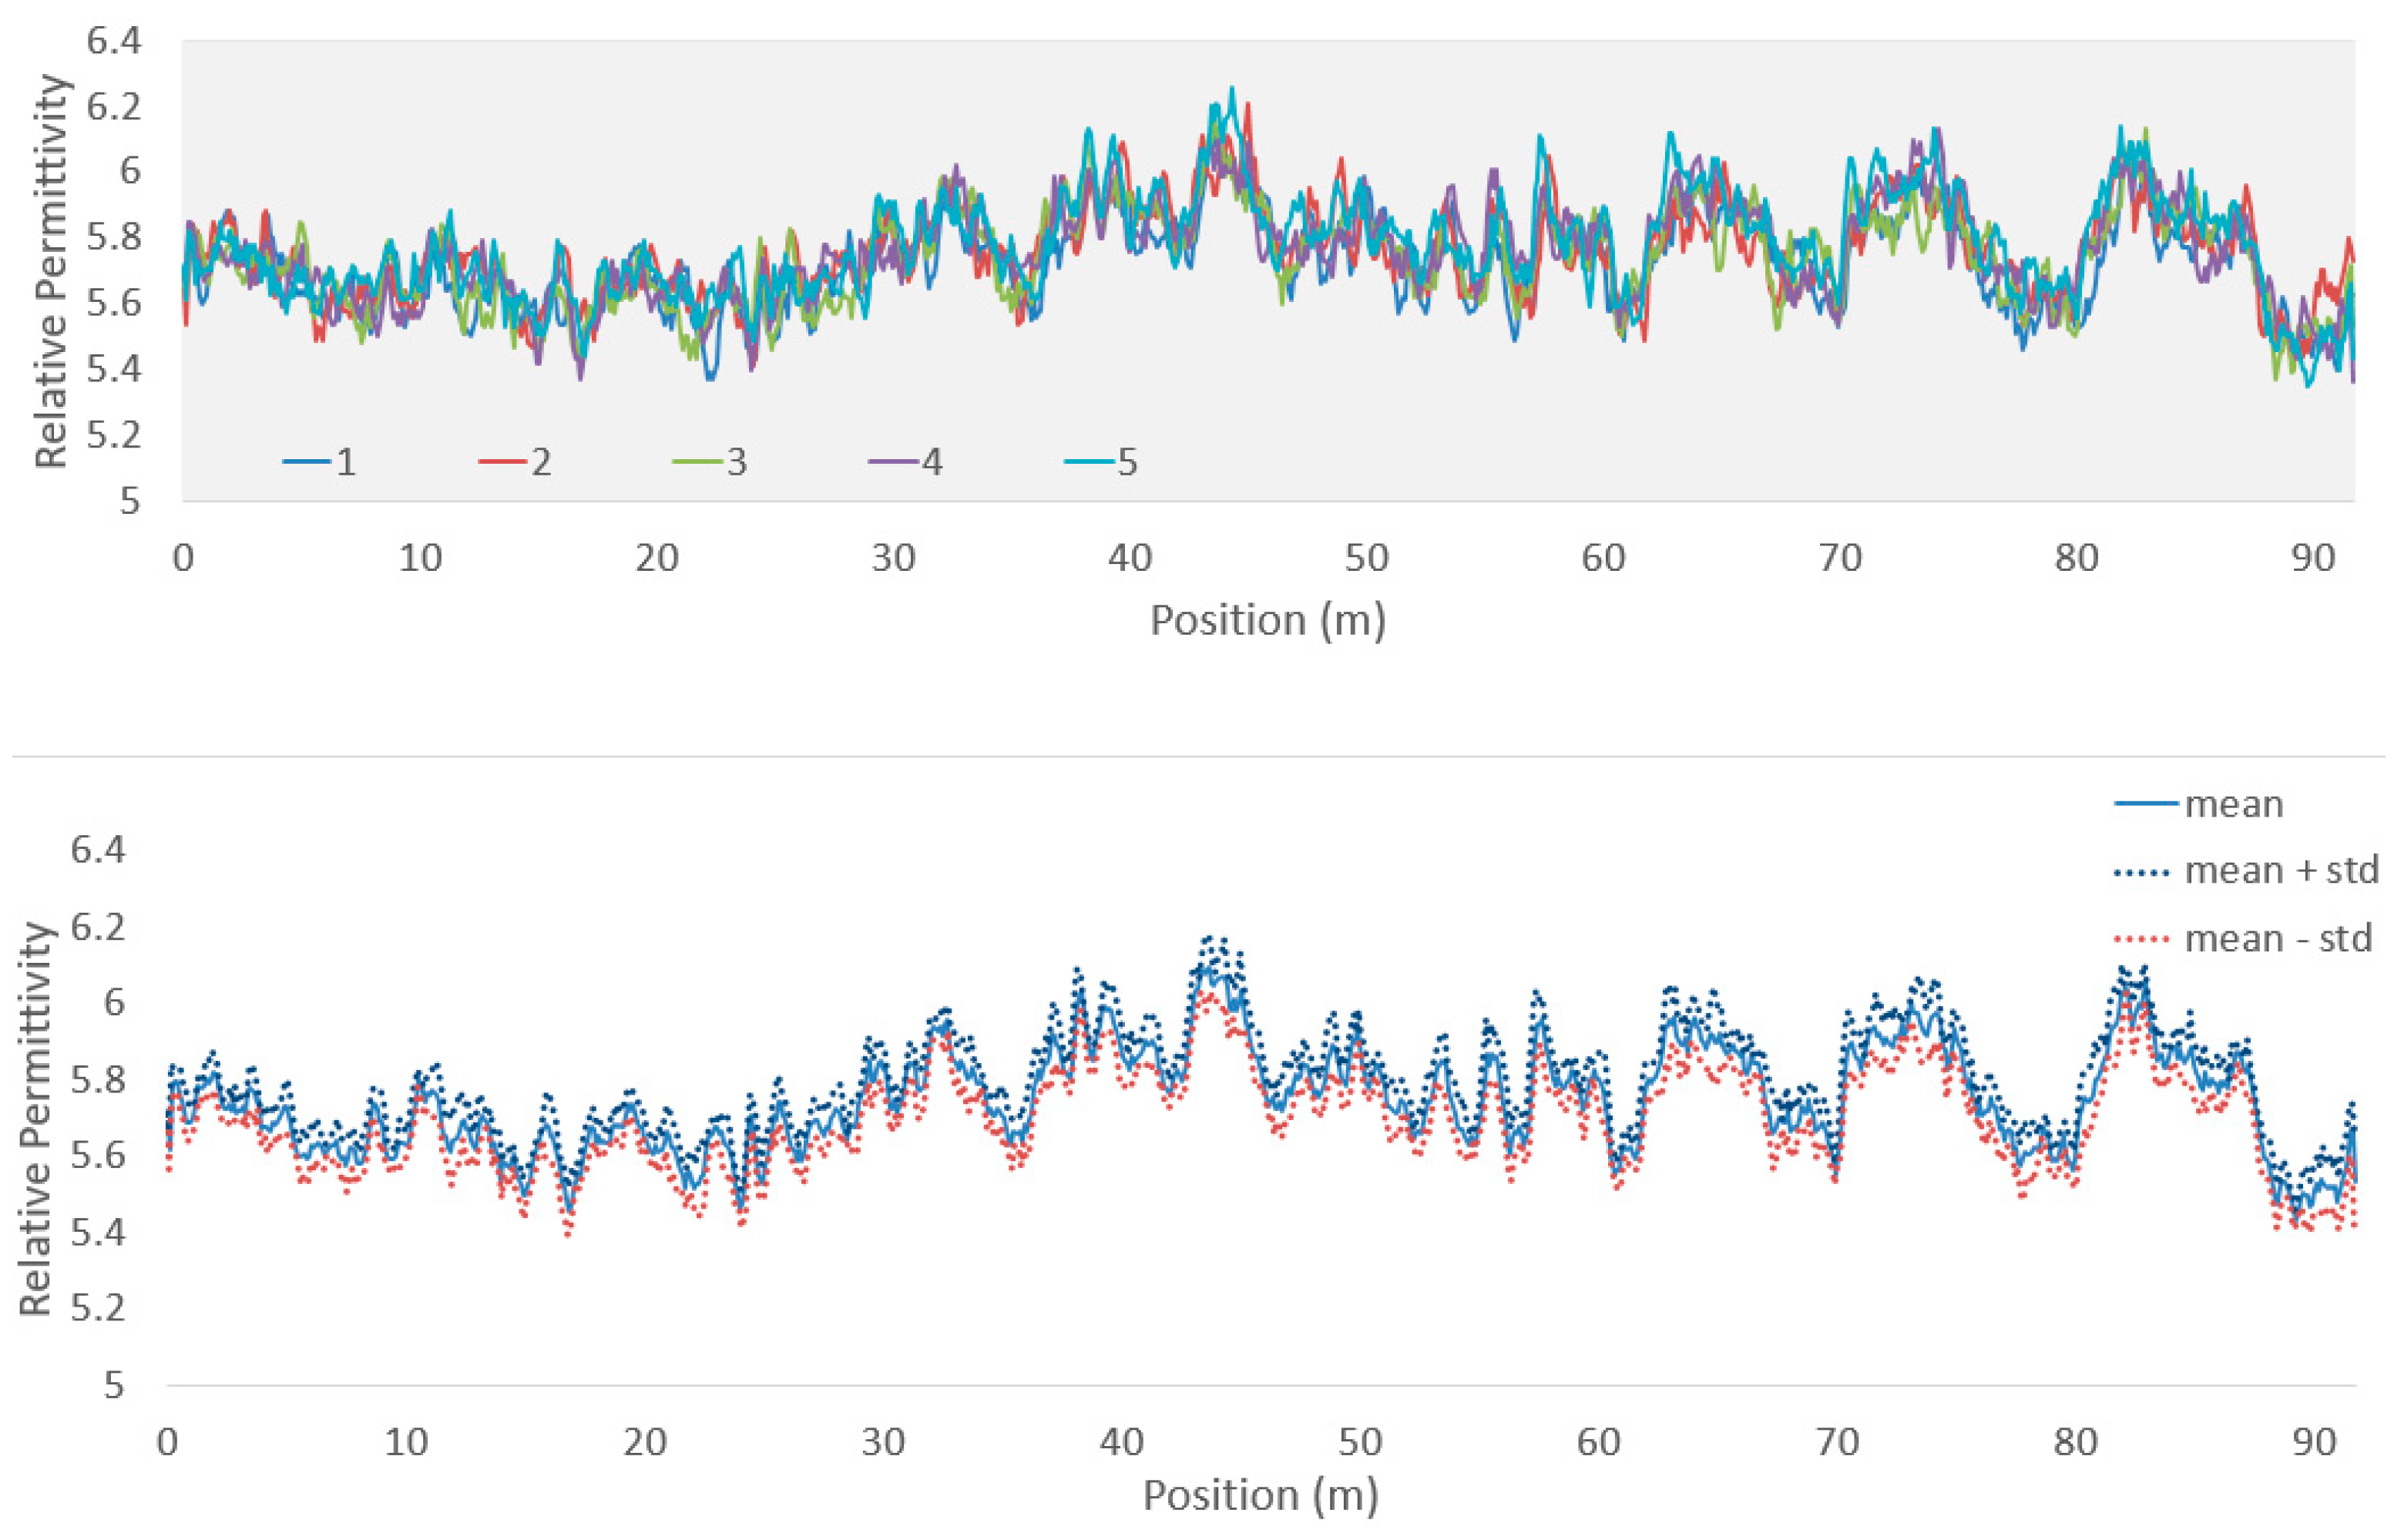
5.1. Repeatability Demonstration

The first example is shown to demonstrate the repeatability and reliability of PDP data. Testing has been performed in Minnesota, USA, on a road surface that had been shaved and a single lift of about 25 mm of asphalt had been placed on the milled surface. The testing location was a recently resurfaced road. After the old asphalt was shaved, the road was covered with a single layer of new asphalt that was laid in two strips with a longitudinal joint near the center of the lane. Five PDP repeat profiles were collected on a ~90 m long test line parallel to the road centerline. The PDP device was placed on a cart and data were collected with an odometer triggering to acquire data at ~10 cm intervals. The PDP repeat data for the 90 m long line for all the five passes are shown in Figure 3 (top) in the form of the relative permittivity versus position. In addition, the bottom part of Figure 3 illustrates the average kr value of the five passes at each position along the line, plotted together with their ± standard deviation at each location. All the profiles show strong repeatability. Minor positioning errors might occur due to the odometer or small variations in the PDP lateral position from pass to pass. However, the overall location of high and low kr values is remarkably good.
To enable the comparison of nuclear density and kr values, five locations were identified along the ~90 m long repeatability line as high and low relative permittivity spots and were tested with a nuclear density gauge (details on this test can be found in [14]). Figure 4 presents the correlation of the density with the relative permittivity data obtained from PDP.
In HMA pavements, a weak spot appears to be the joint between adjacent mats. At the test site, the centerline joint was clearly visible, as shown in Figure 5 (left). A cross-lane test was set up and traverse lines to the pavement’s long dimension were collected with PDP and repeated five times. The transect crossed the joint at ~4 m, as it can be seen also from the PDP cross-lane data which are presented in the form of kr versus position (Figure 5, right). The centerline joint appears as a low dielectric permittivity area. With regards to the data consistency, PDP data are again shown to be repeatable and the overall system’s performance is reliable.

5.2. Full Lane Plan Map

PDP was employed in a pavement quality control project where data were collected during an active paving job in Brampton, ON, Canada (Figure 6, left). The roadway was a two-lane road where the asphalt pavement was laid in three lifts. The primary goal of the survey was to map the full lane width to obtain a good indication of kr (or density) variability. A grid was established to survey both lanes of the road, consisting of lines perpendicular to the road alignment. For the example shown here, only a part of the grid is presented (i.e., an area of ~7 by 8 m2) to show the variability more clearly. Nine parallel lines were surveyed at 1 m spacing. In order to provide a more comprehensive view, the multiple line data were merged to form a color map to show the measurement variability over the area covered. The color map of the relative permittivity is shown in Figure 6 (right). The key observation is the low kr values near the center of the x–axis of the grid that goes all the way along the y–axis. This low kr (hence, low ρ) area is due to the joint between the two lanes present at the middle of the pavement.

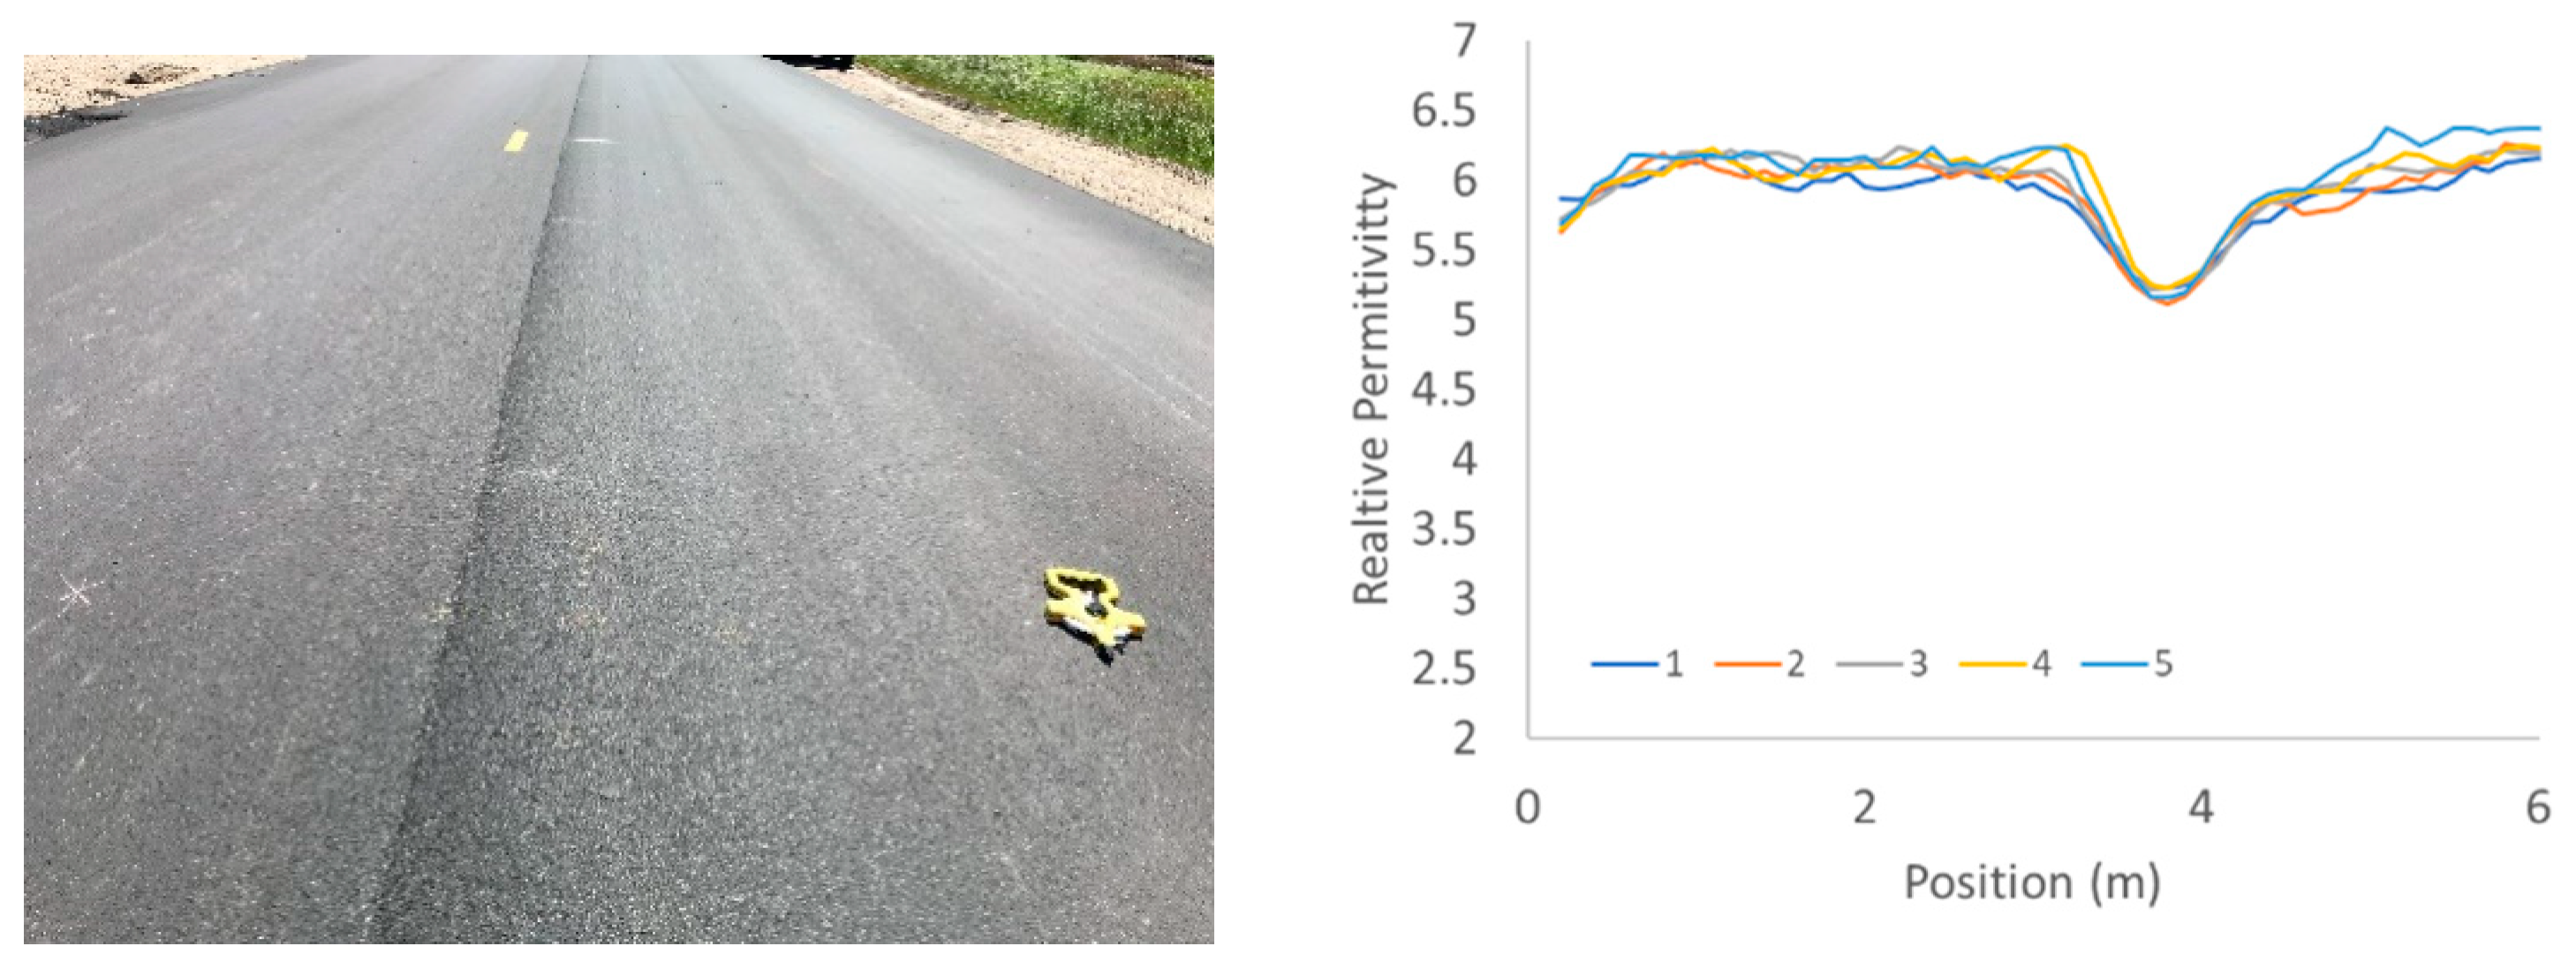
5.3. Various Output Displays

As discussed earlier, the translation from relative permittivity values to density values is a topic that still requires further research. In most cases, the translation methodology occurs by correlating core density data to kr data. Various groups have a preference on the output they would like to see which could be any amongst density, relative or normalized density, air void ratio, etc. Figure 7 displays various output formats of PDP data that were collected along an asphalt bicycle path that was repaved. To obtain density values from the kr data, we used Lichtenecker’s formula [37]. The air void content values are higher than the values encountered in most asphalt pavements. This is reasonable due to the fact that bicycle paths do not carry as heavy loads as pavements do, so, they are not compacted as much.
Since PDP—or any other air-launched GPR system—measures relative permittivity and also, given that the kr transformation to density is material specific in most cases, displaying the kr variations is often the most practical display option for evaluating the asphalt pavement placement uniformity in the field, rather than absolute density values. Each user group has specific design specifications and needs to develop their specific data presentation form that meets their workflow and validation requirements.

6. Discussion and Conclusions

The asphalt pavement density is an important factor in indicating if the asphalt mix has been rolled to achieve the pavement design specifications. The goal of the PDP device is to accurately determine permittivity from the surface reflection and provide translation tools to estimate asphalt pavement density or air void content from the measured permittivity. Extensive field testing of this application to date indicates that the permittivity to density translation is site specific (which is relative to the asphalt mix used and how it is installed).
It is important to separate instrument calibration and stability from the derived density values. PDP produces repeatable, stable results when it comes to determining the dielectric permittivity of the pavement. The accuracy of the absolute density value strongly depends on the interpretation model being used for the “kr to ρ transformation”. As a result, using relative density variability rather than density absolute values is more practical. Given that determining absolute density may be challenging, relative variations in either density or permittivity provide a powerful means for assessing the uniformity of compaction at a site. The natural conclusion is using the permittivity values directly and a physical sample (i.e., core and measure density) in anomalous areas as a most efficient way of assessing pavement placement consistency.
The interpretation model that helps derive density values from dielectric permittivity data is typically simplified, as most interpretation models to date have been focused on estimating the asphalt permittivity assuming a uniform half-space. More advanced interpretation approaches are available [41] that can handle layered and/or graded media using full wave inversion resulting in a suitably weighted average permittivity.

Author Contributions

Conceptualization, N.D., A.P.A., S.R.J. and D.K.; methodology, N.D., A.P.A., S.R.J. and D.K.; validation, N.D., A.P.A., S.R.J. and D.K.; formal analysis, N.D., A.P.A., S.R.J. and D.K.; investigation, N.D., A.P.A., S.R.J. and D.K.; writing—original draft preparation, N.D.; writing—review and editing, N.D., A.P.A., S.R.J. and D.K.; supervision, A.P.A.; project administration, A.P.A. All authors have read and agreed to the published version of the manuscript.

Funding

This research received no external funding.

Institutional Review Board Statement

Not applicable.

Informed Consent Statement

Not applicable.

Data Availability Statement

The data used in this research are available from the authors upon reasonable requests.

Conflicts of Interest

The authors declare no conflict of interest.

References

  1. Zube, E. Compaction Studies of Asphalt Concrete Pavement as Related to the Water Permeability Test. In Proceedings of the 41st Annual Meeting of the Highway Research Board, Washington, DC, USA, 8–12 January 1962. [Google Scholar]
  2. Santucci, L.E.; Allen, D.D.; Coats, R.L. The Effects of Moisture and Compaction on the Quality of Asphalt Pavements. Assoc. Asph. Paving Technol. 1985, 54, 168–208. [Google Scholar]
  3. Ford, M.C. Pavement Densification Related to Asphalt Mix Characteristics. In Proceedings of the 1988 Annual Meeting of the Transportation Research Board, Washington, DC, USA, January 1988. [Google Scholar]
  4. Brown, E.R.; Cross, S. A Study of In-Place Rutting of Asphalt Pavements. In Proceedings of the 1989 Annual Meeting of the Association of Asphalt Paving Technologist, Nashville, TN, USA, 22–26 February 1989. [Google Scholar]
  5. Brown, E.R.; Collins, R.; Brownfield, J.R. Investigation of Segregation of Asphalt Mixtures in State of Georgia. In Proceedings of the 68th Annual Meeting of the Transportation Research Board, Washington, DC, USA, 22–26 January 1989. [Google Scholar]
  6. Brown, E.R. Density of asphalt concrete: How much is needed? Transp. Res. Rec. J. Transp. Res. Board 1990, 1282, 27–32. [Google Scholar]
  7. Huber, G.A.; Heiman, G.H. Effect of Asphalt Concrete Parameters on Rutting Performance: A Field Investigation. In Proceedings of the Association of Asphalt Paving Technologists 56, Reno, NV, USA, February 1987; pp. 33–61. [Google Scholar]
  8. Roberts, F.L.; Kandhal, P.S.; Brown, E.R.; Lee, D.Y.; Kennedy, T.W. Hot Mix Asphalt Materials, Mixture Design, and Construction; National Asphalt Paving Association Education Foundation: Lanham, MD, USA, 1996. [Google Scholar]
  9. Killingsworth, B.M. Quality Characteristics for Use with Performance Related Specifications for Hot Mix Asphalt; NCHRP Project 9-15 Research Results Digest 291; Transportation Research Board, National Research Council: Washington, DC, USA, 2004. [Google Scholar]
  10. Commuri, S. Intelligent Asphalt Compaction Analyzer; Final Report FHWA-HIF-12-019; University of Oklahoma: Norman, OK, USA, 2011. [Google Scholar]
  11. AASHTO T 166. Standard Method of Test for Bulk Specific Gravity (G mb) of Compacted Asphalt Mixtures Using Saturated Surface-Dry Specimens; WSDOT Materials Manual M 46-01.37; American Association of State Highway and Transportation Officials (AASHTO): Washington, DC, USA, 2020. [Google Scholar]
  12. AASHTO. Asphalt Surface Dielectric Profiling System Using Ground Penetrating Radar; American Association of State Highway and Transportation Officials (AASHTO) Standard Practice; Designation: PP 98-201; AASHTO: Washington, DC, USA, 2020; pp. 98.1–98.9. [Google Scholar]
  13. Diamanti, N.; Redman, J.D.; Annan, A.P. A GPR-based Sensor to Measure Asphalt Pavement Density. In Proceedings of the 17th International Conference on Ground Penetrating Radar, Rapperswil, Switzerland, 18–21 June 2018. [Google Scholar]
  14. Diamanti, N.; Annan, A.P.; Jackson, S.R. Measuring Asphalt Pavement Density with a GPR-based Sensor: A Case Study. In Proceedings of the 10th International Workshop on Advanced Ground Penetrating Radar, The Hague, The Netherlands, 8–12 September 2019. [Google Scholar]
  15. Mallick, R.B.; El-Korchi, T. Pavement Engineering: Principles and Practice; CRC Press: Boca Raton, FL, USA, 2009. [Google Scholar]
  16. Chanzy, A.; Tarussov, A.; Bonn, F.; Judge, A. Soil Water Content Determination Using a Digital GPR. Soil Sci. Soc. Am. J. 1996, 60, 1318–1326. [Google Scholar] [CrossRef]
  17. Redman, J.D.; Davis, J.L.; Galagedara, L.W.; Parkin, G.W. Field Studies of GPR Air Launched Surface Reflectivity Measurements of Soil Water Content. In Proceedings of the 9th International Conference on Ground Penetrating Radar, Santa Barbara, CA, USA, 29 April–2 May 2002; pp. 156–161. [Google Scholar]
  18. Redman, J.D.; Galagedara, L.; Parkin, G. Measuring soil water content with the ground penetrating radar surface reflectivity method: Effects of spatial variability. In Proceedings of the ASAE Annual International Meeting, Las Vegas, NV, USA, 27–30 July 2003. Paper Number: 032279. [Google Scholar]
  19. Serbin, G.; Or, D. Near-surface water content measurements using horn antenna radar: Methodology and overview. Vadose Zone J. 2003, 2, 500–510. [Google Scholar] [CrossRef]
  20. Huisman, J.A.; Hubbard, S.S.; Redman, J.D.; Annan, A.P. Measuring soil water content with ground penetrating radar. Vadose Zone J. 2003, 2, 476–491. [Google Scholar] [CrossRef]
  21. Annan, A.P. Ground-Penetrating Radar. In Near-Surface Geophysics; Butler, D.K., Ed.; Society of Exploration Geophysicists (SEG): Tulsa, OK, USA, 2005; No. 13, Chapter 11; pp. 357–438. [Google Scholar]
  22. FCC. USA Regulations on UWB GPR; Federal Communications Commission (FCC) Regulations, Part 15.503; FCC: Washington, DC, USA, 2003. [Google Scholar]
  23. RSS-220 Industry Canada. Devices Using UWB Technology; Radio Standards Specification RSS-220; Industry Canada, 2009; Issue 1; p. 19.
  24. Diamanti, N.; Redman, J.D.; Hogan, C.M.; Annan, A.P. Air-launched GPR depth of investigation. In Proceedings of the 18th International Conference on Ground Penetrating Radar, SEG, Golden, CO, USA, 14–19 June 2020. [Google Scholar]
  25. Shangguan, P.; Al-Qadi, I.; Lahouar, S. Pattern recognition algorithms for density estimation of asphalt pavement during compaction: A simulation study. J. Appl. Geophys. 2014, 107, 8–15. [Google Scholar] [CrossRef]
  26. Shangguan, P.; Al-Qadi, I.L. Calibration of FDTD Simulation of GPR Signal for Asphalt Pavement Compaction Monitoring. IEEE Trans. Geosci. Remote Sens. 2015, 53, 1538–1548. [Google Scholar] [CrossRef]
  27. Leng, Z.; Al-Qadi, I.; Lahouar, S. Development and validation for insitu asphalt mixture density prediction models. NDT & E Int. 2011, 44, 369–375. [Google Scholar]
  28. Wang, S.; Al-Qadi, I.L.; Cao, Q. Factors impacting monitoring asphalt pavement density by ground penetrating radar. NDT & E Int. 2020, 115, 102296. [Google Scholar]
  29. Saarenketo, T.; Roimela, P. Ground Penetrating Radar Technique in Asphalt Pavement Density Quality Control. In Proceedings of the 7th International Conference on Ground Penetrating Radar, Lawrence, KS, USA, 27–30 May 1998; pp. 461–466. [Google Scholar]
  30. Saarenketo, T.; Scullion, T. Road evaluation with ground penetrating radar. J. Appl. Geophys. 2000, 43, 119–138. [Google Scholar] [CrossRef]
  31. Maser, K. Infrasense—Development of a Pavement Thickness Density Meter; NCHRP-61 Final Report; Infrasense Inc.: Arlington, MA, USA, 2002. [Google Scholar]
  32. Sebesta, S.; Wang, F.; Scullion, T.; Liu, W. New Infrared and Radar Systems for Detecting Segregation in Hot-Mix Asphalt Construction; Report: FHWA/TX-05/0-4577-2; Texas Transportation Institute, The Texas A&M University System: Austin, TX, USA, 2002. [Google Scholar]
  33. Saarenketo, T. Electrical Properties of Road Materials and Subgrade Soils and the Use of Ground Penetrating Radar in Traffic Infrastructure Surveys. Ph.D. Thesis, University of Oulu, Oulu, Finland, 2006. [Google Scholar]
  34. Popik, M.; Lee, H.; Aho, B.; Maser, K.; Holzschuher, C. Using ground penetrating radar for evaluation of asphalt density measurements. In Proceedings of the 89th Annual Meeting of the Transportation Research Board, Washington, DC, USA; 2010. [Google Scholar]
  35. Al-Qadi, I.; Leng, Z.; Larkin, A. In-place hot mix asphalt density estimation using ground penetrating radar. In Nondestructive Testing and Evaluation (NDTE) Technologies for Airport Pavement Acceptance and Quality Assurance Activities; ICT Report No. 11-096; University of Illinois: Champaign, IL, USA, 2011. [Google Scholar]
  36. Plati, C.; Loizos, A. Estimation of in-situ density and moisture content in HMA pavements based on GPR trace reflection amplitude using different frequencies. J. Appl. Geophys. 2013, 97, 3–10. [Google Scholar] [CrossRef]
  37. Lichtenecker, K. Die Dielektrizitätskonstante natürlicher und künstlicher Mischkörper. Phys. Zeitschr. 1926, XXVII, 115–158. [Google Scholar]
  38. Olhoeft, G.R. Electrical properties of rocks. In Physical Properties of Rocks and Minerals; Touloukian, Y.S., Judd, W.R., Roy, R.F., Eds.; McGraw-Hill: New York, NY, USA, 1981; pp. 257–330. [Google Scholar]
  39. Birchak, J.R.; Gardner, C.G.; Hipp, J.E.; Victor, J.M. High dielectric constant microwave probes for sensing soil moisture. Proc. IEEE 1974, 62, 93–98. [Google Scholar] [CrossRef]
  40. Sensors & Software Inc. PDP Toolkit User’s Guide. v. 2020-00058-00; Sensors & Software Inc.: Mississauga, ON, Canada, 2020. [Google Scholar]
  41. Kalogeropoulos, A.; van der Kruk, J.; Hugenschmidt, J.; Bikowski, J.; Bruhwiler, E. Full-waveform GPR inversion to assess chloride gradients in concrete. NDT & E Int. 2013, 57, 74–84. [Google Scholar]
Figure 1. A cart-mounted (top-left) and a vehicle-based (top-right) PDP system. The bottom plot illustrates the PDP real-time display showing an output of the relative permittivity and its statistics.
Remotesensing 13 02613 g001
Figure 2. PDP instrument background principle of operation. It is an air-launched GPR that transmits through a transmitter (T) a radio wave pulse, which is reflected from the air/ground interface. The receiver (R) records the transient signal, and the surface reflection event (annotated on the right part of the figure) is identified and automatically processed to estimate the asphalt pavement dielectric permittivity, kr. The GPR wave velocity in the subsurface is annotated with v while the free space propagation velocity, c, is equal to 0.3 m/ns.
Remotesensing 13 02613 g002
Figure 3. Plot of the kr values along a 90 m test line with five repeat passes shown to illustrate the PDP data repeatability (top), where numbers 1 to 5 indicate the number of repeats of the test. Plot of the mean kr value at each position along the line, plotted together with the ± standard deviation (bottom). Relative permittivity values range from about 5.40 to 6.20.
Remotesensing 13 02613 g003
Figure 4. Correlation between nuclear density and PDP kr data [14]. A linear model is fitted to the data.
Remotesensing 13 02613 g004
Figure 5. View of the new pavement (left) where the centerline joint response is clearly visible at the ~4 m position during a cross-lane test (right). Numbers 1 to 5 in the right plot indicate the number of repeats of the cross-lane test.
Remotesensing 13 02613 g005
Figure 6. A cart-based PDP (left) and a plan map of kr variation in the grid area (right). The darker areas are of low dielectric permittivity and are most prevalent along the joint between the two lanes (right).
Remotesensing 13 02613 g006
Figure 7. PDP various display output plots with distance traversed along an asphalt bicycle path.
Remotesensing 13 02613 g007
Publisher’s Note: MDPI stays neutral with regard to jurisdictional claims in published maps and institutional affiliations.

