Article

A Method for Quantifying the Impacts of Human Activities on Net Primary Production of Grasslands in Northwest China

1
College of Geography and Environmental Science, Northwest Normal University, Lanzhou 730070, China
2
Cryosphere Research Station on the Qinghai-Tibet Plateau, State Key Laboratory of Cryospheric Science, Northwest Institute of Eco-Environment and Resources, Chinese Academy of Sciences, Lanzhou 730000, China
*
Author to whom correspondence should be addressed.
Remote Sens. 2021, 13(13), 2479; https://doi.org/10.3390/rs13132479
Submission received: 14 May 2021 / Revised: 18 June 2021 / Accepted: 21 June 2021 / Published: 25 June 2021

Abstract

:
Accurately assessing the impact of human activities on net primary productivity (NPP) of vegetation is of great significance to the achievement of sustainable development. However, it is difficult to disentangle the effects of climate conditions and human activities on NPP, and bridging this knowledge gap largely depends on the calculation of the NPP under natural conditions. Here, we propose a method for calculating natural vegetation NPP (NNPP) based on non-human influence grids, which are obtained according to the consistent rate of climate and actual NPP (ANPP) temporal changes. We selected Northwest China as study area, and we used a light use efficiency (LUE) model to estimate ANPP and used the random forest algorithm (RF) to estimate the NNPP. The results show that NNPP is very close to ANPP, and the human activities on NPP (HNPP) based on NNPP is close to the actual situation of human activities on NPP. From 2001 to 2017, the positive HNPP accounts for 40.28% of the total grassland area, with an average value of 28.65 gC·m−2·yr−1, while the negative HNPP accounts for 59.72% of the total area, with an average value of −31.19 gC·m−2·yr−1. The grassland NPP shows an increasing trend, which is dominated by climate factors. Human activity is the dominant factor for the grassland degradation, accounting for 42.78% of the degraded area, but promoting grassland growth in 11.4% of the restored area. This study provides a new method to estimate the impacts of human activities on vegetation, and the results can be used to evaluate the effectiveness of ecological environmental governance, providing a quantitative basis for scientifically building the harmonious relationship between human and nature.

Graphical Abstract

1. Introduction

Grassland is an important part of terrestrial ecosystem, accounting for about 25% of the total land area of the earth [1]. The grassland vegetation carbon pool accounts for 20% of the world’s total [2]. Net primary productivity (NPP) of vegetation is the residual assimilation of autotrophic respiration of all organic matter produced by green plants through photosynthesis [3]. It directly reflects the quality of terrestrial ecosystems, and it is the main factor determining the role of carbon source and sink of the ecosystem [4]. Therefore, quantifying the effects of climate change and human activities on grassland is essential to develop adaptation strategies to cope with climate change and the challenges posed by human activities to ecosystems.
Human activity is an important factor affecting NPP changes [5]. At present, there are several methods to quantitatively calculate the impact of human activities on NPP (HNPP). Based on the land-use change, the NPP can be estimated [6], while this method cannot estimate the anthropogenic effects in areas where the land use unchanged. The climate-sensitive calculation method [7] obtains weights by fitting the sensitivity of NPP to meteorological factor to obtain the NPP anthropogenic influenced value, and this method requires the sensitivity of the NPP includes impacts of human activities. The most widely used method is the difference between actual NPP (ANPP) and potential NPP (PNPP) [8]. The ANPP can be estimated using the improved Carnegie–Ames–Stanford approach (CASA) model [9]. The CASA model calculates NPP based on vegetation physiological process, photosynthetic effective radiation absorbed by vegetation and light energy utilization rate. The model can be used to model long-term and large-scale NPP values [10]. The PNPP is the highest form of vegetation under field conditions, and it corresponds to the NPP of the potential vegetation, and thus PNPP is relatively high. PNPP is generally based on climatological models [11], such as Miami model [12] and Thornthwaite Memorial Model [13]. These models use meteorological factors such as temperature, precipitation, and potential evapotranspiration as input parameters, while soil, topography, and vegetation types were poorly considered [3], which strongly affect vegetation growth [14]. As a result, these methods usually lead to large errors in the simulated PNPP values [15]. Therefore, it is urgent to establish a reliable method to calculate the actual natural NPP under current climate conditions.
Theoretically, if the grids without the effects of human activities can be identified, the ANPP of these grids can be regarded as the natural vegetation NPP (NNPP). Based on this methodology, we selected the northwestern region of China as study area, which accounts for about 41.29% of the China’s grassland [16]. This area is the representative of a fragile ecology, and it is vulnerable to human activities. The main goal of this research is to establish a new estimation method to calculate the HNPP, and the results can provide a new idea for quantifying impacts of human activities on vegetation NPP.

2. Materials and Methods
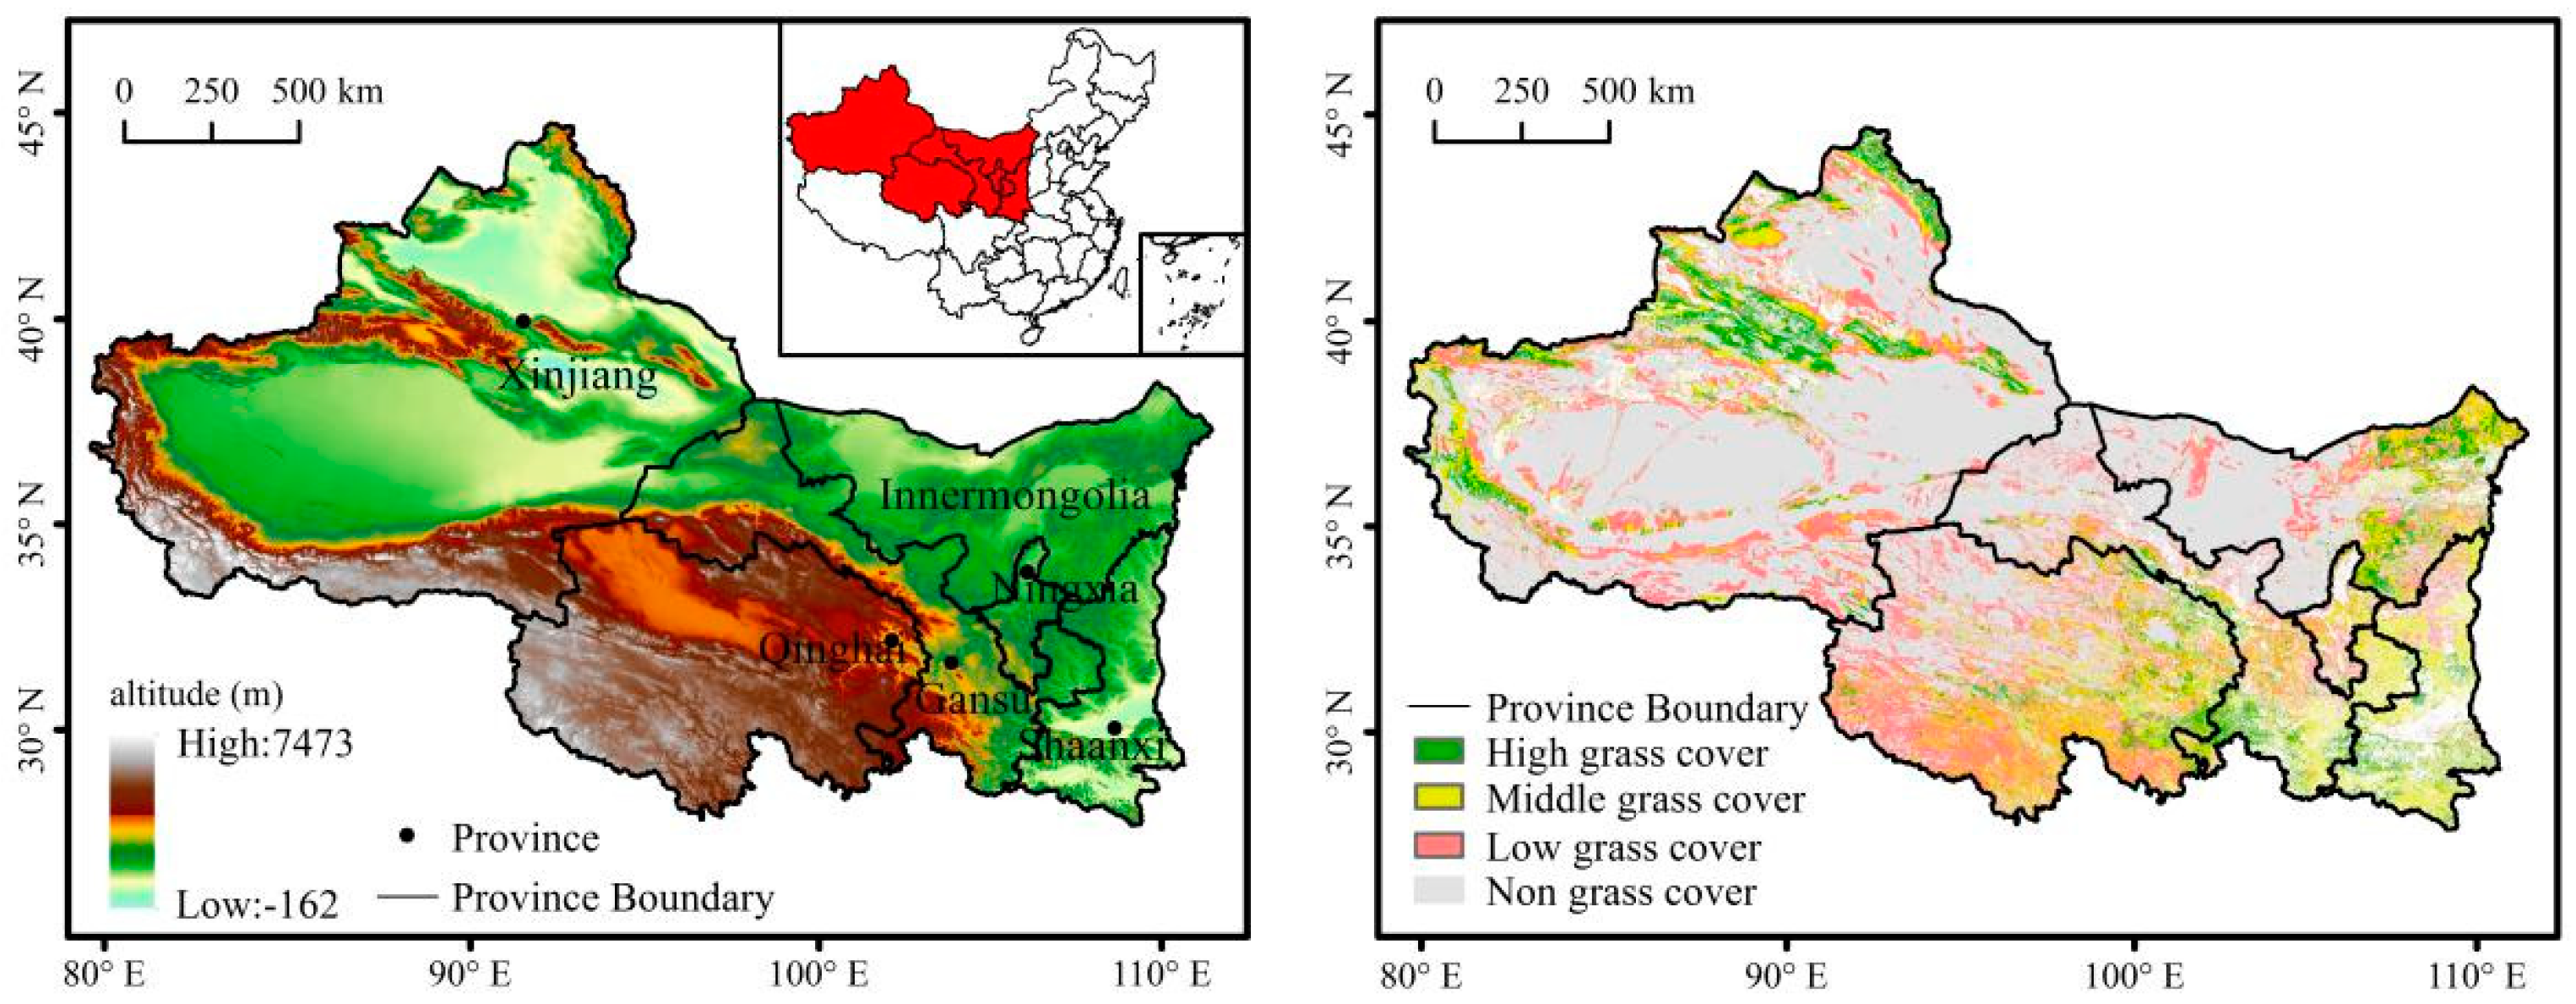
2.1. Study Area

The Northwest China (Figure 1) (31°32′ N–49°10′ N and 73°15′ E–111°50′ E) covers an area of about 3.5 million km2, accounting for 36% of China’s total land area. Located in deep inland, this area has a typical continental temperate climate, with a mean annual air temperature of 5.06 °C. The precipitation is low and gradually decreases from east to west. The topography is dominated by mountains, plateaus, and basins, with an average elevation of 2267 m. The land cover types include forest, grassland, farmland, and desert.

2.2. Data and Processing

The normalized difference vegetation index (NDVI) data, MOD13A3 (1 km, 1 month) from 2001 to 2017, were obtained from the Atmosphere Archive and Distribution System (LAADS) website (https://ladsweb.modaps.eosdis.nasa.gov/, accessed on 12 February 2020). The surface reflectance data were retrieved from the NASA MOD09A1 (1 km, 8 d) product. The solar radiation data (0.125° × 0.125°, 1 month) were downloaded from the Atmospheric Science Data Center (http://eosweb.larc.nasa.gov/project/ceres/ceres_table, accessed on 14 February 2020). The temperature data (0.125° × 0.125°, 1 month) were obtained from the European Center for Medium-Range Weather Forecasts (ECMWF) (http://apps.ecmwf.int/datasets/, accessed on 20 January 2020). The precipitation data (0.5° × 0.5°, 1 month) were derived from the Climatic Research Unit (CRU), version TS4.03 (https://crudata.uea.ac.uk/cru/data/hrg/cru_ts_4.03/, accessed on 23 January 2020). Spatial splicing, format transformation, and projection transformation were performed using MODIS reprojection tools (MRT). The original map projection was converted into Albers Equal Area projection. The maximum value composite (MVC) was used to obtain yearly data. Finally, the bilinear interpolation method was used to resample the three kinds of data at the resolution of 1 km × 1 km [17,18,19].
The digital elevation model (DEM) data, population density data, and land use map were downloaded from the Resource and Environmental Science Data Center of the Chinese Academy of Sciences (http://www.resdc.cn/, accessed on 23 January 2020). The vector data were obtained from the National Basic Geographic Information Center (http://www.ngcc.cn/ngcc/, accessed on 23 January 2020). The grazing data were obtained from the National Bureau of Statistics of China (http://www.stats.gov.cn/, accessed on 23 January 2020), and the livestock data includes the data of the Ningxia region from 2001 to 2017 and the Sanjiangyuan region from 2007 to 2017.
The measured NPP values were derived from field sampling (n = 27) and literatures (n = 71) [20,21]. During field sampling, the grass plot was 25 m × 25 m, and three plots of 30 cm × 30 cm were selected on the diagonal. The above-ground biomass was harvested, the roots were dug out, and the sample was dried (85 °C). After reaching a constant weight, the dry mass was weighed to obtain biomass, and the dry weight was multiplied the conversion coefficient by 0.475 to obtain the NPP [22].

2.3. Methods

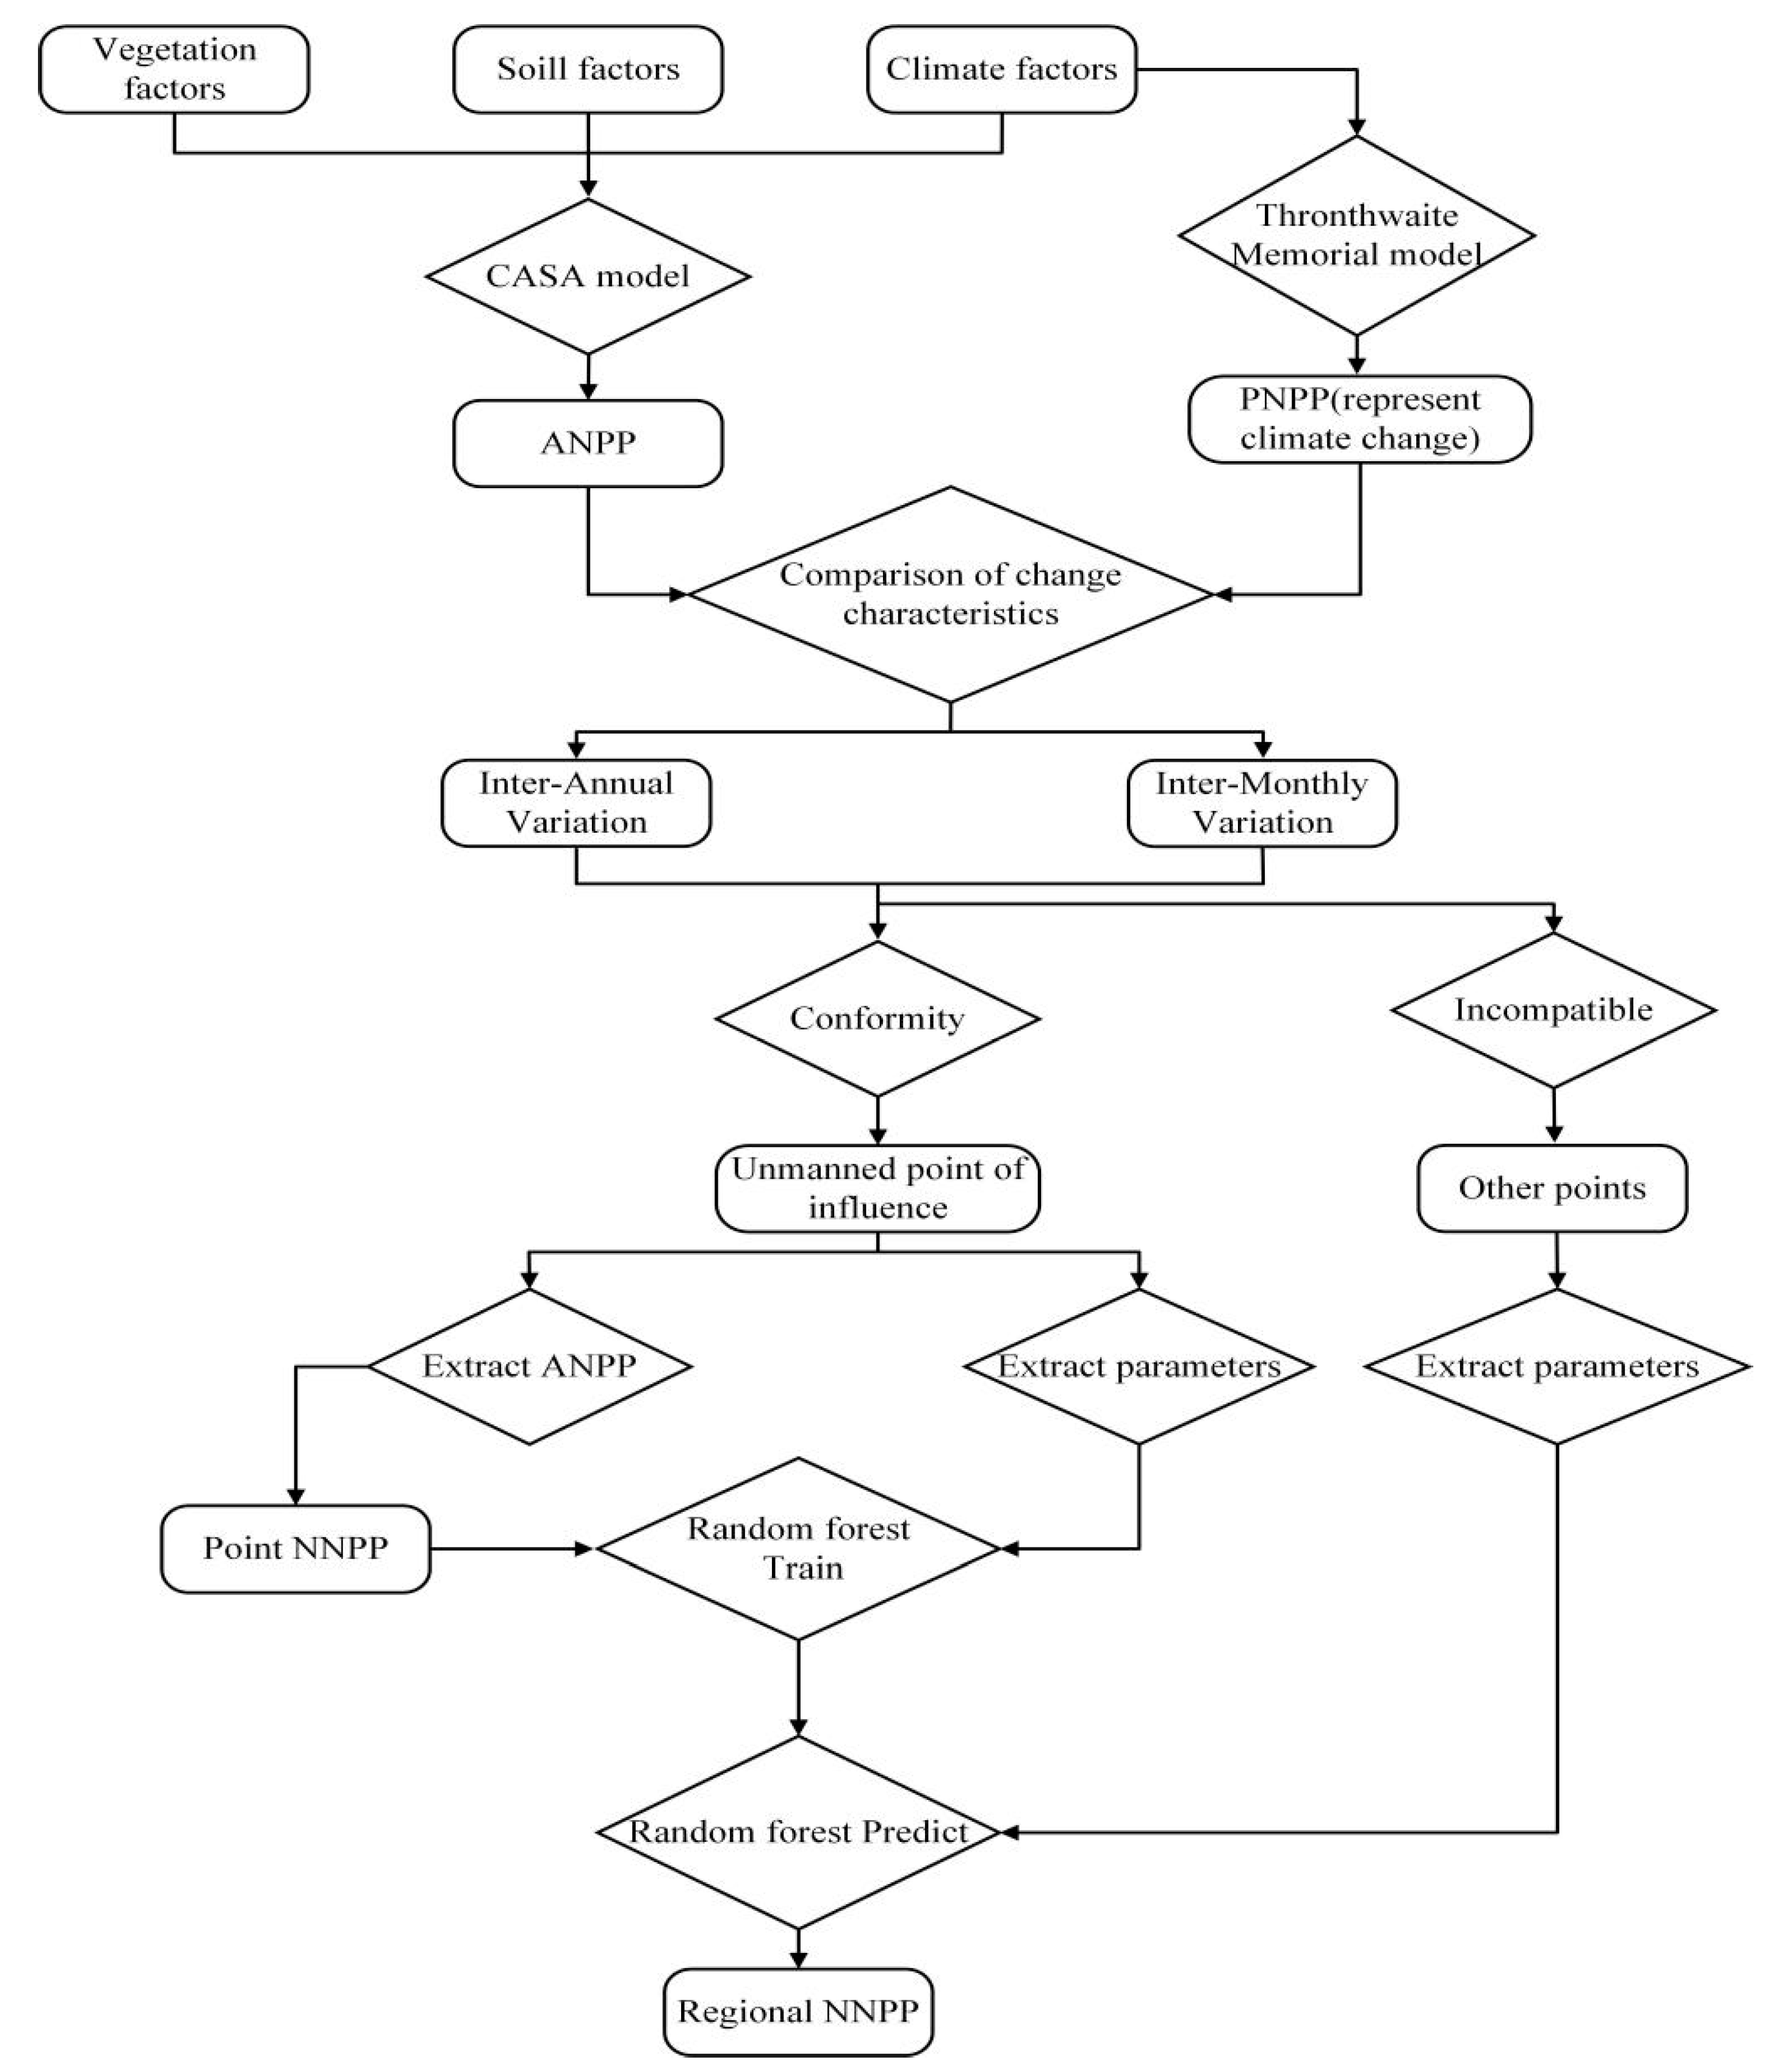
2.3.1. Calculation of ANPP

The CASA model has been widely used to estimate ANPP. This method can estimate NPP over a large region and for long time series [23]. We used the CASA model to calculate ANPP of the grasslands as follows:
ANPP(x,t) = APAR(x,t) × ε(x,t)
where, APAR(x,t) represents the photosynthetically active radiation (MJ·m−2) absorbed by pixel x in month t; and ε(x,t) is the actual light-use efficiency (gC·MJ−1) of pixel x in month t. APAR(x,t) and ε(x,t) are calculated using Equations (2) and (3), respectively.
APAR(x,t) = SOL(x,t) × FPAR(x,t) × 0.5
where, SOL(x,t) represents the total solar radiation (MJ·m−2) of pixel x in month t; FPAR(x,t) represents the absorption coefficient of the vegetation layer on incident photosynthetically active radiation, which is determined by the NDVI; 0.5 is the proportion of SOL intercepted by the vegetation.
ε ( x , t )   =   T ε 1 ( x , t )   ×   T ε 2 ( x , t )   ×   W p ( x , t )   ×   ε max
where, Tε1(x,t) and Tε2(x,t) are the temperature stress coefficients of low and high temperature to light-use efficiency, respectively; Wp(x,t) is the coefficient of water stress, reflecting the influence of the water conditions. The εmax is the maximum light-use efficiency under ideal conditions. The maximum light-use efficiency rate refers to the simulation value of the maximum light energy utilization rate of typical vegetation [24].
We used the NDVI-FPAR lookup table provided in the NASA-MOD15 algorithm to calculate the monthly FPAR. The algorithm is as follows:
F P A R ( x , t )   =   { 0 ,   N D V I     0.075 min ( 1.16   ×   N D V I ( x , t )     0.0439 ) ,   N D V I   >   0.075 }
W p   =   0.5   +   p r e p r e max   ×   [ ( 1     1   +   L S W I 1   +   L S W I max )   +   0.5 ]
where, Wp is the water stress coefficient, pre and premax are the monthly precipitation and the maximum monthly precipitation, respectively.
Wu [25] and Piao [26] suggested that there was a time lag between vegetation growth and climatic factors. Therefore, according to Luo’s result [7], we set the lag of three months in the CASA model for precipitation, i.e., the precipitation prei of this month is the average of the precipitation of this month and the precipitation of the previous three months. The algorithm was expressed as follows:
p r e i   =   1 4   ×   ( p r e i   +   p r e i 1   +   p r e i 2   +   p r e i 3 )
LSWI is the surface water index, which is calculated as follows:
L S W I   =   R E f 2     R E f 6 R E f 2   +   R E f 6
where, REf2 and REf6 are the 2nd and 6th bands of MOD09A1 data, respectively.
Tε1(x,t) = 0.8 + 0.2 × Topt(x) − 0.0005 × [Topt(x)]2
where, Topt is the monthly average temperature (°C) when the NDVI value of a certain region is the highest in a year. When the average temperature of a month is less than or equal to −10 °C, the value is 0 [9].
T ε 2 ( x , t )   =   1.84 { 1   +   exp [ 0.2   ×   ( T o p t ( x )     10     T ( x , t ) ) ] }   ×   1 { 1   +   exp [ 0.3   ×   ( T o p t ( x )     10     T ( x , t ) ) ] }
where, T(x,t) for the average temperature of the month; When the monthly average temperature T(x,t) in a month is 10 °C higher or 13 °C lower than Topt(x,t), the value of Tε2(x,t) in this month is equal to half of that when the monthly average temperature T(x,t) is Topt(x,t) [9].

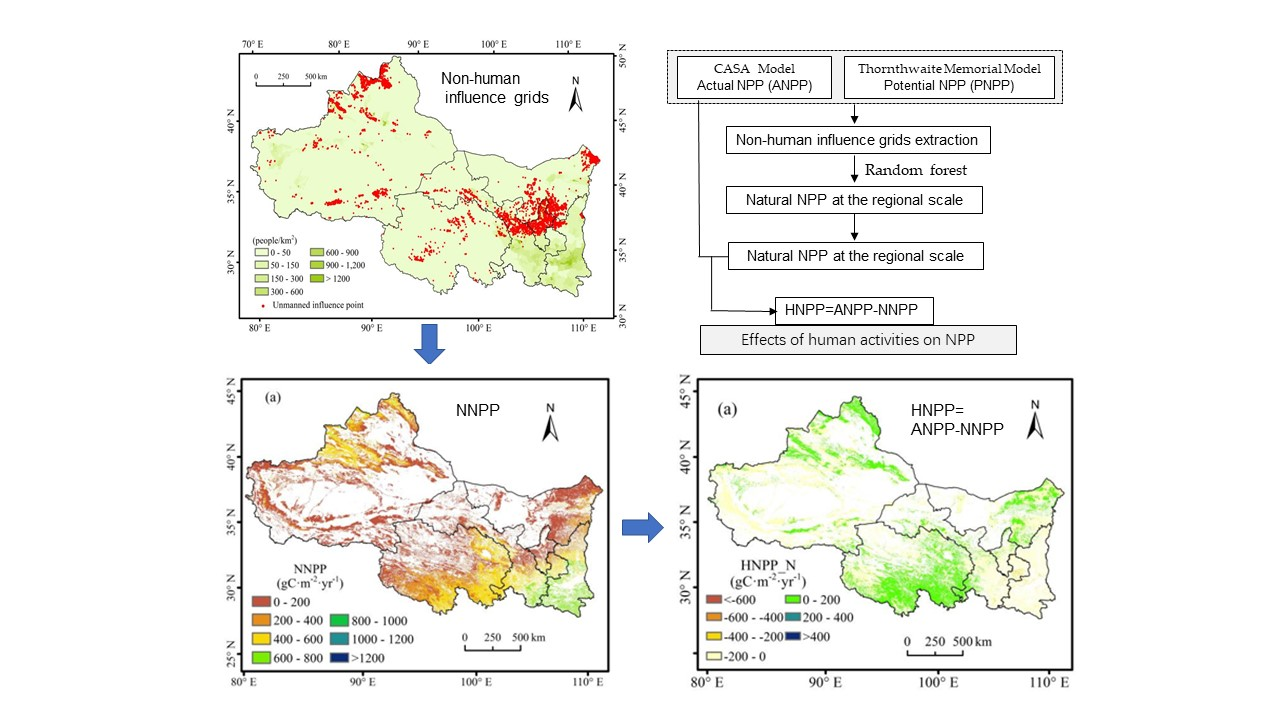
2.3.2. Calculation of NNPP

The climate factors used for estimating PNPP are precipitation and temperature in the climatological model. Therefore, the PNPP was regarded as a comprehensive indicator of multiple climatic factors, and changes in PNPP represent the climate change. Theoretically, if there were only effects of climate change, the changing patterns of vegetation NPP should be consistent with the climate, and the ANPP of the corresponding grid is NNPP. Based on this hypothesis, we extracted grid without human activities by determining whether the ANPP changing trends of the grassland vegetation were consistent with the climate change. The actual NPP with unmanned influence point is defined as NNPP, and the parameters of this grid are trained using the random forest learning algorithm, and finally the NNPP values at the grid scale were upscaled to the entire area (Figure 2).
(1)
Identify the grid without human influence
Climate change is a comprehensive index and it is difficult to calculate with specific formulas. The climatological model for estimating PNPP only uses climate factors. Therefore, the PNPP estimated by the climatological model can be used as a climate index. The comparison between ANPP and climate is the comparison between ANPP and PNPP. PNPP was estimate by the Thornthwaite Memorial Model [27], and the calculation formula is as follows:
PNPP = 3000 [1 − e−0.0009695(V − 20)]
V   =   1.05 r 1   +   ( 1   +   1.05 r / L ) 2
L = 3000 + 25t + 0.05t3
where, PNPP unit is gC·m−2·yr−1; V is the average annual actual evaporation (mm); r is the annual cumulative precipitation (mm); L is the annual evaporation capacity (mm); t is the average annual temperature (°C).
According to the above description, the changes of ANPP and PNPP are compared year by year. The formula is as follows:
If, ANPPi+1ANPPi ≥ 0, Ai = 1, else Ai = 0
If, PNPPi+1PNPPi ≥ 0, Ti = 1, else Ti = 0
We defined Coincidence Ratio (CR) to examine the differences between climate change and ANPP change. If Ai = Ti, then CRi = 1, indicating that ANPP and PNPP showed same interannual variations, otherwise CRi = 0, indicating that they were different.
C R y   =   i = 2001 2017 C R i n
where, CRy is the Coincidence Ratio of year between climate change and ANPP change during the study period, i represents the year, CRi indicates whether the ith year coincides, and n is the total number of years in the study period. Due to the disturbance in the ecosystem, a threshold is set for the judgment. If it is greater than the threshold, it indicates that the ANPP is consistent with climate change, and this grid is an unmanned influence grid.
The above judgment is based on the interannual scale and failed to detect the impact of human activities during the year (at the month scale). For example, grazing is a human activity, the grass will gradually recover, and the interannual coincidence rate may not be recognized. According to the growth pattern of grassland, the monthly NPP variation shows a single peak distribution, and its maximum value should appear in June and July. If grassland was affected by humans during the annual, its monthly NPP changes would not be consistent with this rule. Since it is impossible to determine whether the maximum NPP of each grid is in June or July, June and July were excluded in the calculation. The specific calculation method is as follows:
If, ANPPij+1ANPPij ≥ 0, (j = 1, 2, 3, 4), Aij = 1, else Aij = 0
If, ANPPijANPPij+1 ≥ 0, (j = 8, 9, 10, 11), Aij = 1, else Aij = 0
Ri = Ai1 × Ai2 × Ai3 × Ai4 × Ai8 × Ai9 × Ai10 × Ai11
where, ANPPij is the ANPP of the j month of the ith year, i represents the year (2001~2017), j represents the month, Ri represents whether the inter-monthly NPP change of the ith year follows a single peak distribution.
R m   =   i = 2001 2017 C R i n
where, Rm is the ratio of monthly NPP subject to single peak distribution during the study period, and n is the total number of years in the study period (n = 17).
Theoretically, the consistency of ANPP and PNPP includes inter-annual change and intra-annual change, and the coincidence rate should be 100%. However, the 17-year period is a relatively long time, the CRs could be affected by many other factors such as extreme events and non-human disturbances. Therefore, it is necessary to manually set the thresholds of the CRy and Rm values. To find the best values, we tried several values, and the results were assessed using field surveys of unmanned influenced points to validate whether there was human activity. Based on the field investigation results, we manually set the thresholds of CRy and Rm as 0.88 and 0.94 respectively, that is, during the 17-year period, CRy and Rm are allowed to not coincide for 2 years and 1 year respectively. The grids with the values between these thresholds, namely (CRy > 0.88) ∩ (Rm > 0.94), were identified as the grids without the effects of human activities.
(2)
Upscaling the NPP to regional scale
This study used the random forest (RF) machine learning methods to upscale the NNPP to the entire study area. Random forest is a multifactor machine learning algorithm, which is suitable for solving classification and regression problems. Multiple random samples are obtained through multiple sampling, and corresponding decision trees are established through these samples, and the specific algorithm can be found [28]. RF has a high prediction accuracy, a good tolerance for outliers and noise, and is not prone to overfitting [29]. This method has been successfully used to model the net primary productivity [30], as well as forest biomass [31].
The random forest uses the ANPP at unmanned influence points as the dependent variable, and 10 factors, including elevation, slope, slope orientation, mean annual temperature, mean annual precipitation, mean annual solar radiation, NDVI, mean temperature in growing season, cumulative precipitation in growing season, and solar radiation in growing season, as independent variables. We defined May to October as growing season because this period is usually considered as the growing season in the Northwest China [32]. Training and parameter tuning are performed to obtain the characteristic relationship of each variable, and further simulate the grassland NNPP.

2.4. Calculation of HNPP

We compared the calculation results of HNPP based on NNPP and PNPP, which were named as HNPP_N and HNPP_P, respectively. The HNPP was calculated by the difference between ANPP and NNPP (or PNPP), which was expressed as follows:
HNPP = ANPPPNPP, or HNPP = ANPPNNPP
where, HNPP value > 0 suggests that the effect of human activities on the vegetation is positive; HNPP value < 0 indicates that the effect of human activities on the vegetation is negative.

2.5. Changing Trend

For each pixel, the interannual changing rate for HNPP was estimated by unitary linear regression, and the calculation formula is as follows:
s l o p e   =   n   ×   i = 1 n i   ×   N P P i     i = 1 n i i = 1 n N P P i n   ×   i = 1 n i 2     ( i = 1 n i ) 2
where n represents years (the time series was from 2001~2017, n = 17); HNPPi represents the HNPP in year i.
We use the F-test to test the significance of NPP changing trend, the formula is as follows:
F   =   i = 1 n ( y i     y ¯ ) 2 i = 1 n ( y i     y i ) 2   ×   ( n     2 )
where, y is the regression value, yi is the value of the ith year, y ¯ is the multi-year average, and n is the number of years. The results are divided into 4 groups: significant increase (Slope > 0, p < 0.01), increase but not significant (Slope > 0, 0.01 ≤ p ≤ 0.05), and decrease but not significant (Slope < 0, 0.01 ≤ p ≤ 0.05), significant decrease (Slope < 0, p < 0.01).
In this study, the changing direction and trends of HNPP are defined based on the values of HNPP and Slope. When HNPP and slope values are positive, it indicates that the positive influence of human activities on NPP is increasing. Slope value is negative, it indicates that the positive influence is decreasing. When HNPP and Slope values are negative, it indicates that the negative influence of human activities on NPP is increasing. When the slope value is positive, it indicates that the negative influence is decreasing.

3. Results

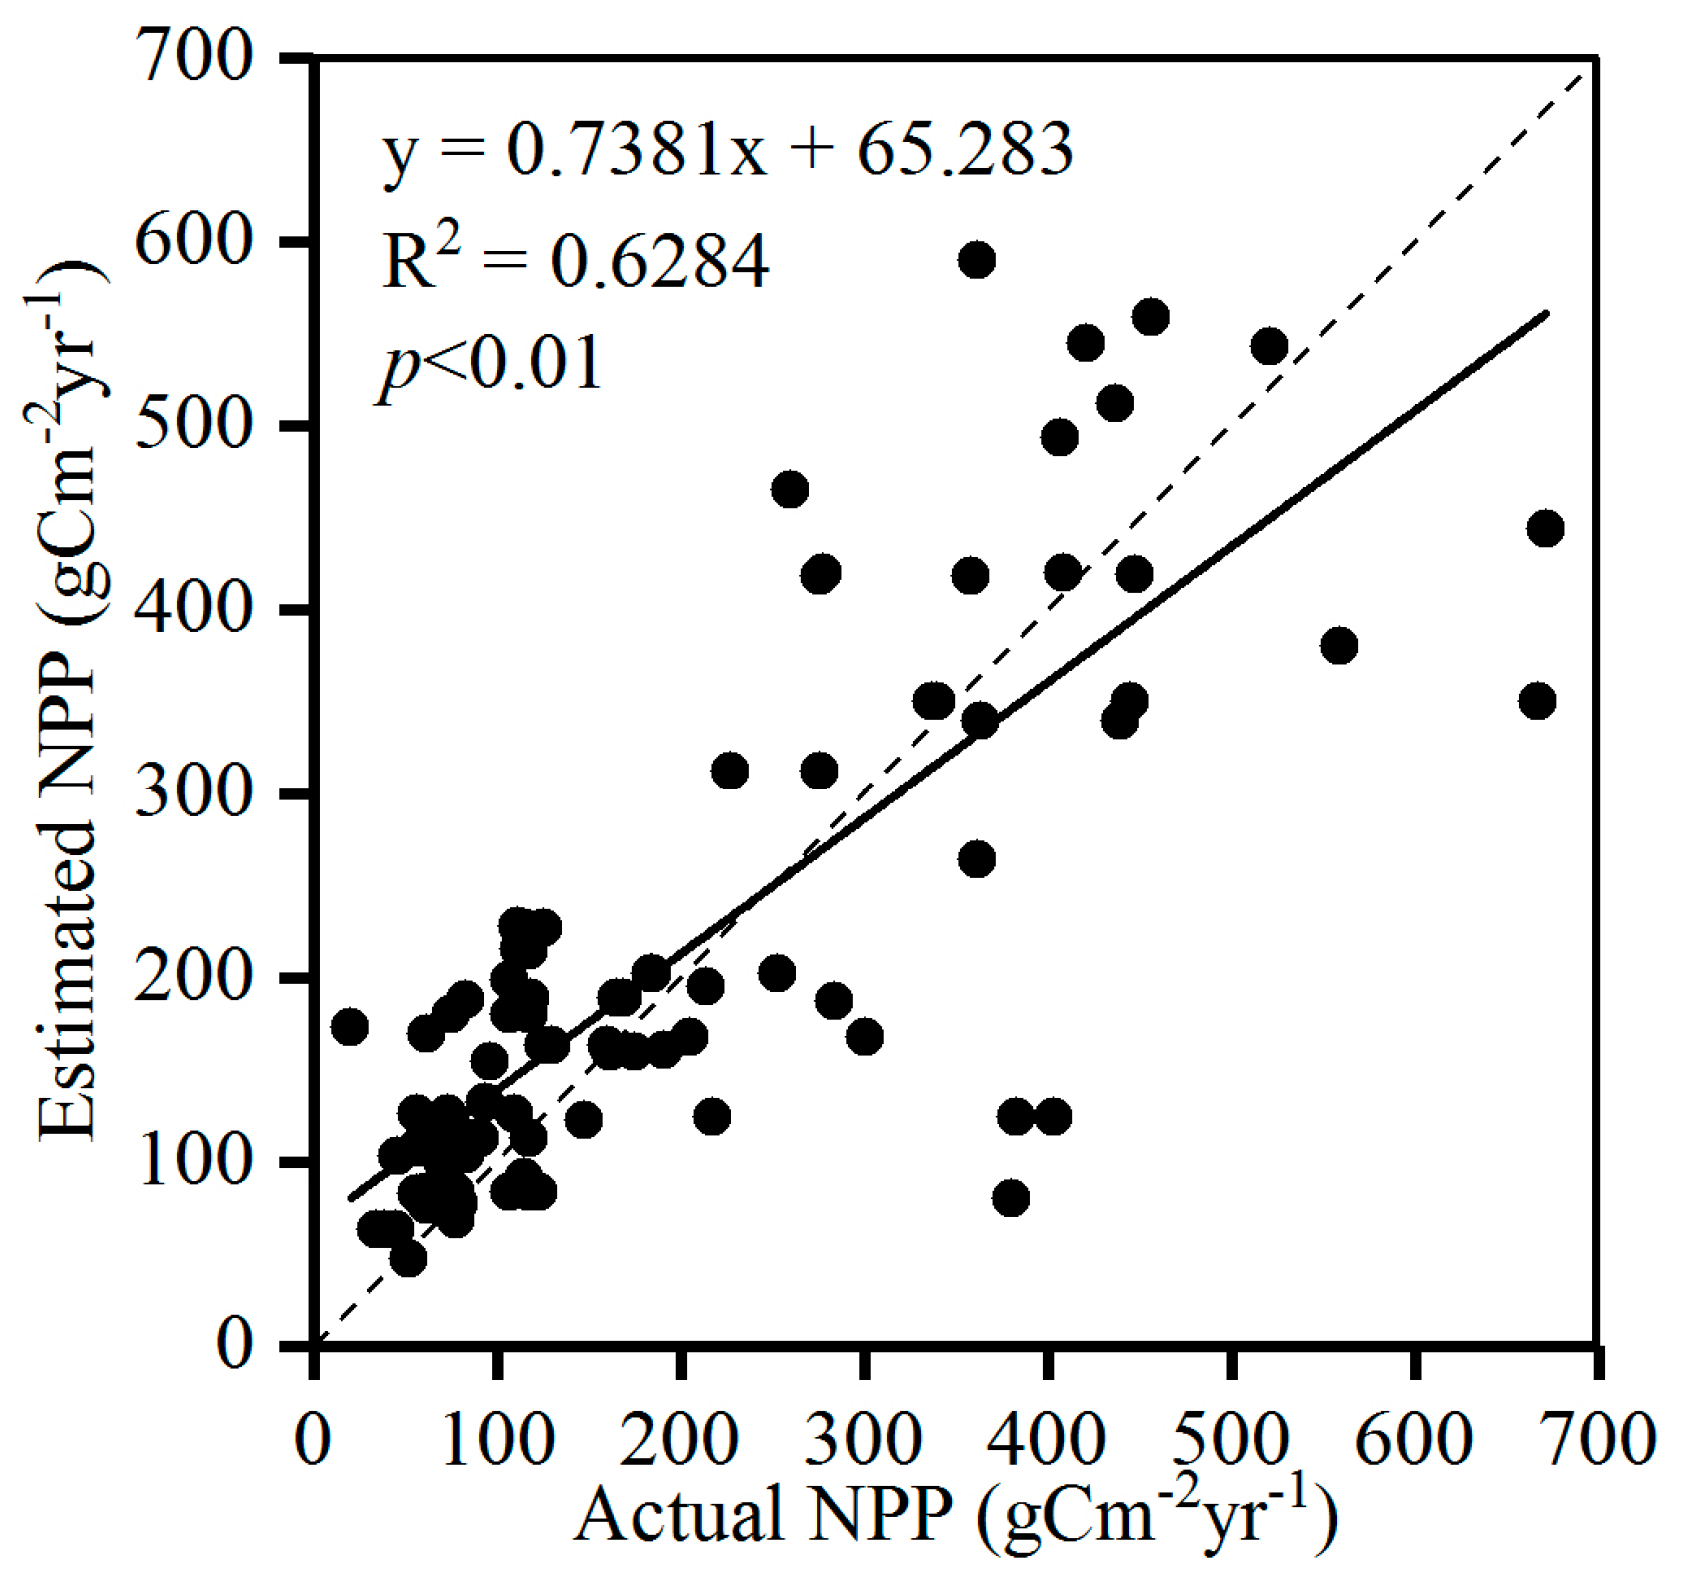
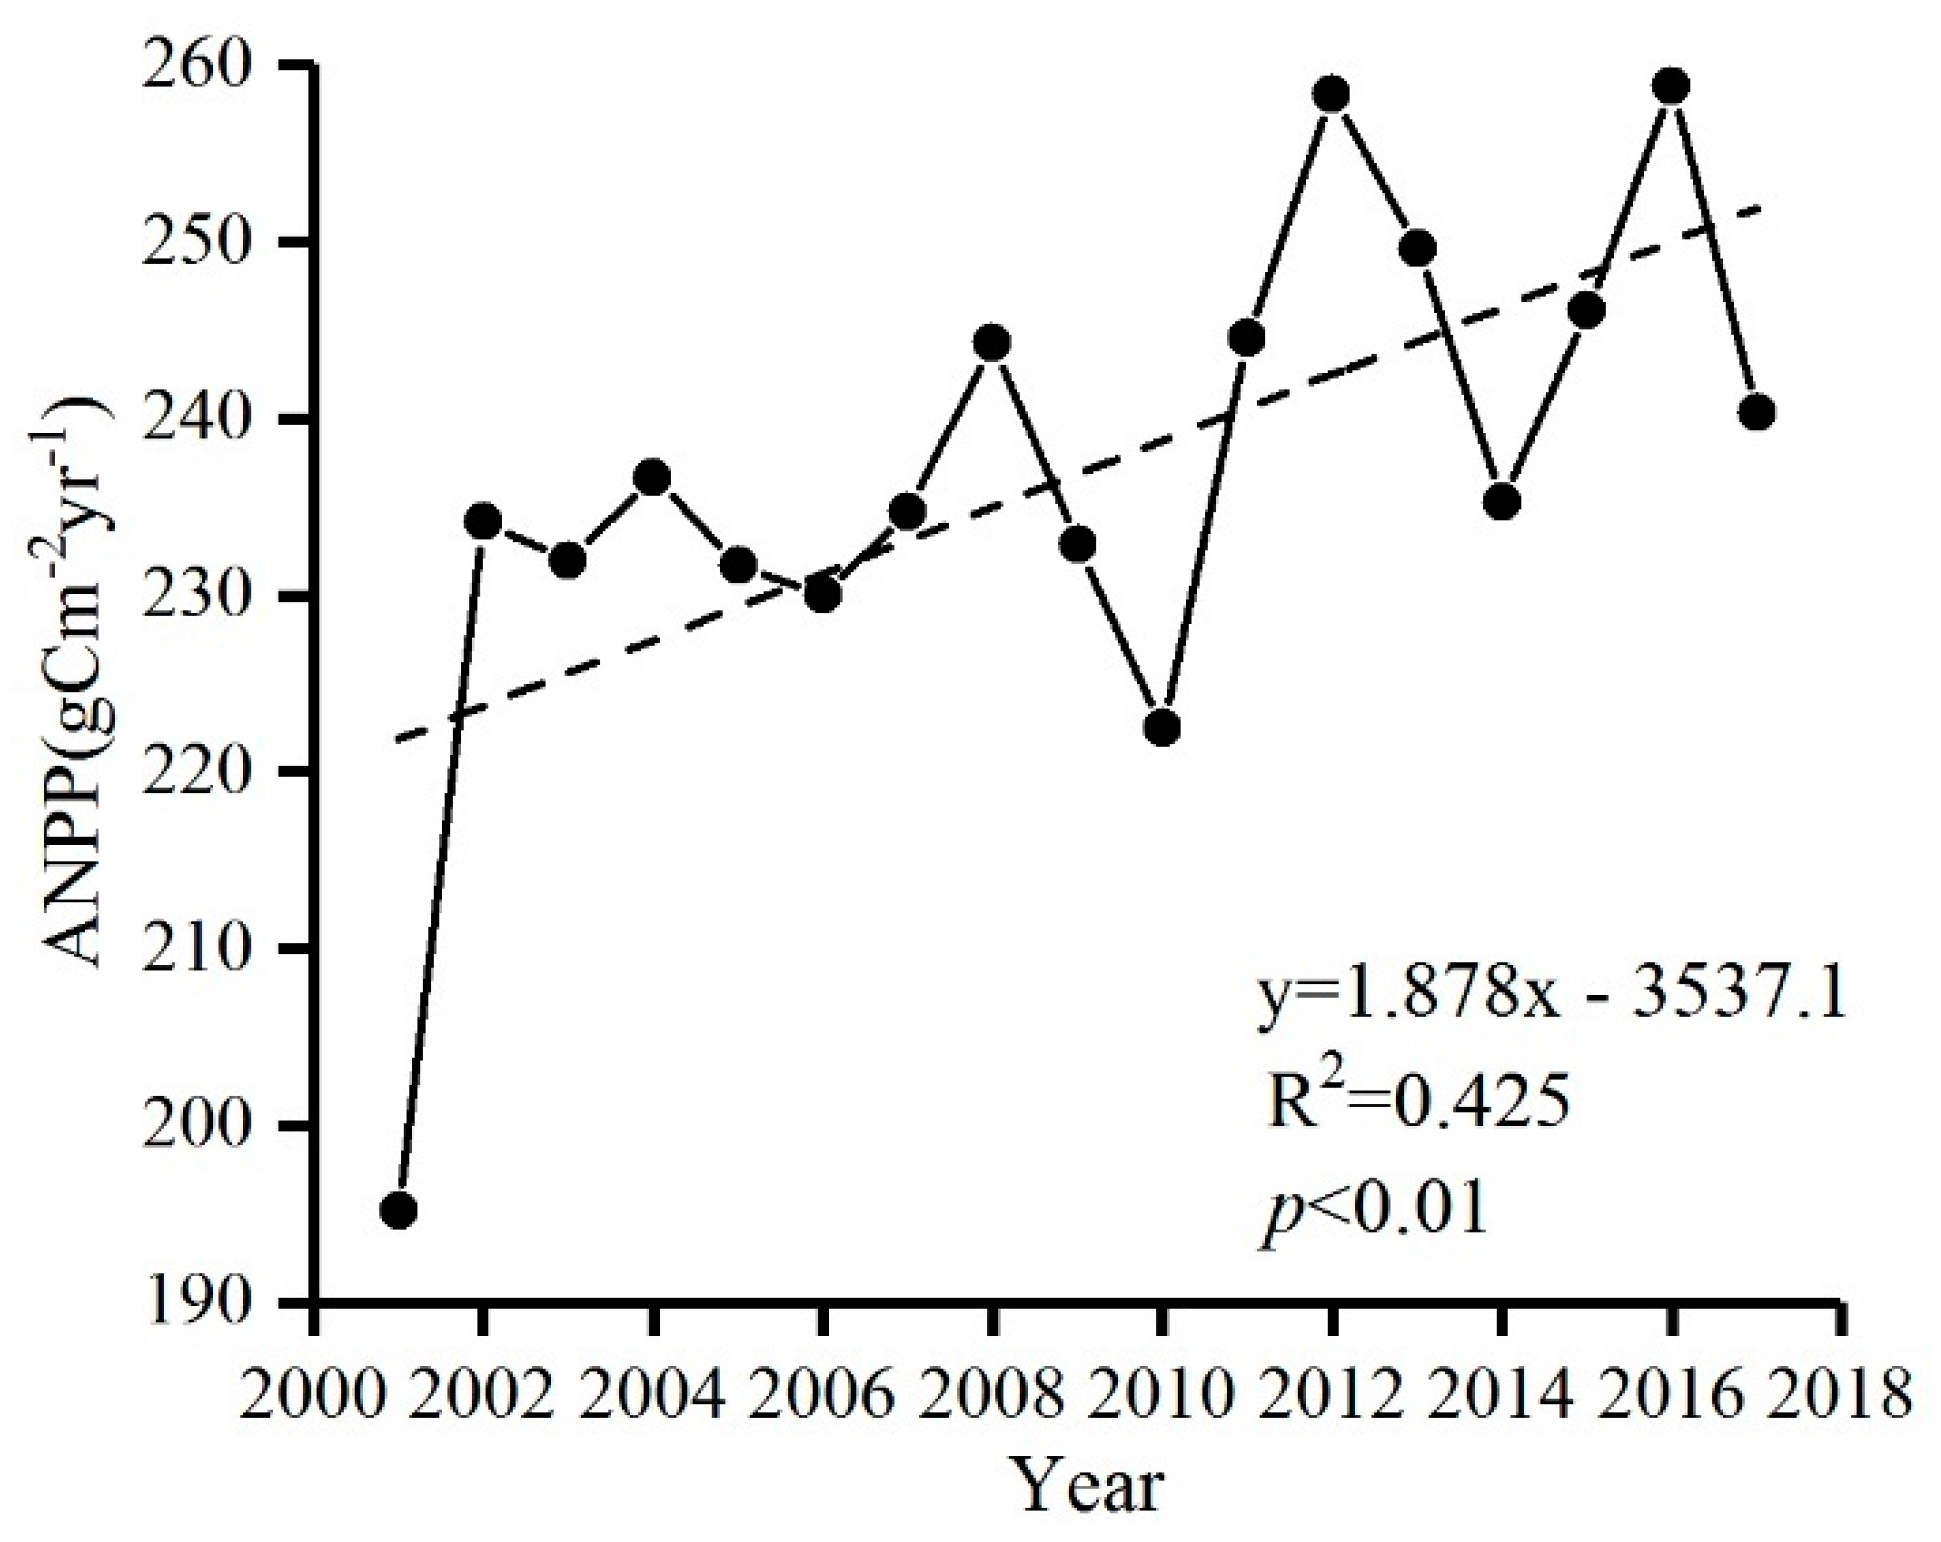
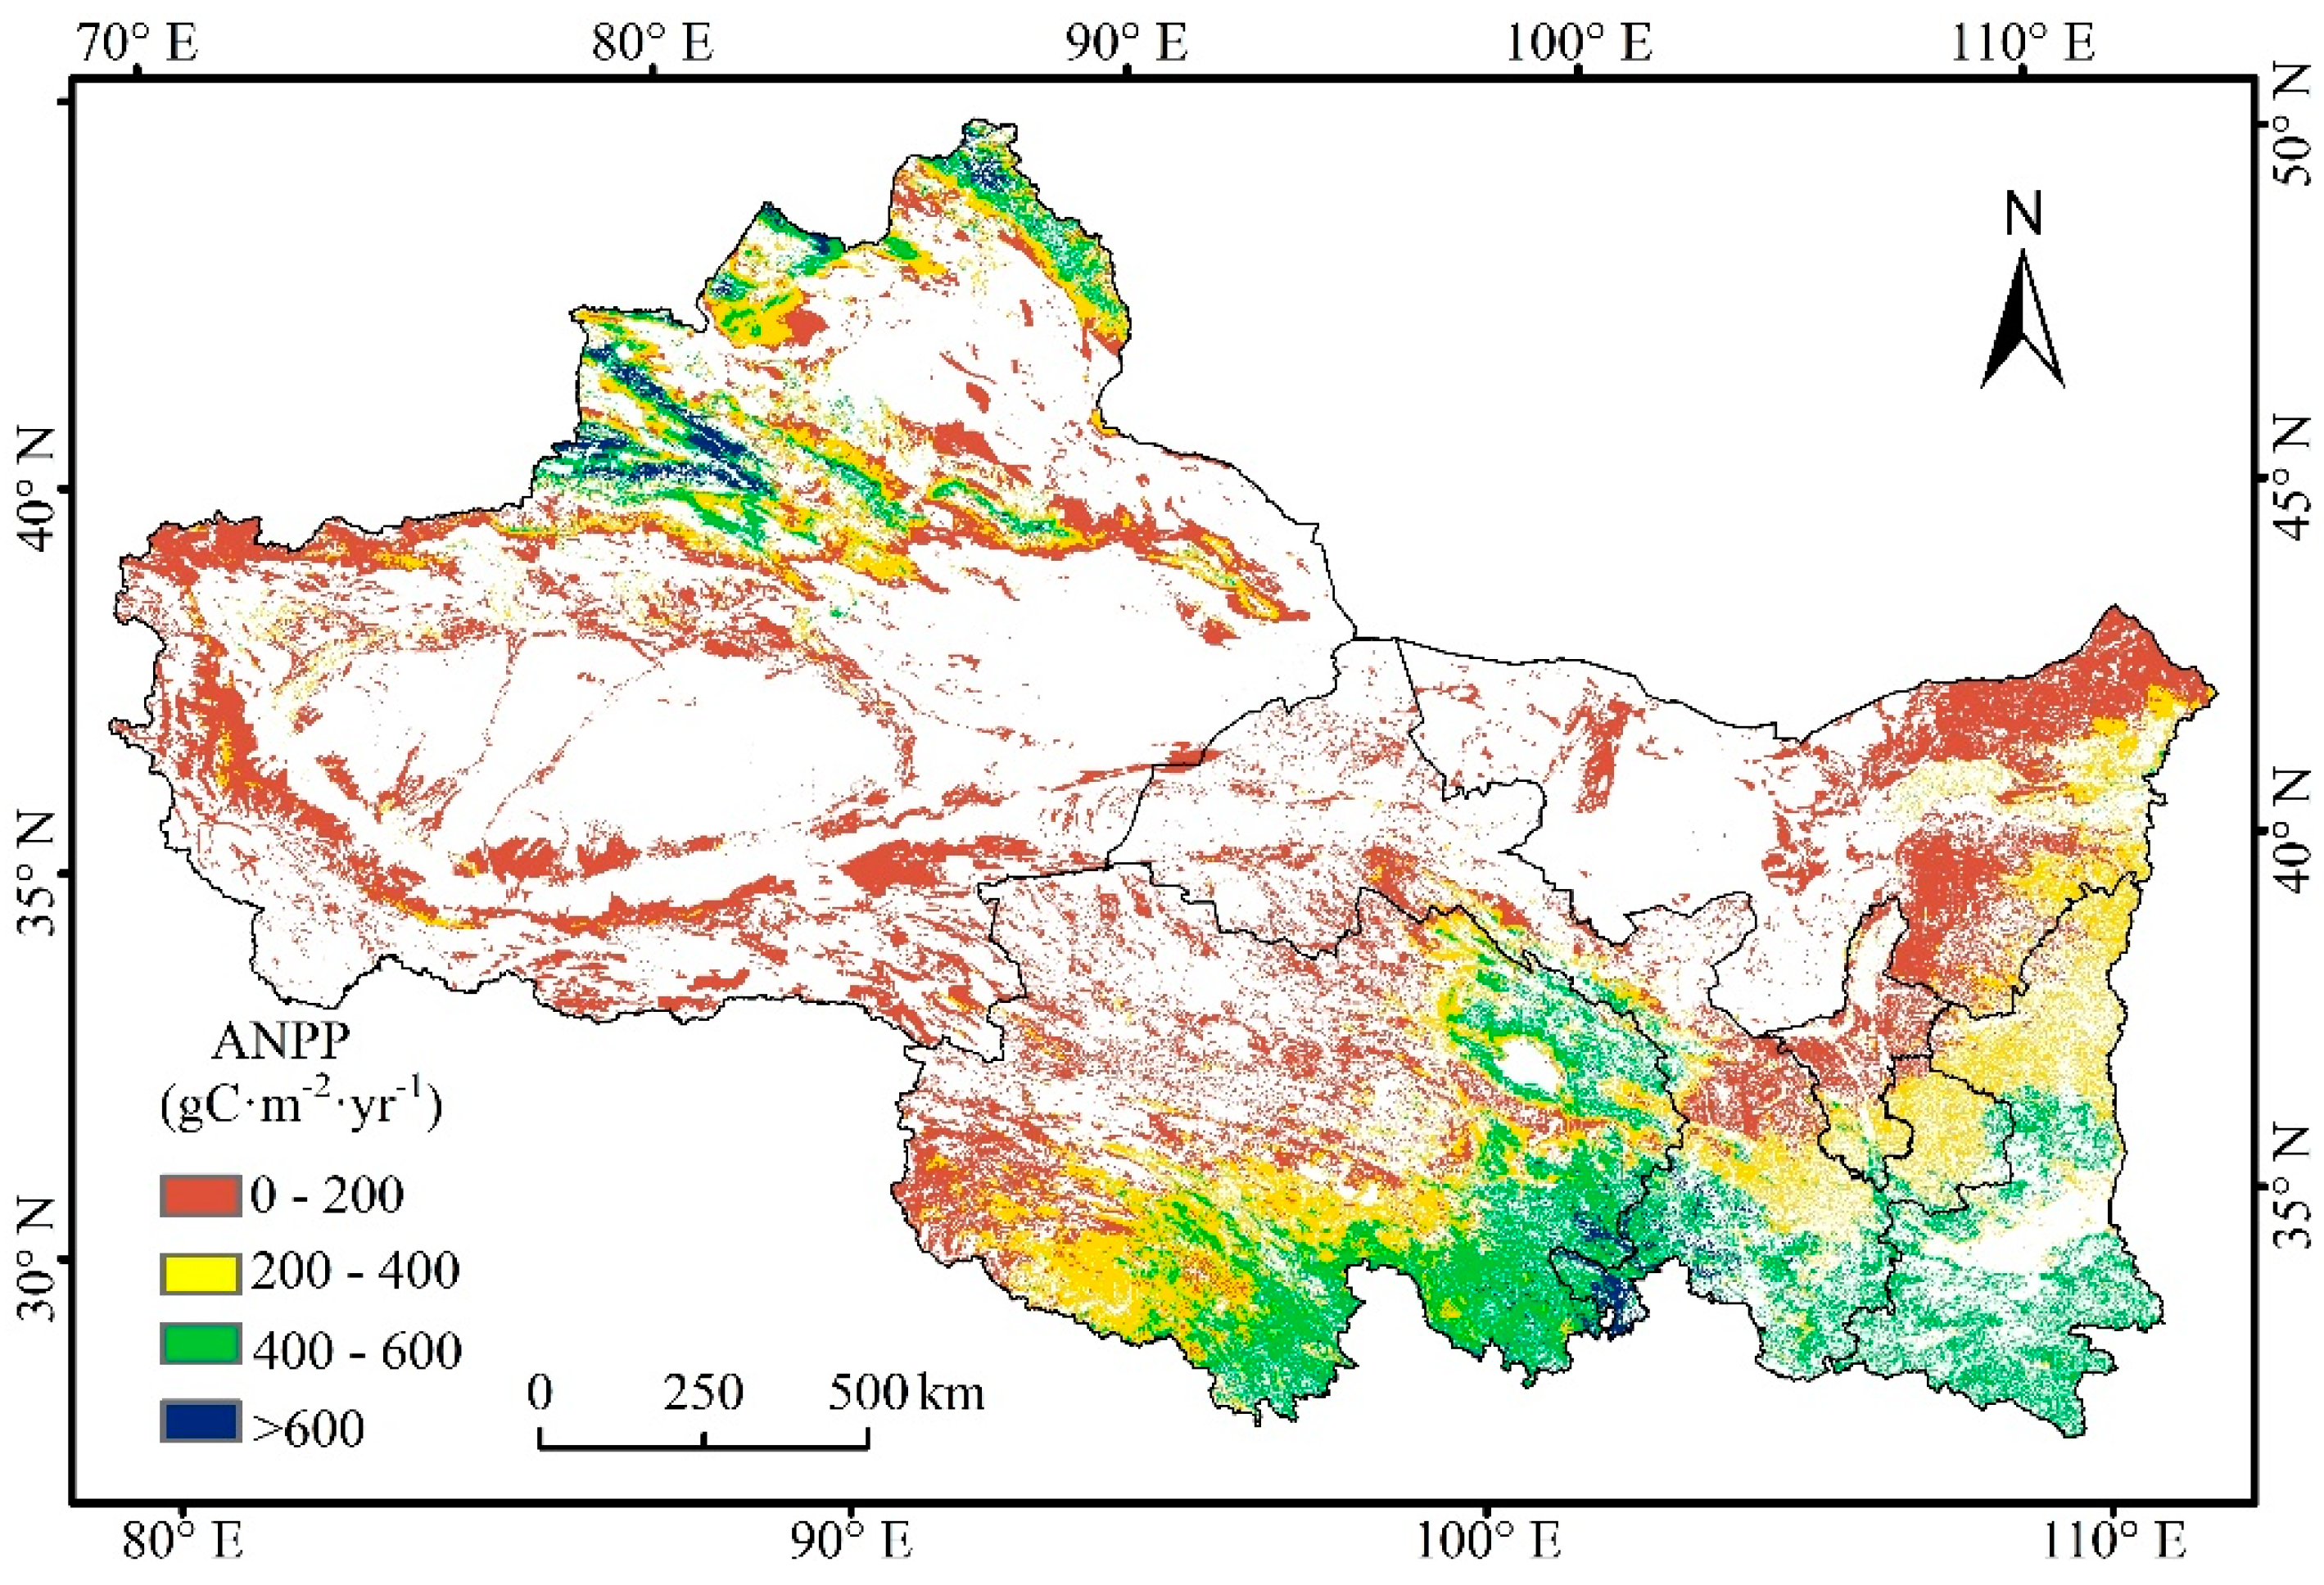
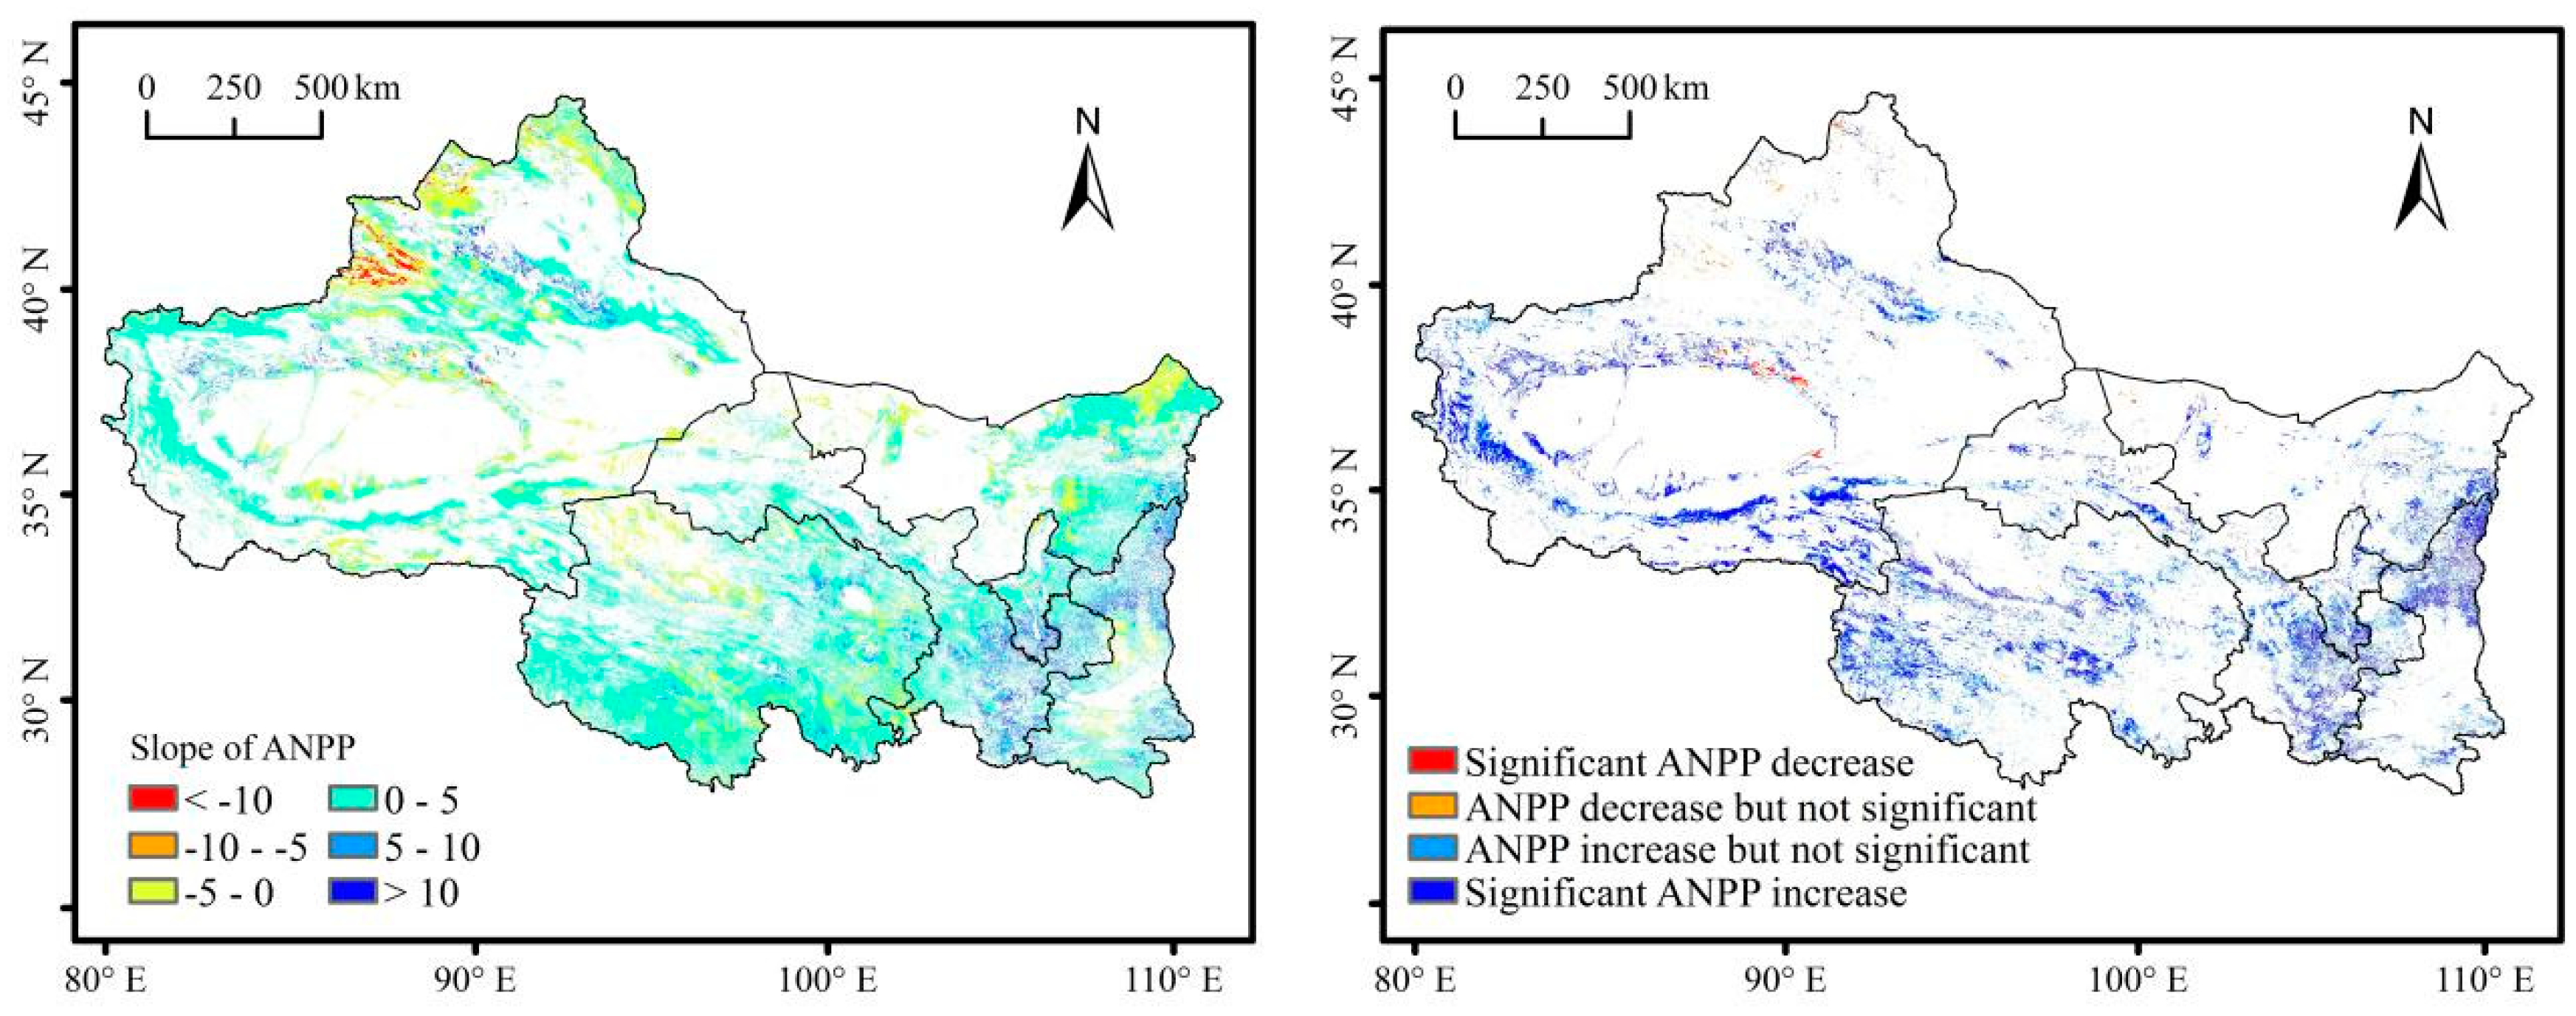
3.1. ANPP Estimation and Spatial and Temporal Distribution
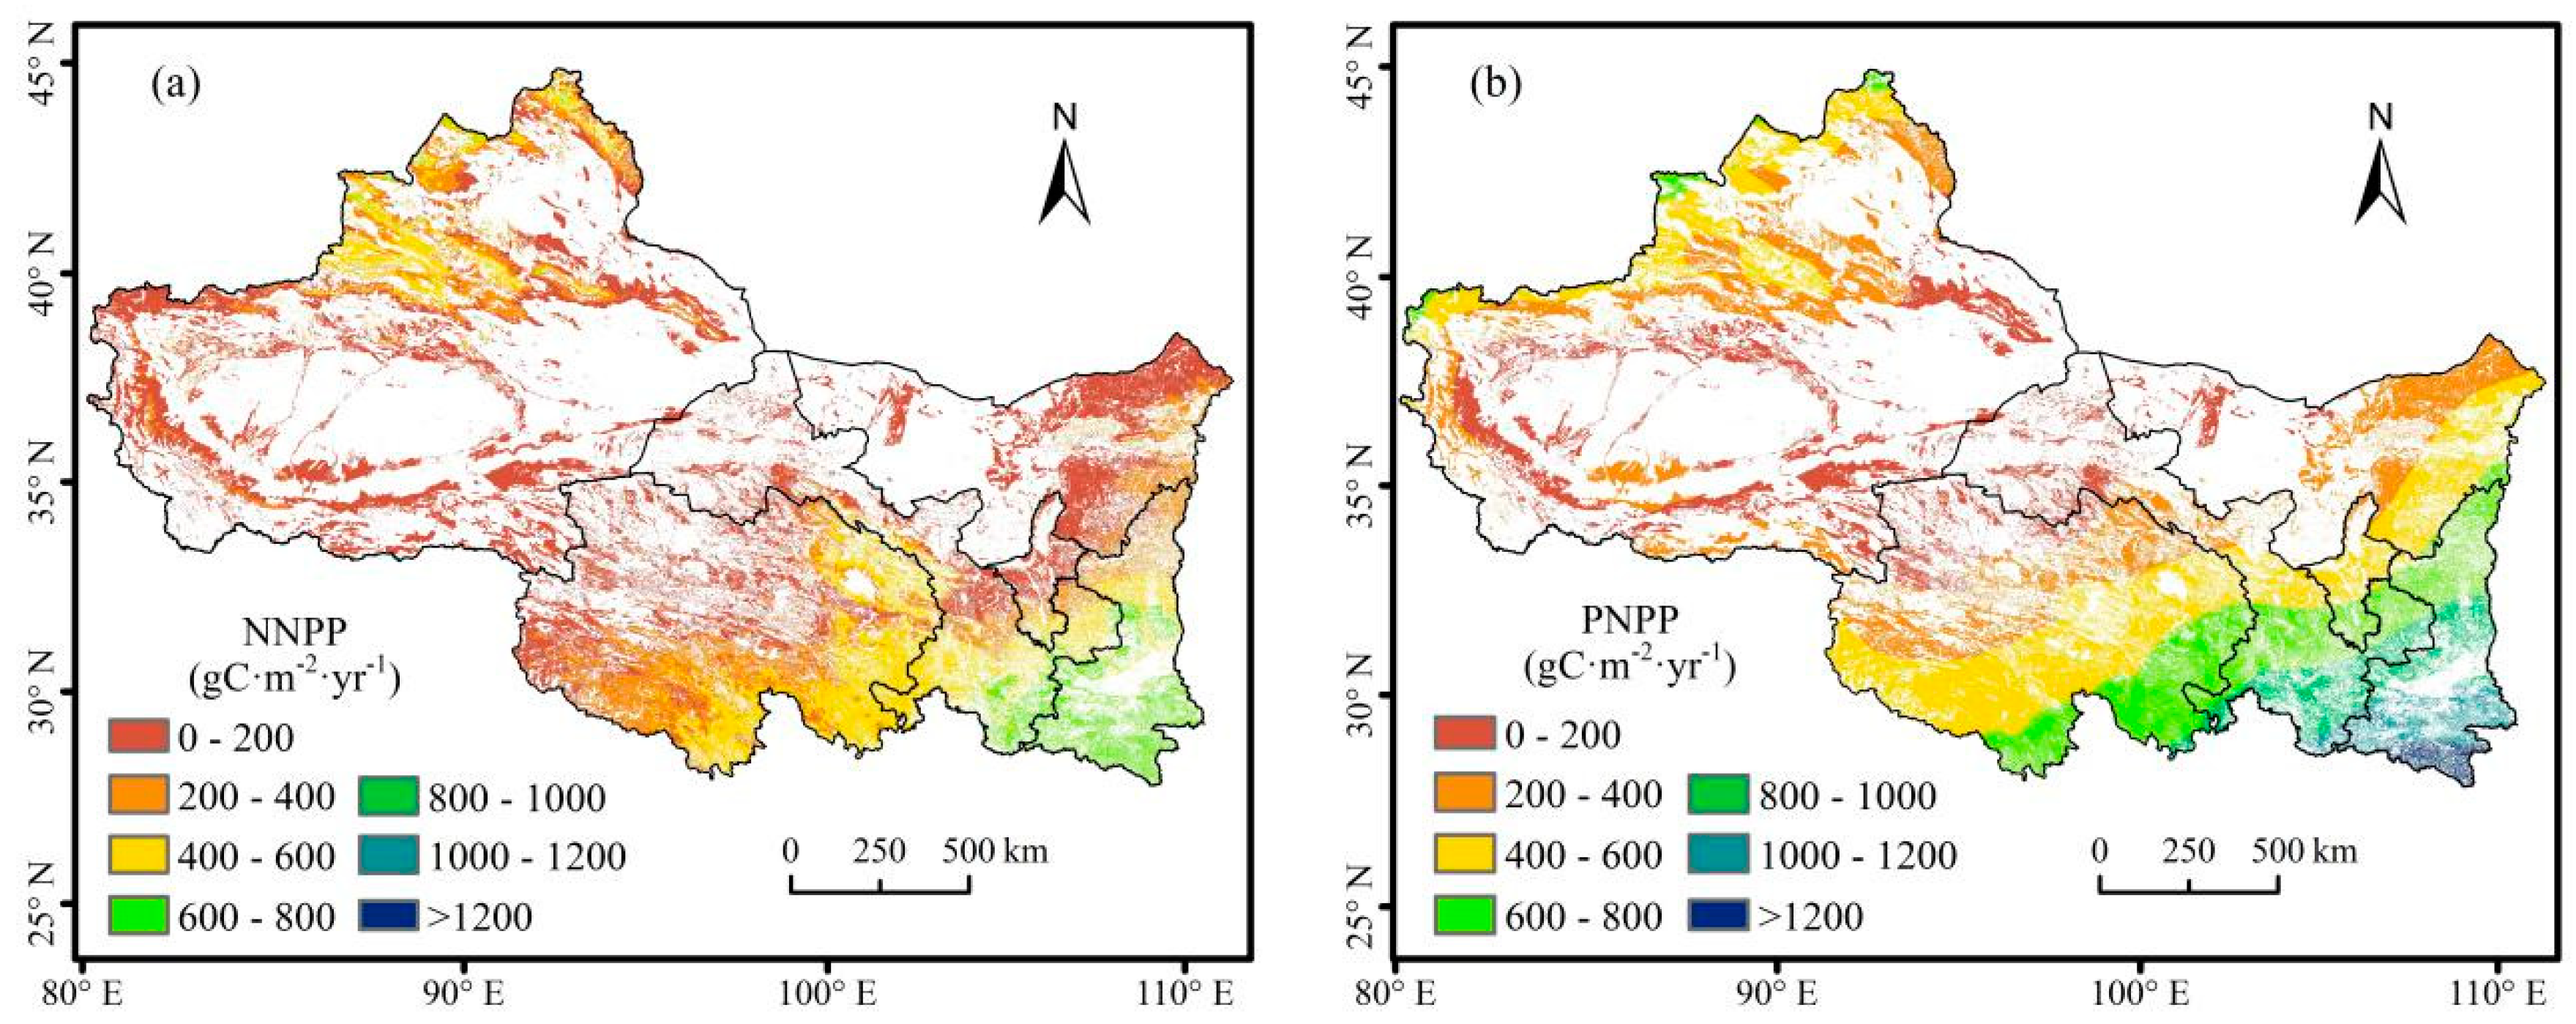
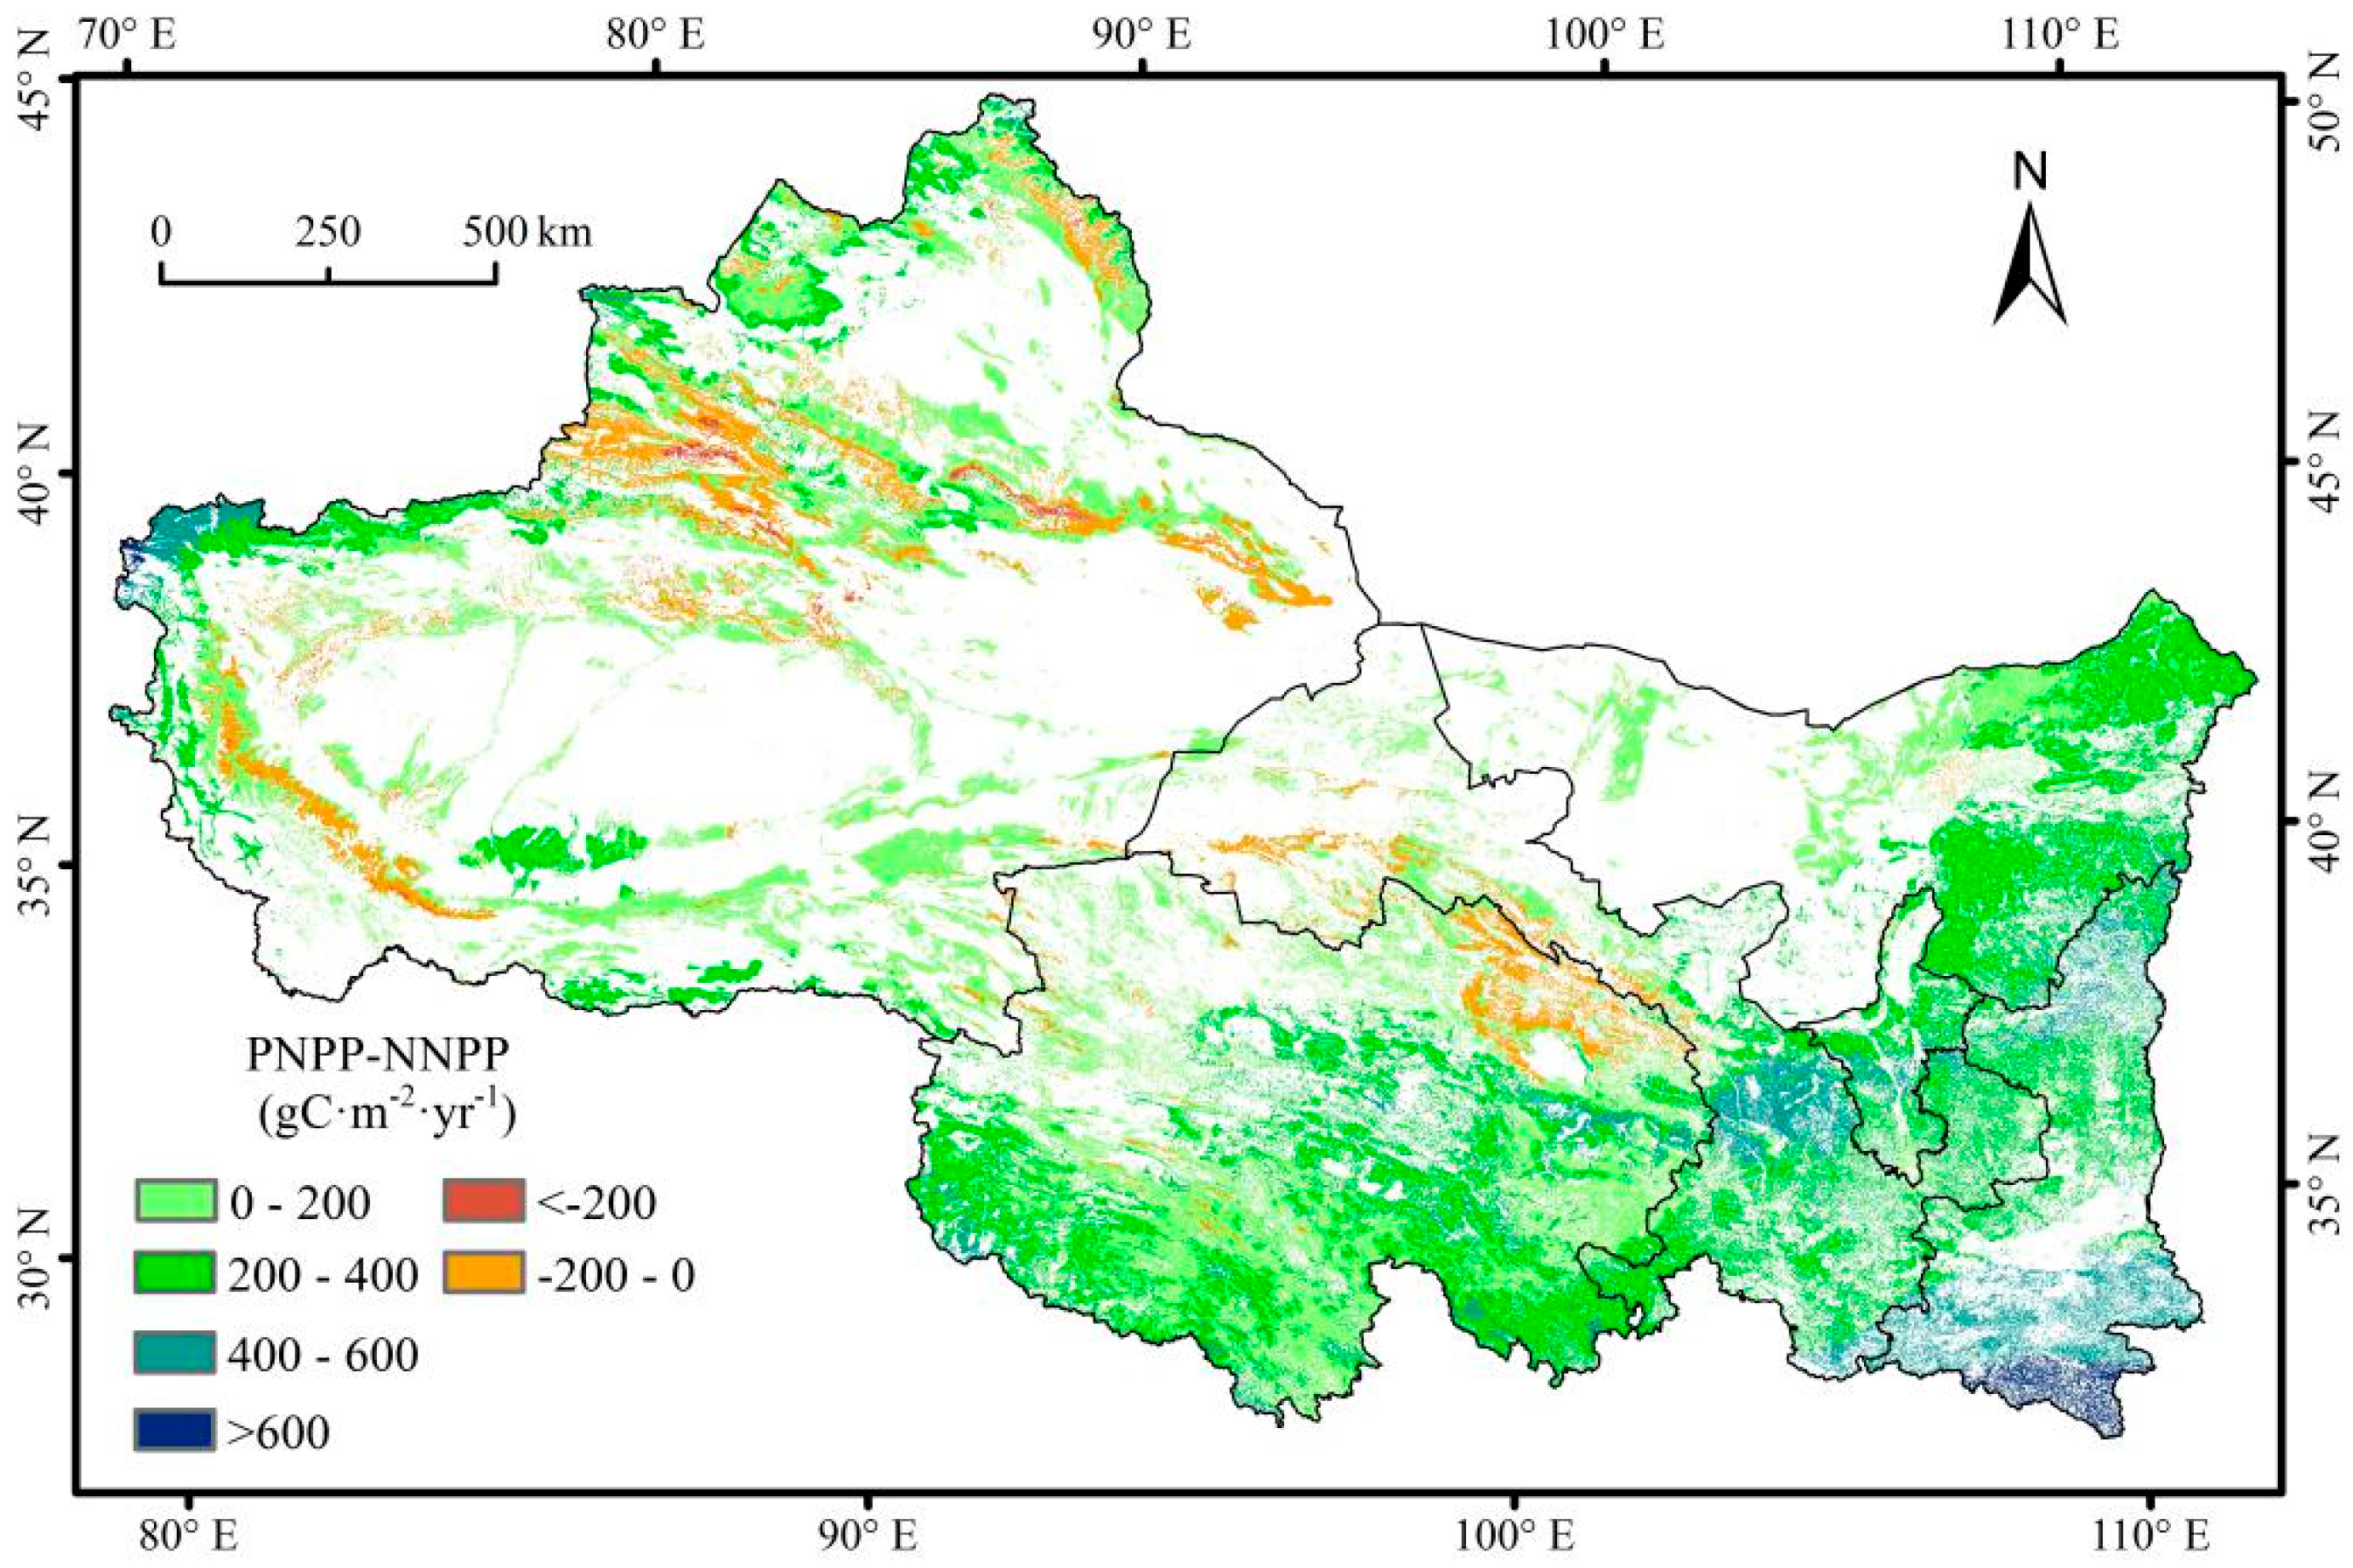
The accuracy (Figure 3) of modelling actual NPP is verified using the measured data (98 sites, 71 from literatures, 27 from our field work). The correlation coefficient (R2 = 0.63, p < 0.01) indicates that the estimate is reliable. The linear fitting scatter plot mainly distributed in low value area, which can be explained as that the most areas had low NNP values.
From 2001 to 2017, the ANPP of grassland in Northwest China showed a significant increasing trend, with a rate of 1.88 gC·m−2·yr−1 (p < 0.01) (Figure 4) and an average value of 236.99 gC·m−2·yr−1. The grassland ANPP was the smallest in 2001, which was mainly due to the low precipitation in that year. The annual total ANPP increased from 224.31 TgC·yr−1 (1 TgC = 1012 gC) to 276.24 TgC·yr−1 during 2001–2017, reflecting the improvement of the grassland. The ANPP of grassland decreased from southeast to northwest (Figure 5). The ANPP values were higher in southern area, which have higher precipitation in Northwest China. Other high value areas are mainly distributed in high mountainous areas. The low values are mainly located in the northern desert areas. The total area with an increasing trend was 87.08 × 10⁴ km2, accounting for 75.77% of the total grassland area. Among them, 26.58% showed significant increase (Figure 6), mainly located in the eastern Qinghai, northern Shaanxi, and Gansu province. Moreover, nearly 24.23% of grassland indicated a decreasing trend in grassland ANPP, including only 0.60% as significant decrease, mainly scattered in most parts of northern Xinjiang.

3.2. NNPP and PNPP

3.2.1. Non-Human Affected Grids

The population density in the study area is shown as Figure 7, and the most of the unmanned influence points are distributed in areas with low population density. A total of 10,231 non-human affected grids were extracted (Figure 7). Unmanned influence points are mainly distributed in uninhabited areas such as plateaus, mountains, and deserts. Most of these places are far away from strong human activities areas such as cities and towns, located in nature reserves and ANPP low-value areas.

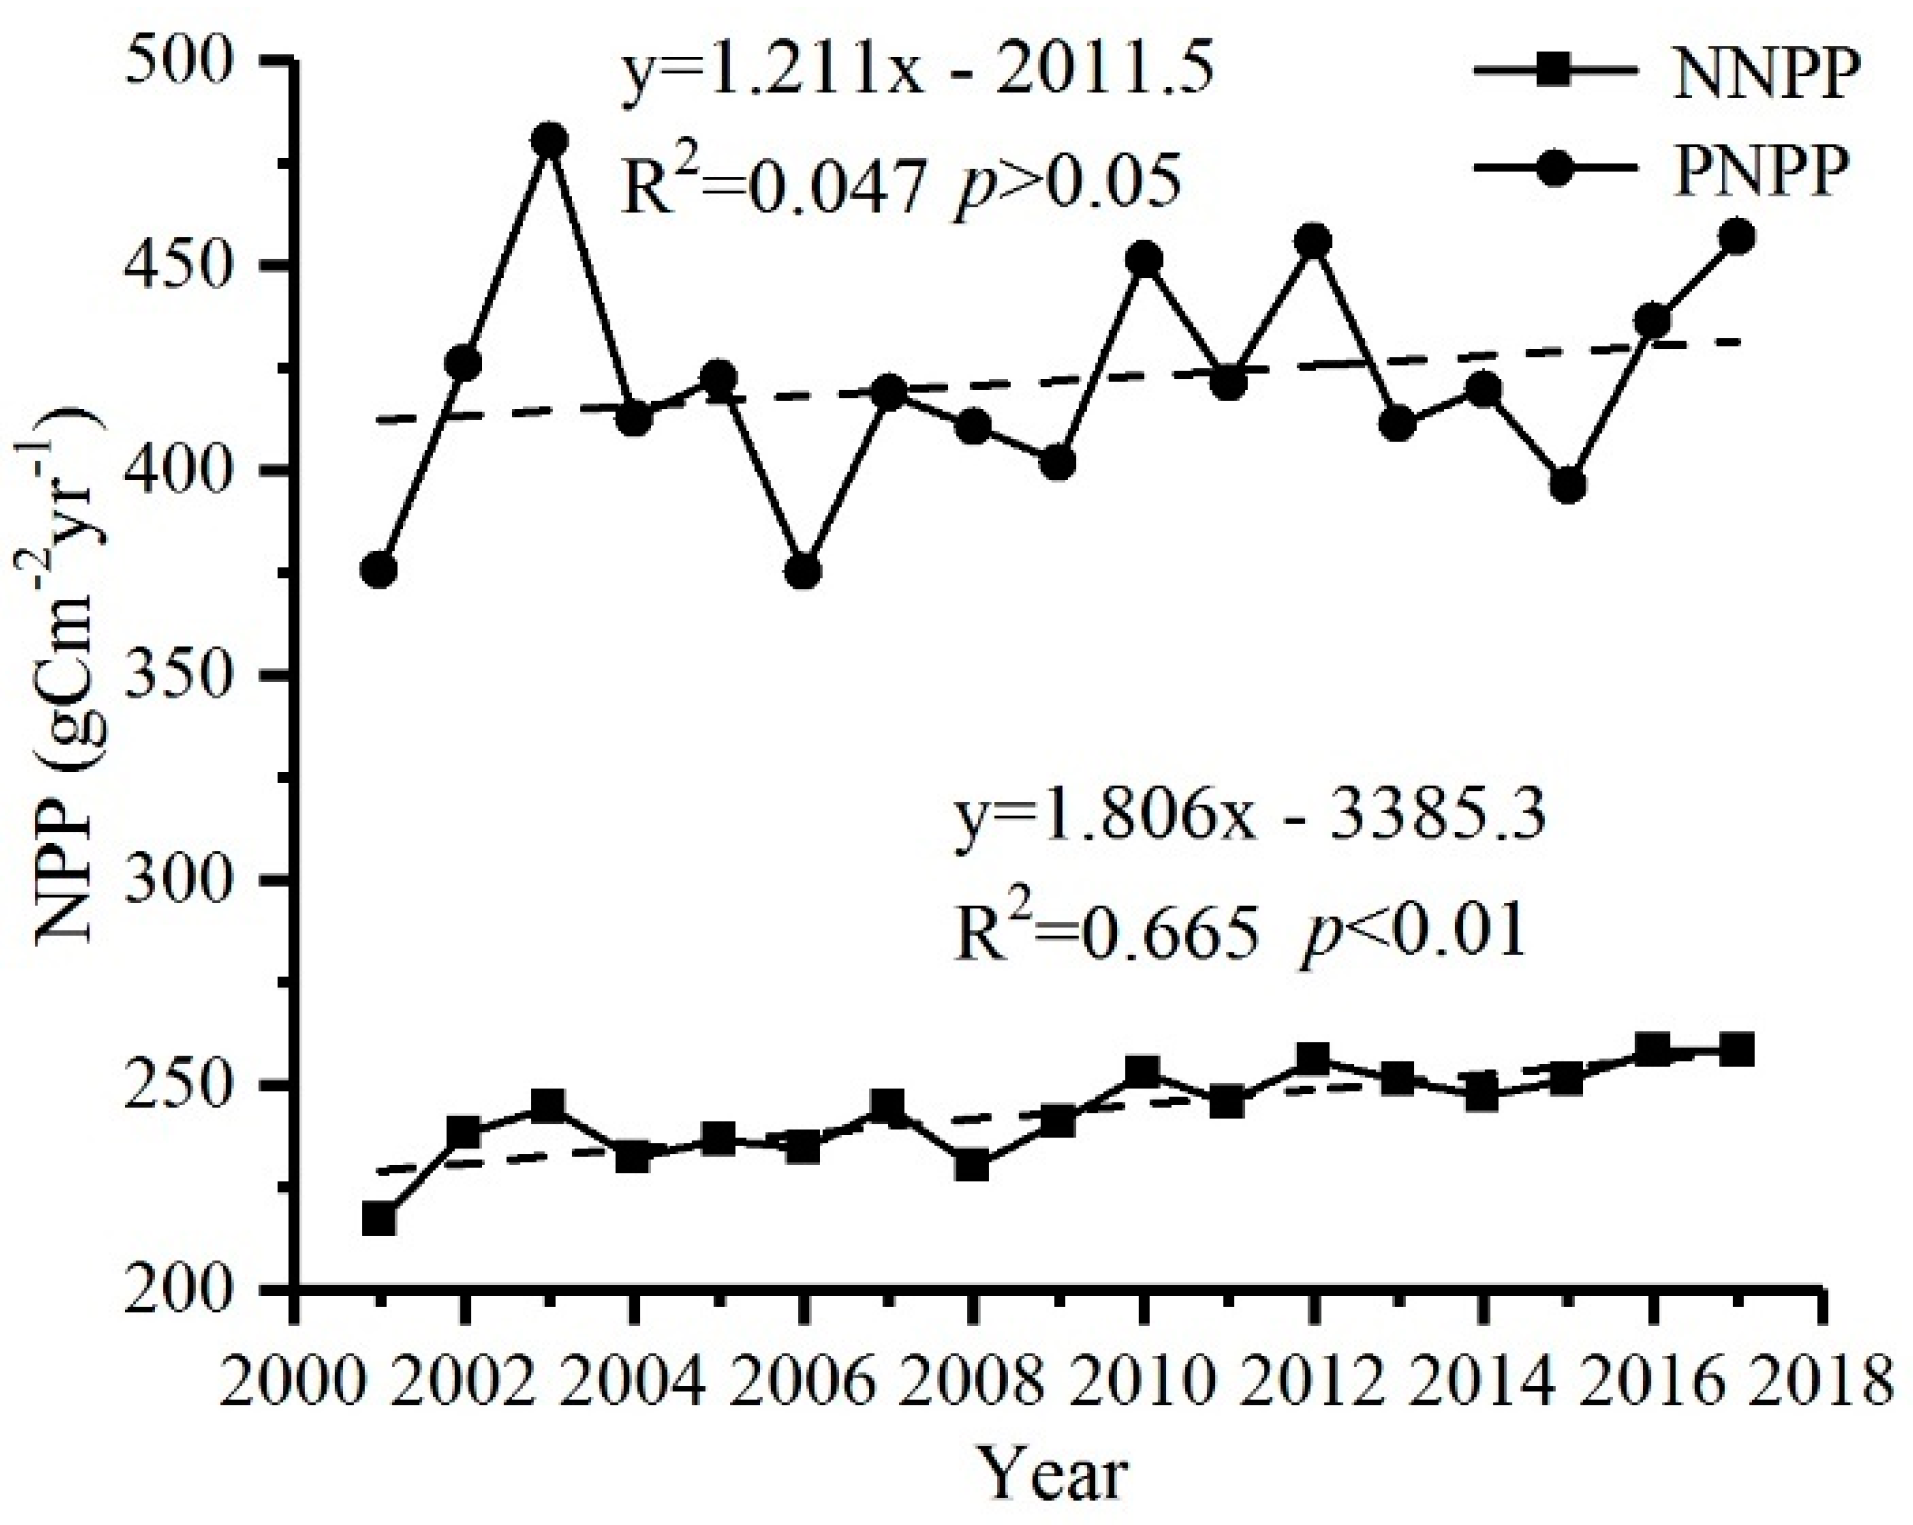
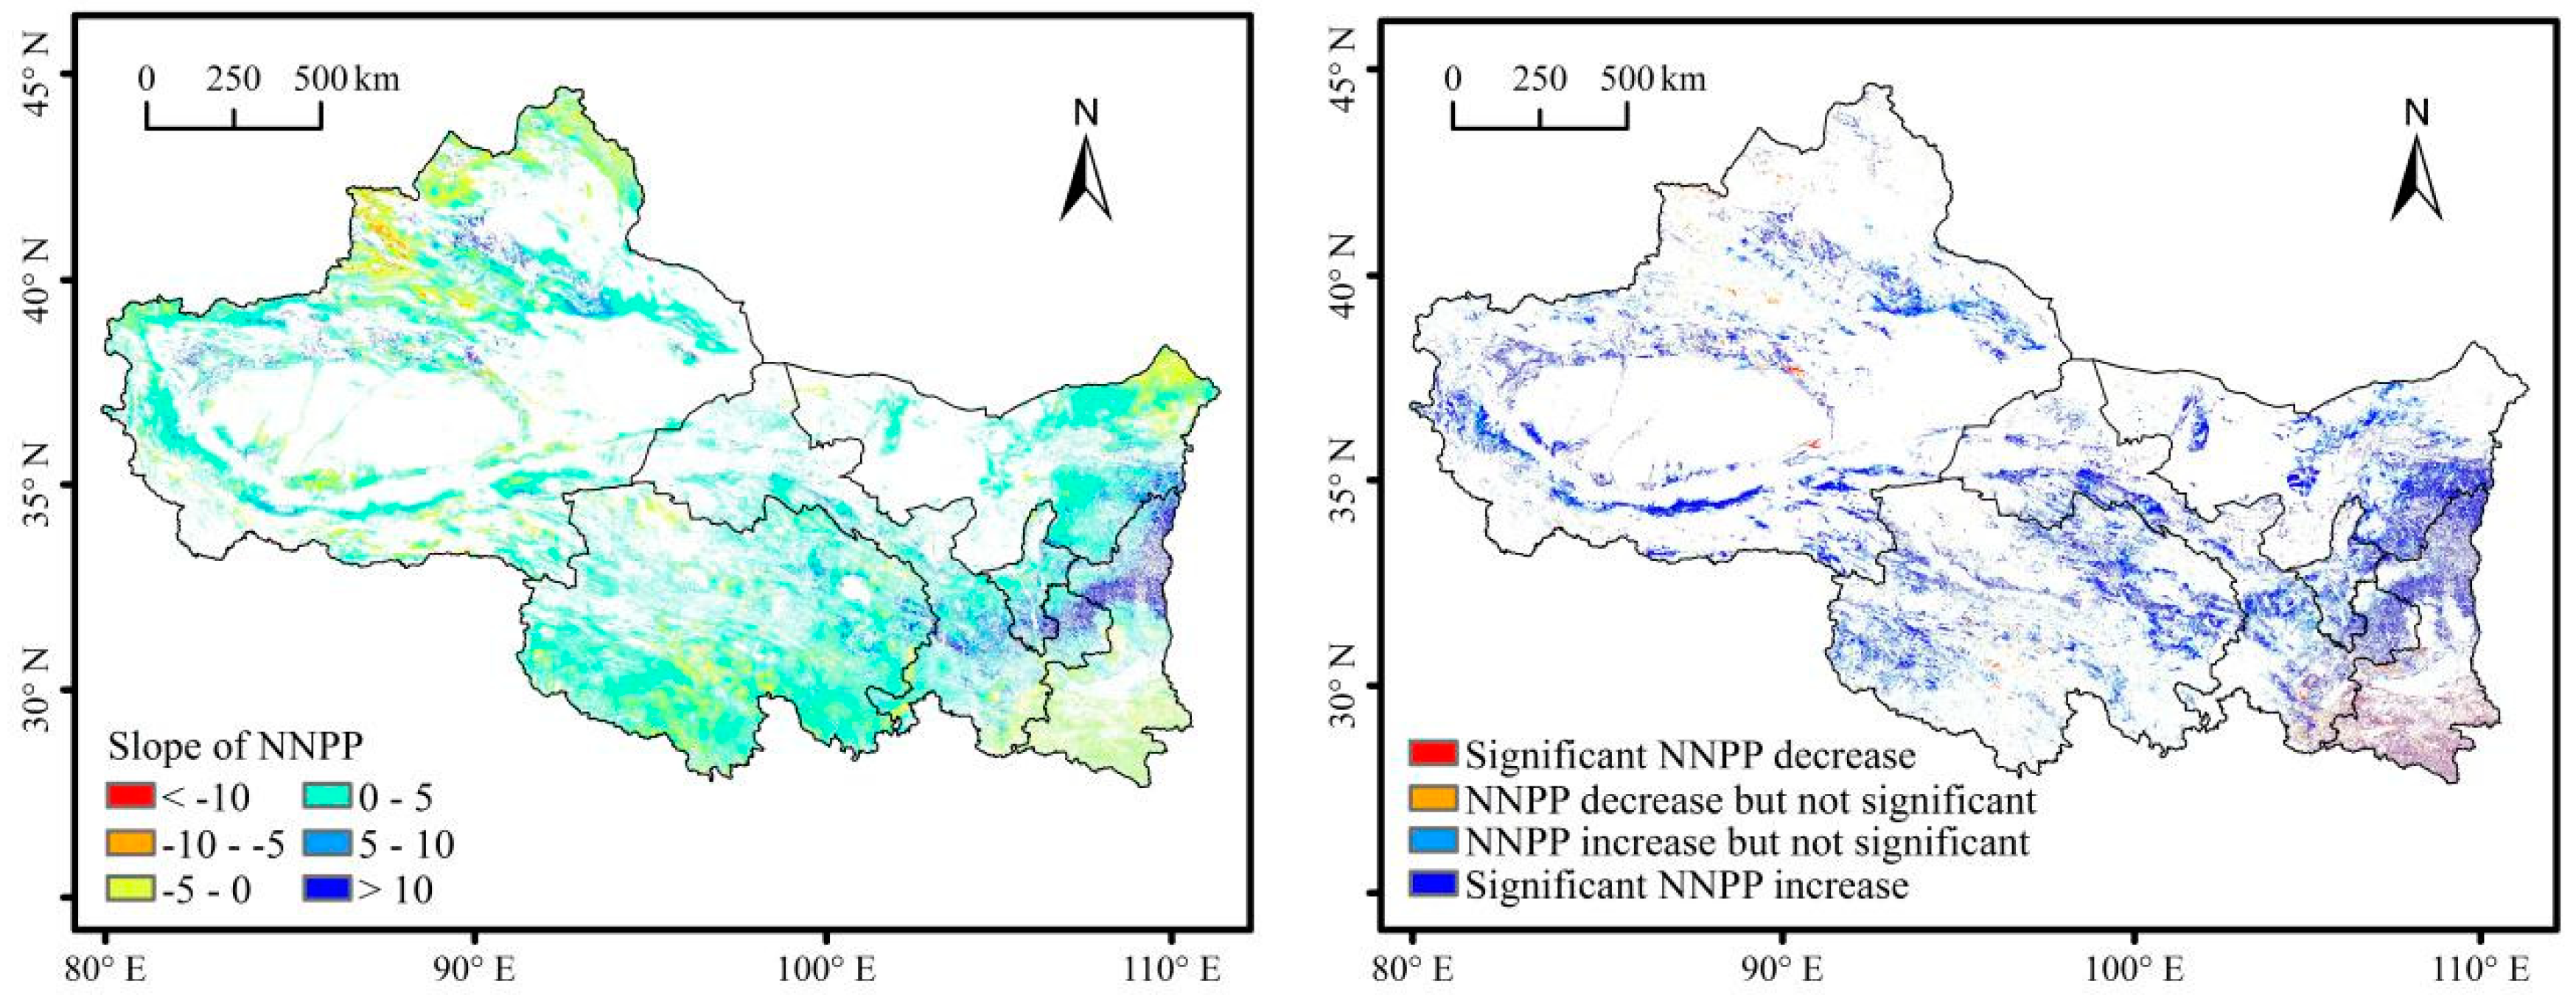
3.2.2. Spatial and Temporal Distribution

Based on the RF machine learning algorithm, the ANPP in the non-human affected grids were upscaled to the entire area to obtain NNPP (Figure 8a). The multi-year average value was 243.60 gC·m−2·yr−1 and an annual total of 276.75 TgC·yr−1. The high value of NNPP was mainly distributed in the southern Shaanxi, the southeastern Qinghai, and the northwestern Xinjiang. The average annual NNPP showed an increasing trend at a rate of 1.81 gC·m−2·yr−1 (Figure 9). From 2001 to 2017, 80.81% of the grassland NNPP showed an increasing trend (Figure 10). Among them, the areas with a significant increase accounted for 34.11%, mainly in the north regions of Shaanxi, middle of Gansu and Qinghai. However, 19.19% of the grassland showed a decreasing trend in the NNPP, and only 1.86% showed a significant decreasing trend, mainly in the southern Shaanxi Province.
The spatial pattern of PNPP was similar to that of NNPP, with a multi-year average of 421.96 gC·m−2·yr−1 (Figure 9) and a total of 479.4 TgC·yr−1. The spatial distribution of PNPP (Figure 8b) overall decreased from southeast to northwest.

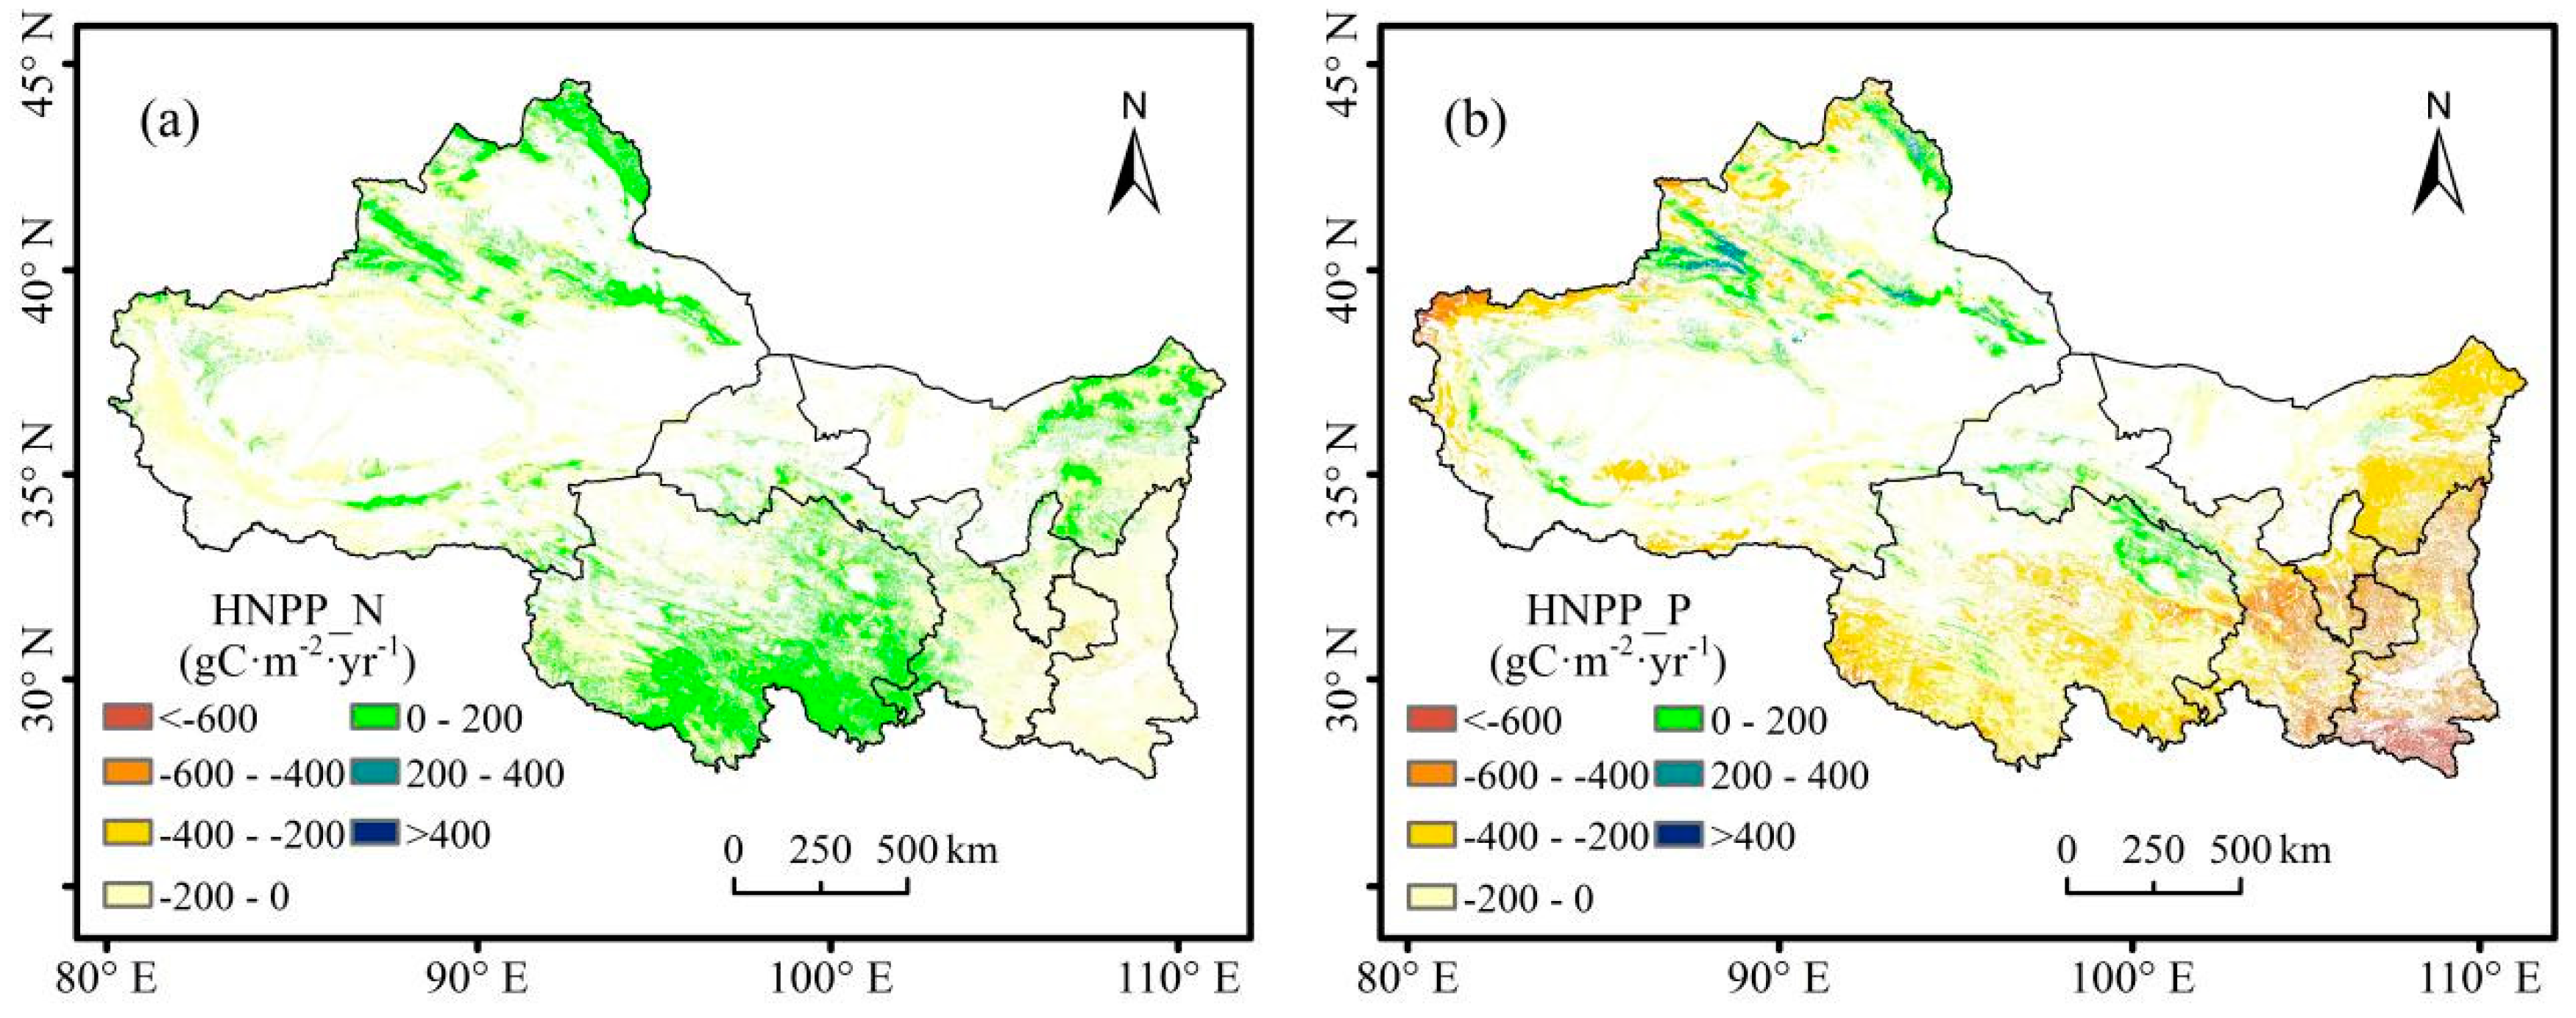
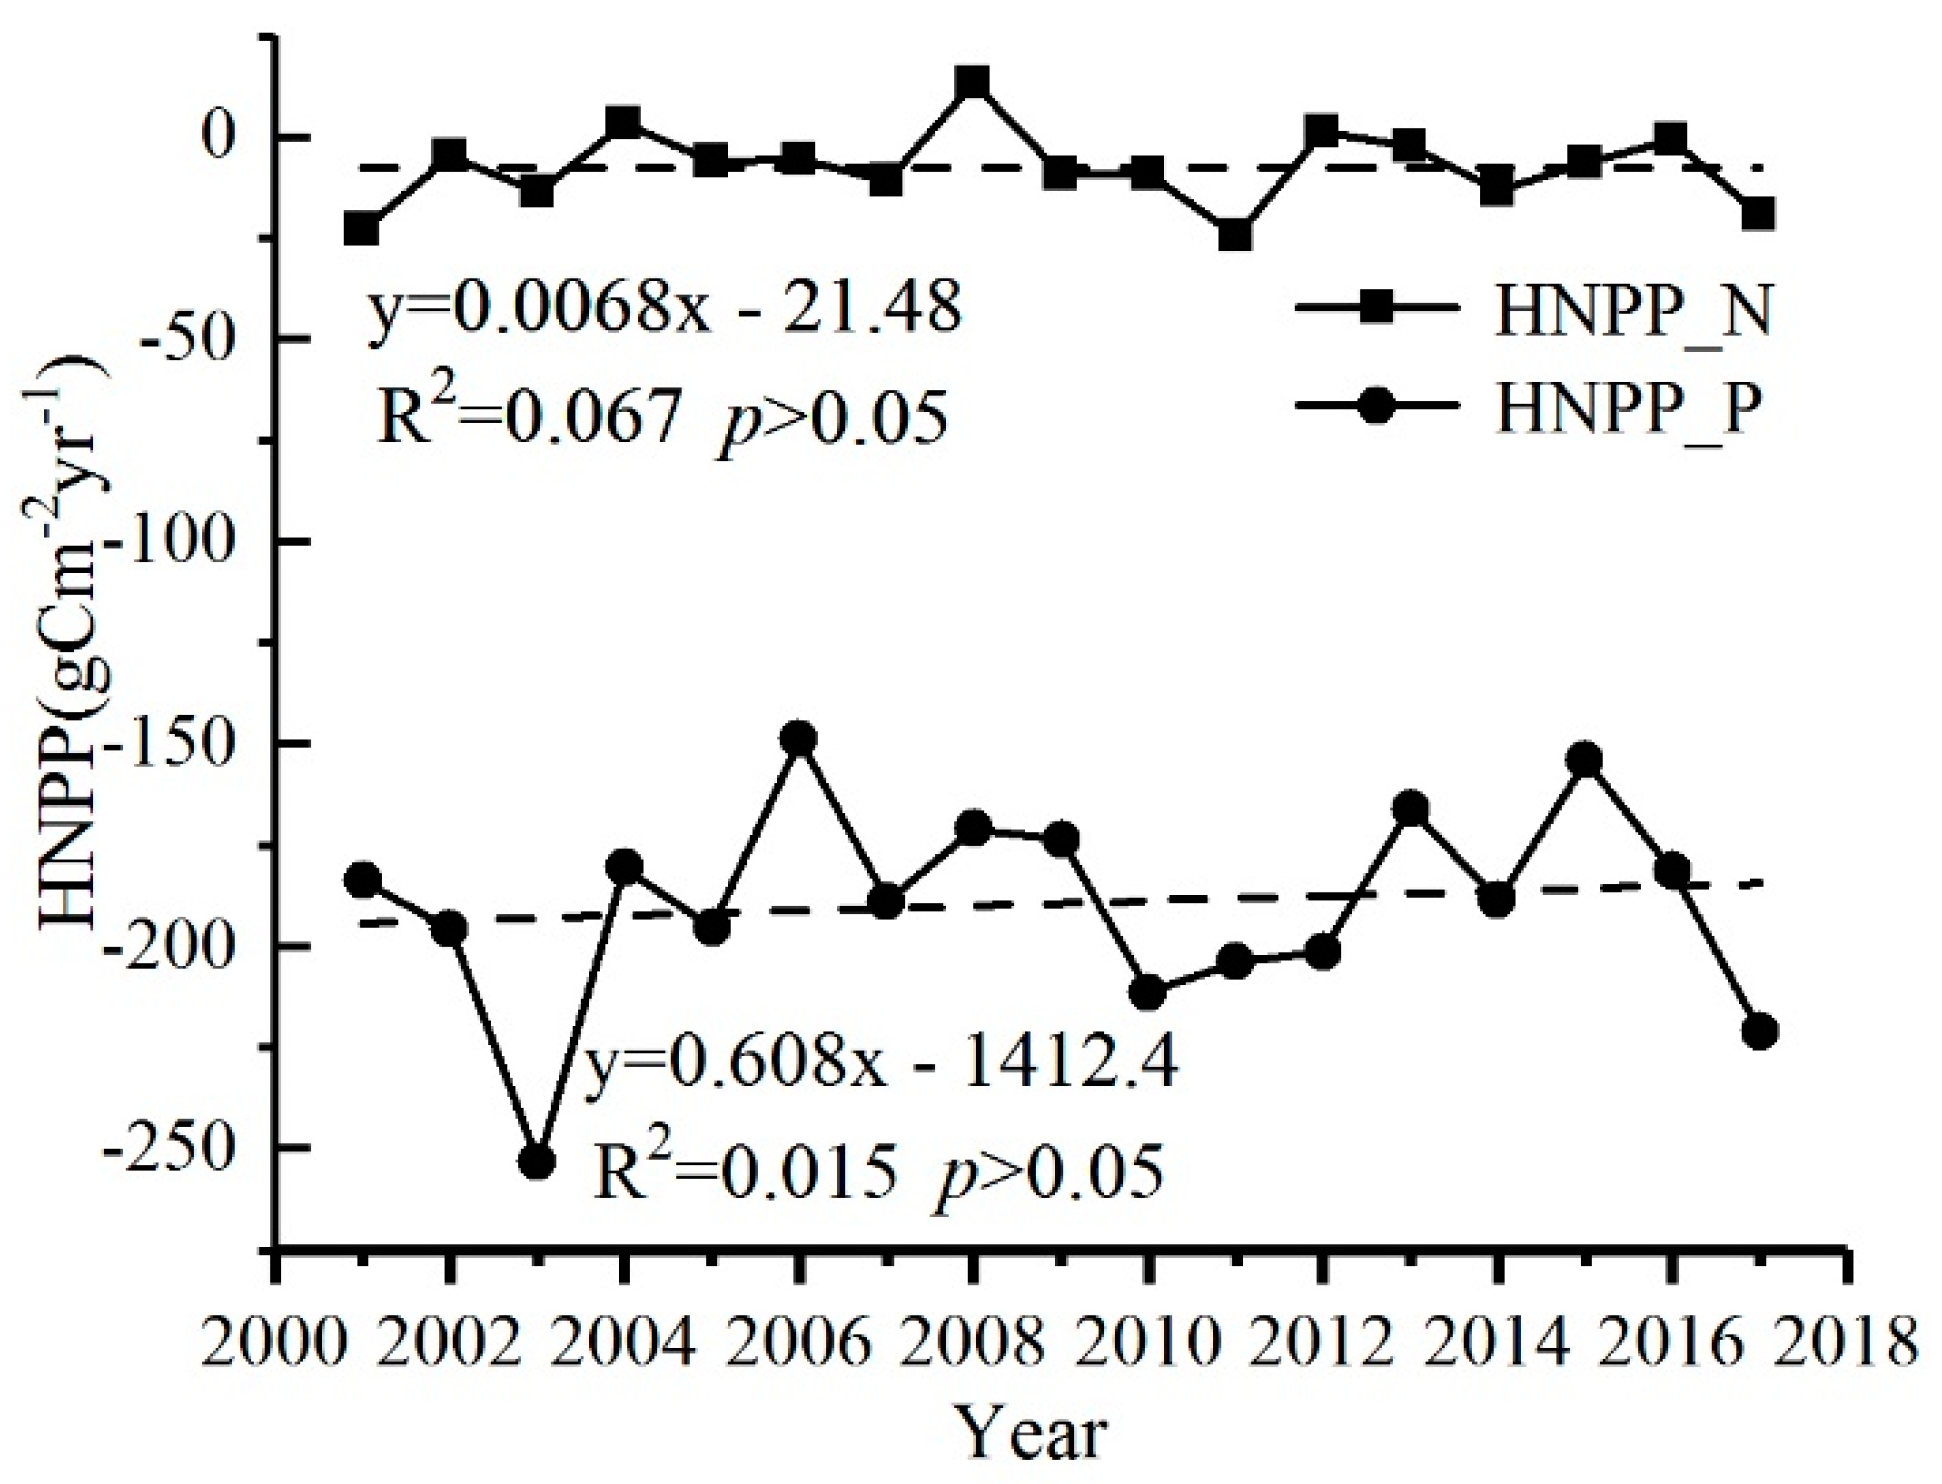
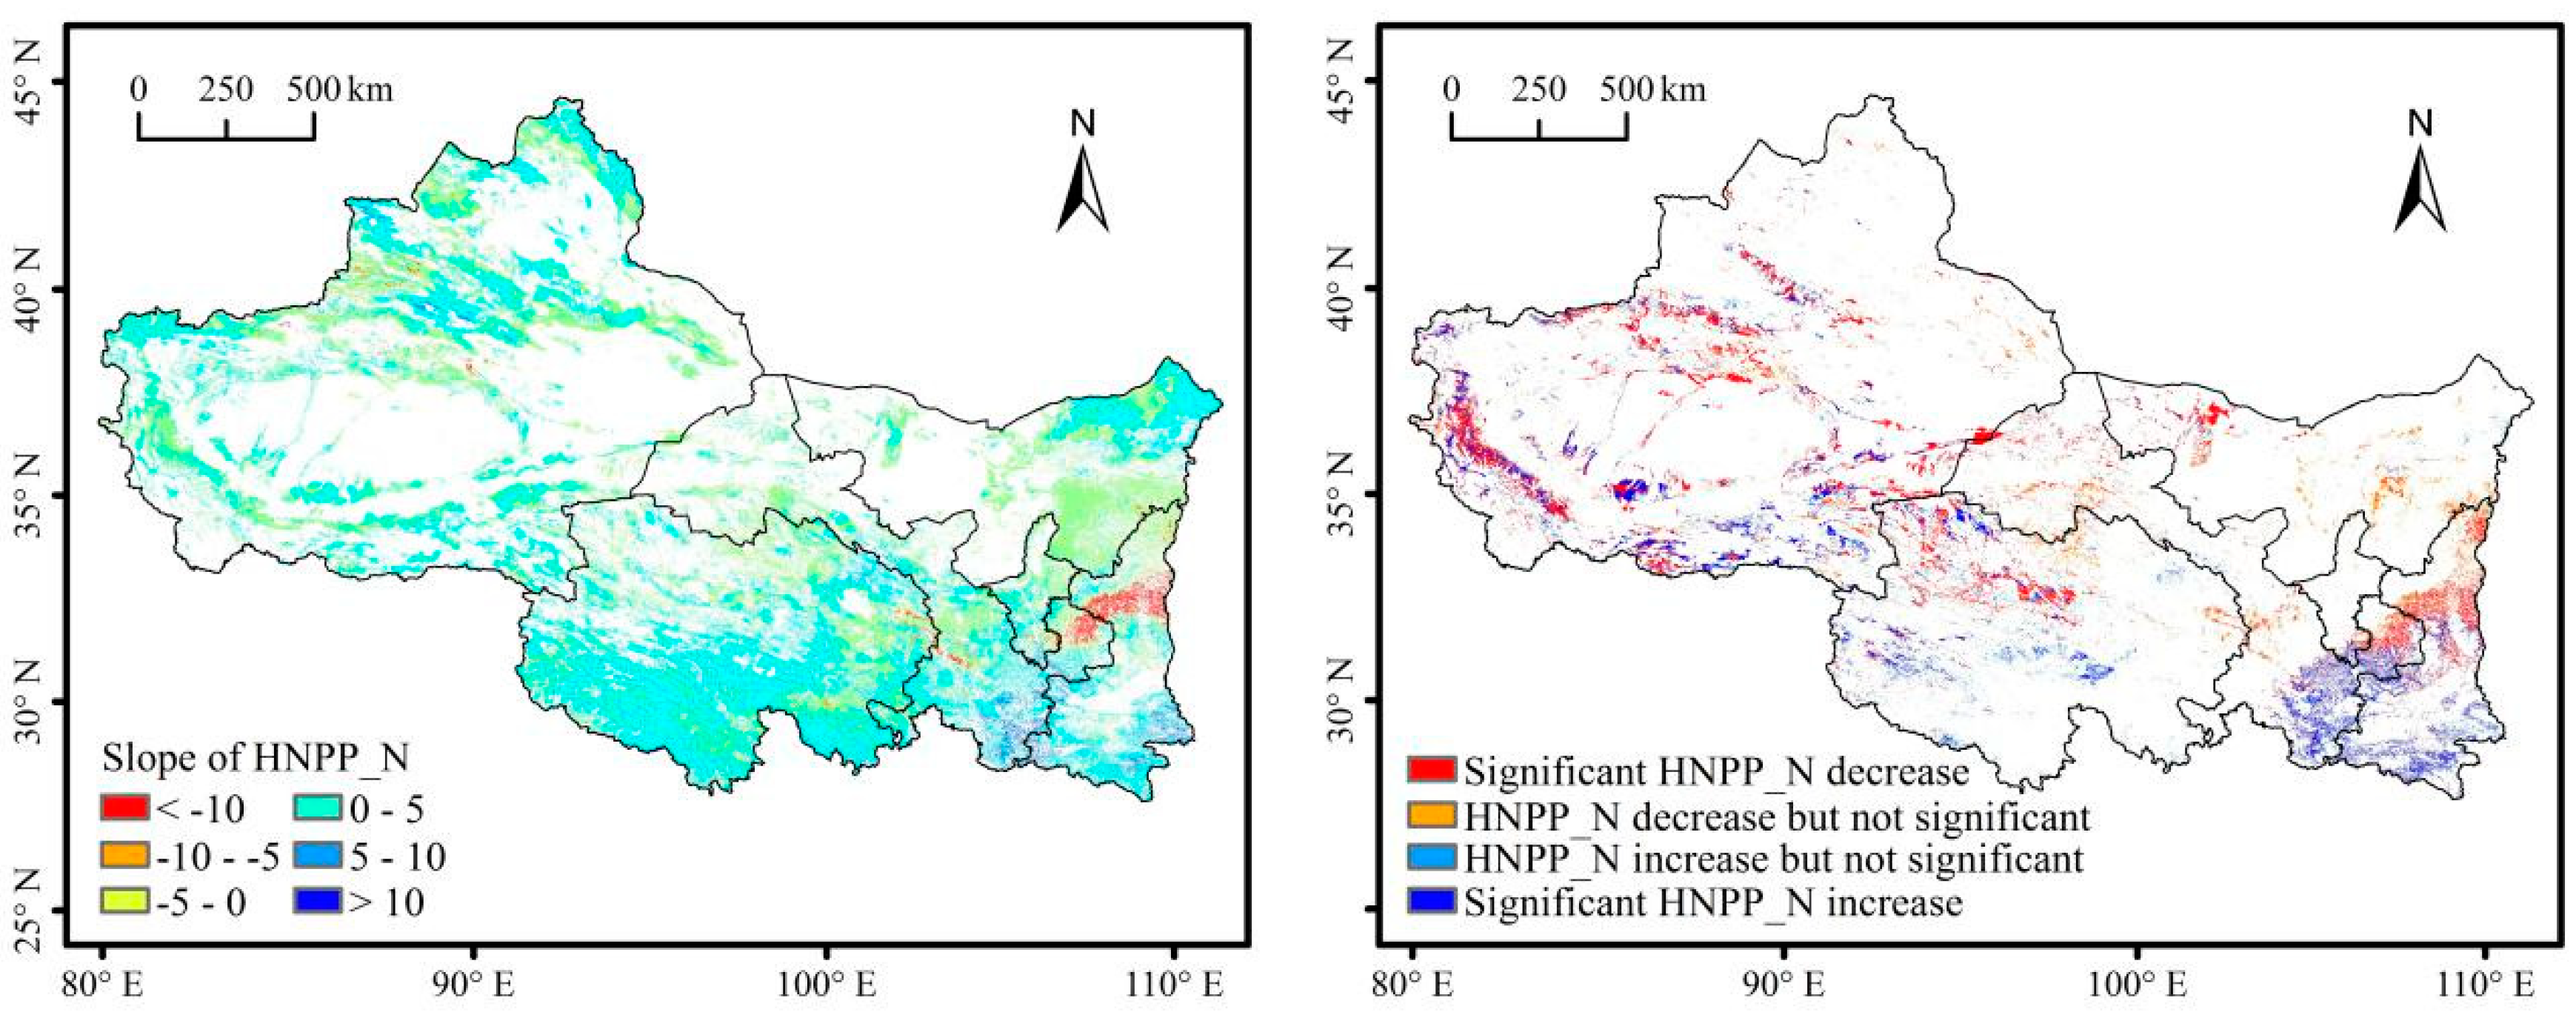
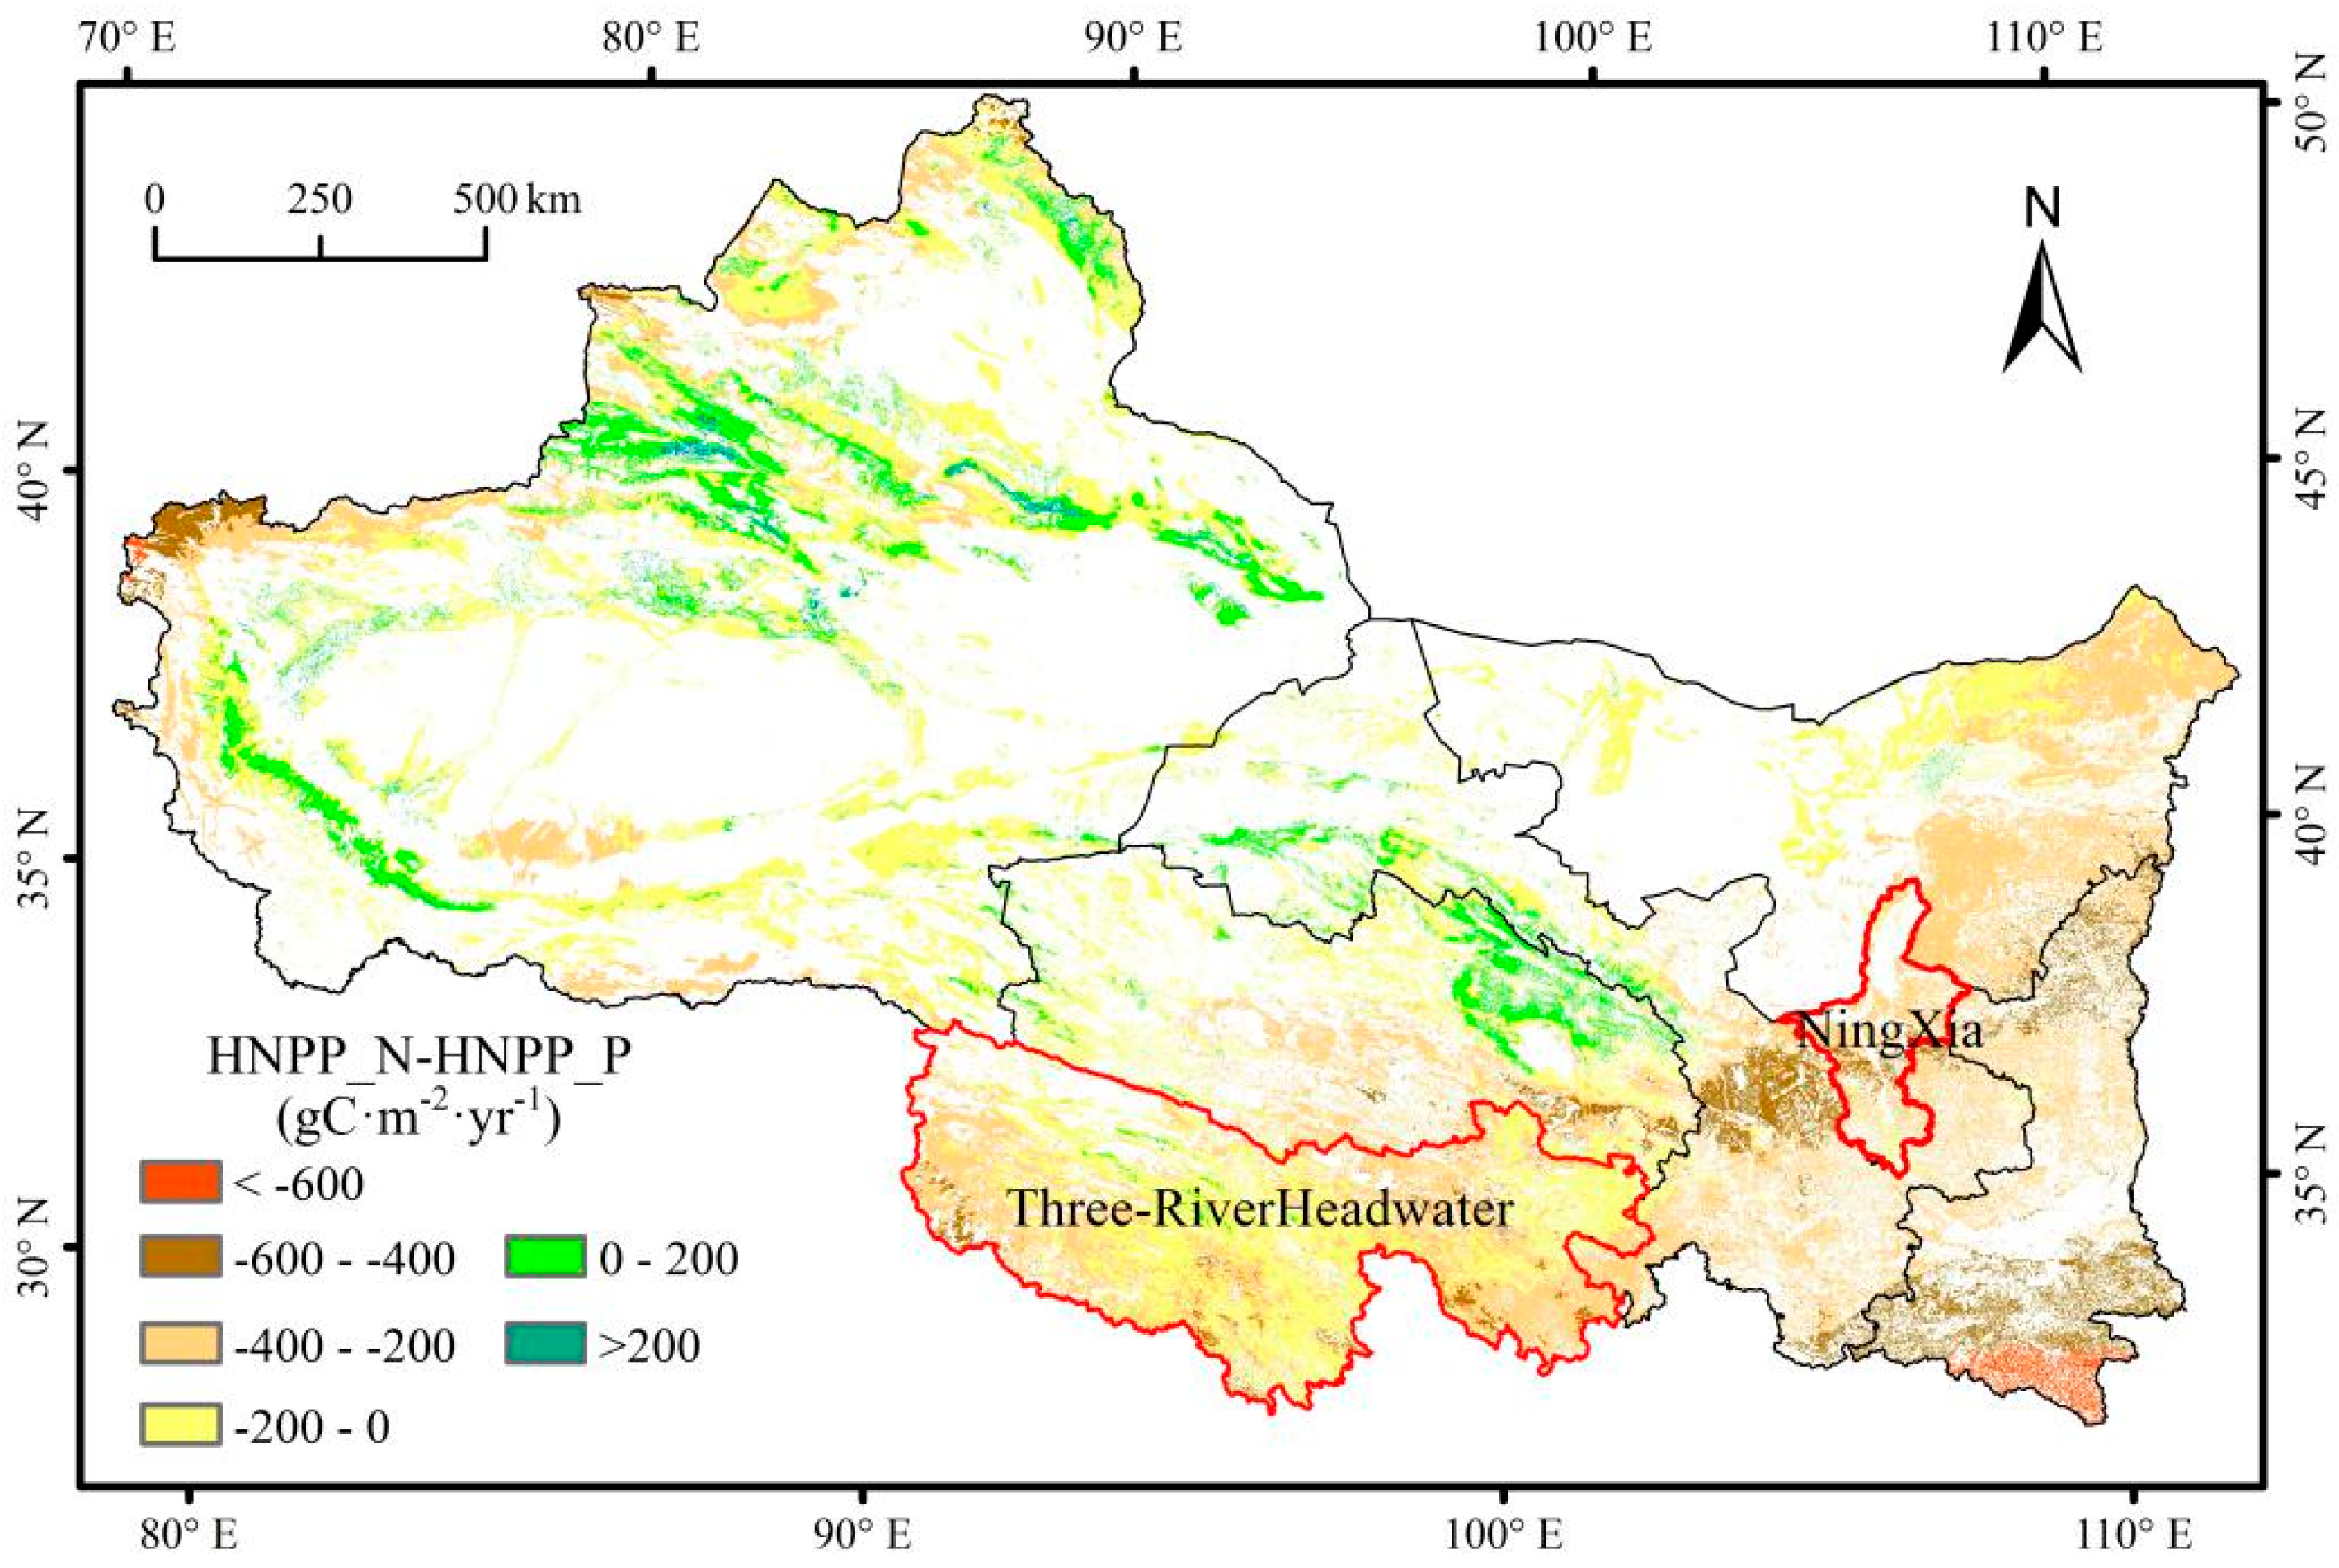
3.3. HNPP_N and HNPP_P

The HNPP_N > 0 accounted for 40.28% of the total grassland area (Figure 11a), with an average value of 28.65 gC·m−2·yr−1. HNPP_N < 0 accounted for 59.72% of the total area, with an average value of −31.19 gC·m−2·yr−1. The areas with HNPP_N > 0 are mainly distributed in central Inner Mongolia, southern Qinghai Province, Qilian Mountains in Gansu Province, northern Tianshan Mountains, and Altai Mountains in Xinjiang. The areas with HNPP_N < 0 are mainly distributed in the southern Shaanxi, where the population is dense and human activities are intense. On the whole, the HNPP_N showed a weak negative impact from human activities, with an average value of −7.45 gC·m−2·yr−1 (Figure 11a). The changing trend of HNPP_N was not significant (Figure 12). The maximum value (13.17 gC·m−2·yr−1) was recorded in 2008, and the minimum value (−24.33 gC·m−2·yr−1) was found in 2011. The HNPP_N of grassland in Northwest China from 2001 to 2017 shows an increasing trend in 48.96% of grassland HNPP_N (Figure 13). Among them, the areas with significant increase trends accounted for 9.69%, mainly in the southern regions of Shaanxi, Gansu and Qinghai province. However, 41.14% of grassland HNPP_N in the northwest region showed decreasing trends, and 12.64% of the regions showed significant decreasing trends, which were mainly distributed in the northern Shaanxi, Tianshan Mountains, Kunlun Mountains, and the southwestern Altai Mountains.
HNPP_P ranged from −148.97–−253.39 gC·m−2·yr−1, with an average value of −189.15 gC·m−2·yr−1 (Figure 13). However, HNPP_P > 0 accounts for 11.21% of the total grassland area (Figure 11b), which mainly distributed in the Qilian, Tianshan, and Altai Mountains. The HNPP_P < 0 accounted for 88.79% of the total grassland area (Figure 11b), with an average value of −224.58 gC·m−2·yr−1. Negative values are widely distributed, and the lowest values are mainly distributed in southern Shaanxi and southern Gansu. The population density in the above-mentioned areas is relatively high, and human activities are intense.

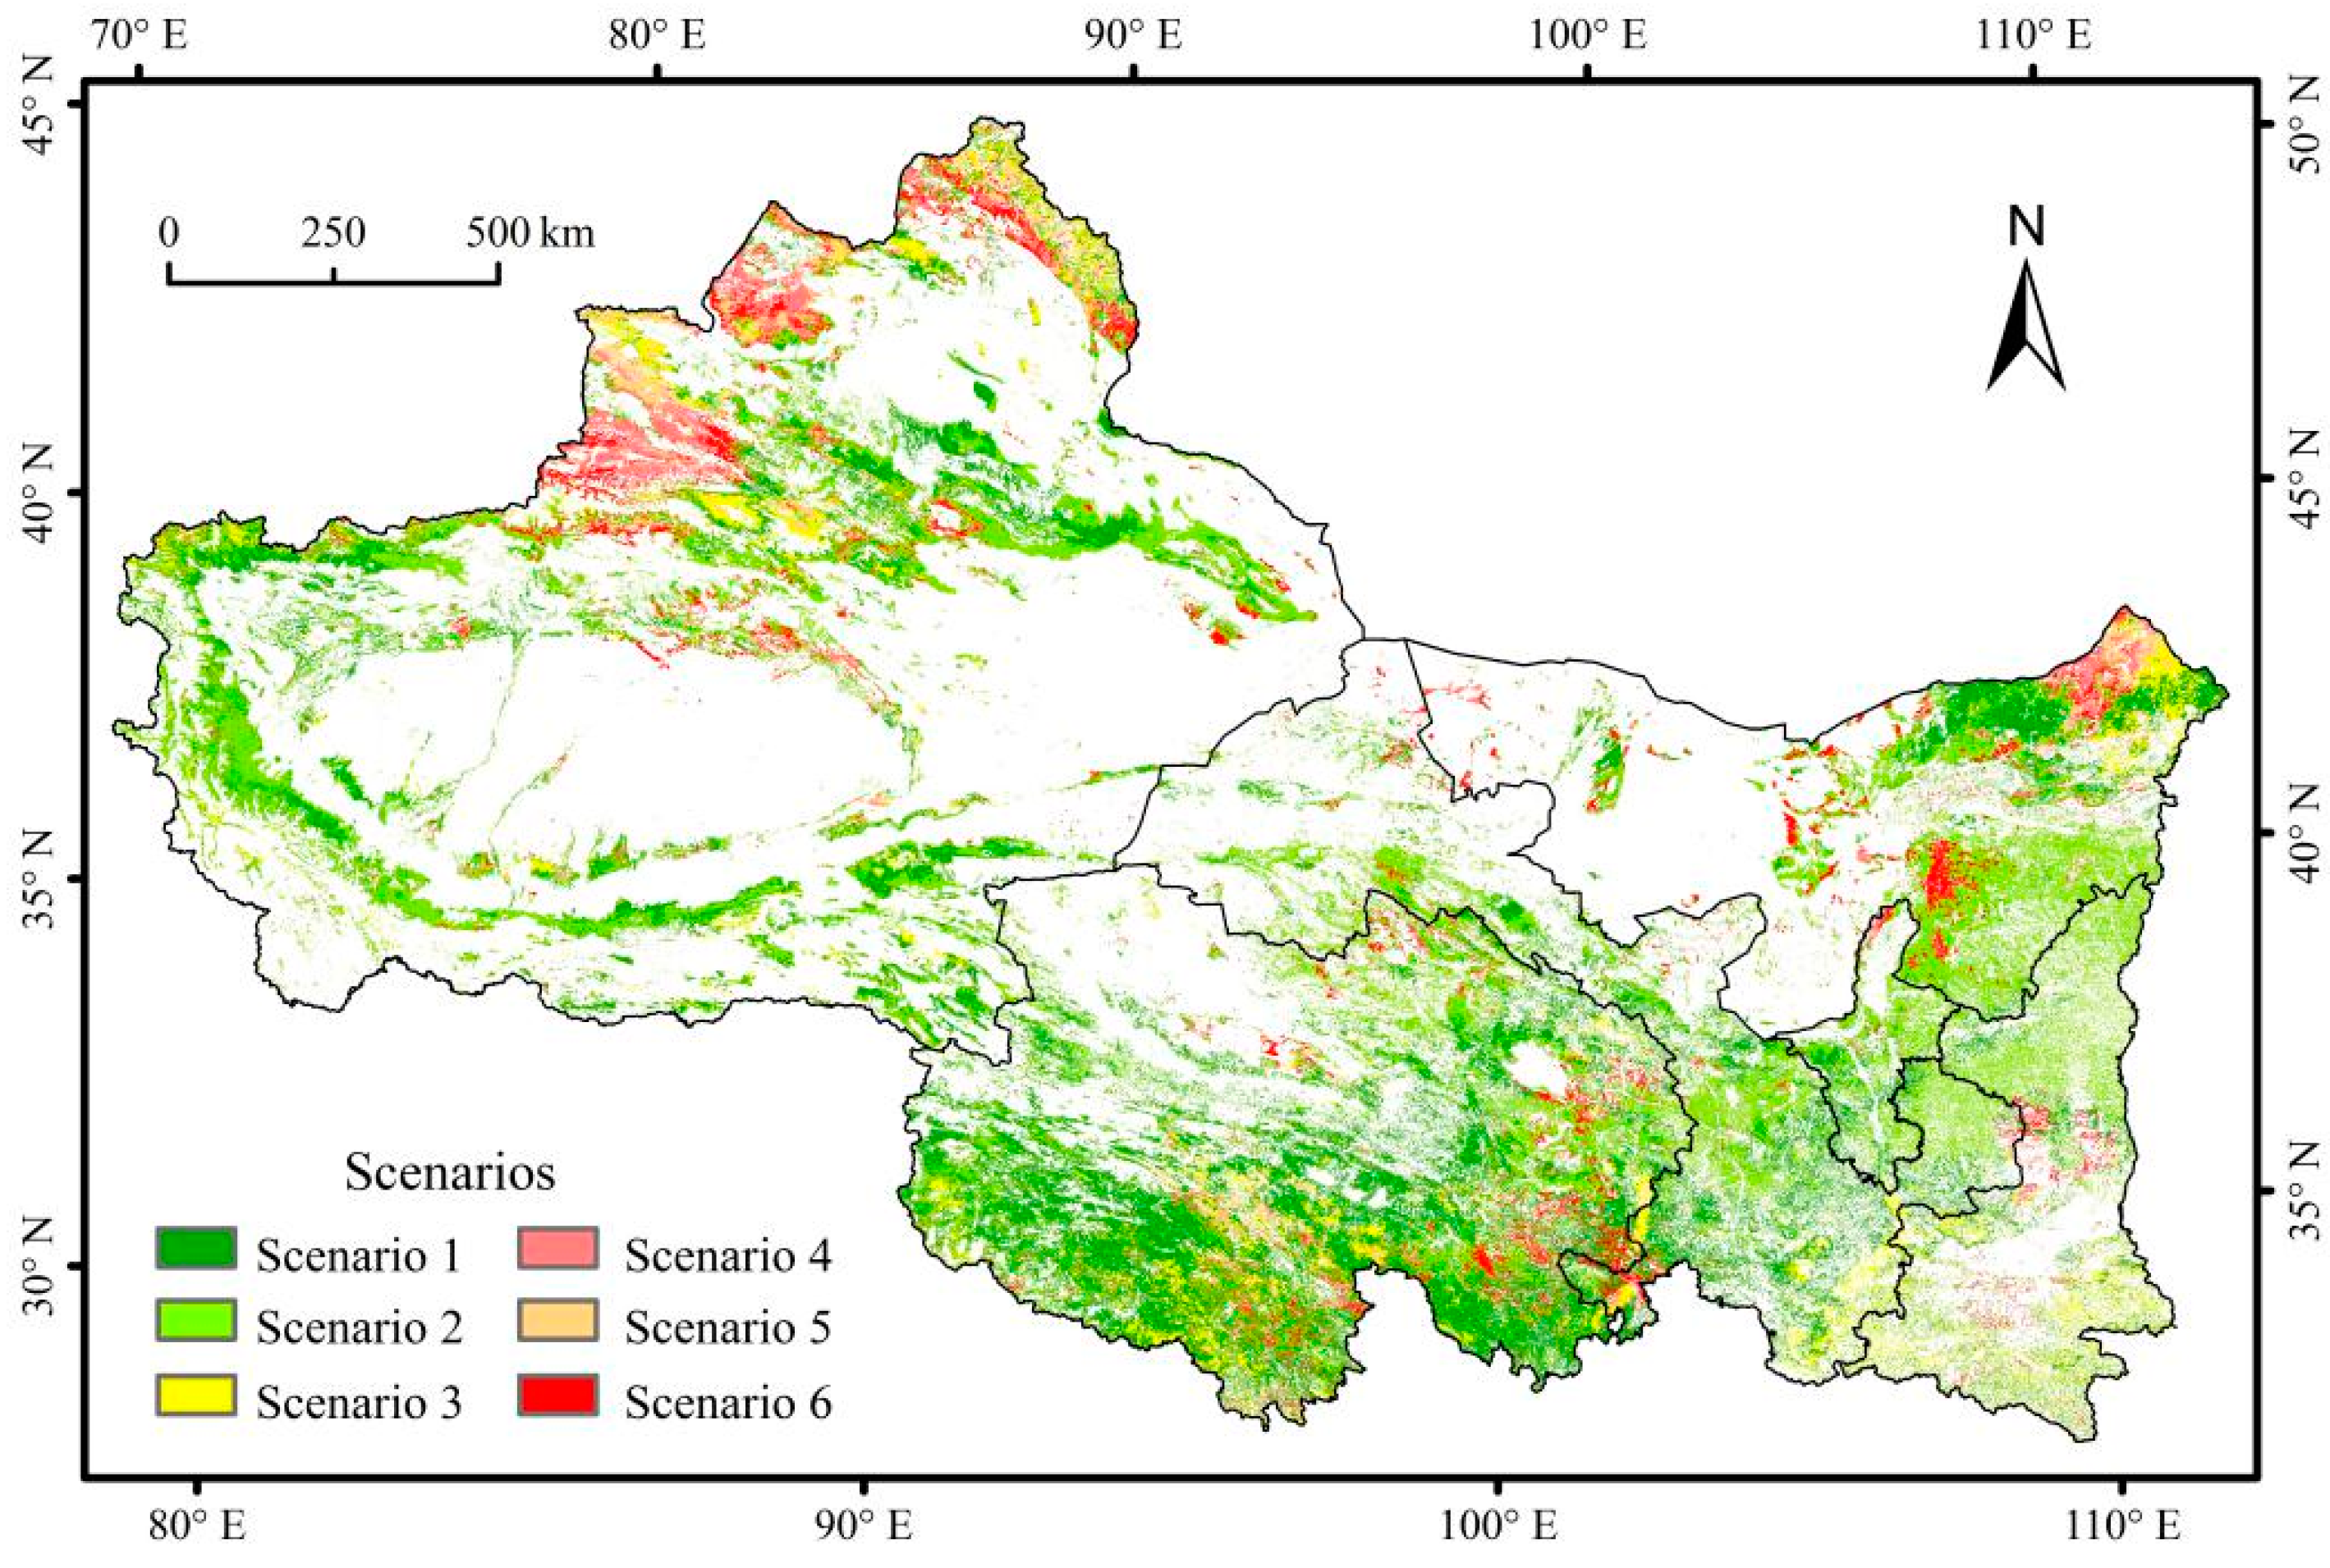
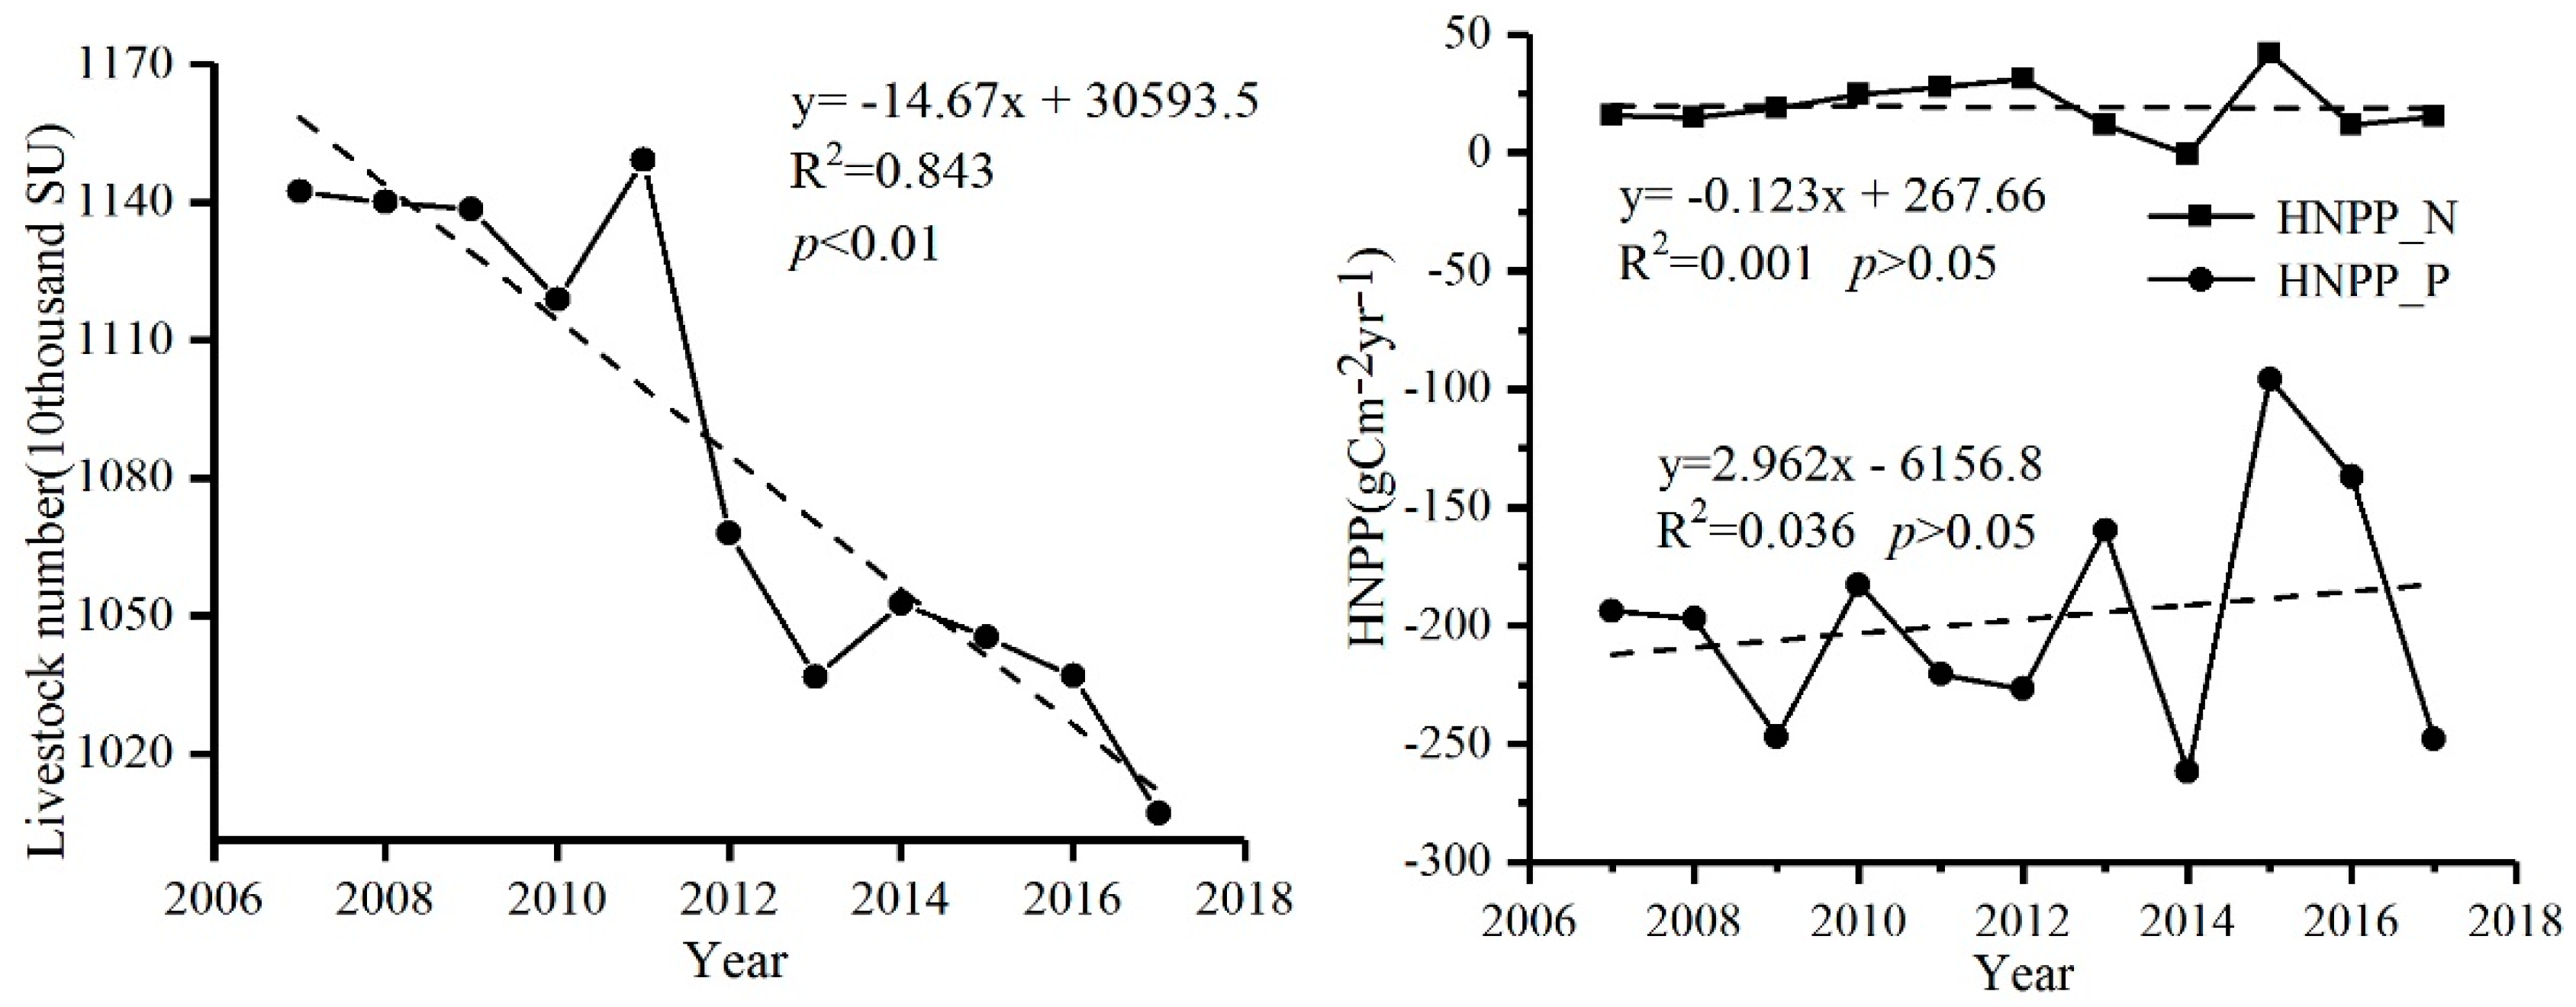
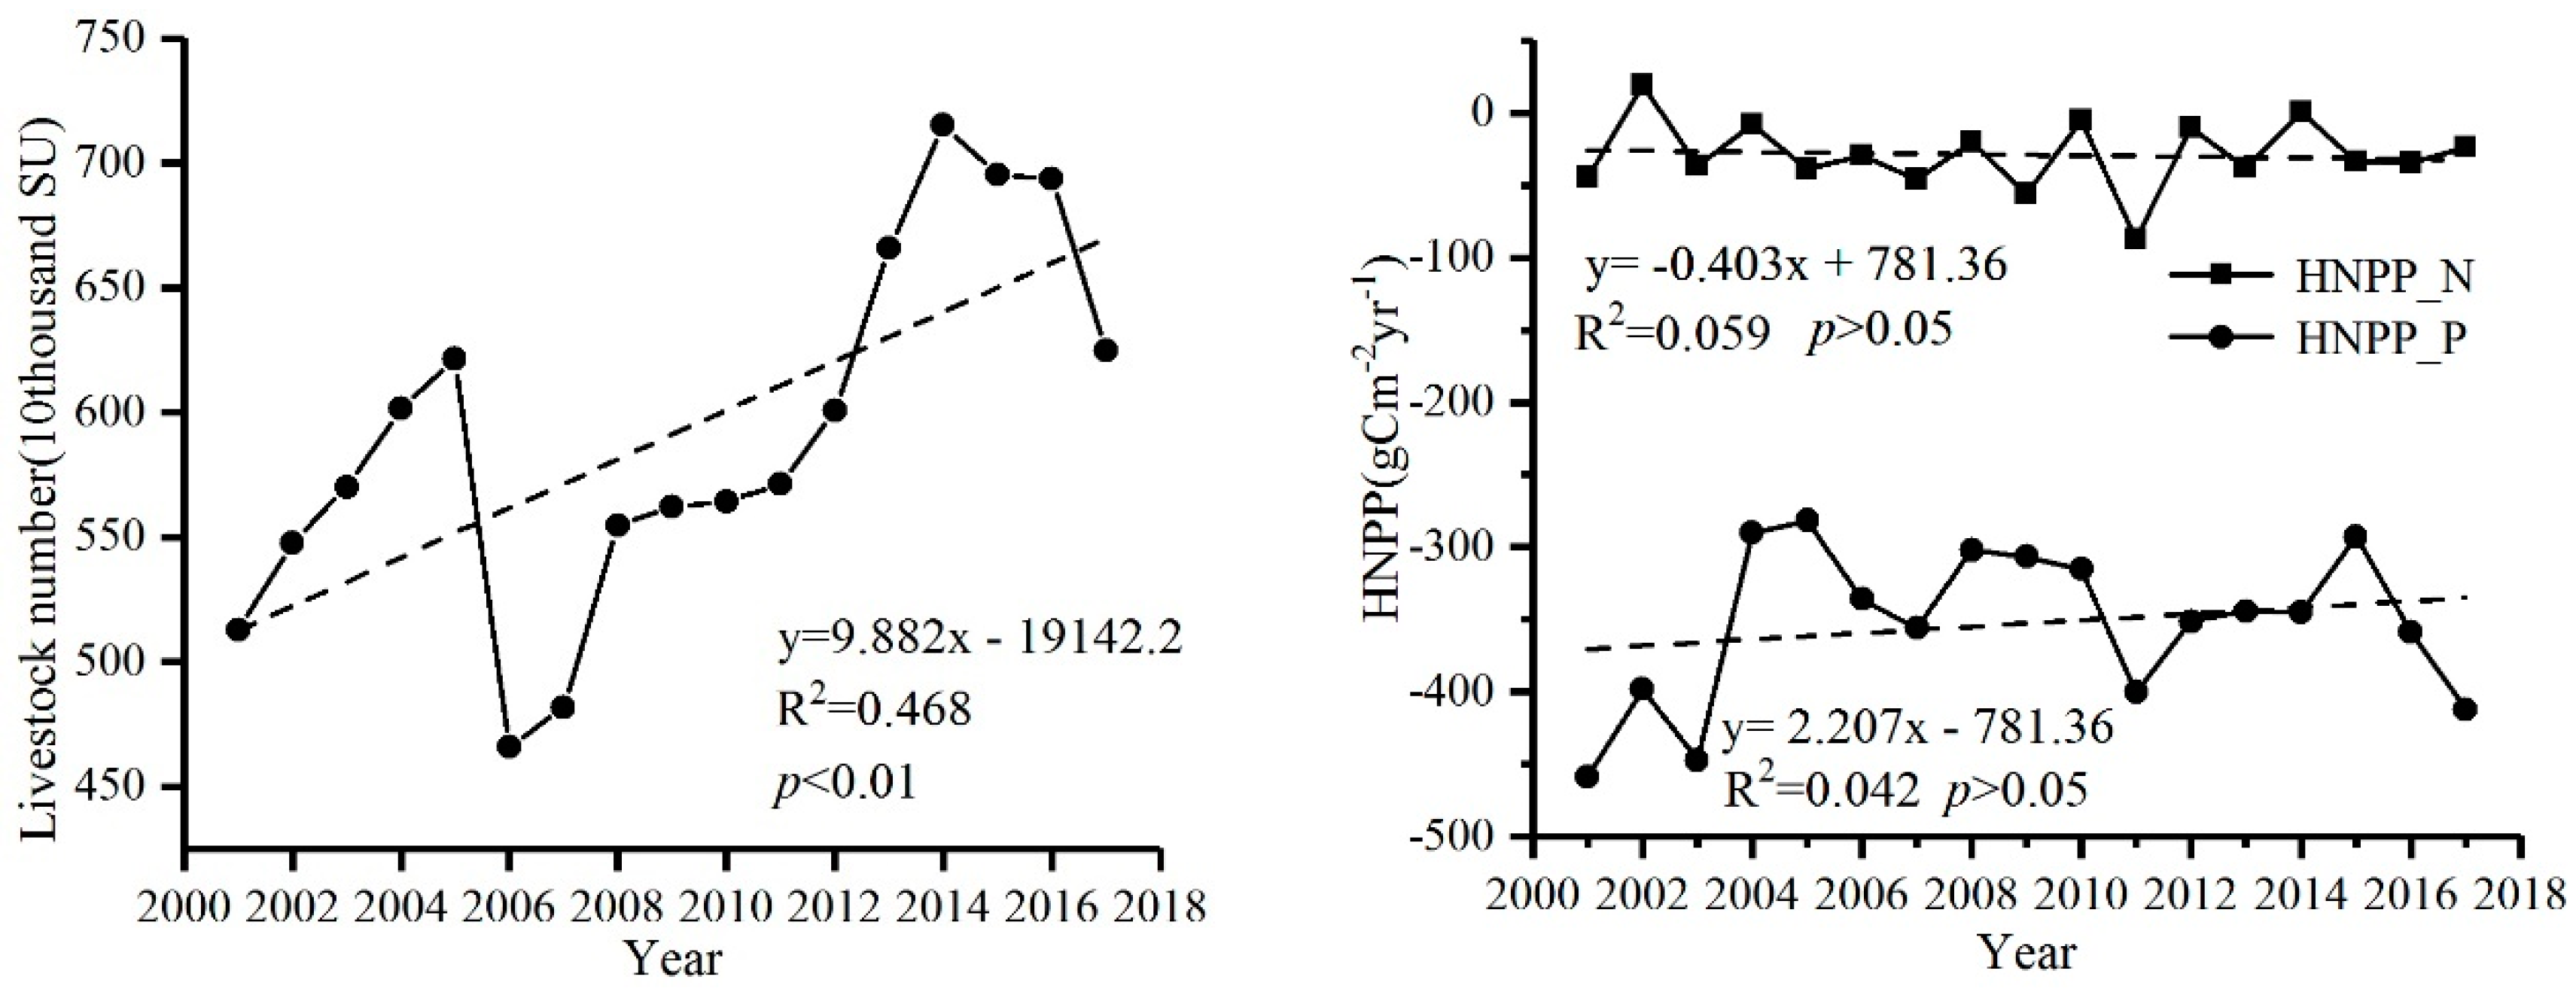
3.4. The Relative Roles of Human Activities and Climate Change in Grassland Change

The spatial distribution of grassland ANPP change, including climate variation, human activities, and combined effects of climate variation and human activities during the 2001–2017 were analyzed (Table 1 and Figure 14). In order to disentangle the relative effects of human activities and climate change in the process of grassland change, six possible scenarios were defined (Table 1) and evaluated by calculating the Slope of ANPP, NNPP, and HNPP_N.
From 2001 to 2017, 84.32% of the grassland showed increasing trends, and the degraded areas only accounted for 15.68% in the Northwest China. Human activity played a minor role in grassland change (16.34%), while the improvement of grassland was mainly attribute to climate. Human activities accounted for only 11.43% of areas with increasing NPP. However, the main factor of grassland degradation was human activity, accounting for 42.73% of the degraded area. In the study area, the population are sparse (29.36 people/km2). The desert is widespread in this region, and the human activities is limited to the city, oasis, and its surrounding areas. During the past 30 years, precipitation had increased slightly, and the vegetation coverage had been increasing in the region [33]. This is consistent with the conclusion that grassland restoration is mainly dominated by climate change in previous study [34]. Grassland degradation is mainly dominated by human activities [15] and is distributed in major pastoral areas, such as central Inner Mongolia, Tianshan Mountains, and Altai Mountains. Overgrazing exceeds the carrying capacity of the grasslands, and then leads to grassland degradation [35].

4. Discussion

4.1. NNPP and PNPP

During the study period, the average values of NNPP, PNPP, and ANPP were 243.60 gC·m−2·yr−1, 421.96 gC·m−2·yr−1, and 236.99 gC·m−2·yr−1, respectively. PNPP was much higher than NNPP and ANPP. The area with higher PNPP values than NNPP accounted for 88.51% of the study area (Figure 15). This may be explained as that the Thornthwaite Memorial Model just considers the climatic factors and ignores factors such as vegetation type, water and temperature stress on plant growth, and photosynthesis efficiency. The areas with lower PNPP values than NNPP are mainly distributed in the mountainous areas. These areas are widely covered by snow and glaciers, which absorb heat of the mountainous areas during the melting of snow and glaciers in summer and have a great impact on the temperature. Therefore, the actual evaporation in the Thornthwaite Memorial Model may be exaggerated, resulting in a smaller PNPP.
According to the theoretical premise of this study, the NNPP should have a strong correlation with ANPP. The correlation coefficient 0.95, which is much higher than the correlation between ANPP and PNPP (R2 = 0.72). The NNPP estimation considers the parameters that were not included in the climatological model such as NDVI, altitude, slope, aspect, solar radiation, and solar radiation of the growing season. Therefore, NNPP estimated by random forest is more reliable than PNPP.

4.2. HNPP_N Is More Consistent with the Actual Situation Than HNPP_T

The mean values of HNPP_N and HNPP_P were −7.45 gC·m−2·yr−1 and −189.15 gC·m−2·yr−1, accounting for 3.14% and 79.81% of ANPP, respectively. The former showed that human activities had weak negative effects, and the latter indicated strong negative effects. The spatial pattern of HNPP also showed great differences (Figure 16).
The HNPP_N > 0 (24.068 gC·m−2·yr−1) and HNPP_P < 0 (−197.120 gC·m−2·yr−1) in the Three-River Source Region (Figure 11), where the main human activity is grazing. Since 2003, the “Animal Reduction Project” has been implemented in the Three-River Source Region. By 2015, the stocking pressure index has decreased by 34.3% [36]. According to the statistical data from 2007 to 2017, and the inventory showed a significant decline of 146,700 stock unit (SU) per year (Figure 17). The livestock reduction project has achieved significant result [3]. In addition to livestock reduction measures, the Three-River Source region has implemented a series of ecological restoration measures, such as grass fences, artificial replanting of grass seeds, artificial rainfall, and rodent control. The total area of returning farmland to forest and grassland is approximately 102.07 km2 [33], and comprehensive management of 3.49 × 10⁷ km2 was implemented for improve grassland yield, forage quality, disaster resistance, and species diversity [3]. Therefore, the human activities in this area had a positive effect on grassland, indicating that the HNPP_N results were more accurate.
Ningxia is one of the important pastoral areas in China. From 2001 to 2017, this area showed an increasing trend of livestock numbers (Figure 18). The increasing livestock leads to an increase in the negative impact of human activities and the degradation of grassland vegetation in the region [36]. During this period, the negative impact of HNPP_N had been increasing, while HNPP_P had been decreasing, and the former was more consistent with the actual situation (Figure 16).

5. Conclusions

The NNPP estimated by ANPP based on the grids without effects of human activities proposed in this study can accurately reflect the ANPP of vegetation. Using this method, we found that human activities have a weak negative impact on the NPP of grassland in Northwest China, and the grassland degradation was mainly caused by human activities, but the restoration is mainly caused by climate warming and humidification. This method can be used to evaluate the effectiveness of ecological environment treatment and provide quantitative basis for scientifically building the strategy to cope with climate change.
This study selected grassland in Northwest China as study area. This method may be also applicable to other types of vegetation and regions, and the main differences are the indices to identify grids without the effects of human activities. For example, forest land is a perennial plant, and the interannual changing pattern of NPP is different from that of grassland. In addition, the random forest algorithm is used to upscale the NPP in this study, other approaches such as deep learning methods may be also useful tools to study the temporal and spatial changes in NPP.

Author Contributions

Conceptualization, C.L. and X.W.; methodology, C.L., T.D.; software, T.Z.; validation, Y.W.; formal analysis, H.Y.; investigation, M.Z., Y.W., and T.D.; writing—original draft preparation, T.D., X.W.; writing—review and editing, L.L., C.L., and X.W. All authors have read and agreed to the published version of the manuscript.

Funding

This study was financially supported by the National Natural Science Foundation of China (41761083, 32061143032, 41801060), the state key laboratory of Cryospheric Science (SKLCS-ZZ-2021), the Strategic Priority Research Program of Chinese Academy of Sciences (XDA20100103), and the West Light Foundation of the Chinese Academy of Sciences.

Institutional Review Board Statement

Not applicable.

Informed Consent Statement

Not applicable.

Data Availability Statement

Not applicable.

Conflicts of Interest

The authors declare no conflict of interest.

References

  1. Liu, Y.; Zhang, Z.; Tong, L.; Khalifa, M.; Wang, Q.; Gang, C.; Wang, Z.; Li, J.; Sun, Z. Assessing the effects of climate variation and human activities on grassland degradation and restoration across the globe. Ecol. Indic. 2019, 106, 105504. [Google Scholar] [CrossRef]
  2. Yang, Y.; Wang, Z.; Li, J.; Gang, C.; Zhang, Y.; Zhang, Y.; Odeh, I.; Qi, J. Comparative assessment of grassland degradation dynamics in response to climate variation and human activities in China, Mongolia, Pakistan and Uzbekistan from 2000 to 2013. J. Arid Environ. 2016, 135, 164–172. [Google Scholar] [CrossRef]
  3. Ying, Z.; Zhang, C.-B.; Wang, Z.-Q.; Yang, Y.; Zhang, Y.-Z.; Li, J.-L.; An, R. Quantitative assessment of relative roles of climate change and human activities on grassland net primary productivity in the Three-River Source Region, China. Acta Prataculturae Sin. 2017, 26, 1–14. [Google Scholar]
  4. Field, C.B.; Behrenfeld, M.J.; Randerson, J.T.; Falkowski, P. Primary production of the biosphere: Integrating terrestrial and oceanic components. Science 1998, 281, 237–240. [Google Scholar] [CrossRef] [PubMed] [Green Version]
  5. Gang, C.; Zhou, W.; Chen, Y.; Wang, Z.; Sun, Z.; Li, J.; Qi, J.; Odeh, I. Quantitative assessment of the contributions of climate change and human activities on global grassland degradation. Environ. Earth Sci. 2014, 72, 4273–4282. [Google Scholar] [CrossRef]
  6. Saikku, L.; Mattila, T.; Akujaervi, A.; Liski, J. Bioenergy, Human appropriation of net primary production in Finland during 1990–2010. Biomass Bioenergy 2015, 83, 559–567. [Google Scholar] [CrossRef]
  7. Luo, Z.; Wu, W.; Yu, X.; Song, Q.; Yang, J.; Wu, J.; Zhang, H. Variation of net primary production and its correlation with climate change and anthropogenic activities over the Tibetan Plateau. Remote Sens. 2018, 10, 1352. [Google Scholar] [CrossRef]
  8. Li, Q.; Zhang, C.; Shen, Y.; Jia, W.; Jiao, L. Quantitative assessment of the relative roles of climate change and human activities in desertification processes on the Qinghai-Tibet Plateau based on net primary productivity. Catena 2016, 147, 789–796. [Google Scholar] [CrossRef]
  9. Potter, C.S.; Randerson, J.T.; Field, C.B.; Matson, P.A.; Vitousek, P.M.; Mooney, H.A.; Klooster, S.A. Terrestrial ecosystem production: A process model based on global satellite and surface data. Glob. Biogeochem. Cycles 1993, 7, 811–841. [Google Scholar] [CrossRef]
  10. Mu, S.; Zhou, S.; Chen, Y.; Li, J.; Ju, W.; Odeh, I.J.G.; Change, P. Assessing the impact of restoration-induced land conversion and management alternatives on net primary productivity in Inner Mongolian grassland, China. Glob. Planet. Chang. 2013, 108, 29–41. [Google Scholar] [CrossRef]
  11. Chen, T.; Bao, A.; Jiapaer, G.; Guo, H.; Zheng, G.; Jiang, L.; Chang, C.; Tuerhanjiang, L. Disentangling the relative impacts of climate change and human activities on arid and semiarid grasslands in Central Asia during 1982–2015. Sci. Total Environ. 2019, 653, 1311–1325. [Google Scholar] [CrossRef] [PubMed]
  12. Lieth, H.J. Resources, Modeling the Primary Productivity of the World. In Primary Productivity of the Biosphere; Springer: Berlin/Heidelberg, Germany, 1975. [Google Scholar]
  13. Thornthwaite, C. An approach toward a rational classification of climate. Geogr. Rev. 1948, 38, 55–94. [Google Scholar] [CrossRef]
  14. Wu, X.; Fang, H.; Zhao, Y.; Smoak, J.M.; Li, W.; Shi, W.; Sheng, Y.; Zhao, L.; Ding, Y. A conceptual model of the controlling factors of soil organic carbon and nitrogen densities in a permafrost-affected region on the eastern Qinghai-Tibetan Plateau. J. Geophys. Res. Biogeosci. 2017, 122, 1705–1717. [Google Scholar] [CrossRef]
  15. Zhang, C.; Wang, X.; Li, J.; Hua, T. Roles of climate changes and human interventions in land degradation: A case study by net primary productivity analysis in China’s Shiyanghe Basin. Environ. Earth Sci. 2011, 64, 2183–2193. [Google Scholar] [CrossRef]
  16. Ni, J. Carbon storage in grasslands of China. J. Arid Environ. 2002, 50, 205–218. [Google Scholar] [CrossRef]
  17. Zhou, Y.; Zhang, L.; Xiao, J.; Williams, C.A.; Vitkovskaya, I.; Bao, A. Spatiotemporal transition of institutional and socioeconomic impacts on vegetation productivity in Central Asia over last three decades. Sci. Total Environ. 2019, 658, 922–935. [Google Scholar] [CrossRef]
  18. Chen, T.; Tang, G.; Yuan, Y.; Guo, H.; Xu, Z.; Jiang, G.; Chen, X. Unraveling the relative impacts of climate change and human activities on grassland productivity in Central Asia over last three decades. Sci. Total Environ. 2020, 743, 140649. [Google Scholar] [CrossRef]
  19. Zhang, Y.; Wang, Q.; Wang, Z.; Yang, Y.; Li, J. Impact of human activities and climate change on the grassland dynamics under different regime policies in the Mongolian Plateau. Sci. Total Environ. 2020, 698, 134304. [Google Scholar] [CrossRef]
  20. Wang, P.; Xie, D.; Zhou, Y.; Youhao, E.; Zhu, Q. Estimation of net primary productivity using a process-based model in Gansu Province, Northwest China. Environ. Earth Sci. 2014, 71, 647–658. [Google Scholar] [CrossRef]
  21. Xia, J.; Ma, M.; Liang, T.; Wu, C.; Yang, Y.; Zhang, L.; Zhang, Y.; Yuan, W. Estimates of grassland biomass and turnover time on the Tibetan Plateau. Environ. Res. Lett. 2018, 13, 014020. [Google Scholar] [CrossRef]
  22. Zhu, W.-Q.; Pan, Y.-Z.; Zhang, J.-S. Estimation of net primary productivity of Chinese terrestrial vegetation based on remote sensing. Chin. J. Plant Ecol. 2007, 31, 413. [Google Scholar]
  23. Yu, D.; Shi, P.; Shao, H.; Zhu, W.; Pan, Y. Modelling net primary productivity of terrestrial ecosystems in East Asia based on an improved CASA ecosystem model. Int. J. Remote Sens. 2009, 30, 4851–4866. [Google Scholar] [CrossRef]
  24. Zhu, W.; Pan, Y.; Hao, H.; Yu, D.; Hu, H. Simulation of maximum light use efficiency for some typical vegetation types in China. Chin. Sci. Bull. 2006, 51, 457–463, (In Chinese with English Abstract). [Google Scholar] [CrossRef]
  25. Wu, D.; Zhao, X.; Liang, S.; Zhou, T.; Huang, K.; Tang, B.; Zhao, W. Time-lag effects of global vegetation responses to climate change. Glob. Chang. Biol. 2015, 21, 3520–3531. [Google Scholar] [CrossRef]
  26. Piao, S.; Fang, J.; He, J. Variations in vegetation net primary production in the Qinghai-Xizang Plateau, China, from 1982 to 1999. Clim. Chang. 2006, 74, 253–267. [Google Scholar] [CrossRef]
  27. Box, E. Quantitative Evaluation of Global Primary Productivity Models Generated by Computers. In Primary Productivity of the Biosphere; Springer: Berlin/Heidelberg, Germany, 1975. [Google Scholar]
  28. Fang, K.N.; Jian-Bina, W.U.; Zhu, J.P.; Bang-Changa, S.J.S.; Forum, I. A review of technologies on random forests. Stat. Inf. Forum 2011, 26, 32–38. [Google Scholar]
  29. Rodriguez-Galiano, V.F.; Chica-Olmo, M.; Abarca-Hernandez, F.; Atkinson, P.M.; Jeganathan, C. Random Forest classification of Mediterranean land cover using multi-seasonal imagery and multi-seasonal texture. Remote Sens. Environ. 2012, 121, 93–107. [Google Scholar] [CrossRef]
  30. Yu, B.; Chen, F.; Chen, H. NPP estimation using random forest and impact feature variable importance analysis. Spat. Sci. 2017, 64, 1–20. [Google Scholar] [CrossRef]
  31. Silveira, E.M.O.; Silva, S.H.G.; Acerbi-Junior, F.W.; Carvalho, M.C.; Carvalho, L.M.T.; Scolforo, J.R.S.; Wulder, M.A. Object-based random forest modelling of aboveground forest biomass outperforms a pixel-based approach in a heterogeneous and mountain tropical environment. Int. J. Appl. Earth Obs. Geoinf. 2019, 78, 175–188. [Google Scholar] [CrossRef]
  32. Piao, S.; Friedlingstein, P.; Ciais, P.; Viovy, N.; Demarty, J. Growing season extension and its impact on terrestrial carbon cycle in the Northern Hemisphere over the past 2 decades. Glob. Biogeochem. Cycles 2007, 21. [Google Scholar] [CrossRef]
  33. Fan, J.-W.; Shao, Q.-Q.; Liu, J.-Y.; Wang, J.-B.; Harris, W.; Chen, Z.-Q.; Zhong, H.-P.; Xu, X.-L.; Liu, R.-G. Assessment of effects of climate change and grazing activity on grassland yield in the Three Rivers Headwaters Region of Qinghai–Tibet Plateau, China. Environ. Monit. Assess. 2009, 170, 571–584. [Google Scholar] [CrossRef]
  34. Zhou, W.; Gang, C.; Zhou, L.; Chen, Y.; Odeh, I. Dynamic of grassland vegetation degradation and its quantitative assessment in the northwest China. Acta Oecol. 2014, 55, 86–96. [Google Scholar] [CrossRef]
  35. Piao, S.; Mohammat, A.; Fang, J.; Cai, Q.; Feng, J. NDVI-based increase in growth of temperate grasslands and its responses to climate changes in China. Glob. Environ. Chang. 2006, 16, 340–348. [Google Scholar] [CrossRef]
  36. Ying, L.I.; Hao, R. Ecology, grazing resource management and grassland degradation in Northern China. J. Resour. Ecol. 2011, 2, 286–288. [Google Scholar]
Figure 1. Study area and grassland spatial distribution in Northwest China.
Remotesensing 13 02479 g001
Figure 2. Flowchart of the NNPP.
Remotesensing 13 02479 g002
Figure 3. Accuracy assessment of simulation value of CASA model.
Remotesensing 13 02479 g003
Figure 4. Annual average change of ANPP.
Remotesensing 13 02479 g004
Figure 5. Spatial distribution of annual average ANPP.
Remotesensing 13 02479 g005
Figure 6. ANPP interannual rate of change and significance from 2001 to 2017.
Remotesensing 13 02479 g006
Figure 7. The grids (red dots) without human activities.
Remotesensing 13 02479 g007
Figure 8. Spatial distribution of annual mean NNPP (a) and PNPP (b) during 2001–2017.
Remotesensing 13 02479 g008
Figure 9. Changes in annual mean NNPP and PNPP.
Remotesensing 13 02479 g009
Figure 10. Interannual changing rate and significance of NNPP.
Remotesensing 13 02479 g010
Figure 11. Spatial distribution of HNPP. (a) HNPP_N, (b) HNPP_P.
Remotesensing 13 02479 g011
Figure 12. Changes in the annual average values of HNPP_N and HNPP_P from 2001 to 2017.
Remotesensing 13 02479 g012
Figure 13. Interannual changing rate and significance of HNPP_N.
Remotesensing 13 02479 g013
Figure 14. Relative effects of climate change and human activities on grassland ANPP.
Remotesensing 13 02479 g014
Figure 15. Spatial distribution of difference between PNPP and NNPP.
Remotesensing 13 02479 g015
Figure 16. Difference between HNPP_N and HNPP_P from 2001 to 2017.
Remotesensing 13 02479 g016
Figure 17. Interannual changes in stocking capacity and HNPP multi-year average in Three-River Source Region from 2007 to 2017.
Remotesensing 13 02479 g017
Figure 18. Inter-annual changes in livestock and HNPP multi-year average in Ningxia from 2001 to 2017.
Remotesensing 13 02479 g018
Table 1. The relative effects of human activity and climate change on grassland change.
Grassland StatusArea (%)ScenariosSlopeNSlopeHDefinition of Driving Factors of Grassland Dynamic
Grassland
Restoration (SlopeA > 0)
35.671>0>0Both of two factors dominated
grassland restoration
39.012>0<0Climate-dominated grassland restoration
9.643<0>0Human activities-dominated grassland restoration
Grassland
Degradation (SlopeA < 0)
5.024<0<0Both of two factors dominated grassland degradation
3.965<0>0Climate-dominated grassland degradation
6.706>0<0Human activities-dominated grassland degradation
Publisher’s Note: MDPI stays neutral with regard to jurisdictional claims in published maps and institutional affiliations.

