Abstract
Fort Stanwix National Monument, located in Rome, NY, is a historic park with a complex use history dating back to the early Colonial period and through the urban expansion and recent economic revitalization of the City of Rome. The goal of this study was to conduct a GPR investigation over an area approximately 1 acre in size to identify buried historic features (particularly buildings) so park management can preserve these resources and develop appropriate educational programming and management plans. The GPR recorded reflection events consistent with our expectations of historic structures. Differences in size, shape, orientation, and depth suggest that these responses likely date to different time periods in the site’s history. The GPR recorded other reflection anomalies that are difficult to interpret without any additional information, which suggests that pairing high-density geophysical data with limited excavations is critical to elaborate a complex site’s intricate history.
1. Introduction
Remote sensing and near-surface geophysics are often used in archaeology to assist in selecting locations for excavation or to create maps of the locations of historical artifacts and architecture from the past. These maps are generally used to infer spatial relationships between these features and derive meaning of social significance or of the human experience for those that created and used the built environment. However, it can be difficult to manage cultural resources at historic sites with complex land use histories and multiple modern stakeholders that have various responsibilities of site preservation, park management, economic development, and educational programing. High resolution maps of a site’s resources are critical to managing these responsibilities effectively and detailing potential remains from various time periods.
Geophysical data acquisition programs, including ground penetrating radar (GPR), can assist in inventorying the remains of the past and have been used in historic archaeology since the 1970s [1,2]. The benefits of GPR for mapping historic sites compared with traditional excavation include the volume of data that can be collected, the preservation of the site (since the methods are generally non-destructive), and the shareability of digital data between stakeholders. While early applications of GPR to historic archaeology were experimental, more recent studies have been successful in inspecting the structural integrity of historic buildings, identifying specific features of interest, mapping historic landscape use, locating graves and delineating cemeteries, and evaluating urban expansion [3,4,5,6,7,8,9,10,11,12,13,14].
The goal of the current study was to conduct a GPR investigation at Fort Stanwix National Monument (located in the city of Rome, Oneida County, New York (Figure 1)) and identify buried historic features so that park management can preserve these resources and develop appropriate educational programming and management plans. The site itself is situated in the urban center of Rome and as a result, the soil type at Fort Stanwix is characterized as an Alton–Urban land complex, and is largely disturbed [15]. For soils of this type, the surface layer is generally 0–23 cm of gravelly loam, with the subsoil consisting of a gravelly sandy loam with 55% rock fragments at depths of 101–140 cm. The depth to bedrock is below 1.5 m. The water table is generally below 1.83 m at highest levels. The deepest deposits characterized during this investigation were less than 1.5 m below ground surface. Our results do not appear to be impacted by bedrock or the water table.
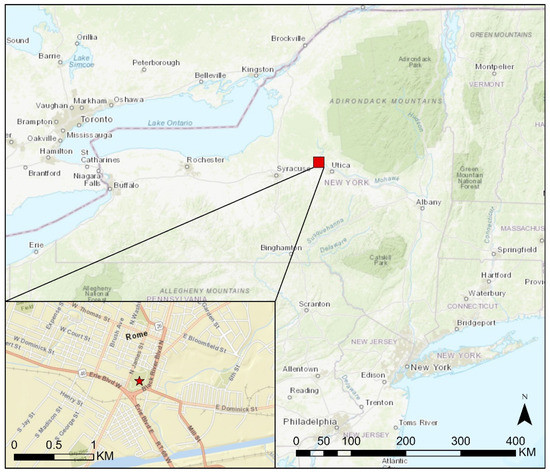
Figure 1.
Location of city of Rome in the state of New York (a red star indicates location of Fort Stanwix National Historic Monument in Rome).
Fort Stanwix was originally constructed in 1758 by the British to protect a critical corridor along the Mohawk valley that facilitated trade between the Iroquois and British. In 1763, an Ottawa leader named Pontiac convinced groups in the area to rebel against the British, and Fort Stanwix fell into disrepair. By 1768, the British called the leaders of the Iroquois to Fort Stanwix and signed the Boundary Line Treaty which helped curb some violence in the area between the two groups. A British garrison remained at the fort until 1774 when the barracks burned down. The fort was rebuilt by the Americans in 1776 at the beginning of the American Revolution. Following the end of the American Revolution, settlers began moving into the fort’s area. Buildings continued to be constructed across the site between 1828 and 1850. In 1927 the State of New York purchased the small plot of land where Fort Stanwix once stood with the mission of turning it into an historic park. The US congress declared their interest in making the park a National Monument as far back as 1935; however, the land would have to be owned by the federal government to make this a reality. The plot was eventually included as part of the Rome Urban Renewal District, which paved the way in 1973 for the City of Rome to purchase the land. They subsequently donated it to the federal government so the park could be named a National Monument and the fort could be reconstructed (Figure 2).
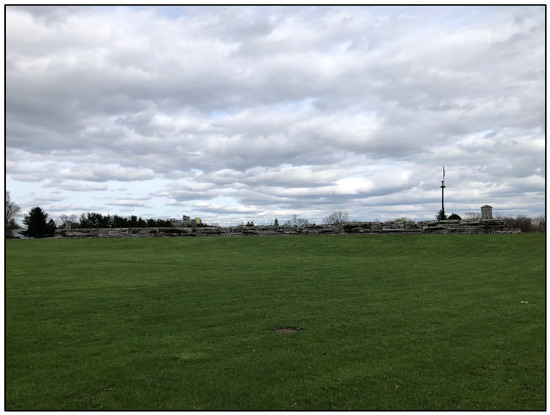
Figure 2.
Photograph showing the reconstructed Fort Stanwix in Rome, NY.
Archaeological investigations were conducted by the Park Service beginning in 1970 with a focus on the Colonial occupation of the fort [16]. Archaeologists working on the excavations noted that buildings were still scattered across the 12 blocks that contained the remains of the fort, and utilities had also been constructed across the area. Earlier excavations [17] indicated that some of the fort’s foundations were still intact, and the park service was able to expose a variety of important historic features including a bakehouse, barracks, bastions, casemates, ditches, a drawbridge, a gateway, a palisade wall, a whipping post, and more. The researchers suggested that “Fort Stanwix was a highly organized military post with all available space used for quarters or some other purpose” [16]. The reconstruction of the fort’s layout, and the daily life of the soldiers and civilians who occupied it based on the excavation data, was thorough. The three major streets, two alleyways, eleven buildings with cellars, nine cisterns, and three wells from the urban expansion during the 1800s and 1900s were viewed as “intrusions” on the earlier history. These structures, however, are considered by some to also be important historical features on the landscape that represent the City of Rome’s early growth and urban renaissance [18]. Despite the significant focus on the Colonial period, the park maintains a rich historical record below its surface and is a location whose history continues to be written. The park’s existence continues to be a significant landmark in the cityscape and an important part of the revitalization movement for the downtown area.
With much of the evidence from this critical urban expansion period buried below the ground surface of the National Historic Monument, one of the central focuses of this research was to recover information about the time just prior to the park’s initiation. Remotely sensed data related to this period of history would also allow us to make some comparisons between the city layout in this area of Rome, NY during the time just prior to park construction with the current urban landscape that the park is embedded in. We compared inferred layouts from geophysical data with aerial photographs from contemporary Rome, NY extracted from Google Earth. These complimentary data sets will allow for direct comparisons of structure density.
Another more immediate concern of the park is to avoid disturbing historic features, including graves from a cemetery that dates to the fort’s initial construction. Geophysics has been documented as an important tool for avoiding unmarked burials during park planning and refurbishment at National Monuments in the United States [19,20]. The park service plans on expanding walkways throughout Fort Stanwix to enhance the tourist experience. Data from the current study will inform the park’s management on locations of least impact to the rich archaeological record during walkway expansion. Preservation and conservation efforts are of high importance to the National Park Service. The data from this study may also assist with the development of appropriate and contextualized signage to be placed along the new walkways and with content for guided tours.
2. Materials and Methods
2.1. Overview of GPR
This investigation was undertaken in early 2019 and utilized GPR to image the subsurface and identify possible archaeological resources. GPR sends electromagnetic pulses to a transmitting antenna at the ground surface, which produces a radio wave that travels through the subsurface [21]. Wave speed depends on the ability of a given medium to transfer energy [22]. When an approaching wave encounters a discontinuity in the physical properties of the soil and the wave’s speed changes, some of the wave front’s energy is reflected toward the ground surface [23]. The two-way travel time (usually recorded in nanoseconds) and the amplitude of the reflection are recorded at the surface by a receiving antenna. Each traverse with the GPR provides a two-dimensional profile of the subsurface. When traverses are collected adjacent to each other, then data can be resampled to create pseudo-3D visuals called time-slices [24].
There are several limitations of GPR that can make its use difficult on archaeological projects, specifically historic sites with such complicated histories as that of Fort Stanwix. First, it can be difficult to distinguish between historic targets from different time periods and from historic features compared to modern infrastructure or recent ground disturbance. Second, the performance of the instrument will be affected by the physical properties of the soil and water saturation can compromise depth of penetration and data clarity. Finally, sources of external noise (such as metal fences, electrical wiring, radio towers, and communications systems) can affect data clarity.
2.2. Data Acquisition Procedures
This investigation was carried out using a GPR antenna with a 400 MHz central frequency. The antenna was pushed along the ground surface with a three wheeled survey cart, and locational accuracy was measured by calibrating the survey wheel to the site’s ground conditions. Data were collected in a total of four grids across the designated survey area (Figure 3). Parallel transects were collected every 0.25 m across all grids. All transects were unidirectional from an established baseline for each grid (Figure 3). The survey utilized sample intervals of 50 scans per meter and 512 samples per scan for optimal data clarity and waveform reconstruction. A time window of 80 ns was used to ensure depth penetration in accordance with expected feature depths. The survey area was largely obstacle free, except for several small trees, a bench, and large timber piles (Figure 4).
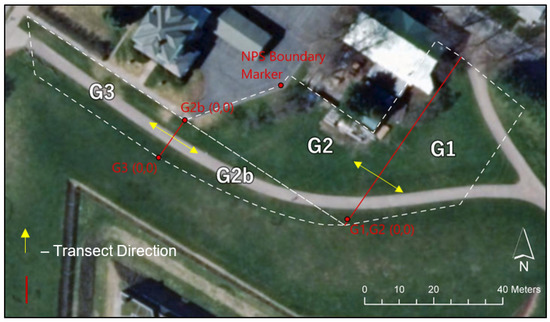
Figure 3.
Map showing layout of survey grids and direction of data acquisition.
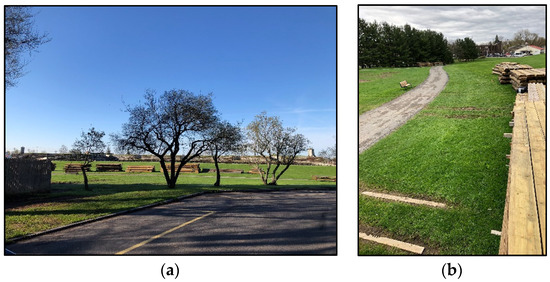
Figure 4.
Examples of (a) trees and (b) timber piles in and around the survey boundaries.
2.3. Data Processing Procedures
Data processing procedures were conducted following concepts and techniques outlined by others [25,26,27] which begin with trace editing, then move through 1D and 2D filtering steps, 2D data corrections, and finally image display and analysis. These sources provide the theoretical baseline for how to minimally process geophysical data to ensure optimal data clarity and resolution, while lessening distortion.
Data collected during the survey was downloaded and processed using GPRSlice v7.MT software. Raw data were imported and converted using the Batch Gain–Wobble technique, as required for creation of initial time-slices. Next, raw data were gridded using the Inverse Distance algorithm with a setting of 2, as is recommended for initial data exploration, and 20 time-slice amplitude maps were created for each survey grid. These raw slices were used as reference data to compare with final images and ensure limited quality deterioration throughout the processing phase.
After the initial amplitude maps were created, processing was conducted on all data to allow for better interpretation of the results. Initial processing utilized the radargram editing tool in order to adjust for time-zero corrections. This was done using the ‘auto 0ns line-by-line + truncate, method 1′ tool, allowing for the automatic scanning of each radargram to eliminate the offset of the ground-surface. The data were then examined utilizing the radargram viewer to look at the data in 2d form to identify any clear reflections that could represent cultural features. These anomalies were noted and formed the basis for interpretation of the processed amplitude maps following filtering. After the time-zero correction was completed, a background filter was applied to the raw data utilizing a length of 99,000. This technique ensured that only erroneous horizontal banding was removed through automatically computing the average scan across the entire radargram and subtracting it from each individual trace within the radargram. Next, the data were regained utilizing the AGC gain option to help set the most viable gain curve for the data as a consistent amplitude range across the set. Finally, the data were migrated utilizing the hyperbola fit tool to estimate wave velocity and correct for signal distortion. Based on the hyperbola fitting model, the soils at Fort Stanwix were moist with a dielectric permittivity of 16 and an approximate velocity of 0.76 m/ns.
After data filtering was completed, the data were again gridded using the Inverse Distance algorithm with a setting of 2. A 3 × 3 Low-Pass smoothing filter was applied and 20 time slice profiles were produced to mirror the ones created for the raw data. Figure 5 shows a comparison of raw and processed data from grid 2.
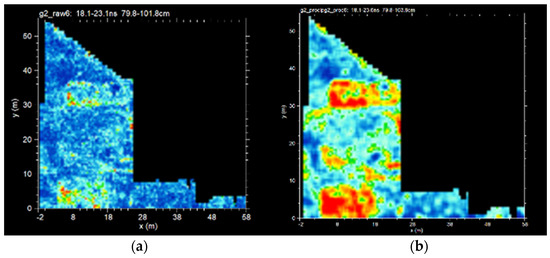
Figure 5.
A comparison of time slices from grid 2 created with (a) raw GPR data and (b) processed GPR data.
3. Results
The ground-penetrating radar survey recorded a variety of high amplitude reflections consistent with the expectations for historical building foundations typical for this type of site. After consideration of the location and results of data collected from the survey area, it was concluded the data from grids 1 and 2 provided responses most consistent with the research goals. This was due to on-site observations that grid 2b and 3 consisted primarily of construction fill from the creation of a sidewalk ramp connecting the street with the lower fort ground level. This observation, as expected, was confirmed when grids 2b and 3 produced no clear, identifiable results. The presence of construction fill and heavily disturbed soil can lead to the recording of erroneous reflections during survey. Additionally, these previous construction episodes could have disturbed or removed the shallow cultural features the survey sought to identify. Therefore, the results focus on anomalies identified in grids 1 and 2.
A1 is in the northwestern portion of grid 1 and represents a rectangular anomaly that is clearly identified starting at around ~15 ns and extends ~30 ns (Figure 6 and Figure 7). At various depths this anomaly has reflections that could represent possible walls or partitions, specifically identifiable at depths around ~15–~25 ns.
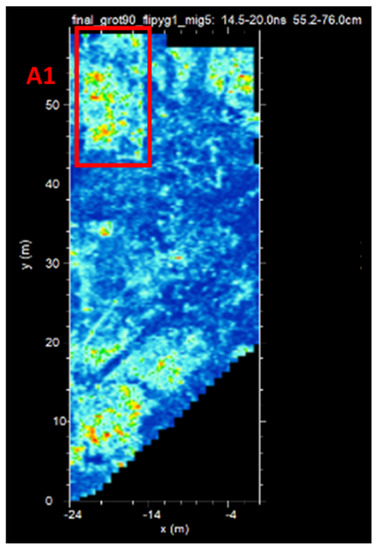
Figure 6.
Time slice taken from 55.2–76.0 cm below ground surface from grid 1.
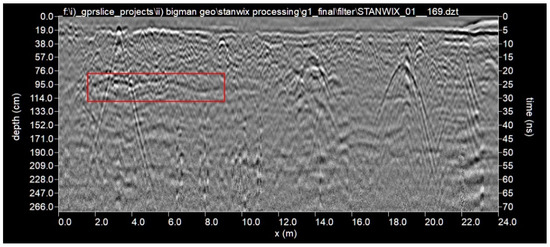
Figure 7.
GPR profile from grid 1 showing horizontal reflection event from A1.
A2 is in the center-western portion of grid 1 and represents a collection of four or more square anomalies. These are clearly identified starting at around ~20 ns and extend to around ~40 ns in depth (Figure 8 and Figure 9). These anomalies could represent distinct features; however, based on proximity and alignment it was decided to include them as a single area.
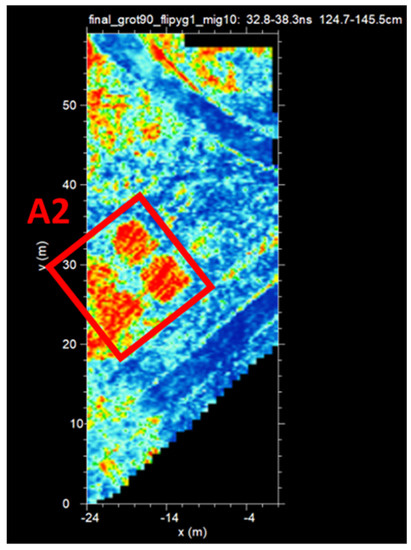
Figure 8.
Time slice taken from 124.7–145.5 cm below ground surface from grid 1.
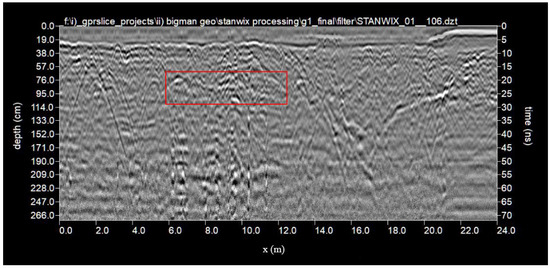
Figure 9.
GPR profile from grid 1 showing horizontal reflection event from A2.
A3 is in the south-western potion of grid 1 and represents a circular to squarish anomaly that is clearly identified starting at around ~23 ns and extends to around ~35 ns. This anomaly is best seen at around ~25–30 ns (Figure 10 and Figure 11). A3 could represent a continuation of A5; however, it was separated due to a difference in geographical alignment and depth of reflection. A3 is best identified lower in the subsurface than A5. These two areas could represent two distinct, possibly overlapping cultural responses from different time periods.
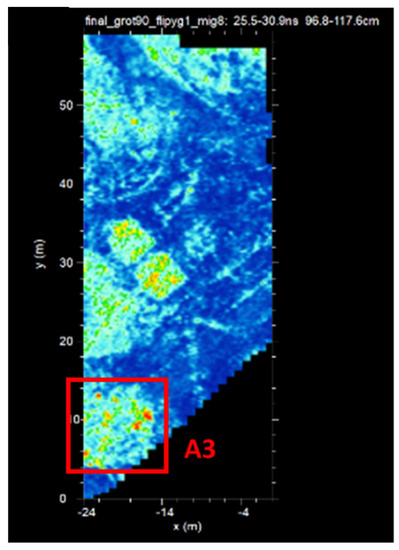
Figure 10.
Time slice taken from 96.8–117.6 cm below ground surface from grid 1.
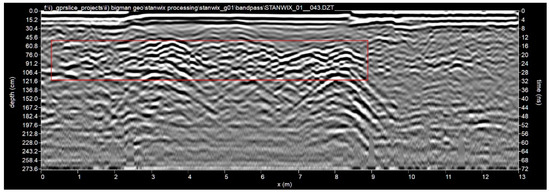
Figure 11.
GPR profile from grid 1 showing horizontal reflection event from A3.
A4 is in the northern portion of grid 2 and represents a long, rectangular anomaly that is clearly identified starting at around ~15 ns and extends to around ~35 ns (Figure 12 and Figure 13). This anomaly has linear reflections that could represent walls. A5 is in the southern portion of grid 2 and represents a rectangular anomaly that is clearly identified starting at around ~15 ns and extends to around ~35 ns (Figure 11 and Figure 12). A5 is similar in nature to A4 and also contains reflections that could be interpreted as linear, wall-like anomalies.
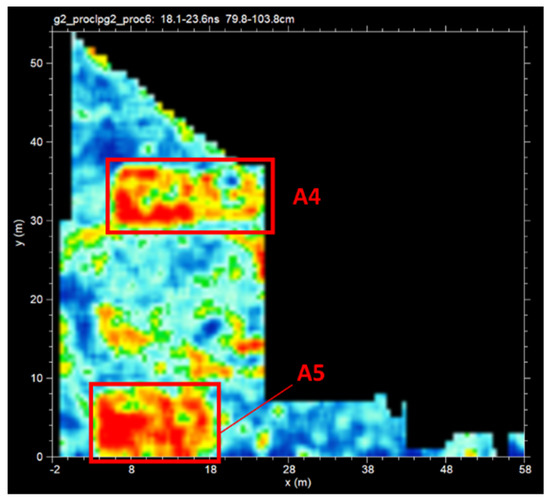
Figure 12.
Time slice taken from 79.8–103.8 cm below ground surface from grid 2.
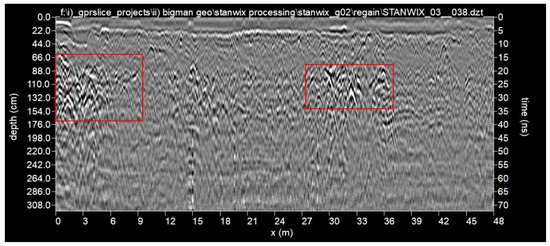
Figure 13.
GPR profile from grid 2 showing horizontal reflection event from A4 and A5.
4. Discussion
The five locations identified as areas of interest (A1–A5) contain reflection events with varied patterning when viewed as time-slices (Figure 14). Both the shapes of these anomaly clusters and their orientations differ. A3 does not have clear boundaries and is difficult to identify a clear shape or orientation. A1, A4, and A5 are all consistently rectangular in shape and are all oriented in the same direction. This southeast–northwest orientation is consistent with the modern street layout in this area of Rome, NY. Many of the houses which are still in use today, outside the park boundaries are also rectangular in shape and are oriented in the same direction as A1, A4, and A5.
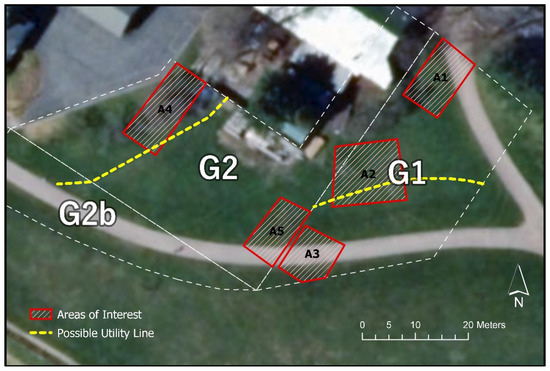
Figure 14.
Map showing the locations of A1–A5 in grids 1 and 2.
The lengths of A1, A4, and A5 are similar to each other and match the lengths from houses still in use in the surrounding area. Table 1 shows the approximate lengths rounded to the nearest meter of the three rectangular GPR responses and lengths from five houses measured at random from Stanwix St. and East Embargo St., two blocks and three blocks north of the park boundary. The range of lengths for our three rectangular anomalies is 14–19 m with an average length of 16. The range of lengths from the five randomly selected and measured houses were 13–21 m with an average of 16.8. Based on the consistency in shape, size, and orientation, we suggest that these three anomalies likely date to the period immediately preceding park construction.

Table 1.
This table shows the approximate lengths of rectangular anomalies and some randomly selected houses within three blocks of the park.
A2 consists of four to five square reflection anomalies (as seen in Figure 7 and Figure 9), which are oriented in a different direction compared with the rectangular responses. These are approximately five to six meters on a side and are oriented in a north-south direction. The difference in orientation and shape might suggest that these responses date to a different time-period in the parks use history compared to A1, A4, and A5.
The GPR responses also varied in depth below ground surface (Table 2). The shallowest anomalies were A1, A4, and A5 which were all less than 1 m deep. A3 was just over 1 m deep. A2 was the deepest response and was over 1.25 m deep. These data reinforce our previous interpretations. It appears that the three rectangular anomalies are reasonably shallow which might suggest that they are the most recent, while A2 is the deepest which might suggest that it is older. Unfortunately, there are no clear stratigraphic breaks in the GPR profiles, which would help support our claims if the responses were in different strata.
Table 2.
Two-way travel times and estimated depths of the five areas of interest.
The GPR recorded additional responses that might be relevant to the site’s complex history, but these reflections are difficult to interpret without context. A large “V” shaped response in profile view was recorded in grid 1 showing a descending then ascending reflection event indicative of soil disturbance (Figure 9). With the complicated history at Fort Stanwix, it is unclear if a response such as this represents the location of the Colonial era ditch surrounding the fort, modern construction, or a massive archaeological excavation in that area of the site. The difficulty in confidently correlating anomalies such as this with specific functions or time periods is near impossible to overcome without the help of some excavation. Other difficult examples include two semicircular reflections in grid 1 seen in time-slice view approximately 1 m deep (Figure 10). These anomalies are deeper than the rectangular responses and could represent large cisterns dating to the urban expansion of downtown. Again, with limited context, any interpretation of these intriguing anomalies is highly speculative and even small excavation could shed considerable light on the function and date of these responses.
With sufficient data clarity and confidence in dating the reflection responses to the period just prior to the park’s initiation, we can compare building densities from that period of landscape use with today. We recorded three rectangular responses indicative of buildings in the approximately 1 acre research area. The sizes of these are consistent with houses that are in use today in this area of Rome, NY. While it is possible that additional structures existed in this area at that time, the clarity and consistency of GPR responses here suggests a high probability that these represent the only buildings, likely houses, that were in use just prior to park development.
Using Google Earth we drew eight random polygons of different shapes, each 1 acre in size, at various locations within a six-block radius of the park’s boundary and counted the total number of houses that could be seen on the aerial image. The density of houses in a 1 acre area ranged from 6 to 15 with a mean of 10.75, a median of 11, and a mode of 11. Table 3 shows the densities of from each randomly drawn polygon.
Table 3.
Densities of houses within 1 acre areas drawn on Google Earth images within six blocks of the park boundary. Counts are organized from least dense to most dense.
This comparison highlights how much housing has been constructed since the US Congress declared the site a National Monument. In the least dramatic example, there was a doubling of house density, and in the most extreme example, the number of houses in a 1 acre area grew by 500%. The total space available to each house in a 1 acre space dropped from 1349 m2 in the early 1970s to between 674.5 m2 and 269.8 m2 today based on our counts. The average reduction in per house area is 78% (376.45/1349). According to the geophysical evidence, houses in the early 1970s were separated from each other by 20–25 m while houses today are sometimes only one to two meters apart.
Increases in residential density have complex influences on the occupants of the urban landscape. In the late 1800s, it was believed that increasing the density of urban residential populations would only have negative effects on occupant well-being, but a study conducted by Rohe [28] on the evolution of thought regarding the impacts of density concluded that the effects are more nuanced and multi-dimensional. While crime rates appear to be positively correlated with increases in residential density, beyond a certain threshold there is a decrease in incidents of homicide and aggravated assault [29]. Increases in density can also impact community satisfaction rates. Crowding can lead to social overload, defined as increasing the number of social interactions beyond the capacity for individuals to process incoming social stimuli [30], which may cause withdrawal, a decrease in satisfaction, and a breakdown in supportive relationships [29,30]. However, the development of support systems [31] and appropriately structuring neighborhoods so residents can have opportunities to visit shared spaces or have views of nature from their homes can mitigate some of the negative effects that crowding has on a person’s psychology [32]. Increased urban density can have deleterious effects on the environment through increased energy usage and waste from construction [33]. However, creating an optimal mixture of residential, commercial, and shared space (such as the Fort Stanwix National Historic Monument) can help mitigate some of the negative effects on the environment and overall wellbeing [32,33,34]. The growing density of residential urban environments is filled with tradeoffs. Increased residential density can have direct impacts on air quality, water quality, and noise [35], but can also lead to increased economic opportunity [36].
We have found that connecting data collected from the archaeological record using noninvasive geophysical investigation with those collected from modern day databases such as Google Earth can help us understand the evolution of urban landscapes and develop questions regarding the impacts of housing expansion and residential density. It also can help place historic landmarks into context with regards to its usefulness as a mitigating feature for social well-being. Archaeology of the recent past affects social memory [37] and is useful for collaborations with other social scientists to answer questions about contemporary populations [38]. We can now build “bridges” with other disciplines using the contemporary archaeological record [38] and compare density changes with rates of change in other variables (such as health, income, crime, environment, and social satisfaction). Archaeology of the recent urban past offers particularly useful insights into the materiality of urban life and a powerful research tool that archaeologists, heritage interpreters, and social scientists should make use of within the context of “urban regeneration schemes” [39].
Shallow geophysical techniques, like GPR, can be utilized in new and novel ways to not only provide archaeologists, historians, and other researchers with a window into the subsurface or data for analyses but also a nondestructive technique to guide conservation, preservation, and ethical research. The combination of high-resolution GPR survey coverage with other primary sources of data (such as aerial photography, previous archaeological excavations, or historic maps) allows researchers to both answer questions surrounding what might be present in the study area and broader questions about community growth, relationships between spaces, and urban development. As seen in the analyses presented above, GPR can be used as a guiding source of data for site interpretations not previously available for consideration. By working with park staff, historians, and archaeological colleagues, the Fort Stanwix investigation has opened a new chapter of site interpretations beyond the military activities highlighted at the site and its museum. These new data open discussions about the growth of Rome and the interplay between urban development, housing expansion, and residential density.
Moreover, the use of a methodology based in nondestructive techniques is essential to the conservation, preservation, and continued application of ethical research at important historical sites like Fort Stanwix. It is imperative that researchers and contractors work closely with park staff, historians, and archaeologists to develop a survey plan which incorporates shallow geophysics, archival research, and small-scale ground-truthing to prepare park management plans that consider the preservation of previously unknown resources and promote community outreach and education. At Fort Stanwix, the GPR survey conducted for this project contributed to the dialogue park staff were already having regarding the expansion of park paths, educational opportunities, and preservation of resources associated with the site’s revolutionary war history. The results of our study highlighted the importance of expanding the monument’s interpretations past the military saga and into the modern urban development surrounding the city of Rome. This type of methodology can provide a cost-effective path for expanding a site’s ability to provide accurate, inclusive, and meaningful interpretations for the surrounding community. It also provides educational opportunities which seek to ground American history in people, not just events.
The GPR survey at Fort Stanwix serves as a strong case study in how to apply an inclusive archaeology of the recent past using nondestructive methods with a focus on public outreach. According to Dalglish [40], the recent past is often more accessible and thus suitable for public engagement activities. He suggests that the “recent past also often holds more immediate and powerful meaning for people. People can feel more connected to the places which feature prominently in the memory of those still alive or in oral histories which connect the present generation to past generations with whom they feel a direct connection” [40]. This idea echoes the importance that temporal proximity of recent history has on contemporary populations [41] since “the generations that experienced the recent past first-hand are still among us” [42]. Developing an outreach program that includes history from 50 years ago will excite and engage the community surrounding the National Historic Monument to learn more about the recent past, since visibility develops interest [43]. Even young generations interested in present day social issues such as racism, economics, and social inequality can draw data from this type of archaeology to inform modern debates [42].
As shallow geophysical techniques, like GPR, become more commonplace in modern research and park management designs, it is important to highlight the importance of their use in a holistic methodology that seeks to promote the preservation, conservation, and continued application of ethical research at these important sites. It is imperative that future research designs seek to incorporate the surrounding communities to provide meaningful, inclusive interpretations at the site. There is a unique opportunity at Fort Stanwix to develop a public outreach program that incorporates the surrounding community. Not all archaeology of the recent past is conducted on protected lands. The benefits of this program is that new research initiatives can be defined by the diversity of stakeholders interested in Rome’s history. This includes the modern urban population. While much archaeology of the recent past has focused on the material intrusion of the past into the present [37], geophysics at protected sites involves reusable and recollectable data sets to frame the “now”. If we want to generate an archaeology that connects the past, present, and future, we should look at current conditions, such as those identified in our geo-database analysis, combined with other social, environmental, and economic data, and work backwards to identify the preconditions that led to the modern makeup of urban environments [44]. Then, with those data, communities can make informed decisions about their futures.
5. Conclusions
This GPR investigation suggests the presence of a high-density of archaeological remains, possibly indicative of architectural debris, located in clusters across the site. The presence of relatively clear, square and rectangular anomalies, located within the top 1.5 m into the subsurface reinforces this conclusion. Observations of shape and orientation, and measurements of size helped us make compelling inferences about when these probable structures were used in the long complex history of Fort Stanwix.
The presence of smaller high amplitude reflections scattered across the survey area, and other patterned but difficult to interpret anomalies, could represent additional architectural remains. Based on the research goals, areas A1–A5 represent the best opportunity for the park to conduct further minimally invasive excavations to date these targets and more fully flesh out the recent history captured at Fort Stanwix National Monument. Additional anomalies should also be targeted to put A1–A5 in proper context. Other researchers [8,9,10,11] have recognized the effectiveness of pairing excavations with large, dense geophysical data sets for both interpreting historical remains and planning site protection programs.
In addition to excavation, a larger GPR survey utilizing a multichannel instrument with RTK GPS integration, paired with other geophysical inspection methods such as magnetic gradiometry and EM conductivity is recommended to completely cover the site and maximize the known inventory of historic features below the surface. These additional noninvasive investigations would further characterize the deposits and refine the resolution of anomalies identified during this survey. ERT could also be used to help gather complimentary information over questionable responses recorded with GPR. For example, using a multiprobe resistivity meter over the suspected ditch feature would help characterize the physical properties of the fill. Higher resistivity values might suggest a ditch filled in with the same material as the host or a relict archaeological excavation unit. However, a lower resistivity over that response may suggest early infilling with debris that has decomposed into organic materials.
Overall, GPR was effective in recording numerous responses from historical features, which will help the Park Service manage this important resource entrusted to them. Combining geophysical data with publicly available aerial photography is a novel approach that helped us characterize the historic record and confidently date some of the geophysical anomalies. The comparison of buried historic features with modern data suggests a rapid housing expansion up to five times as dense now compared with the time just prior to the park’s initiation in the early 1970s. The park itself, as a shared neighborhood space, may have positive impacts on the wellbeing of individuals living in surrounding neighborhoods. The geophysics also will contribute to the preservation and educational planning of the parks resources and promote public outreach with a focus on recent history, which was unavailable until now at the park.
Author Contributions
Conceptualization, D.P.B.; methodology, T.S., D.P.B., D.J.D.; software, T.S., D.J.D.; validation, D.P.B.; formal analysis, T.S., D.P.B.; investigation, T.S., D.J.D.; resources, D.P.B.; data curation, D.J.D.; writing—original draft preparation, T.S., D.P.B., D.J.D.; writing—review and editing, T.S., D.P.B., D.J.D.; visualization, T.S., D.J.D.; supervision, D.P.B.; project administration, D.P.B.; funding acquisition, D.P.B. All authors have read and agreed to the published version of the manuscript.
Funding
This research was funded through a private contract.
Institutional Review Board Statement
Not applicable.
Informed Consent Statement
Not applicable.
Data Availability Statement
The data presented in this study are available on request from the corresponding authors. The data are not publicly available due to the project being conducted in conjunction with the National Park Service.
Acknowledgments
The authors would like to thank the National Park Service, the team at Fort Stanwix National Park, and Alan Greene, Helen Juergens, and Julie Duggins from Paleowest for their help, support, and collaboration.
Conflicts of Interest
The authors declare no conflict of interest.
References
- Kenyon, J.L. Ground-Penetrating Radar and Its Application to a Historical Archaeological Site. Hist. Arch. 1977, 11, 48–55. [Google Scholar] [CrossRef]
- Bevan, B.; Kenyon, J. Ground-penetrating radar for historical archaeology. MASCA Newsl. 1975, 11, 2–7. [Google Scholar]
- Ranalli, D.; Scozzafava, M.; Tallini, M. Ground penetrating radar investigations for the resoration of historic buildings: The case study of the Collemaggio Basilica (L.; Aquila, Italy). J. Cult. Herit. 2004, 5, 91–99. [Google Scholar] [CrossRef]
- Abueladas, A.R.; Akawwi, E. Ground-penetrating radar inspection of subsurface historical structures at the baptism (El-Maghtas) site, Jordan. Geosci. Instrum. Method. Data Syst. 2020, 9, 491–497. [Google Scholar] [CrossRef]
- Leucci, G.; De Georgi, L.; Ditaranto, I.; Miccoli, I.; Scardozzi, G. Ground-Penetrating Radar Prospections in Lecce Cathedral: New Data about the Crypt and the Structures under the Church. Remote Sens. 2021, 13, 1692. [Google Scholar] [CrossRef]
- Monterroso-Checa, A.; Teixido, T.; Gasparini, M.; Pena, J.A.; Rodero, S.; Moreno, J.C.; Morena, J.A. Use of Remote Sensing, Geophysical Techniques and Archaeological Excavations to Define the Roman Amphitheater of Torreparedones (Cordoba, Spain). Remote Sens. 2019, 11, 2937. [Google Scholar] [CrossRef] [Green Version]
- Bigman, D.P. Mapping Social Relationships: Geophysical Survey of a 19th Century American Slave Cemetery. Arch. Anth. Sci. 2014, 6, 17–30. [Google Scholar] [CrossRef]
- Ainsworth, J.T.; Pringle, J.K.; Doyle, P.; Stringfellow, M.; Roberts, D.; Stimpson, I.G.; Wisniewski, K.D.; Goodwin, J. Geophysical investigations of WWII air-raid shelters in the UK. J. Confl. Archaeol. 2018, 13, 167–197. [Google Scholar] [CrossRef]
- Pringle, J.; Lenham, J.; Reynolds, J. GPR investigations to characterize Medieval and Roman foundations under existing shop premises: A case study from Chester, Cheshire, UK. Near Surf. Geophys. 2008, 7, 93–100. [Google Scholar] [CrossRef]
- Thompson, V.D.; DePratter, C.B.; Lulewicz, J.; Lulewicz, I.H.; Thompson, A.D.R.; Cramb, J.; Ritchison, B.T.; Colvin, M.H. The Archaeology and Remote Sensing of Santa Elena’s Four Millennia of Occupation. Remote. Sens. 2018, 10, 248. [Google Scholar] [CrossRef] [Green Version]
- Gustavsen, L.; Stamnes, A.A.; Fretheim, S.E.; Gjerpe, L.E.; Nau, E. The Effectiveness of Large-Scale, High-Resolution Ground-Penetrating Radar Surveys and Trial Trenching for Archaeological Site Evaluations—A Comparative Study from Two Sites in Norway. Remote. Sens. 2020, 12, 1408. [Google Scholar] [CrossRef]
- Tarver, G.; Bigman, D.P. Preservation of McVicker Family Cemetery, Jonesboro, Georgia. Early Ga. 2013, 41, 211–241. [Google Scholar]
- Vanvalkenburgh, P.; Walker, C.P.; Sturm, J.O. Gradiometer and Ground-penetrating Radar Survey of TwoReducciónSettlements in the Zaña Valley, Peru. Archaeol. Prospect. 2014, 22, 117–129. [Google Scholar] [CrossRef]
- Balkaya, Ç.; KalyoncuoĞlu, Ü.Y.; Özhanlı, M.; Merter, G.; Çakmak, O.; Güven, I.T. Ground-penetrating radar and electrical resistivity tomography studies in the biblical Pisidian Antioch city, southwest Anatolia. Archaeol. Prospect. 2018, 25, 285–300. [Google Scholar] [CrossRef]
- Stein, E.R.; Kotlar, K.A.; Kick, J.W. Soil Survey of Oneida County, New York; United States Department of Agriculture, Natural Resources Conservation Service: Washington, DC, USA, 2008.
- Hanson, L.; Hsu, D.P. Casemates and Cannonballs: Archaeological Investigations at Fort Stanwix, Rome, New York; National Park Service: Washington, DC, USA, 1975.
- Campbell, J.D. Archaeological Survey, Site of Fort Stanwix, Rome, N.Y. 24 May–13 August; Manuscript on File at Fort Stanwix National Monument: Rome, NY, USA, 1965.
- Zenzen, J.M. Reconstruction the Past, Partnering for the Future: An Administrative History of Fort Stanwix National Monument; National Park Service: Washington, DC, USA, 2004.
- Bigman, D.P. The Use of Electromagnetic Induction in Locating Graves and Mapping Cemeteries: An Example from Native North America. Archaeol. Prospect. 2012, 19, 31–39. [Google Scholar] [CrossRef]
- Bigman, D.P. An Early Mississippian Settlement History of Ocmulgee. University of Georgia, Athens, Greece, Unpublished Dissertation. 2012. [Google Scholar]
- Koppenjan, S. Ground Penetrating Radar Systems and Design. In Ground Penetrating Radar: Theory and Applications; Jol, H., Ed.; Elsevier: Amsterdam, The Netherlands, 2009; pp. 73–97. [Google Scholar]
- Annan, P. Electromagnetic Principles of Ground Penetrating Radar. In Ground Penetrating Radar: Theory and Applications; Jol, H., Ed.; Elsevier: Amsterdam, The Netherlands, 2009; pp. 3–40. [Google Scholar]
- Bigman, D. GPR Basics: A Handbook for Ground Penetrating Radar Users; Bigman Geophysical: Suwanee, GA, USA, 2018. [Google Scholar]
- Goodman, D.; Nishimura, Y.; Rogers, J.D. GPR time slices in archaeological prospection. Archaeol. Prospect. 1995, 2, 85–89. [Google Scholar]
- Kvamme, K.L. Data Processing and Presentation. In Remote Sensing in Archaeology: An Explicitly North American Perspective; Johnson, J.K., Ed.; University of Alabama Press: Tuscaloosa, AL, USA, 2006; pp. 235–250. [Google Scholar]
- Conyers, L.B. Interpreting Ground-Penetrating Radar for Archaeology; Alta Mira Press: Lanham, MD, USA, 2012. [Google Scholar]
- Cassidy, N.J. Ground Penetrating Radar Data Processing, Modelling and Analysis. In Ground Penetrating Radar: Theory and Applications; Jol, H., Ed.; Elsevier: Amsterdam, The Netherlands, 2009; pp. 141–176. [Google Scholar]
- Rohe, W.M. Models of Residential Density and Their Impact on Planning: A Historical and Contemporary Analysis. Urb. Past Present. 1982, 7, 15–27. [Google Scholar]
- Browning, C.R.; Byron, R.A.; Calder, C.A.; Krivo, L.J.; Kwan, M.P.; Lee, J.Y.; Peterson, R.D. Commercial Density, Residential Concentration, and Crime: Land Use Patterns and Violence in Neighborhood Context. J. Res. Crime. Del. 2010, 47, 329–357. [Google Scholar] [CrossRef]
- McCarthy, D.; Saegert, S. Residential density, social overload, and social withdrawal. Hum. Ecol. 1978, 6, 253–272. [Google Scholar] [CrossRef]
- Evans, G.W.; Palsane, M.N.; Lepore, S.J.; Martin, J. Residential density and psychological health: The mediating effects of social support. J. Pers. Soc. Psychol. 1989, 57, 994–999. [Google Scholar] [CrossRef] [PubMed]
- Kearney, A.R. Residential Development Patterns and Neighborhood Satisfaction: Impacts of Density and Nearby Nature. Environ. Behav. 2006, 38, 112–139. [Google Scholar] [CrossRef]
- Norman, J.; MacLean, H.L.; Kennedy, C.A. Comparing High and Low Residential Density: Life-Cycle Analysis of Energy Use and Greenhouse Gas Emissions. J. Urban Plan. Dev. 2006, 132, 10–21. [Google Scholar] [CrossRef]
- Hachem-Vermette, C.; Grewal, K.S. Investigation of the impact of residential mixture on energy and environmental performance of mixed use neighborhoods. Appl. Energy 2019, 241, 362–379. [Google Scholar] [CrossRef]
- Haigh, F.; Chok, H.N.; Harris, P. Housing Density and Health: A Review of the Literature and Health Impact Assessments; Unpublished report; Centre for Health Equity Training, Research and Evaluation (CHETRE), University of New South Wales: Sydney, Australia, 2011. [Google Scholar]
- Hummel, D. The effects of population and housing density in urban areas on income in the United States. Local Econ. J. Loc. Econ. Policy Unit. 2020, 35, 27–47. [Google Scholar] [CrossRef]
- Van Dyke, R.M. Archaeology and Social Memory. Ann. Rev. Anth. 2019, 48, 207–225. [Google Scholar] [CrossRef]
- Hodder, I. Epilogue. In Archaeologies of the Contemporary Past; Buchli, V., Lucas, G., Eds.; Routledge: London, UK, 2001; pp. 189–191. [Google Scholar]
- Symonds, J. Historical Archaeology and the Recent Urban Past. Int. J. Herit. Stud. 2004, 10, 33–48. [Google Scholar] [CrossRef]
- Dalglish, C. (Ed.) Archaeologists, Power and the Recent Past. In Archaeology, the Public and the Recent Past; The Boydell Press: Woodbridge, UK, 2013; pp. 1–12. [Google Scholar]
- Buchli, V.; Lucas, G. (Eds.) The absent present: Archaeologies of the contemporary past. In Archaeologies of the Contemporary Past; Routledge: London, UK, 2001; pp. 3–18. [Google Scholar]
- Wilkie, L. Black sharecroppers and white frat boys: Living communities and the appropriation of their archaeological past. In Archaeologies of the Contemporary Past; Buchli, V., Lucas, G., Eds.; Routledge: London, UK, 2001; pp. 108–118. [Google Scholar]
- Burstrom, M. Looking into the Recent Past: Extending and Exploring the Field of Archaeology. Curr. Swed. Archaeol. 2009, 15, 21–36. [Google Scholar]
- Wurst, L.; Mrozowski, S.A. Toward an Archaeology of the Future. Int. J. Hist. Archaeol. 2014, 18, 210–223. [Google Scholar] [CrossRef]
Publisher’s Note: MDPI stays neutral with regard to jurisdictional claims in published maps and institutional affiliations. |
© 2021 by the authors. Licensee MDPI, Basel, Switzerland. This article is an open access article distributed under the terms and conditions of the Creative Commons Attribution (CC BY) license (https://creativecommons.org/licenses/by/4.0/).