Article

The Modified Normalized Urban Area Composite Index: A Satelliate-Derived High-Resolution Index for Extracting Urban Areas

1
School of Ecological Environment, Institute of Disaster Prevention, Sanhe 065201, China
2
School of Resources and Environmental Science, Wuhan University, Wuhan 430079, China
3
International Institute of Spatial Lifecourse Epidemiology (ISLE), Hong Kong, China
*
Author to whom correspondence should be addressed.
Remote Sens. 2021, 13(12), 2350; https://doi.org/10.3390/rs13122350
Submission received: 20 May 2021 / Revised: 10 June 2021 / Accepted: 12 June 2021 / Published: 16 June 2021
(This article belongs to the Special Issue Nighttime Lights as a Proxy for Economic Performance of Regions)

Abstract

:
The accurate and efficient extraction of urban areas is of great significance for better understanding of urban sprawl, built environment, economic activities, and population distribution. Night-Time Light (NTL) data have been widely used to extract urban areas. However, most of the existing NTL indexes are incapable of identifying non-luminous built-up areas. The high-resolution NTL imagery derived from the Luojia 1-01 satellite, with low saturation and the blooming effect, can be used to map urban areas at a finer scale. A new urban spectral index, named the Modified Normalized Urban Areas Composite Index (MNUACI), improved upon the existing Normalized Urban Areas Composite Index (NUACI), was proposed in this study, which integrated the Human Settlement Index (HSI) generated from Luojia 1-01 NTL data, the Normalized Difference Vegetation Index (NDVI) from Landsat 8 imagery, and the Modified Normalized Difference Water Index (MNDWI). Our results indicated that MNUACI improved the spatial variability and differentiation of urban components by eliminating the NTL blooming effect and increasing the variation of the nighttime luminosity. Compared to urban area classification from Landsat 8 data, the MNUACI yielded better accuracy than NTL, NUACI, HSI, and the EVI-Adjusted NTL Index (EANTLI) alone. Furthermore, the quadratic polynomial regression analysis showed the model based on MNUACI had the best R2 and Root-Mean Square Error (RMSE) compared with NTL, NUACI, HSI, and EANTLI in terms of estimation of impervious surface area. It is concluded that MNUACI could improve the identification of urban areas and non-luminous built-up areas with better accuracy.

1. Introduction

Urban areas are the supporting systems of urban population, built-ups, transportation, and commercial corporations, as well as where urbanization takes place [1]. Urbanization and urban sprawl have important influence on the urban ecological environment, climate, public health, and socioeconomic development through the transformation of land use/cover types [2,3,4,5,6]. Urban expansion brings a series of urban problems, such as underground water pollution, traffic congestion, carbon emission increment, urban heat island effect, etc. Furthermore, urban nighttime light (NTL) causes disturbance to the human circadian rhythm and sleep disorders [7]. These urbanization issues increase the burden on the urban ecological system and impact the sustainable development of cities, especially in developing countries like China. Due to China’s opening and economic development strategies, the urbanization rate of China’s permanent population has increased from 18.96% in 1979 to 60.60% in 2019 [8], as shown in Figure 1. This approximately exponential urban population growth has greatly promoted the accelerated expansion of China’s cities. Faced with problems caused by rapid expansion of China’s cities, it is essential to design relevant analytical methods to solve these regular mapping problems of urban sprawl.
The NTL data have been most widely used to extract urban areas at regional and global scales, such as the Defense Meteorological Satellite Program/Operational Linescan System (DMSP/OLS) and the Suomi National Polar-orbiting Partnership satellite with Visible Infrared Imaging Radiometer Suite (NPP-VIIRS) data [9,10,11,12]. The main approaches for identification of urban areas through NTL data include edge-detection, supervised classification, and threshold-based segmentation. Assuming the existence of abrupt changes of NTL in urban and suburban transition zones, Tan used a light intensity gradient to delineate the boundaries of urban areas [13]. Xue et al. adopted an edge detection method to acquire urban boundaries based on the Vegetation Adjusted NTL Urban Index (VANUI) [14]. In supervised classification methods, many studies have proved that the support vector machine (SVM) method could provide high-precision classification results. Cao et al. developed an SVM-based region-growing algorithm to distinguish urban areas from non-urban background [15]. Jing et al. proved that results obtained by k-nearest-neighbors, SVM, and the random forests classification algorithm could achieve a better agreement for the purpose of urban area detection [16]. In addition, simple thresholding methods were also usually adopted to extract urban area extent [17,18].
The integration of multi-source remote sensing data and NTL data can mitigate the blooming effect (i.e., adjacent pixels of pervious surface are usually counted as impervious surface due to similar NTL values) of NTL and improve its performance. Integrating urban NTL with vegetation index and land surface temperature (LST) provides promising approaches to differentiate urban areas from non-urban areas. For example, Lu et al. developed a Human Settlement Index (HSI) with DMSP-OLS and the normalized difference vegetation index (NDVI) data to map urban settlements [19]. Zhang et al. proposed a simple and effective VANUI that could reduce the effects of NTL saturation and overcome the overcorrection issue of HSI [20]. Zhuo et al. proposed an Enhanced Vegetation Index (EVI) Adjusted NTL Index (EANTLI) to lessen the saturation problem of NTL data [21]. Liu et al. demonstrated that an LST and EVI Regulated NTL City Index (LERNCI) was more effective in delineating the urban spatial structures than VANUI [22]. However, when land cover types include water body and bare land, it is not enough to rely solely on vegetation index or land surface temperature to separate urban area from non-urban area. Therefore, Liu et al. established a Normalized Urban Areas Composite Index (NUACI) by combining the Normalized Difference Water Index (NDWI), NTL, and the EVI to estimate the urban impervious surface [23]. NUACI could degrade oversaturation using water body and vegetation indexes, but it might still ignore certain urban areas in low-luminous areas.
A Modified NDWI (MNDWI) was found to be more suitable for water feature recognition than the NDWI, as it can better suppress non-water land noise and better enhance water features [24]. Thus, this study aimed to develop a Modified NUACI (MNUACI) on the basis of the MNDWI, NDVI, and NTL, to further improve the identification of urban areas. Moreover, the MNUACI has a higher spatial resolution than the previous DMSP/OLS- and NPP-VIIRS-based indexes by using NTL data from the Luojia 1-01 NTL satellite, designed and developed by Wuhan University in China, which has started providing nighttime imagery with a finer resolution of 130 m since 2018. The MNUACI would be useful for a wide array of urban studies, such as urban population health [25], urban spatial structure [26], and energy carbon emissions [27], where such an index has been urgently demanded.

2. Study Sites and Data Sources

2.1. Study Sites

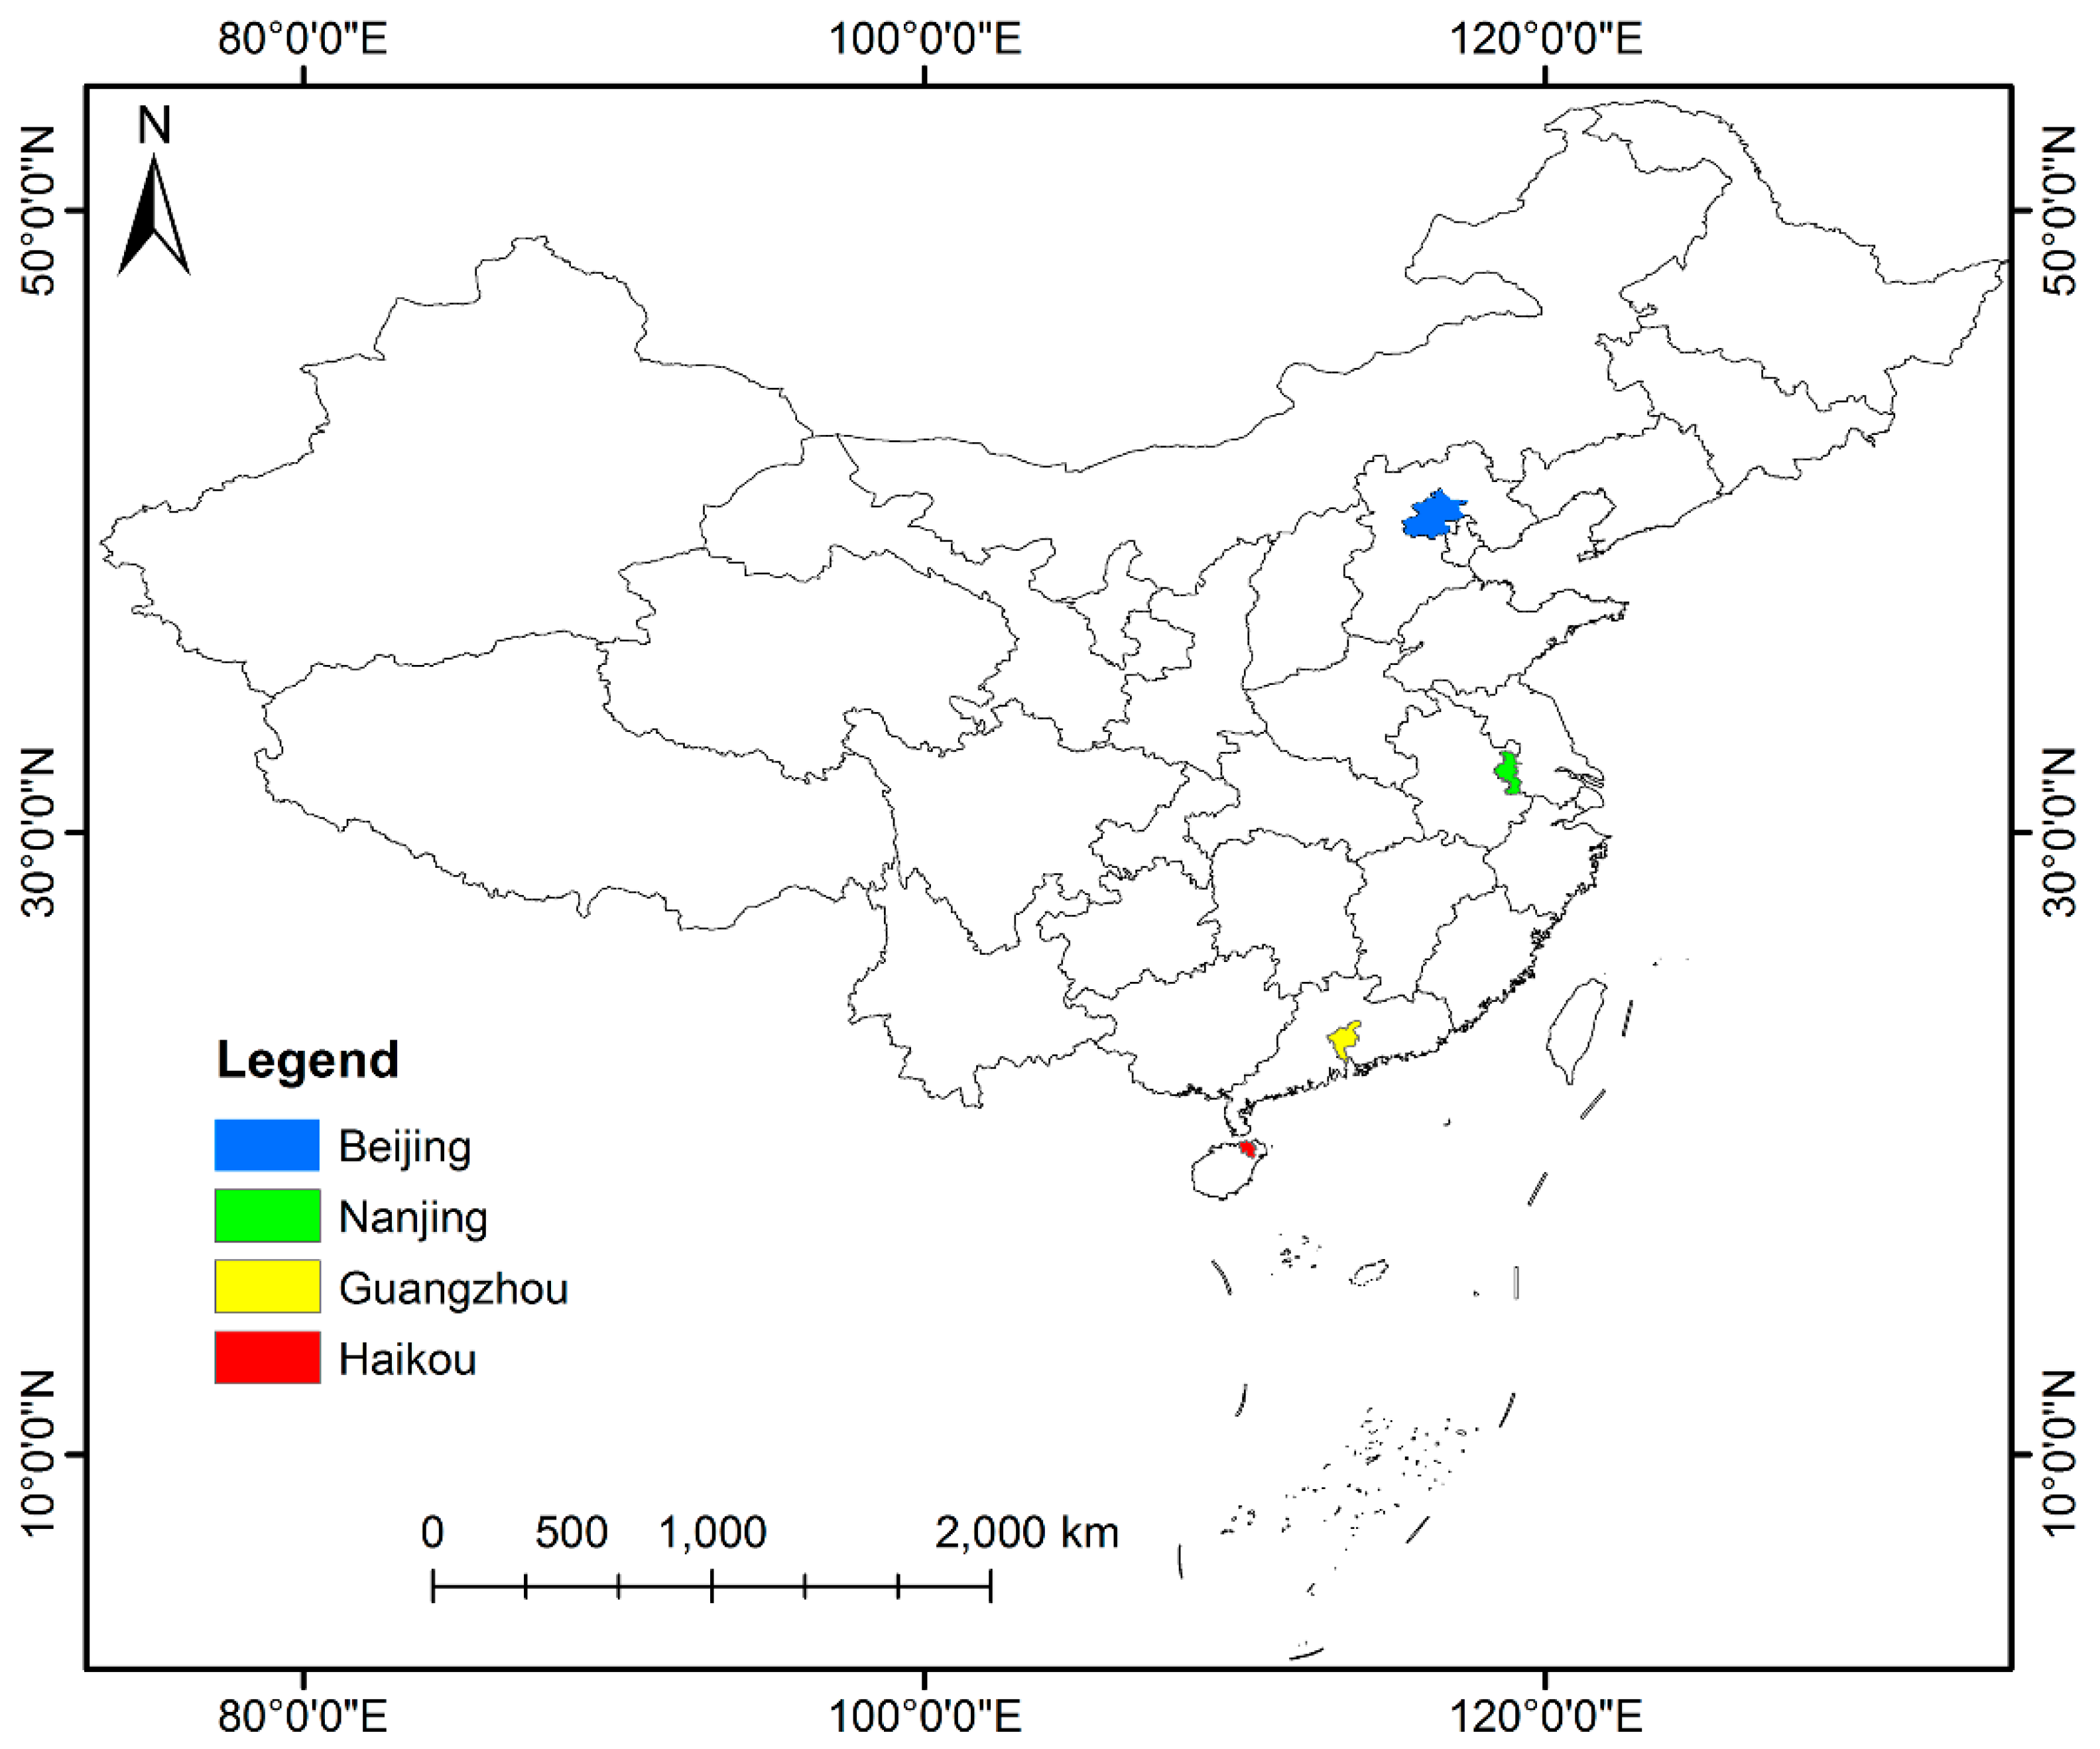
As shown in Figure 2, four capital cities in China from north to south, Beijing, Nanjing, Guangzhou and Haikou, were chosen as study sites. Beijing, the political, science and technology innovation and cultural center of China, is surrounded by mountains in the west, north and northeast, and the North China Plain in the southeast [28]. It has sixteen municipal districts with a total area of 16,410 km2, a resident population of 21.54 million and a GDP of 3032 billion CNY in 2018 [29]. With six downtown areas as the center and Tongzhou District as the sub-center, Beijing is expanding outward along east-west and north-south axes, and the urban secondary industry and a large labor force is beginning to migrate to the surrounding suburbs. Nanjing, a regional transportation hub, is in the lower reaches of the Yangtze River and is the only megacity in the Yangtze River Delta and East China. It includes twelve administrative districts, with a total area of 6587 km2, a resident population of 8.44 million and a GDP of 1282 billion CNY in 2018 [30]. New urban areas and towns were built along two banks of the Yangtze River, and the central city expanded northward and southward to the suburbs, where the chemical industry was centrally located. Guangzhou, located at the northern edge of the pearl river delta, is an important transportation and logistics hub in South China. It consists of eleven administration districts, with a resident population of 14.9 million and a GDP of 2286 billion CNY in 2018, covering a total area of 7434 km2 [31,32]. With the metropolitan area as the city center, Guangzhou built two new districts in the south and east regions, and three sub-centers in the north and east regions. The international tourist city of Haikou borders the Qiongzhou Strait in the north and serves as the core city of the China Free Trade Zone. Haikou covers a land area of 2290 km2 and a sea area of 861 km2, with a population of 2.3 million and a GDP of 151.1 billion CNY in 2018 [33]. Haikou has built the east and west coast tourism belt and the north-south tourism axis of Nandu River urban water system.
The traditional economic growth points are mostly located in the central areas of China cities. Based on the strong economic foundation, the latest urban planning and layouts of the above four cities guide and drive the flow of the large labor force to the new industrial agglomeration areas in suburbs, thus promoting the continuous urban expansion of these cities. Besides, these four cities have experienced tremendous socioeconomic development over the past 40 years, representing the natural and socioeconomic development levels of different cities in China. Therefore, they are suitable to study the dynamics of urbanization and its impact on urban ecosystems according to the extent of urban areas extraction.

2.2. Data Sources

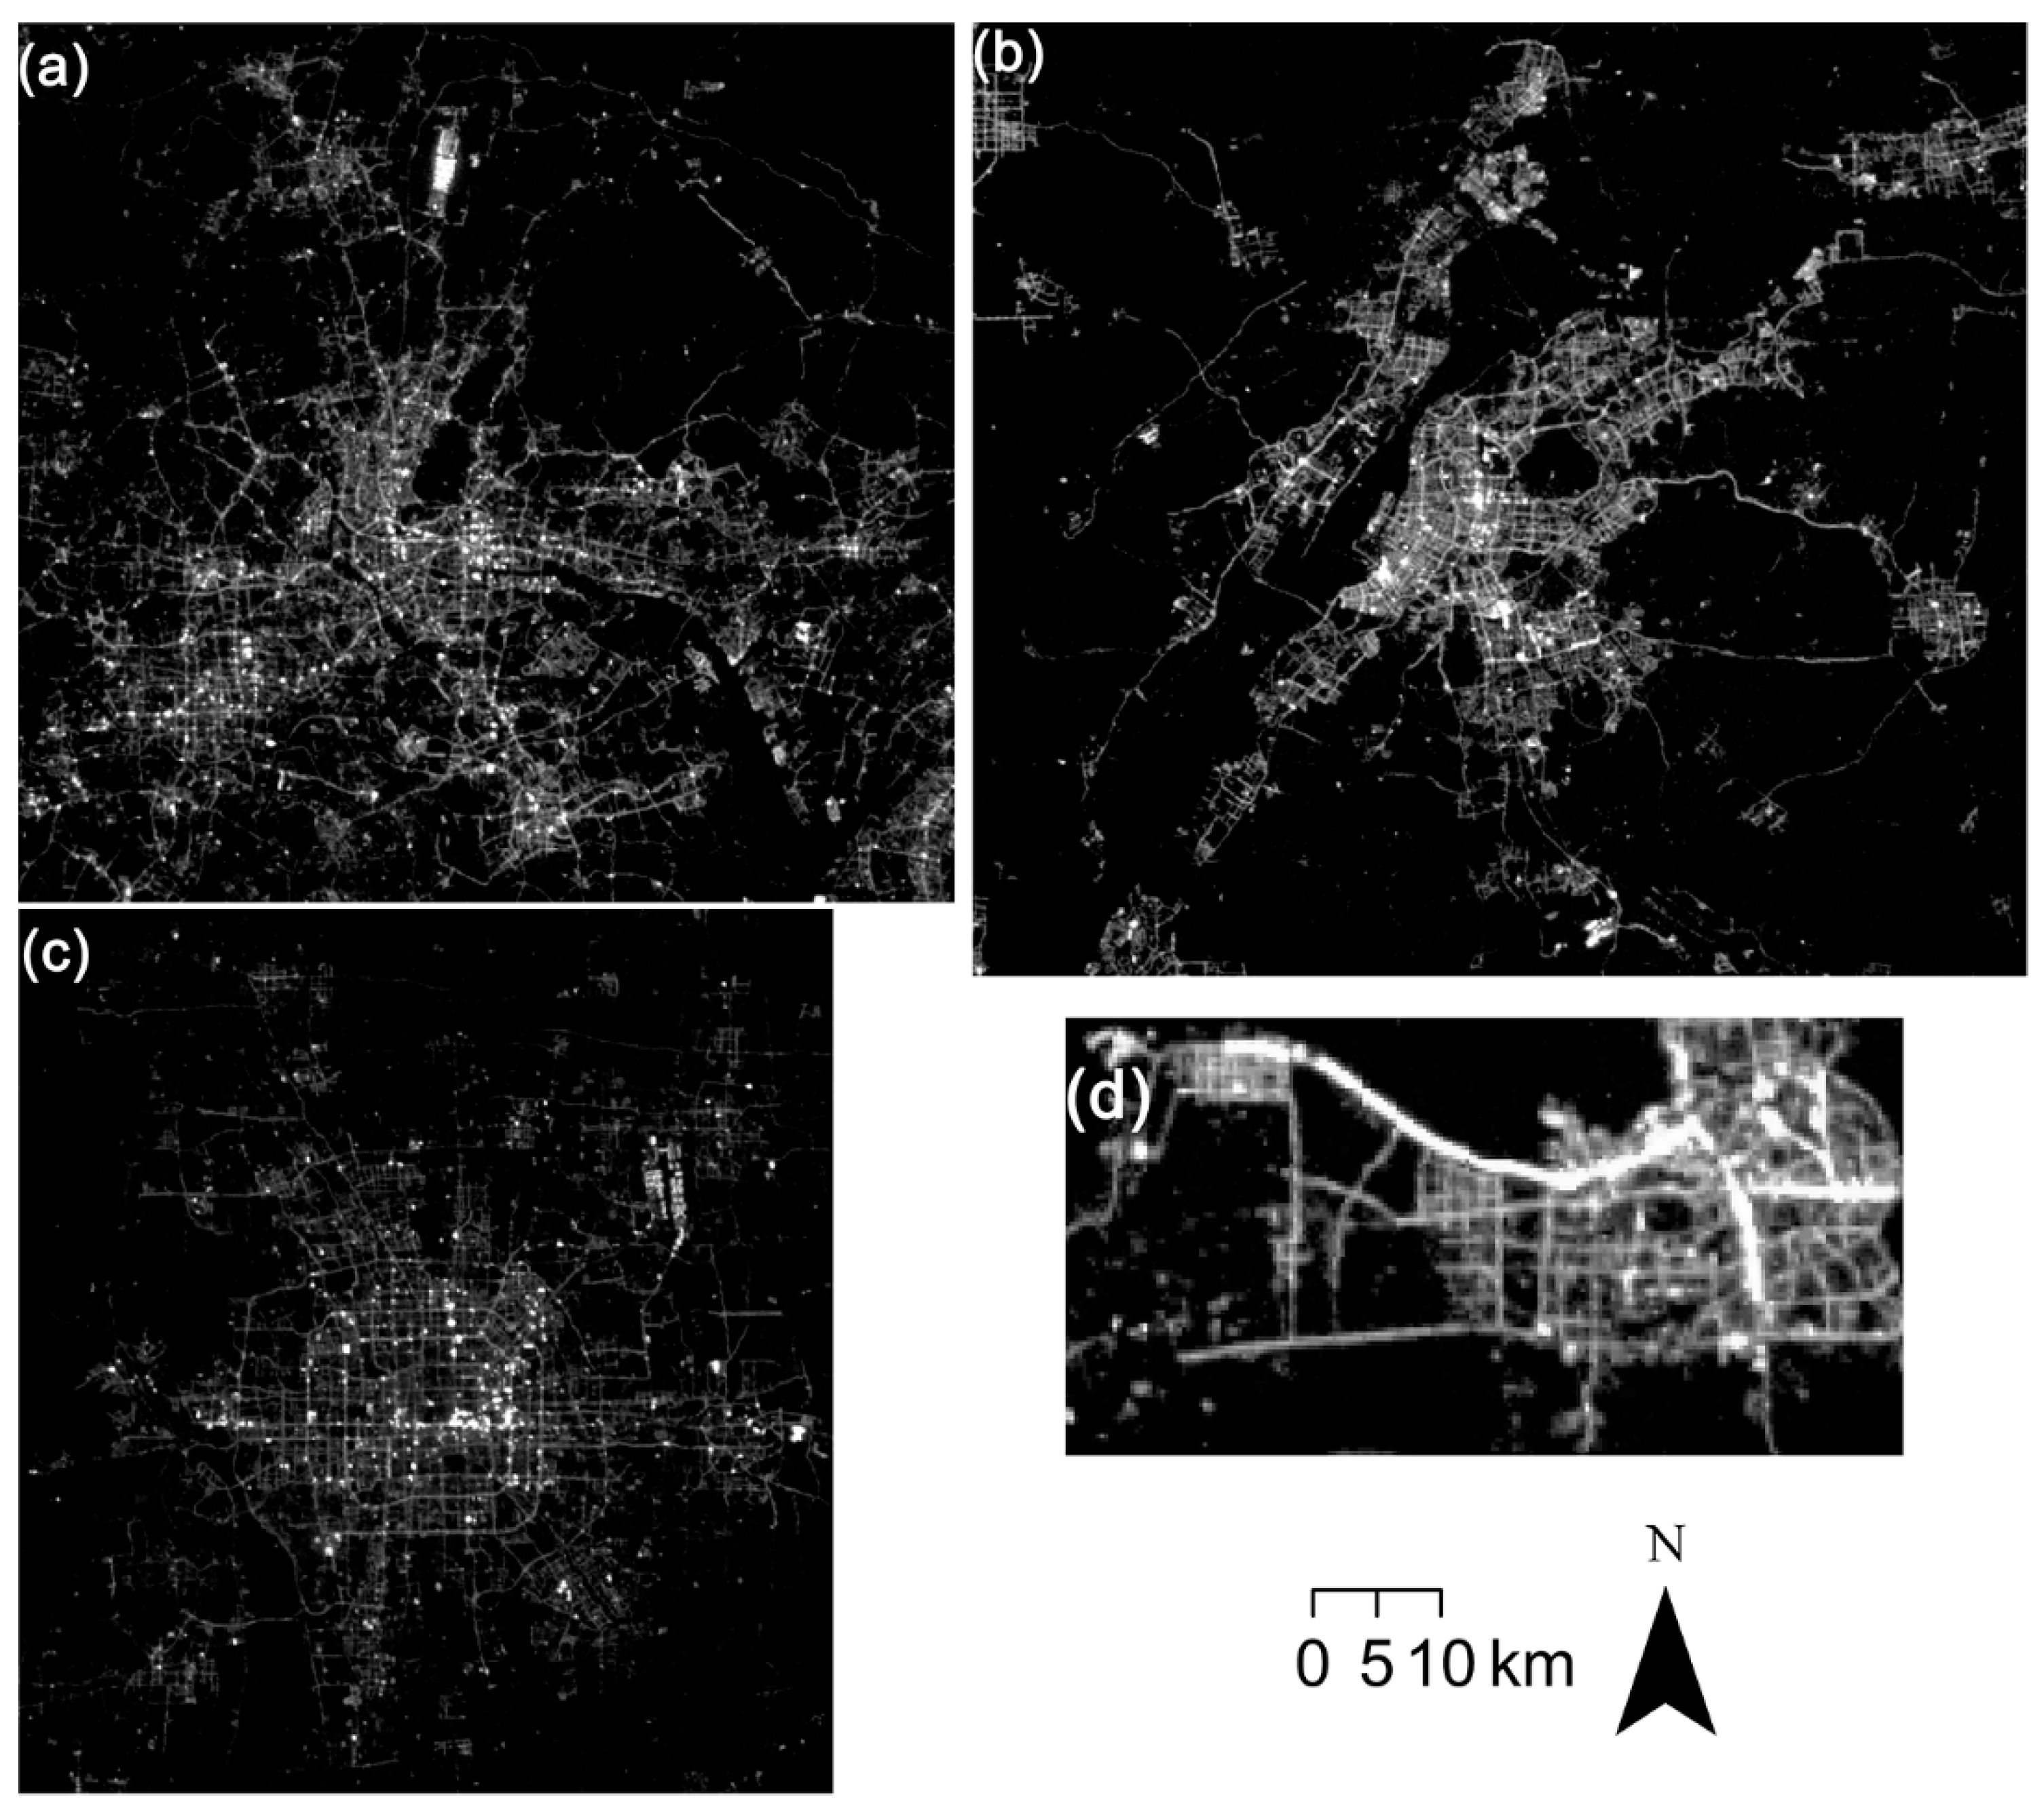
The cloud-free Luojia 1-01 NTL images in Beijing, Nanjing, Guangzhou and Haikou, which are dated 6 September 2018, 15 July 2018, 4 September 2018 and 5 September 2018, respectively, as illustrated in Figure 3 and Table 1, were downloaded for free from the Hubei Data and Application Center of High-Resolution Earth Observation System website (http://59.175.109.173:8888, accessed on 1 June 2021). The Luojia 1-01 NTL satellite, designed and developed by Wuhan University in China, has started to provide nighttime imagery with a finer resolution of 130 m since 2018. This satellite sensor records with 14-bits radiometric resolution and improves on-board calibration functions, which demonstrates finer spatial detail and urban spatial structure than DMSP/OLS and NPP-VIIRS data [34,35]. Landsat 8 Operational Land Imager (OLI) images with minimum cloud cover for Beijing, Nanjing, Guangzhou and Haikou on 23 October 2017, 6 June 2018, 23 October 2017, and 17 May 2018 were obtained from the United States Geological Survey (USGS) website (https://glovis.usgs.gov, accessed on 1 May 2021), as illustrated in Table 1. Except for the coastal/aerosol band and the cirrus band, OLI inherits the seven bands of the Thematic Mapper (TM) and Enhanced Thematic Mapper Plus (ETM+) sensors, improving image measurement abilities and offering compatibility with the historical Landsat images. The Landsat 8 multi-spectral imagery ranging from Band 2 to Band 7 (Blue, Green, Red, NIR, SWIR1, SWIR2, respectively) were used for relevant vegetation index calculation, water body index calculation and image classification.

3. Methodology

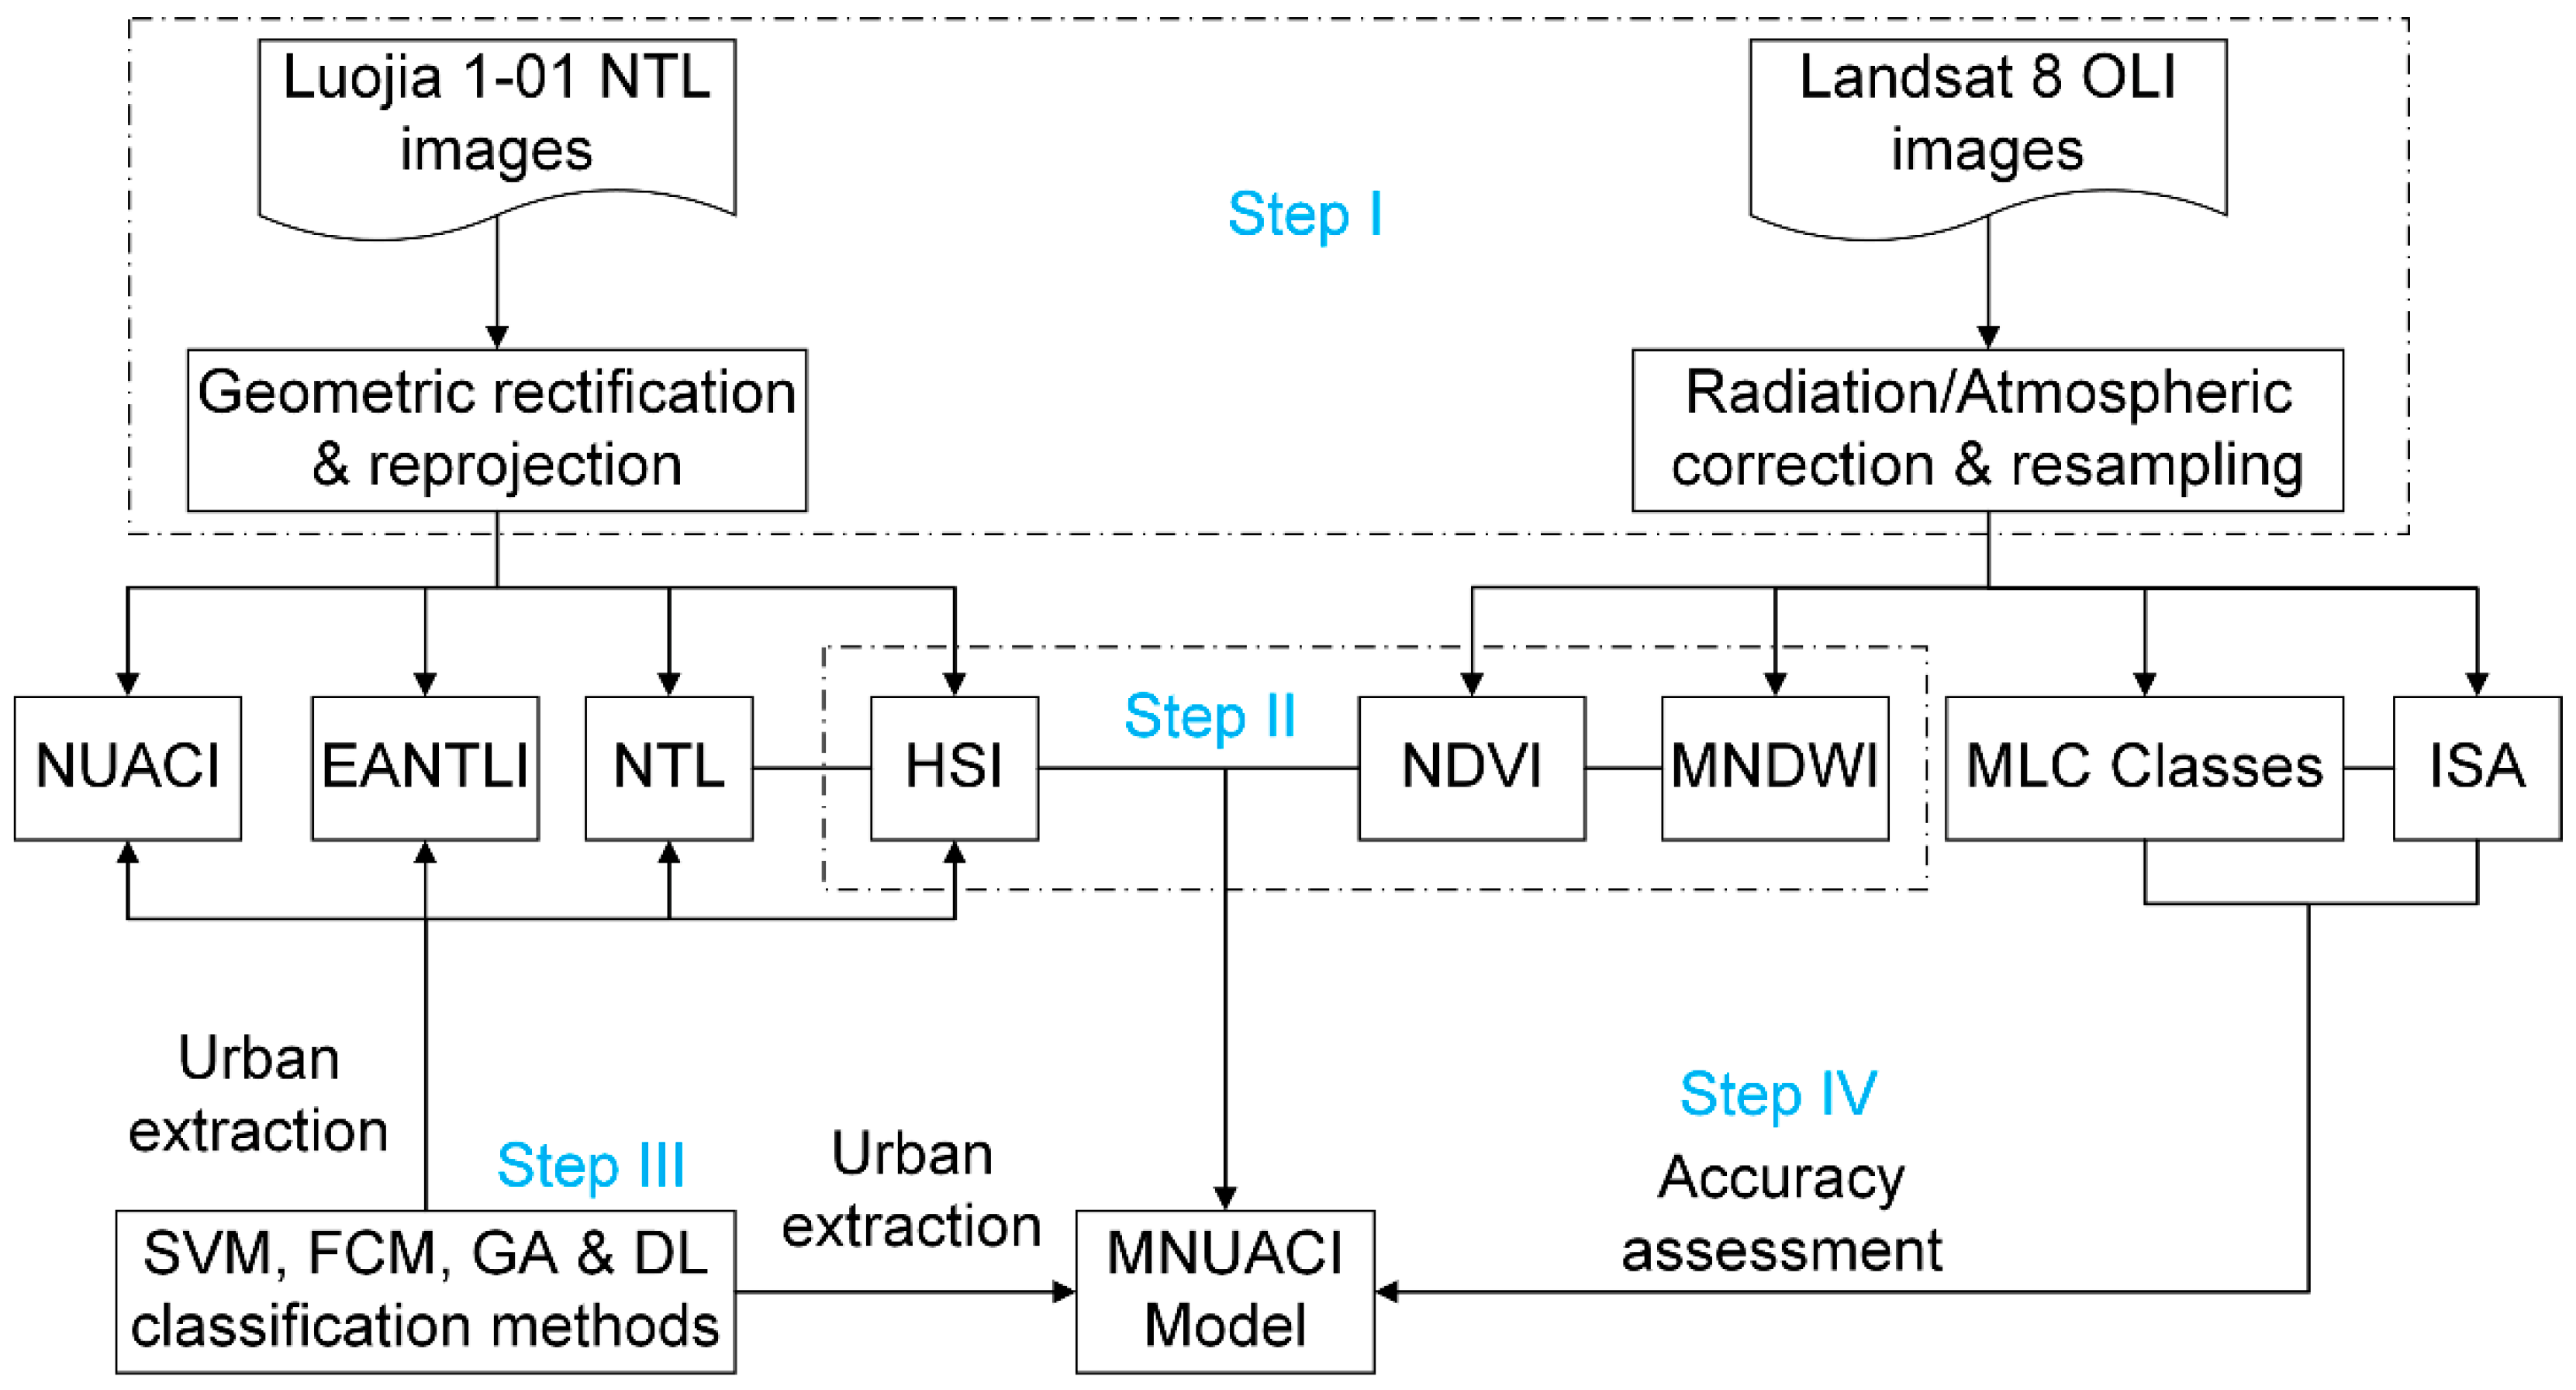
Figure 4 demonstrates the methodological framework, which involves four main steps. First, basic preprocessing such as geometric rectification, reprojection, and atmospheric correction was executed for the Luojia 1-10 NTL and Landsat 8 OLI raw data. Next, the MNUACI model was developed by integrating NTL, HSI, NDVI and MNDWI data. Third, four classic classification methods were applied to NTL, HSI, NDVI and MNDWI data for mapping urban areas of study sites. Lastly, the reference urban mapping results based on Landsat 8 data were used to evaluate the accuracy of the MNUACI model.

3.1. Data Preprocessing

The positioning accuracy of Luojia 1-01 NTL imagery was reported as approximately 800 m by executing the on-board geometric calibration method [36], but its results are far from meeting the actual positioning requirements. For each Luojia 1-01 image, at least forty ground control points (GCPs) were selected at road intersections on Landsat 8 images, and a geometric correction was carried out on Luojia 1-01 images through an affine transformation. The geometric accuracy of the final correction error of each image was controlled within half of a Luojia 1-01 image pixel, namely 65 m. Landsat 8 OLI records not only the reflected and emitted radiation from the earth’s surface, but also the radiation scattered or emitted by the atmospheric layer. To quantize the real reflectance from the earth’s surface, the Radiometric Calibration Tool and the Fast Line-of-sight Atmospheric Analysis of Spectral Hypercubes (FLAASH) module in the ENVI software were used to convert the DNs of raw images into surface reflectance values. The purpose of atmospheric correction is to eliminate the influence of atmosphere and solar illumination and obtain the correct surface reflectance parameters of the earth’s surface. After atmospheric correction, satellite images can improve the ability of data analysis. To integrate them better with images from Landsat 8 OLI, Landsat 8 images were resampled to the same 130 m-resolution as the Luojia 1-01 nighttime images after the images underwent atmospheric correction.

3.2. Modified Normalized Urban Area Composite Index (MNUACI)

Water and vegetation index can effectively differentiate water body and vegetation types from urban areas [37]. Based on the characteristics of the two indexes, the NUACI, established by integrating water index, vegetation index and NTL data, can be used to recognize urban areas, as shown in the following equation:
N U A C I = { 0 ,     d > r ,     d = ( N D W I a ¯ N D W I ) 2 + ( E V I b ¯ E V I ) 2 ( 1 d / r ) N T L n o r m ,     d r
where a ¯ N D W I and b ¯ E V I indicate the average NDWI and EVI from the urban impervious surface, respectively; d and r denote the distance and maximum radius of the circle from urban core, respectively; and NTLnorm represents the normalized NTL which is expressed with the following equation:
N T L n o r m = N T L N T L min N T L max N T L min
where NTLmin and NTLmax are the minimum and maximum values of NTL DN values, respectively.
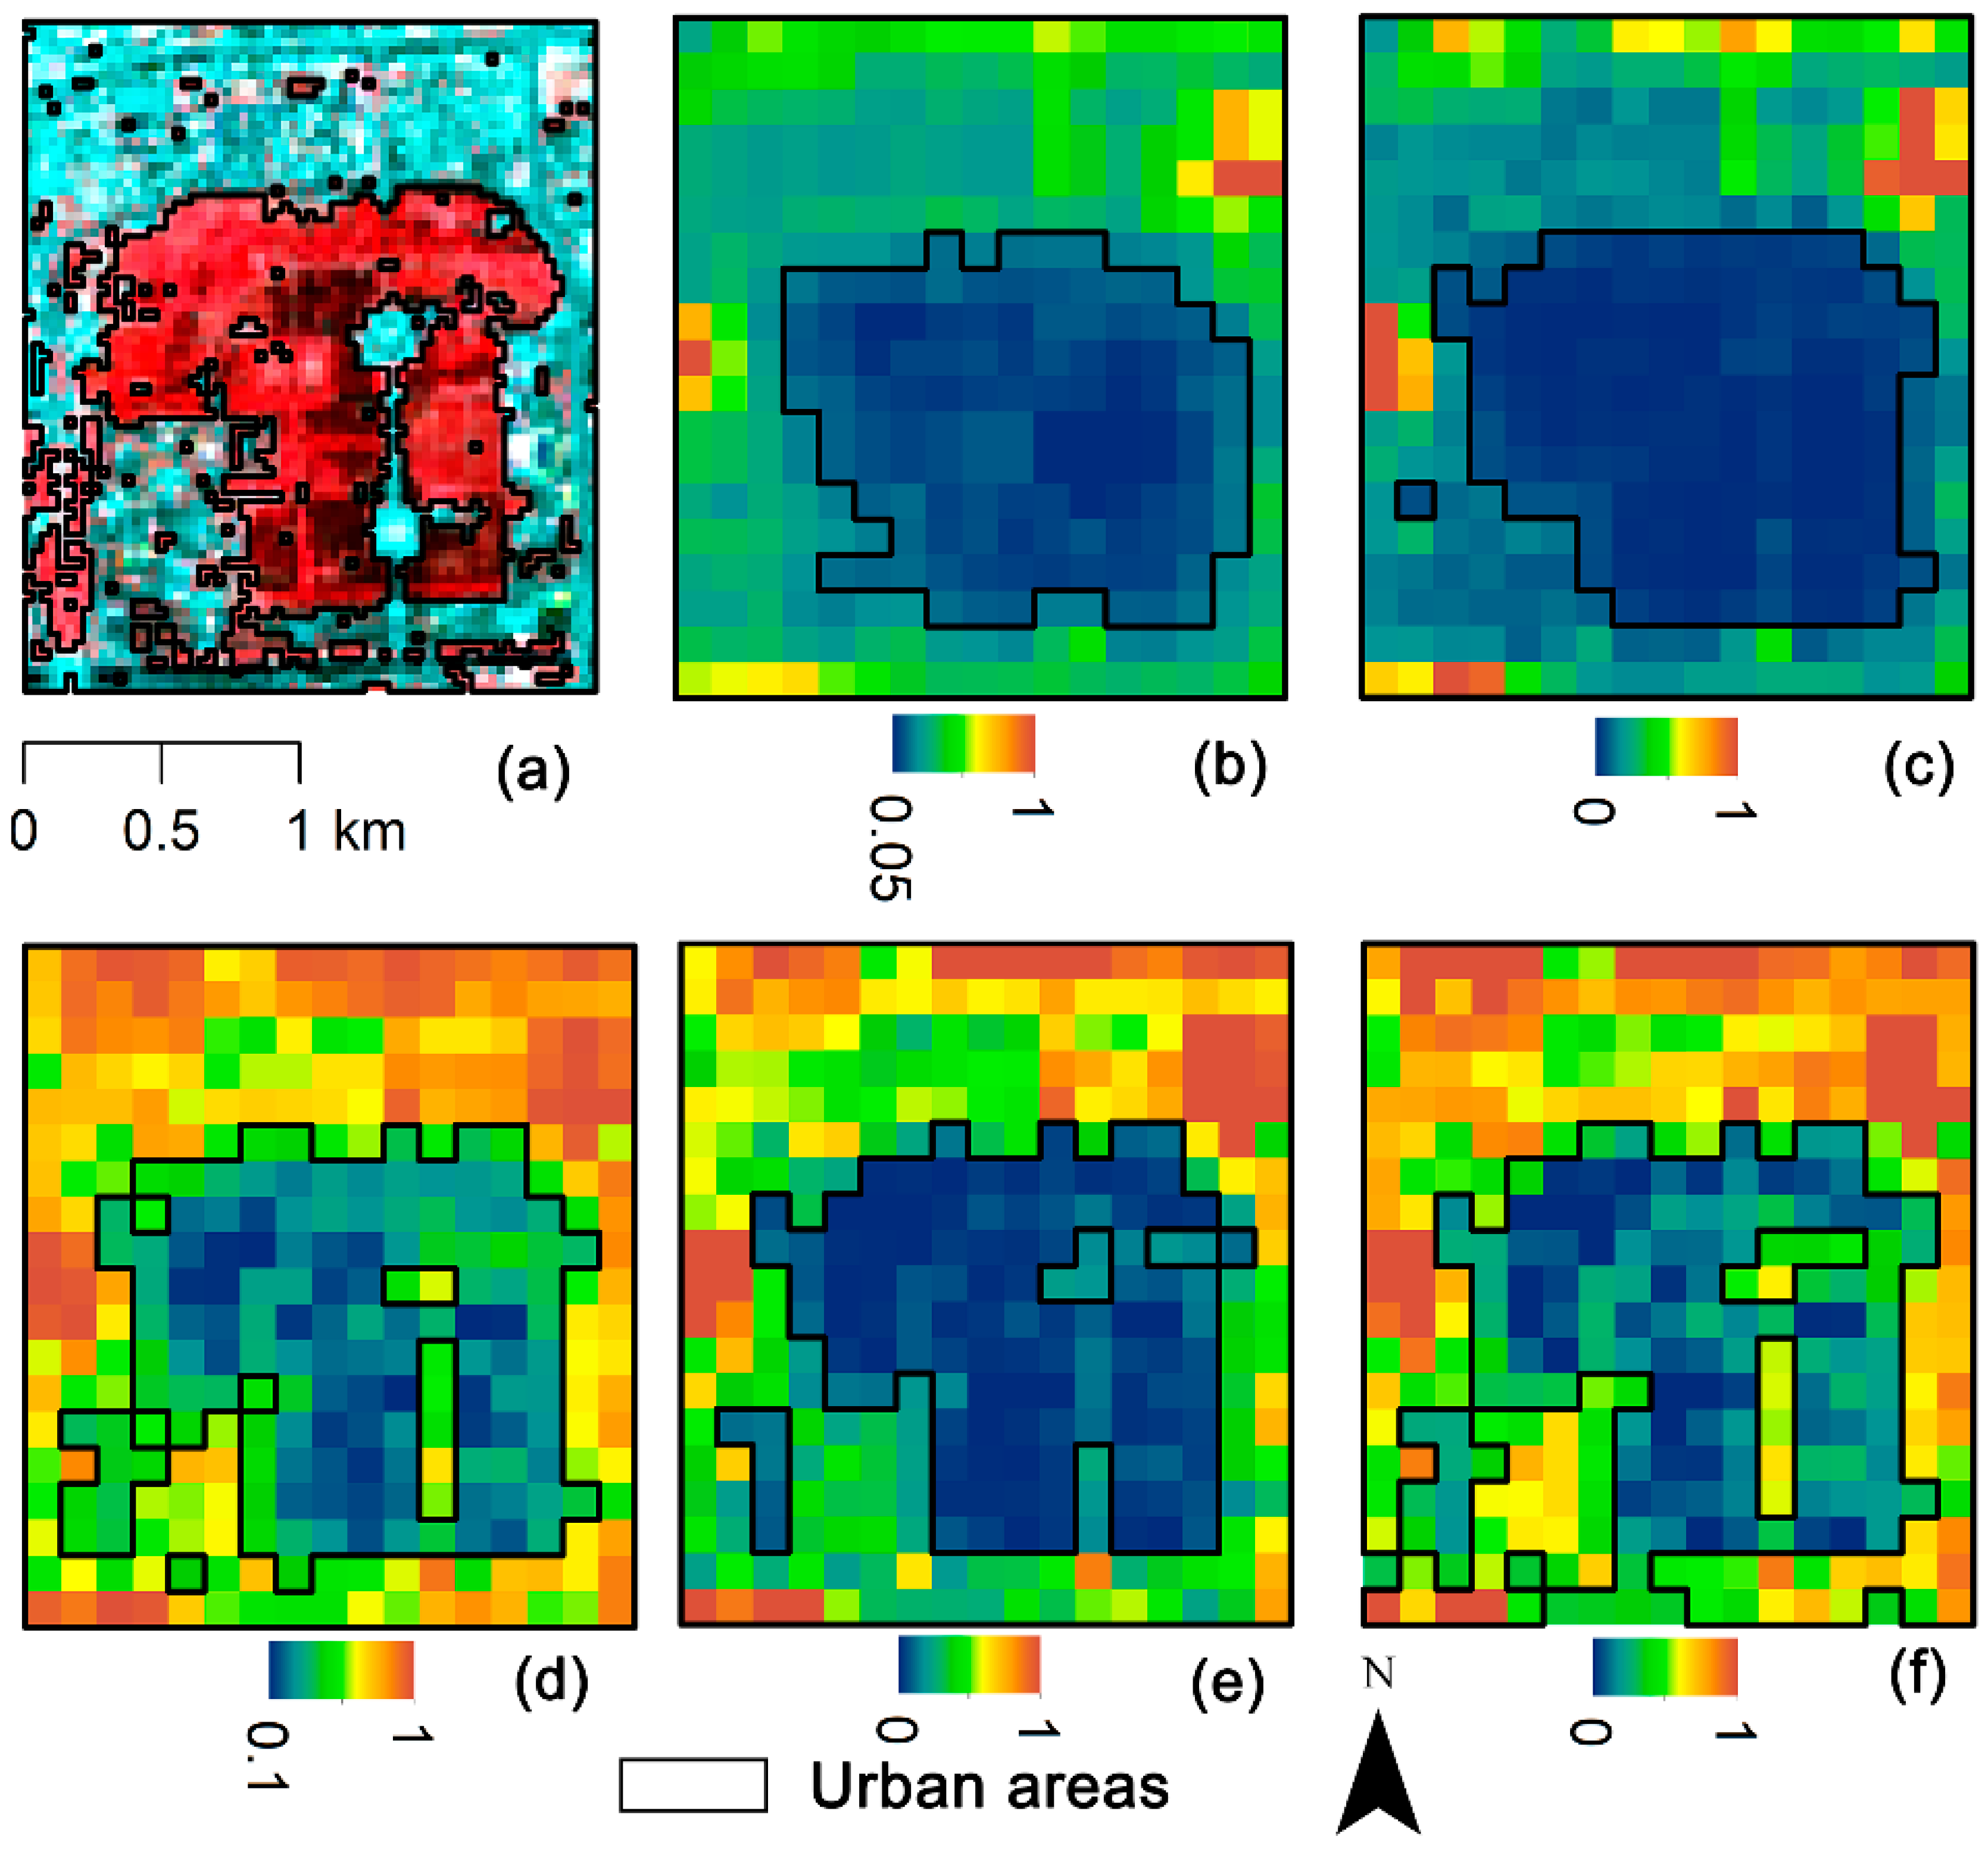
Equation (1) reveals that the integration of NDWI and EVI can eliminate the blooming effect of NTL when d is greater than r, while the saturation effect of NTL can be mitigated when d is less than r. As illustrated in Figure 5, in the absence of NTL, NUACI is unable to detect impervious surfaces, such as buildings and roads in urban areas. To make up for the drawback of NUACI, HSI was introduced to reinforce the NTL effect of urban impervious surfaces. In addition, compared with NDWI, MNDWI is more suitable for water identification of water bodies under urban background due to its merits of suppressing noises from bare soil and built-up areas [38]. Considering the advantages of HSI and MNDWI, a modified urban index MNUACI is constructed by integrating them, as expressed in the following equation:
M N U A C I = { 0 ,     d > r ,     d = ( M N D W I a ¯ M N D W I ) 2 + ( N D V I b ¯ N D V I ) 2 ( 1 d / r ) H S I ,     d r
where a ¯ M N D W I and b ¯ N D V I indicate the average MNDWI and NDVI from urban impervious surfaces, respectively. HSI can be expressed with following equation:
H S I = ( 1 N D V I n o r m ) + N T L n o r m 1 N T L n o r m + N D V I n o r m + N D V I n o r m × N T L n o r m
where NDVInorm represents the normalized NDVI, and its normalized method is the same as NTLnorm.
The equation of MNDWI is expressed as follows:
M N D W I = G M I R G + M I R
where G and MIR denote the green band and mid-infrared band of Landsat 8 OLI images, separately.

3.3. Accuracy Analysis Methods

A confusion (error) matrix is an effective quantitative method of characterizing accuracies of land use/land cover types in image classification results. The Commission Errors (CE) are mistakes where results erroneously included in consideration when they should be excluded. The Omission Errors (OE) are mistakes where results are erroneously excluded from consideration when they should have been included. Overall Accuracy (OA) is essentially what percentage of all reference data is correctly classified. The Kappa Coefficient (KC) is a statistic measure of inter-rater reliability or intra-rater reliability for qualitative (categorical) items [39,40,41]. The Jaccard Similarity coefficient (JSI) refers to a statistic used for gauging the similarity and diversity of sample sets [42].
By calculating the CE, OE, OA, KC and JSC of the reference data and the user classification data, the consistency between both datasets can be evaluated. The detailed equations are as follows:
O E = 1 n t t n r t
C E = 1 n t t n u t
O A = n t t N
K C = N t = 1 c n t t t = 1 c n r t n u t N 2 t = 1 c n r t n u t
J S I = | U R | | U | + | R | | U R |
where ntt refers to pixel numbers correctly classified in type t; nut refers to pixel numbers of type t in user classification data; nrt refers to pixel numbers of type t in the reference data; c refers to the number of all types; N refers to total pixel numbers in all types; and U and R refer to the user classification dataset and reference dataset, respectively.

3.4. Estimation of Urban Impermeable Surface

The Impervious Surface Area (ISA) is considered to be an important indicator to measure the degree of urbanization. Previous studies have confirmed a positive correlation between ISA and urban NTL data [43,44], therefore, ISA can be used as an evaluation indicator for extraction results of urban areas. Using the blue and near-infrared bands of Landsat 8 images, the Perpendicular Impervious Surface Index (PISI) was derived and used to represent the ISA [45]. The extraction accuracy for the ISA based on PISI ranged from 89.51% to 96.50% in the four China cities, which demonstrated a better separability for ISA and bare soil. The ISA can be derived by following equation:
I S A = 0.8192 ρ B l u e 0.5735 ρ N I R + 0.0750
where ρBlue and ρNIR denote the reflectance of the blue band and near-infrared band from a Landsat 8 image.

4. Results

4.1. Urban Area Extraction by the MNUACI

Landsat 8 multi-spectral reflectance data from the four capital cities in China were adopted to calculate MNDWI and NDVI. The MNUACI was then derived by integrating MNDWI, NDVI and Luojia 1-01 NTL. Before performing the calculation for MNUACI, the parameters a ¯ M N D W I and b ¯ N D V I were determined by Equation (3) based on samples collected from the urban cores. The parameter r was calculated according to the farthest distance between ( a M N D W I ,   b N D V I ) and ( a ¯ M N D W I , b ¯ N D V I ) from the sample data. The parameters ( a ¯ M N D W I , b ¯ N D V I , r) from Beijing, Nanjing, Guangzhou and Haikou are (0.73, 0.54, 0.35), (0.37, 0.55, 0.51), (0.41, 0.46, 0.32) and (0.36, 0.36, 0.49), respectively.
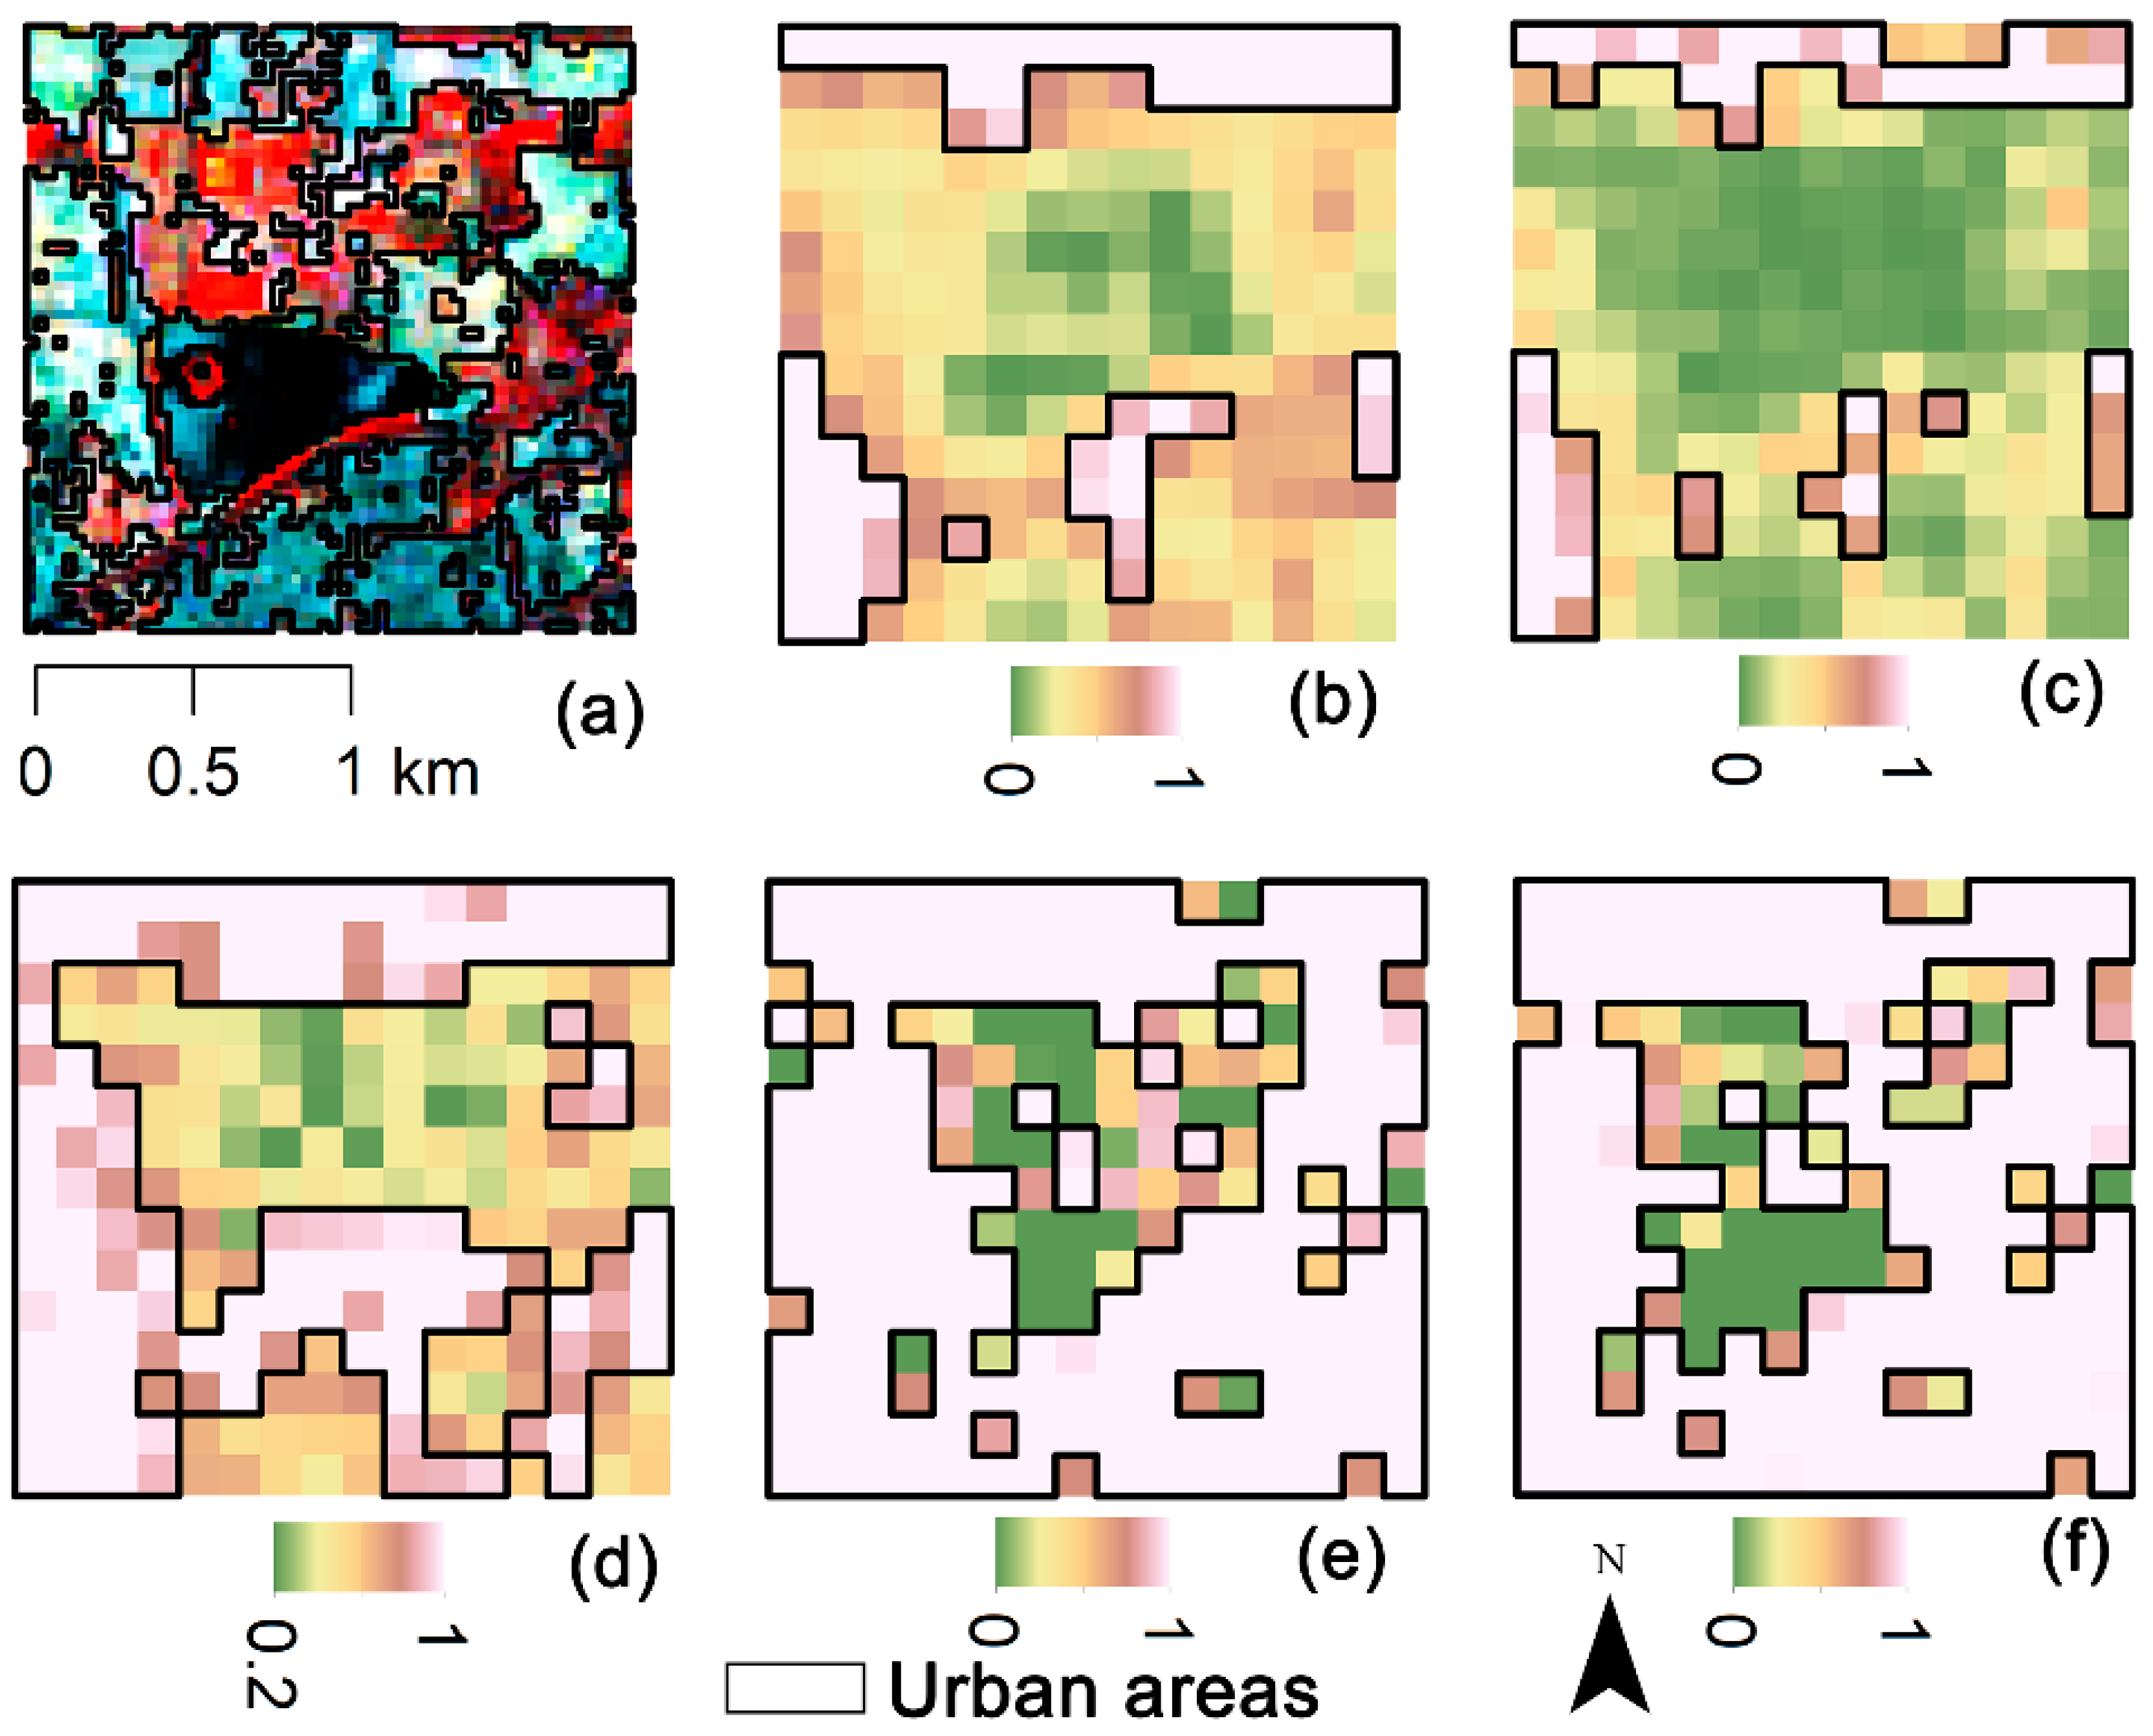
MNUACI is used to distinguish between light-intensity differences in urban core areas, and therefore, to improve pixel resolution in light-saturated areas and allow recognition of urban core structures. The Temple of Heaven Park in Beijing and Hongcheng Lake in Haikou were selected to evaluate the effectiveness of MNUACI. As illustrated in Figure 5, the urban areas (cyan) extracted from Landsat 8 were regarded as reference data, to which NTL, EANTLI, HSI, NUACI, and MNUACI were compared. It can be seen that NTL and EANTLI have similar results: neither buildings nor roads are recognized in the middle of the park due to the lack of nighttime luminosity. Although NUACI shows more fractions of urban areas, only a small amount of impervious surface in the park can be recognized, due to the lack of a sufficient luminous condition. HSI and MNUACI identified detail structures of impervious surfaces, but MNUACI extracted impervious surfaces more accurately. As illustrated in Figure 6, NTL and EANTLI mistakenly identify most urban areas as pervious surfaces and increase omission errors. Although HSI identifies more urban areas, it recognizes the lake as urban areas by mistake, resulting in many commission errors. The recognition results of urban areas from NUACI and MNUACI are similar, both showing the detailed urban structure. However, MNUACI exhibits higher accuracy of urban areas extraction resulting from the reduction of the impact of water bodies on urban areas using MNDWI.
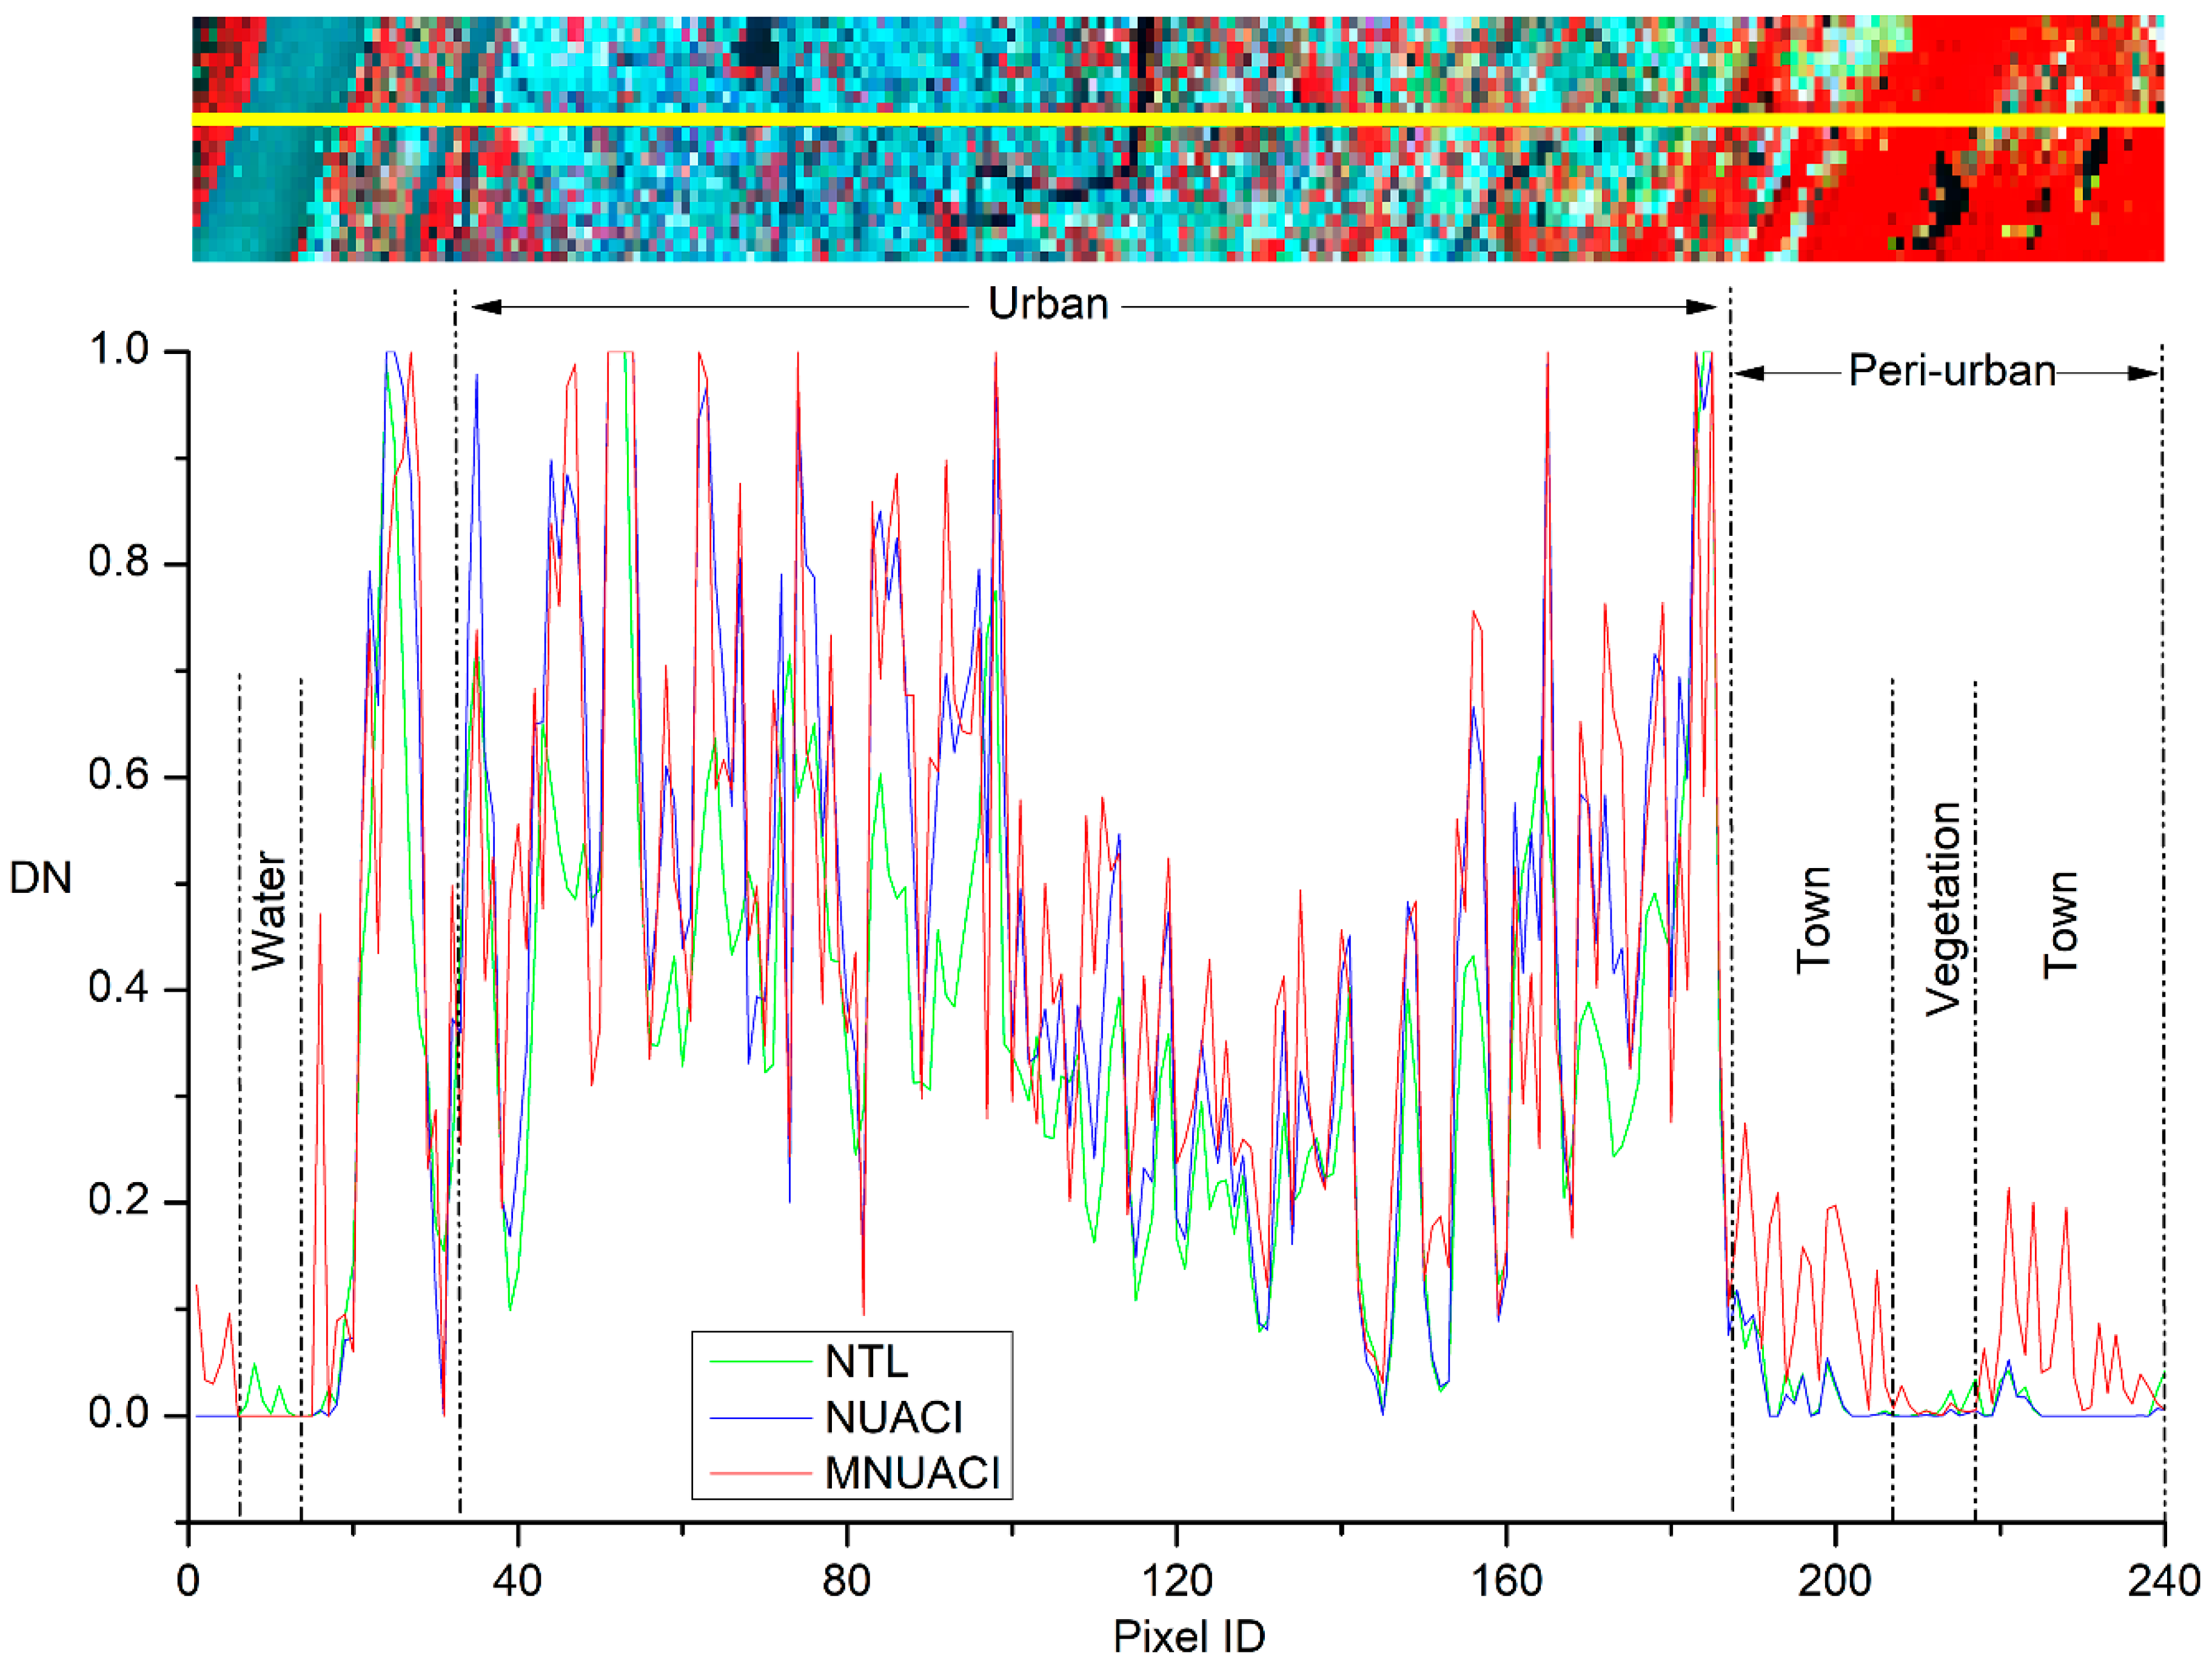
Taking Nanjing as an example, Figure 7 illustrates a latitudinal transect of NTL, NUACI and MNUACI. These three types of curve variation are similar, but DN values of MNUACI and NUACI in urban areas are distinctly higher than those of NTL, which suggests that MNUACI and NUACI can enhance the NTL effect in urban areas. For urban areas, MNUACI has higher peaks and lower valleys than NUACI, which reflects more characteristics of inner-urban variability and spatial differentiation. This suggests an easier process of urban area extraction using MNUACI. For peri-urban areas, NUACI and NTL present similar low DN values, proving it difficult to identify small towns with them. In contrast, DN values are higher when MNUACI extracts urban areas in suburban regions. In addition, NTL cannot eliminate blooming effects due to a small quantity of luminosity values occurring in water and vegetation areas, while MNUACI and NUACI solve these blooming problems by introducing vegetation and water indexes.

4.2. Performance Assessment of the MNUACI

In terms of urban area recognition, a combination of NTL and auxiliary data is better than the use of NTL alone. Different extraction methods for urban areas demonstrate different performances on the same composited NTL index [46]. To assess the feasibility and effectiveness of MNUACI, several supervised and unsupervised classification approaches were separately applied to identify urban areas on NTL, EANTLI, HSI, NUACI and MNUACI images. Because the optimal thresholding method is time-consuming and laborious, the genetic algorithm (GA) was used instead of automatically determining the image segmentation threshold for the extraction of urban areas [47]. Deep learning (DL), GA, fuzzy C-means (FCM) and SVM methods were used to extract urban areas from NTL, EANTLI, HSI, NUACI and MNUACI images of Beijing, Nanjing, Guangzhou and Haikou. Moreover, urban area references of the four sample cities were obtained from Landsat 8 images using the maximum likelihood classifier (MLC) method. Corresponding urban areas from each city were derived from NTL, EANTLI, HSI, NUACI and MNUACI images associated with DL, GA, FCM and SVM approaches. The point-to-point comparison method was applied to test images and reference images. Then, precision indicators such as the Kappa coefficient, overall accuracy and the Jaccard similarity index were calculated to analyze the performance of the combination of different indexes and approaches.
The OA and KC of reference images from Beijing, Nanjing, Guangzhou and Haikou are (93.42%, 0.87), (95.88%, 0.92), (98.16%, 0.96) and (96.94%, 0.94), respectively, which suggests that the classification accuracies of Landsat 8 images from the four cities are reliable.
As illustrated in Table 2, Table 3, Table 4 and Table 5, based on the OA, KC and JSC of five NTL indexes, the order of accuracy of urban area classification in Beijing, Nanjing, Guangzhou and Haikou respectively are: MNUACI > HSI > NUACI > NTL > EANTLI, MNUACI > NUACI > NTL > HSI > EANTLI, MNUACI > NUACI > HSI > NTL > EANTLI, MNUACI > NUACI> HSI > NTL > EANTLI. MNUACI has a higher classification accuracy than the other four NTL indexes of the four capital cities using four classification approaches. Based on the OA, KC and JSC of the four classification methods in MNUACI, each SVM demonstrates the highest classification accuracy in the four urban area classification methods. Except the classification accuracy of NUACI which ranks third in Beijing, each NUACI accuracy from the other three cities follows the corresponding MNUACI. For MNUACI, the accuracy relationship of the four urban area extraction approaches in Beijing, Nanjing, Guangzhou and Haikou are as follows: SVM > GA > FCM > DL, SVM > DL> GA > FCM, SVM > GA > FCM > DL, SVM > GA > FCM > DL. The SVM method is superior to other methods with the GA method being the second, the FCM method the third, and the DL method the last.
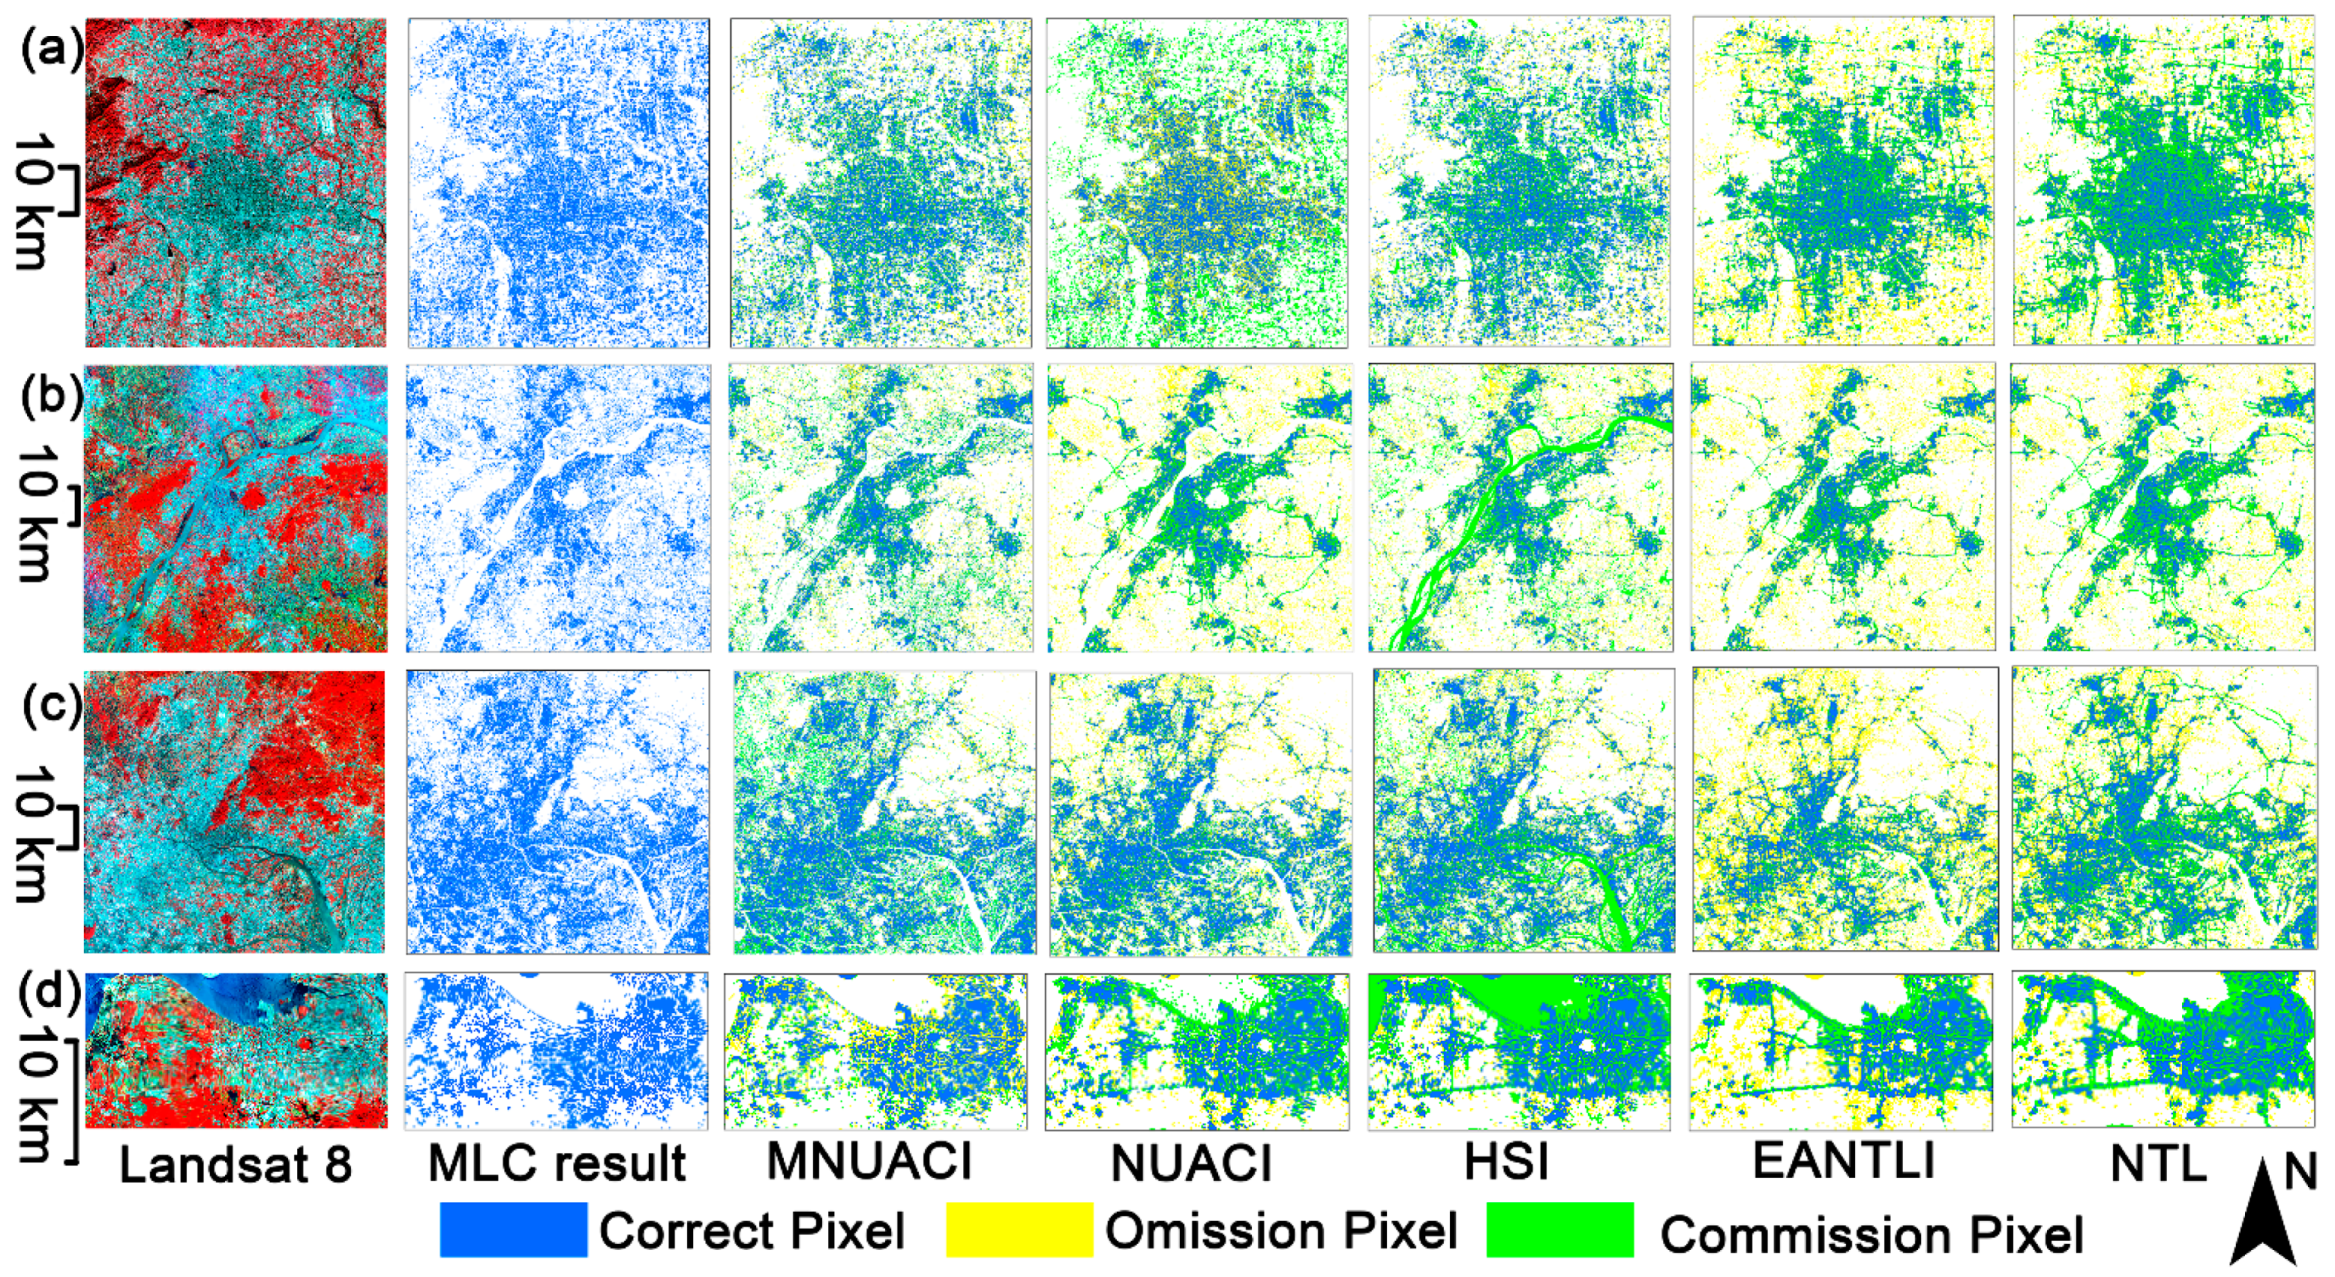
After applying the SVM method, the spatial distribution of the extraction accuracy of urban areas, commission errors and omission errors from Beijing, Nanjing, Guangzhou and Haikou are displayed in Figure 8. The results of EANTLI and NTL produce a great deal of omission errors on some peri-urban areas lacking in nighttime luminosity. This might be due to the Luojia 1-01 satellite imaging time set at 2:00–3:00 a.m. local time. The primary errors of HSI for the extraction of urban areas are commission errors caused by a large number of water bodies. Although NUACI improves the accuracy of urban area extraction by integrating vegetation and water bodies, NUACI, like EANTLI and NTL, still has difficulty identifying unlit urban areas due to the use of NTL alone. All results of MNUACI in the term of extraction of urban areas illustrate lower commission errors and omission errors contrasting to results of NUACI, HSI, EANTL and NTL. Moreover, the spatial distribution type of MNUACI results is also closer to the MLC results.
The extraction results of urban areas in the Tongzhou District of Beijing based on MNUACI, NUACI, HSI, EANTLI and NTL by the SVM method are shown in Figure 9, and a Landsat 8 false color composite image (Figure 9a) is used as a visual reference for urban areas. For two central city areas, MNUACI and HSI show specific spatial distribution patterns and inner-urban differentiation. NUACI and EANTLI extracted non-vegetation and illuminated regions as urban areas, while NTL extracted only illuminated regions as urban areas. For two town areas, NTL, EANTLI and NUACI merely identify road areas within them, missing most town areas, especially for Town II, while MNUACI and HSI recognize more urban areas. For bare land area, NTL, EANTLI and NUACI merely identify minor bare lands within them while MNUACI and HSI recognize most bare lands. For construction sites, NTL almost identifies the whole construction sites as urban areas without any difference, while EANTLI, HSI, NUACI and MNUACI can extract urban areas correctly, among which MNUACI have the best extraction effect. For village areas, the results of urban areas identified by the five indexes are similar, but for Village I, NTL, EANTLI and NUACI, lead to a large number of omission errors, while the results of HSI and MNUACI generate minimum omission errors. Moreover, NTL and EANTLI produce slight commission errors over the river area, and even HSI mistakenly identifies rivers as urban areas. In contrast, MNUACI and NUACI do not generate such errors.

4.3. Correlation between MNUACI and Urban Impervious Surface

Furthermore, one thousand sample points from an ISA image and corresponding MNUACI, NUACI, HSI, EANTLI and NTL images in each city were randomly selected by using the Create Random Points tool as well as the Extract Multi Values to Points tool of the ArcGIS software. The quadratic polynomial regression models were subsequently established with MNUACI, NUACI, HSI, EANTLI and NTL for estimation of ISA. Correlation coefficients and Root-Mean Square Error (RMSE) were employed together to evaluate the performance of the established regression models.
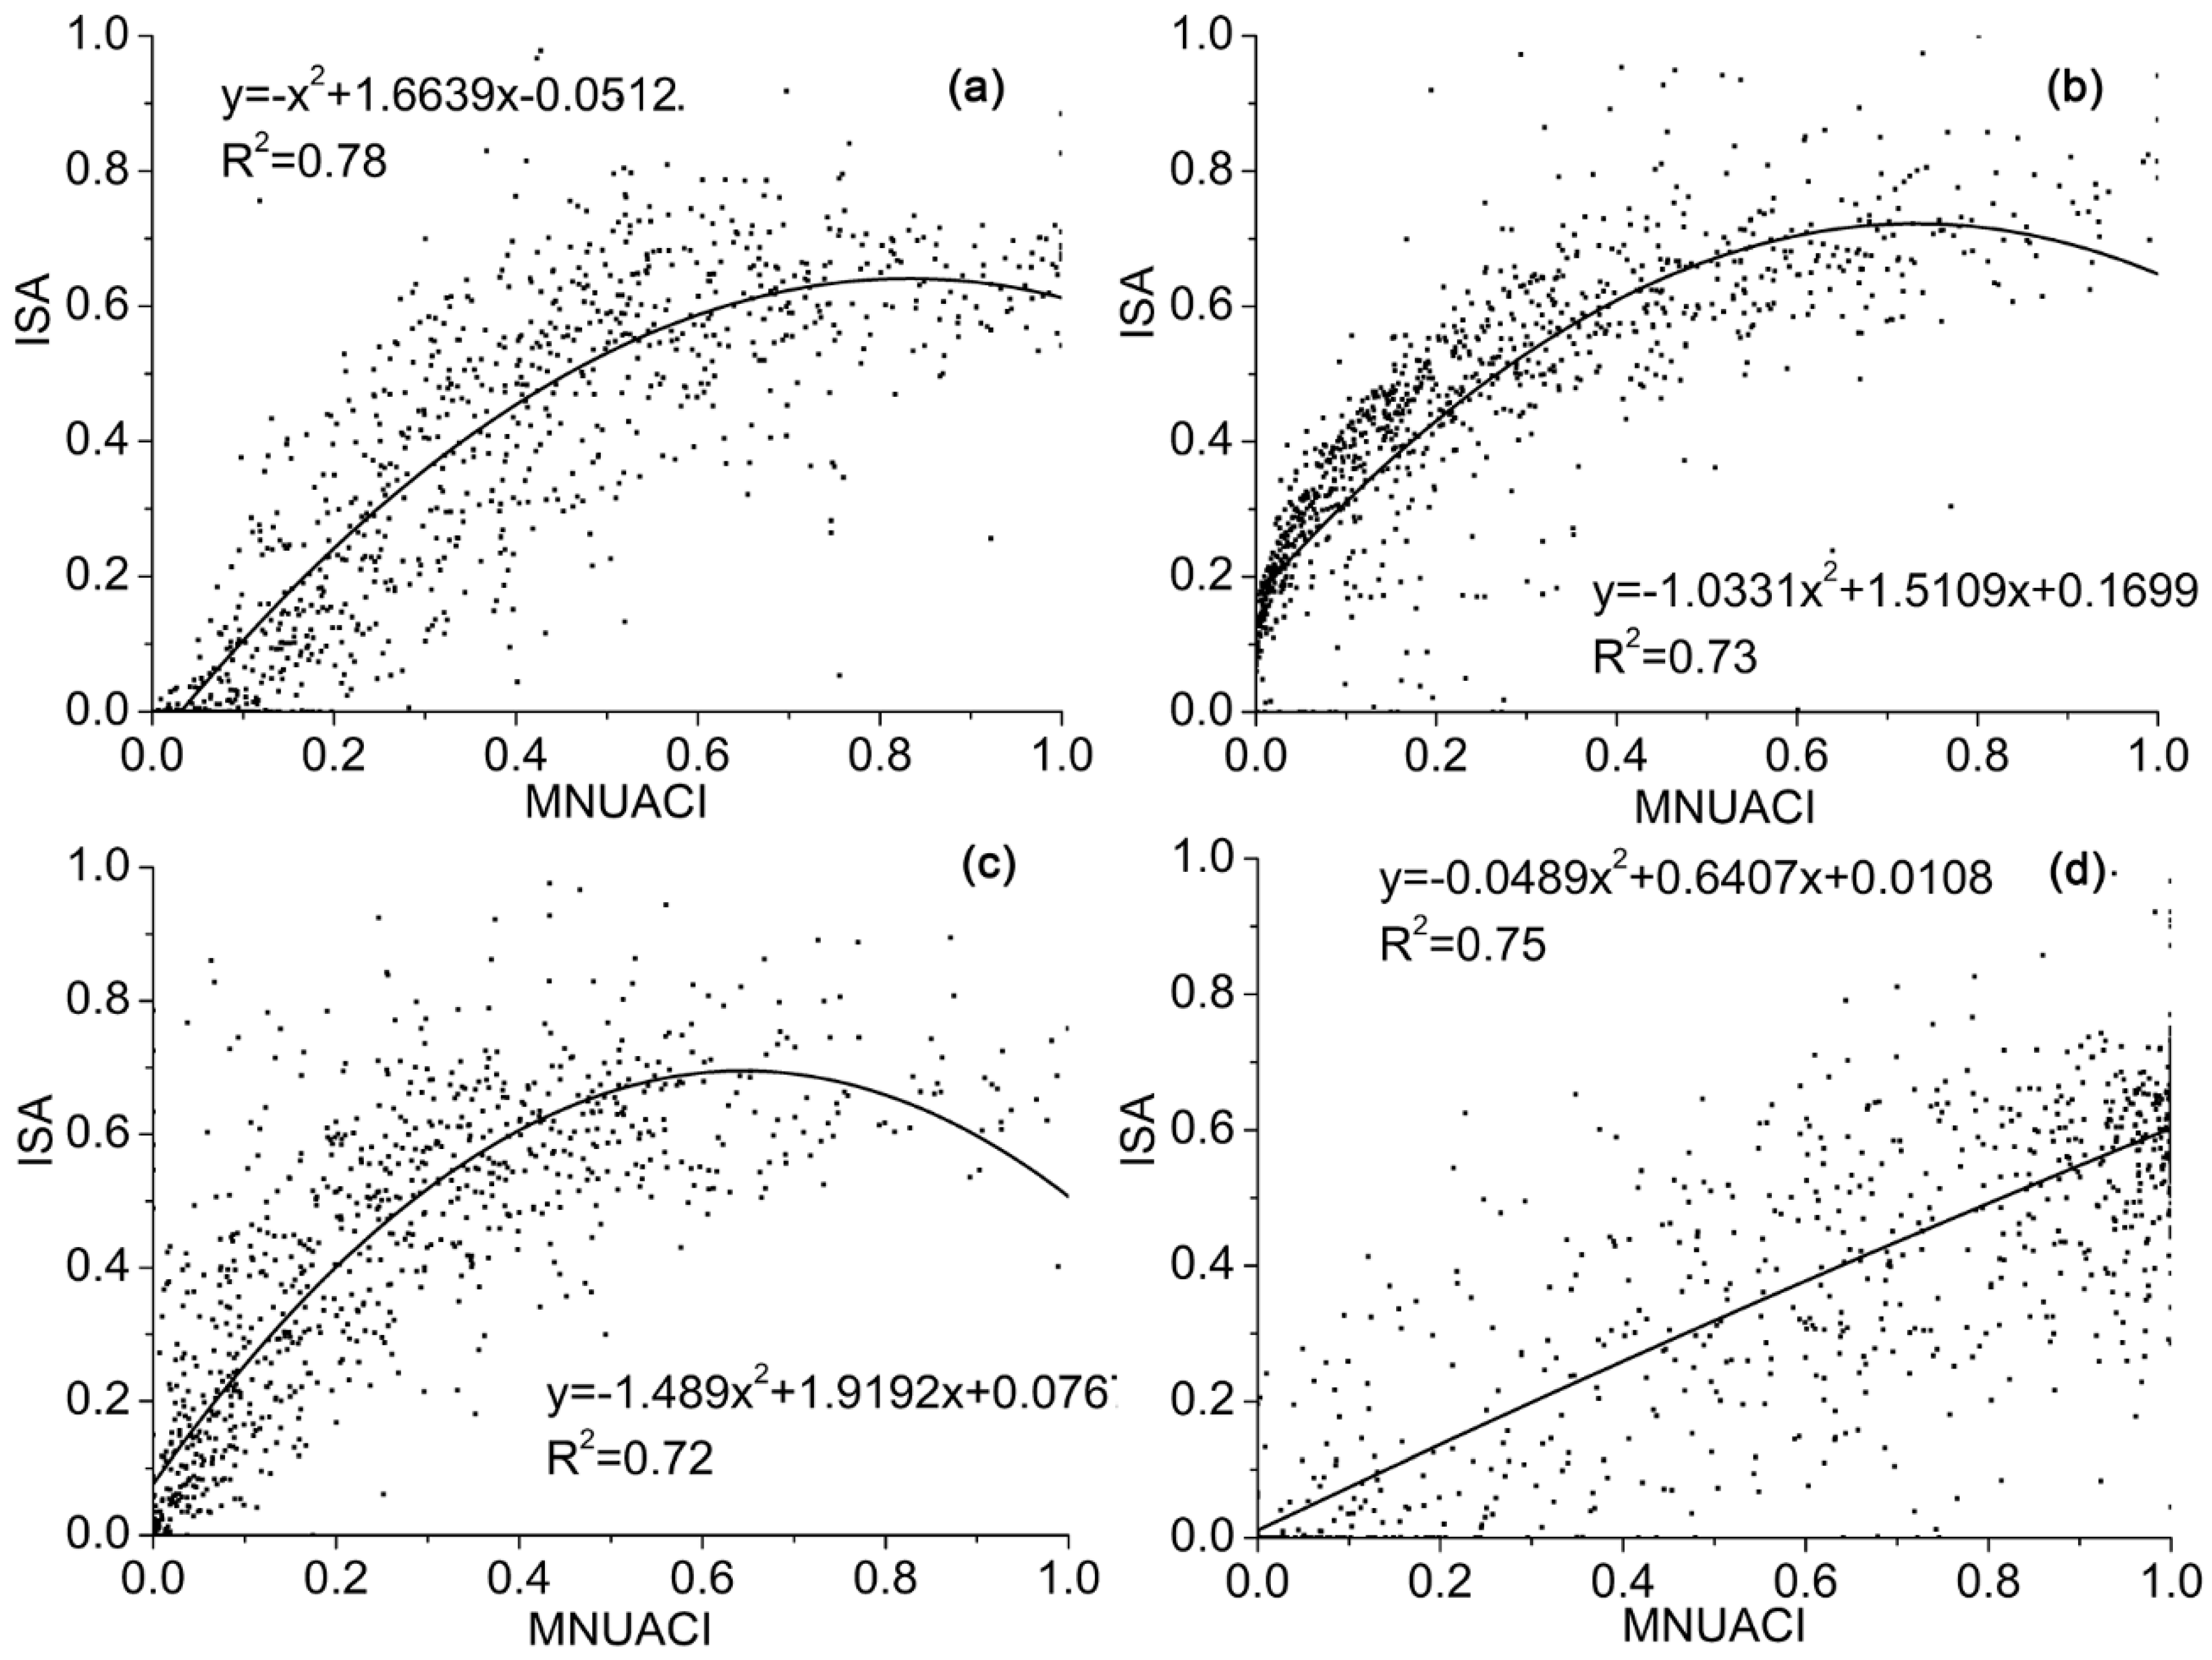
As shown in Table 6, the average R2 and RMSE of MNUACI, NUACI, HSI, EANTLI and NTL in Beijing, Nanjing, Guangzhou and Haikou are (0.74, 0.13), (0.49, 0.18), (0.44, 0.19), (0.21, 0.22) and (0.24, 0.22), respectively. According to correlation coefficients and the RMSE of quadratic polynomial regression models, the results of EANTLI and NTL have similar lower fitting accuracy, and the result of HSI is better than that of the previous two indexes. Apart from the result of Beijing, model regression effects of NUACI in the other three cities are better than EANTLI and NTL. In contrast, MNUACI shows the highest correlation coefficients and the lowest RMSE in all four cities. This suggests that the regression model of MNUACI could enormously decrease the blooming effect of Luojia 1-01 NTL and improve identification accuracy for non-luminous ISA better than for other models. As illustrated in Figure 10, the scatter plots indicate that regression models between MNUACI and ISA in Beijing, Nanjing, and Guangzhou demonstrate the form of a quadratic polynomial regression model, whereas the polynomial regression model at Haikou is closer to a linear regression model. The NTL of urban core areas in developed metropolitan cities, such as Beijing, can contribute to the saturated MNUACI value. The ISA corresponding to PISI might not be the highest, because the differentiation between the blue and the near-infrared band during the daytime is weakened in the urban core area. On the contrary, the NTL of urban core areas in developing cities, such as Haikou, might rarely generate a saturated MNUACI value, which can present a good linear correspondence to ISA derived from a multispectral image.

5. Discussion

In this study, the MNUACI was proposed to improve the capability of delineating spatial structures of inner-urban areas using vegetation coverage and water body index via Luojia 1-01 NTL data. Four China cities with different development levels were chosen to evaluate the performance of MNUACI. To some extent, MNUACI expressed the specific spatial distribution patterns and inner-urban differentiation of urban areas. It also tackled the problems of urban area extraction in areas with low- and non-luminosity.

5.1. Comparison with Previous Indexes

It is difficult for a single NTL to correctly identify urban areas. Through the introduction of a vegetation index, EANTLI, HSI and NUACI all improved the differentiation within the city core area, but HSI mistakenly identifies water bodies as urban areas, and EANTLI also brings about commission errors because of the NTL blooming effect; NUACI applied the water body and vegetation indexes further enhance the inner-city variability and differentiation. However, NUACI is still subject to the NTL blooming effect, generating commission errors in the urban core area. For bare land and suburban towns, NTL, EANTLI and NUACI all generate numerous omission errors due to the lack of luminosity information. In contrast, by using smaller NDVI values (bare land, sand land and built-ups), HSI increases the recognition rate of bare land and urban areas, so that HSI and MNUACI can identify urban areas even under lower luminous conditions. As a regulated version of NDWI, MNDWI can effectively reduce the misclassified built-ups and their shadow information in urban water bodies, while HSI can strengthen the light index value in urban and suburban areas. By introducing improved water index and HSI, MNUACI decreased the size of saturated urban areas and increased the spatial differentiation and variability of inner-urban ones. In addition, with the introduction of HSI, the MNUACI significantly improves the identification ability of urban areas without NTL; it especially reduces the commission errors of urban areas in suburban areas. Adjusted by MNDWI and HSI, MNUACI can not only accurately express the spatial differentiation related to urban spatial structure, but can also increase spatial variation in NTL outside saturated urban areas more than NUACI.
The accuracy of urban area extraction was compared through four classification methods on four sample datasets under different natural and socioeconomic conditions. overall accuracy, Kappa coefficient and Jaccard similarity index were introduced to assess the accuracy of MNUACI, NUACI, HSI, EANTLI and NTL in terms of urban area mapping. Although vegetation index was added to the NTL data to reduce the blooming effect of NTL, the problem of omission errors caused by unlit or low-lit areas was not solved for the high-resolution light data such as for Luojia 1-01. Therefore, NTL and EANTLI had a lower extraction accuracy for urban areas. HSI improves the identification accuracy of urban areas in unlit or low-lit areas because HSI uses a smaller NDVI. However, HSI wrongly identifies the water body as the urban area, resulting in large commission errors. The integration of the water and vegetation index allows NUACI to reduce NTL saturation and the blooming effect, but there still exists the problem of omission errors associated with no-lit or low-lit data. Among the five indexes, the urban area results extracted by MNUACI exhibit the highest accuracy and robustness. This is due to MNUACI dramatically reducing the omission error caused by the unlit area based on small NDVI values and eliminating the blooming effect of NTL through vegetation and the water body index.
For MNUACI, the SVM method has the best performance, followed by the GA method. In third is the FCM method and the DL method shows the lowest urban classification accuracy. Due to the lack of extensive shape and texture information from urban objects, the DL method failed to achieve the desired high accuracy of urban area classification. Although the GA method can obtain higher classification accuracy of urban areas by simulating the natural evolution process to determine the optimal segmentation threshold, the SVM supervised classification approach using training samples shows higher accuracy in terms of Kappa coefficient, overall accuracy and Jaccard similarity index. In addition, considering the coefficient of regression model and RMSE, the correlation degree between the NTL index and ISA is as follows: MNUACI>NUACI>HSI>EANTLI>NTL. The above results suggest that the MNUACI model is robust and reliable for extraction of urban areas. Therefore, with the global coverage of Luojia 1-01 NTL and NDVI data, the approach we proposed can also be applied to the study of urban socio-economic, and environmental issues in other countries and regions around the world.

5.2. Limitations of the Method

The proposed MNUACI model is proven to be effective and accurate in analyzing and identifying urban areas. However, there remain several shortcomings of MNUACI that could be further improved in the future study. Firstly, though the estimation errors of MNUACI were the smallest in five indexes, there still exist large omission errors in unlit and low-lit area, especially in peri-urban areas. More efforts in improving this model quality and integrating more ancillary data should be made. For instance, POI (Point of Interest), land surface temperature and population data can make up the defect caused by unlit and low-lit areas [48,49,50]. Also, co-registration errors of Luojia 1-01 NTL images with Landsat 8 images would be transmitted to MNUACI through NDVI and MNDWI, resulting in some urban area misidentification. Once the positioning accuracy of Luojia 1-01 images is improved, the fusion of NTL and Landsat 8 images will improve the performance of MNUACI. Moreover, it is complicated and difficult to derive accurate parameters d and r by statistical sample data of urban areas. Inaccurate parameters may lead to the inability to exclude the impact of vegetation and water. Finally, the performance of MNUACI was tested only using Luojia 1-01 NTL data, and its applicability and feasibility need to be further evaluated by using other low-resolution NTL data, such as NPP-VIIRS and DMSP-OLS.

6. Conclusions

Accurate and timely information on the spatial extent and spatial distribution of urban areas, particularly at the regional and global levels, is crucial and important for environmental and ecological issues. NTL data are valuable for regional and global urban mapping and for analysis of urban human activities. The Luojia 1-01 satellite usually captures NTL images before dawn, when urban area lights may be turned off. Thereby, NTL data might ignore certain important urban characteristics. In this research, a new urban index is proposed, combining information from Luojia 1-01 NTL data, NDVI and MNDWI of Landsat 8 data for more detailed characterizations of inner-urban variations in nighttime luminosity. In comparison with NUACI, HSI, VANTLI and NTL, MNUACI was superior in identification of inner-city forms. Then, the performance of SVM, GA, FCM and DL methods for extraction of urban areas were evaluated in four Chinese cities according to the five urban indexes mentioned. MNUACI based on the SVM method exhibits the best performance in urban area extraction, attributed to the integration of HSI, NDVI and MNDVI information. The regression models based on the five NTL indices were respectively established to map ISA using the urban fraction obtained by Landsat 8 images as the reference data. The validation results reveal a closer goodness-of-fit relationship with both MNUACI and corresponding ISA. The average correlation coefficient and the RMSE of the four cities are 0.74 and 0.13, respectively. In conclusion, combining with multi-source remotely sensed data, MNUACI has the ability to mitigate NTL pixel saturation and eliminate blooming effects, and provides a promising approach for identification of urban areas by enhancing inner-urban spatial differentiation and spatial differentiation.

Author Contributions

F.L. designed the MNUACI method for extracting urban areas and drafted the manuscript. X.L. carried out the processing of nighttime light data and land use classification using a maximum likelihood classifier based on Landsat 8 images. S.L. analyzed and assessed results of the MNUACI method. P.J. supervised the study and revised the manuscript. All authors have read and agreed to the published version of the manuscript.

Funding

This research was funded by the Natural Science Foundation of Hebei Province of China (Grant No. D2018512002), the Fundamental Research Funds for the Central Universities of China (Grant No. ZY20180101) and the Key Project of Science and Technology Research for Universities of Hebei Province (Grant No. ZD2020407).

Data Availability Statement

Direct request for these materials may be made to the provider as indicated in the Acknowledgments. The processed data presented in this study are available on request from the first author.

Acknowledgments

We thank the High Resolution Earth Observation System of Hubei Data Application Center for providing Luojia 1-01 satellite imagery, and the International Institute of Spatial Lifecourse Epidemiology (ISLE) for the research support.

Conflicts of Interest

The authors declare no conflict of interest. The funders had no role in the design of the study; in the collection, analyses, or interpretation of data; in the writing of the manuscript, or in the decision to publish the results.

References

  1. Cheng, F.; Liu, S.; Hou, X.; Zhang, Y.; Liu, G. Urban land extraction using DMSP/OLS nighttime light data and OpenStreetMap datasets for cities in China at different development levels. IEEE J. Sel. Top. Appl. Earth Obs. Remote Sens. 2018, 8, 2587–2599. [Google Scholar] [CrossRef]
  2. Xu, Z.; Lin, G.C.S. Participatory urban redevelopment in Chinese cities amid accelerated urbanization: Symbolic urban governance in globalizing Shanghai. J. Urban Aff. 2019, 41, 756–775. [Google Scholar] [CrossRef]
  3. Yu, Z.; Yao, Y.; Yang, G.; Wang, X.; Vejre, H. Strong contribution of rapid urbanization and urban agglomeration development to regional thermal environment dynamics and evolution. Forest Eco. Manag. 2019, 446, 214–225. [Google Scholar] [CrossRef]
  4. Zhao, N.; Jiao, Y.; Ma, T.; Zhao, M.; Fan, Z.; Yin, X.; Liu, Y.; Yue, T. Estimating the effect of urbanization on extreme climate events in the Beijing-Tianjin-Hebei region, China. Sci. Total Environ. 2019, 688, 1005–1015. [Google Scholar] [CrossRef]
  5. Wu, T.; Yang, S.; Liu, M.; Qiu, G.; Li, H.; Luo, M.; Jia, P. Urban sprawl and childhood obesity. Obes. Rev. 2020, 22, e13096. [Google Scholar]
  6. Jia, P.; Stein, A.; James, P.; Brownson, R.C.; Wu, T.; Xiao, Q.; Wang, L.; Sabel, C.E.; Wang, Y. Earth observation: Investigating noncommunicable diseases from space. Annu. Rev. Publ. Health 2019, 40, 85–104. [Google Scholar] [CrossRef] [Green Version]
  7. Rybnikova, N.A.; Portnov, B.A. Outdoor light and breast cancer incidence: A comparative analysis of DMSP and VIIRS-DNB satellite data. Int. J. Remote Sens. 2017, 38, 5952–5961. [Google Scholar] [CrossRef]
  8. National Data of National Bureau of Statistics. Available online: https://data.stats.gov.cn/easyquery.htm?cn=C01 (accessed on 7 June 2021).
  9. Tilottama, G.; Elvidge, C.D.; Sutton, P.C.; Baugh, K.E.; Tuttle, B.T. Creating a global grid of distributed fossil fuel CO2 emissions from nighttime satellite imagery. Energies 2010, 3, 1895–1913. [Google Scholar]
  10. Wu, S.; Zhou, S.; Chen, D.; Wei, Z.; Dai, L.; Li, X. Determining the contributions of urbanisation and climate change to NPP variations over the last decade in the Yangtze River Delta, China. Sci. Total Environ. 2014, 472, 397–406. [Google Scholar] [CrossRef]
  11. Levin, N.; Zhang, Q. A global analysis of factors controlling VIIRS nighttime light levels from densely populated areas. Remote Sens. Environ. 2017, 190, 366–382. [Google Scholar] [CrossRef] [Green Version]
  12. Ji, G.; Tian, L.; Zhao, J.; Yue, Y.; Zheng, W. Detecting spatiotemporal dynamics of PM2.5 emission data in China using DMSP-OLS nighttime stable light data. J. Clean. Prod. 2019, 209, 363–370. [Google Scholar] [CrossRef]
  13. Tan, M. An intensity gradient/vegetation fractional coverage approach to mapping urban areas from DMSP/OLS nighttime light data. IEEE J. Sel. Top. Appl. Earth Obs. Remote Sens. 2017, 10, 95–103. [Google Scholar] [CrossRef]
  14. Xue, X.; Zheng, Q.; Ke, W. Delineating urban boundaries using Landsat 8 multispectral data and VIIRS nighttime light data. Remote Sen. 2018, 10, 799. [Google Scholar] [CrossRef] [Green Version]
  15. Cao, X.; Chen, J.; Imura, H.; Higashi, O. A SVM-based method to extract urban areas from DMSP-OLS and SPOT VGT data. Remote Sens. Environ. 2009, 113, 2205–2209. [Google Scholar] [CrossRef]
  16. Jing, W.; Yang, Y.; Yue, X.; Zhao, X. Mapping urban areas with integration of DMSP/OLS nighttime light and MODIS data using machine learning techniques. Remote Sens. 2015, 7, 12419–12439. [Google Scholar] [CrossRef] [Green Version]
  17. Milesi, C.; Elvidge, C.D.; Nemani, R.R.; Running, S.W. Assessing the impact of urban land development on net primary productivity in the southeastern United States. Remote Sens. Environ. 2003, 86, 401–410. [Google Scholar] [CrossRef]
  18. Dou, Y.; Liu, Z.; He, C.; Yue, H. Urban land extraction using VIIRS nighttime light data: An evaluation of three popular methods. Remote Sens. 2017, 9, 175. [Google Scholar] [CrossRef] [Green Version]
  19. Lu, D.; Tian, H.; Zhou, G.; Ge, H. Regional mapping of human settlements in southeastern China with multisensor remotely sensed data. Remote Sens. Environ. 2008, 112, 3668–3679. [Google Scholar] [CrossRef]
  20. Zhang, Q.; Schaaf, C.; Seto, K.C. The vegetation adjusted NTL urban index: A new approach to reduce saturation and increase variation in nighttime luminosity. Remote Sens. Environ. 2013, 129, 32–41. [Google Scholar] [CrossRef]
  21. Zhuo, L.; Zhang, X.; Zheng, J.; Tao, H.; Guo, Y. An EVI-based method to reduce saturation of DMSP/OLS nighttime light data. Acta Geog. Sin. 2015, 70, 1339–1350. [Google Scholar]
  22. Liu, Y.; Yang, Y.; Jing, W.; Ling, Y.; Zhao, X. A new urban index for expressing inner-city patterns based on MODIS LST and EVI regulated DMSP/OLS NTL. Remote Sens. 2017, 9, 777. [Google Scholar] [CrossRef] [Green Version]
  23. Liu, X.; Hu, G.; Ai, B.; Li, X.; Shi, Q. A normalized urban area composite index (NUACI) based on combination of DMSP-OLS and MODIS for mapping impervious surface area. Remote Sens. 2015, 7, 17168–17189. [Google Scholar] [CrossRef] [Green Version]
  24. Kelly, J.T.; Gontz, A.M. Using GPS-surveyed intertidal zones to determine the validity of shorelines automatically mapped by Landsat water indice. Int. J. Appl. Earth Obs. 2018, 65, 92–104. [Google Scholar] [CrossRef]
  25. Yang, S.; Chen, X.; Wang, L.; Wu, T.; Fei, T.; Xiao, Q.; Zhang, G.; Ning, Y.; Jia, P. Walkability indices and childhood obesity: A review of epidemiologic evidence. Obes. Rev. 2021, 22, e13096. [Google Scholar] [CrossRef]
  26. Cao, W.; Dong, L.; Wu, L.; Liu, Y. Quantifying urban areas with multi-source data based on percolation theory. Remote Sens. Environ. 2020, 241, 111730. [Google Scholar] [CrossRef] [Green Version]
  27. Yang, D.; Luan, W.; Qiao, L.; Pratama, M. Modeling and spatio-temporal analysis of city-level carbon emissions based on nighttime light satellite imagery. Appl. Energ. 2020, 268, 114696. [Google Scholar] [CrossRef]
  28. Reply of the CPC Central Committee and the State Council on the “Beijing City Master Plan (2016–2035)”. Available online: http://www.gov.cn/zhengce/2017-09/27/content_5227992.htm (accessed on 7 June 2021).
  29. Beijing Statistical Yearbook 2019. Available online: http://nj.tjj.beijing.gov.cn/nj/main/2019-tjnj/zk/indexch.htm (accessed on 7 June 2021).
  30. Nanjing Statistical Yearbook 2019. Available online: http://tjj.nanjing.gov.cn/material/njnj_2019/hesuan/index.htm (accessed on 7 June 2021).
  31. Guangdong Statistical Yearbook 2019. Available online: http://stats.gd.gov.cn/gdtjnj/content/post_2639622.html (accessed on 7 June 2021).
  32. Zhang, F.; Wang, Y.; Ma, X.; Wang, Y.; Yang, G.; Zhu, L. Evaluation of resources and environmental carrying capacity of 36 large cities in China based on a support-pressure coupling mechanism. Sci. Total Environ. 2019, 668, 838–854. [Google Scholar] [CrossRef]
  33. Haikou Statistical Yearbook 2019. Available online: http://tjj.haikou.gov.cn/tjsj1/tjsjfb/tjnj/201911/t20191121_1466162.html (accessed on 7 June 2021).
  34. Li, X.; Li, X.; Li, D.; He, X.; Jendryke, M. A preliminary investigation of Luojia-1 night-time light imagery. Remote Sens. Lett. 2019, 10, 526–535. [Google Scholar] [CrossRef]
  35. Zhong, X.; Su, Z.; Zhang, G.; Chen, Z.; Meng, Y.; Li, D.; Liu, Y. Analysis and reduction of solar stray light in the nighttime imaging camera of Luojia-1 satellite. Sensors 2019, 19, 1130. [Google Scholar] [CrossRef] [Green Version]
  36. Guan, Z.; Jiang, Y.; Wang, J.; Zhang, G. Star-based calibration of the installation between the camera and star sensor of the Luojia 1-01 satellite. Remote Sens. 2019, 11, 2081. [Google Scholar] [CrossRef] [Green Version]
  37. Liu, X.; Hu, G.; Chen, Y.; Li, X.; Xu, X.; Li, S.; Pei, F.; Wang, S. High-resolution multi-temporal mapping of global urban land using Landsat images based on the Google Earth Engine Platform. Remote Sens. Environ. 2018, 209, 227–239. [Google Scholar] [CrossRef]
  38. Xu, H. Modification of normalised difference water index (NDWI) to enhance open water features in remotely sensed imagery. Int J. Remote Sens. 2006, 27, 3025–3033. [Google Scholar] [CrossRef]
  39. Yan, Y.; Deng, L.; Liu, X.L.; Zhu, L. Application of UAV-based multi-angle hyperspectral remote sensing in fine vegetation classification. Remote Sens. 2019, 11, 2753. [Google Scholar] [CrossRef] [Green Version]
  40. Hou, W.; Hou, X. Data Fusion and Accuracy Analysis of multi-source land use/land cover datasets along coastal areas of the Maritime Silk Road. ISPRS Int. J. Geo Info. 2019, 8, 557. [Google Scholar] [CrossRef] [Green Version]
  41. Cui, B.; Cui, J.; Lu, Y.; Guo, N.; Gong, M. A sparse representation-based sample pseudo-labeling method for hyperspectral image classification. Remote Sens. 2020, 12, 664. [Google Scholar] [CrossRef] [Green Version]
  42. Dalponte, M.; Frizzera, L.; Gianelle, D. Individual tree crown delineation and tree species classification with hyperspectral and LiDAR data. Peer J. 2019, 6, 6227. [Google Scholar] [CrossRef]
  43. Pok, S.; Matsushita, B.; Fukushima, T. An easily implemented method to estimate impervious surface area on a large scale from MODIS time-series and improved DMSP-OLS nighttime light data. ISPRS J. Photogramm. 2017, 133, 104–115. [Google Scholar] [CrossRef] [Green Version]
  44. Guo, W.; Li, G.; Ni, W.; Zhang, Y.; Lu, D. Exploring improvement of impervious surface estimation at national scale through integration of nighttime light and Proba-V data. GISci. Remote Sens. 2018, 55, 699–717. [Google Scholar] [CrossRef]
  45. Tian, Y.; Chen, H.; Song, Q.; Zheng, K. A novel index for impervious surface area mapping: Development and validation. Remote Sens. 2018, 10, 1521. [Google Scholar] [CrossRef] [Green Version]
  46. Zhang, X.; Li, P.; Cai, C. Regional urban extent extraction using multi-sensor data and one-class classification. Remote Sens. 2015, 7, 7671–7694. [Google Scholar] [CrossRef] [Green Version]
  47. Abdel-Khalek, S.; Ishak, A.B.; Omer, O.A.; Obada, A.S.F. A two-dimensional image segmentation method based on genetic algorithm and entropy. Optik 2016, 131, 414–422. [Google Scholar] [CrossRef]
  48. Li, F.; Yan, Q.; Bian, Z.; Liu, B.; Wu, Z. A POI and LST Adjusted NTL urbanindex for urban built-up area extraction. Sensors 2020, 20, 2918. [Google Scholar] [CrossRef]
  49. Li, P.; Zhang, X. A temperature and vegetation adjusted NTL urban index for urban area mapping and analysis. ISPRS J. Photogram. 2018, 135, 93–111. [Google Scholar]
  50. Dobson, J.E.; Bright, E.A.; Coleman, P.R.; Durfee, R.C.; Worley, B.A. Landscan: A global population database for estimating populations at risk. Photogramm. Eng. Remote Sens. 2000, 66, 849–857. [Google Scholar]
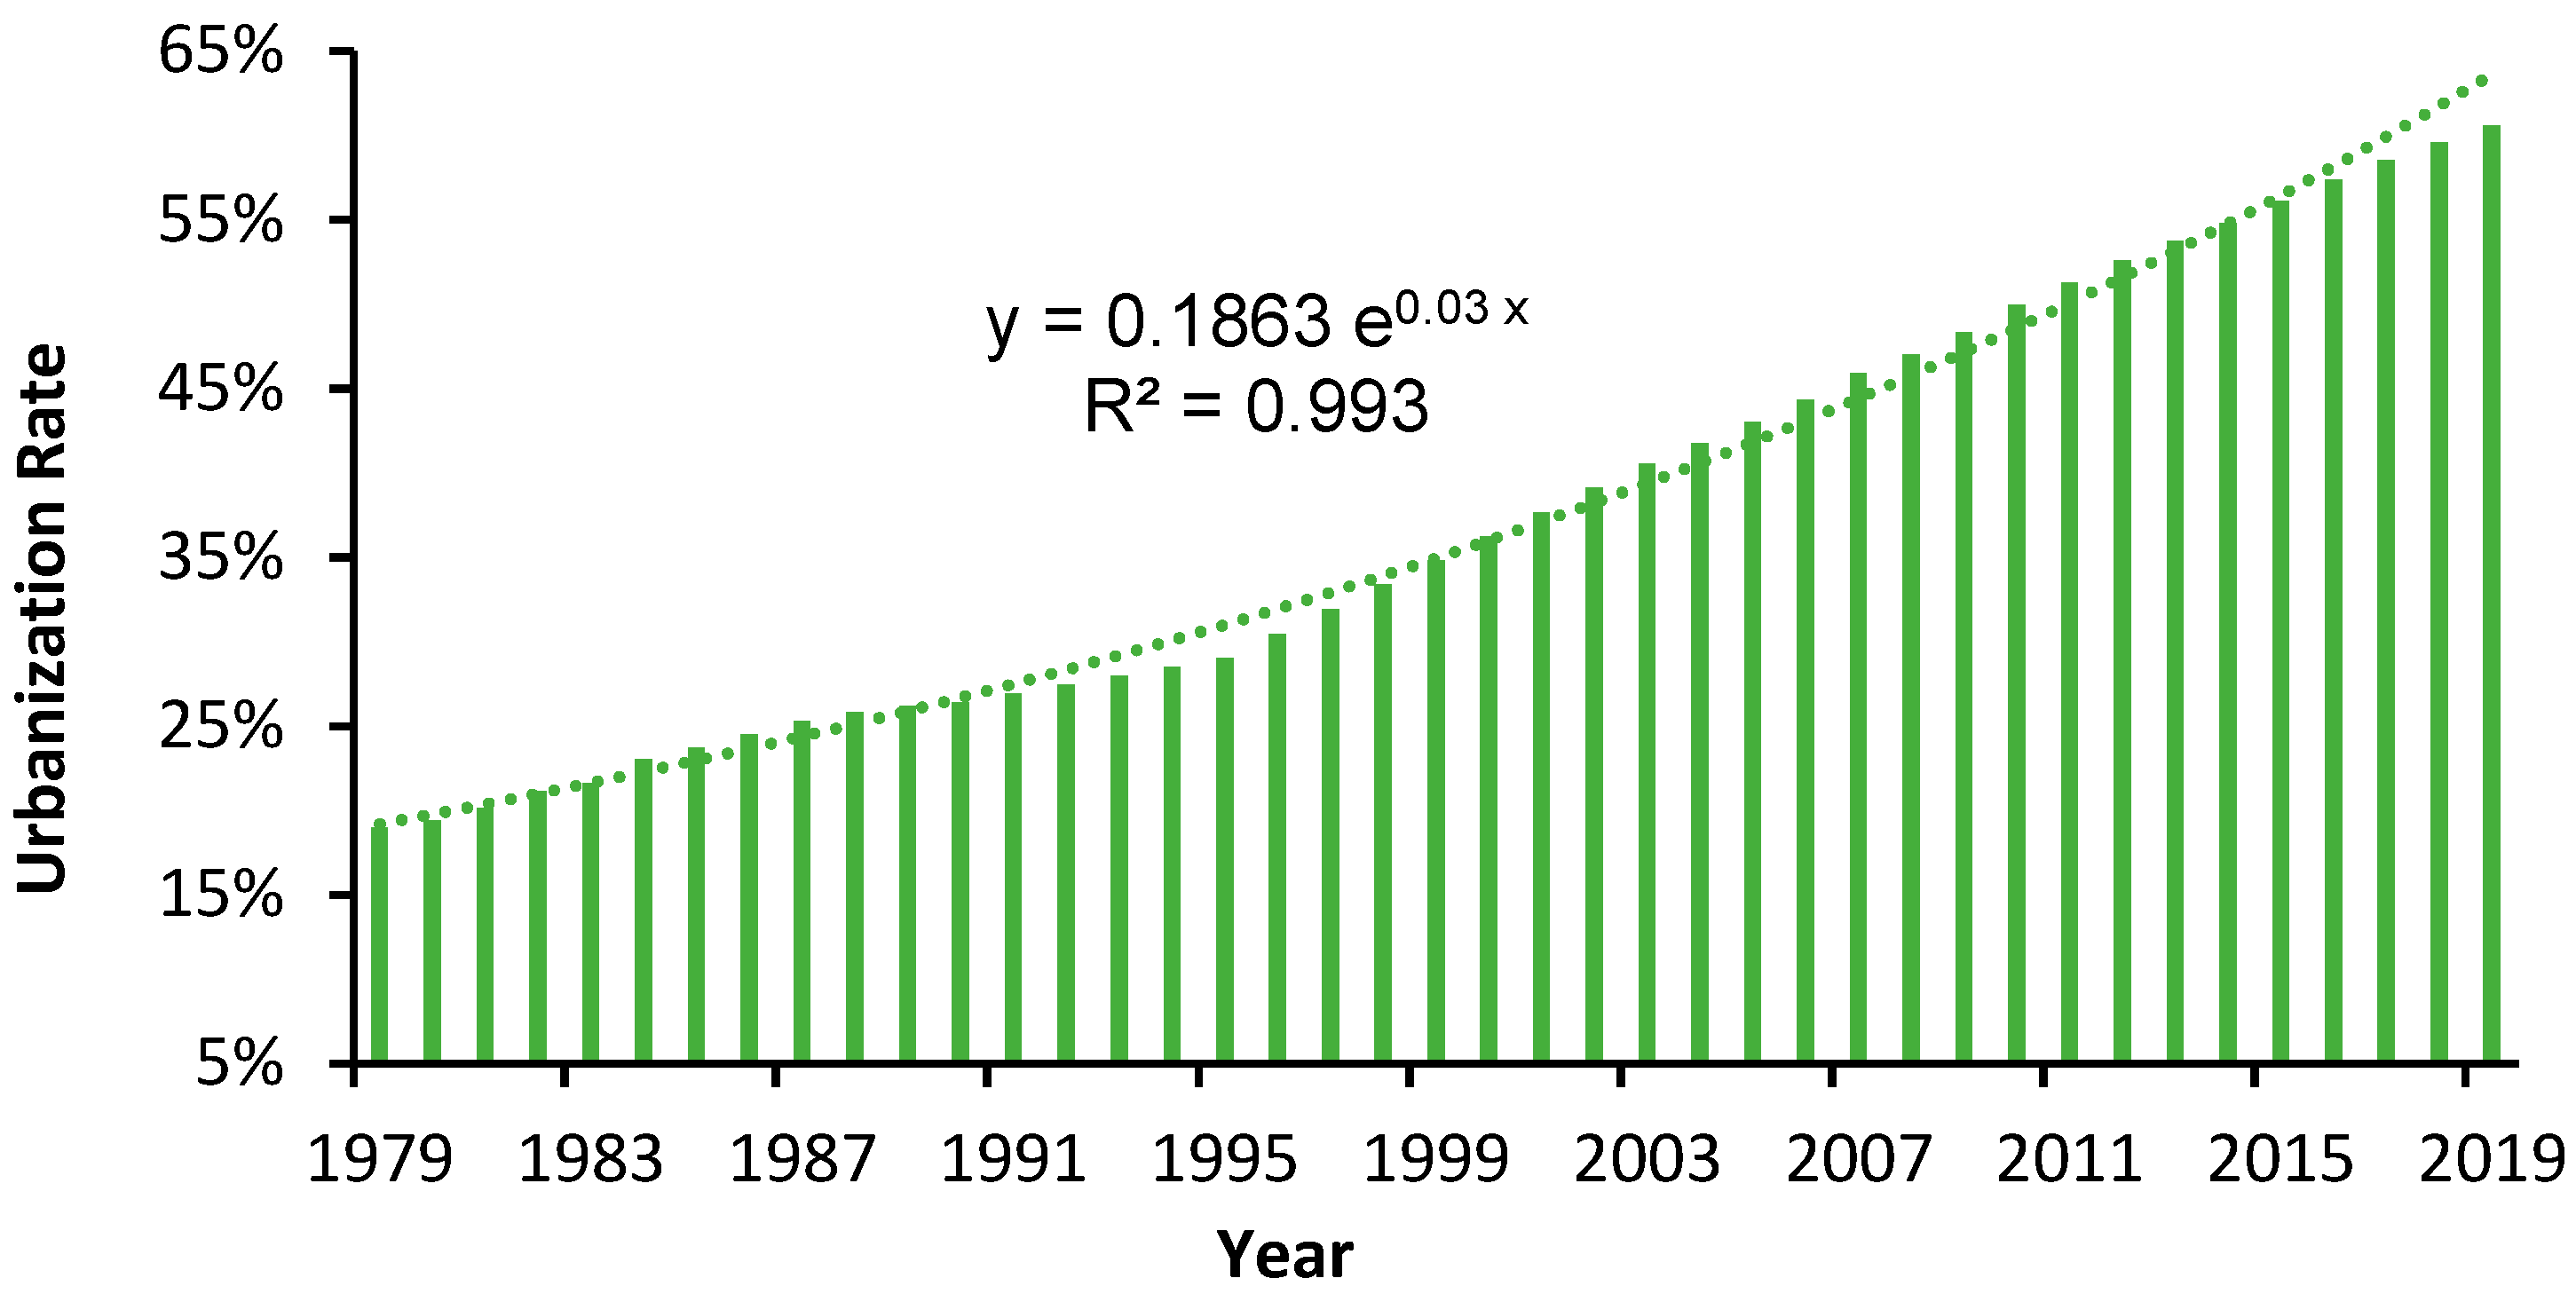
Figure 1. China’s urbanization rate from 1979 to 2019.
Remotesensing 13 02350 g001
Figure 2. Geolocation map of study sites (Beijing, Nanjing, Guangzhou, Haikou).
Remotesensing 13 02350 g002
Figure 3. Nighttime light images of Luojia 1-01 in (a) Guangzhou, (b) Nanjing, (c) Beijing, and (d) Haikou.
Remotesensing 13 02350 g003
Figure 4. Flowchart of methodology for the MNUACI model.
Remotesensing 13 02350 g004
Figure 5. Urban areas in the Temple of Heaven Park in Beijing, extracted from (a) Bands 5, 4, 2 composite image of Landsat 8, (b) normalized Night-Time Light (NTL), (c) Enhanced Vegetation Index Adjusted Nighttime Light Index (EANTLI), (d) Human Settlement Index (HSI), (e) Normalized Urban Areas Composite Index (NUACI), and (f) Modified Normalized Urban Areas Composite Index (MNUACI).
Remotesensing 13 02350 g005
Figure 6. Urban areas in the Hongcheng Lake in Haikou, extracted from (a) Bands 5, 4, 2 composite image of Landsat 8, (b) normalized Night-Time Light (NTL), (c) Enhanced Vegetation Index Adjusted Nighttime Light Index (EANTLI), (d) Human Settlement Index (HSI), (e) Normalized Urban Areas Composite Index (NUACI), and (f) Modified Normalized Urban Areas Composite Index (MNUACI).
Remotesensing 13 02350 g006
Figure 7. Night-Time Light (NTL), Normalized Urban Areas Composite Index (NUACI), and Modified Normalized Urban Areas Composite Index (MNUACI) along a longitudinal transection in Nanjing.
Remotesensing 13 02350 g007
Figure 8. Accuracy comparison of urban area extraction using an SVM method on the basis of the Modified Normalized Urban Areas Composite Index (MNUACI), Normalized Urban Areas Composite Index (NUACI), Human Settlement Index (HSI), EVI-Adjusted NTL Index (EANTLI), and Night-Time Light (NTL) in (a) Beijing, (b) Nanjing, (c) Guangzhou, and (d) Haikou.
Remotesensing 13 02350 g008
Figure 9. Landsat 8 false color composite image (a) and urban extraction results using an SVM method on the basis of the Modified Normalized Urban Areas Composite Index (MNUACI) (b), Normalized Urban Areas Composite Index (NUACI) (c), Human Settlement Index (HSI) (d), EVI-Adjusted NTL Index (EANTLI) (e), and Night-Time Light (NTL) (f) in the Tongzhou District, Beijing.
Remotesensing 13 02350 g009
Figure 10. The quadratic polynomial regression models established based on the Modified Normalized Urban Areas Composite Index (MNUACI) and impervious surface area (ISA) in (a) Beijing, (b) Nanjing, (c) Guangzhou, and (d) Haikou.
Remotesensing 13 02350 g010
Table 1. Research dataset description.
Image TypeAcquisition DateDay/NightSpatial Resolution (m)Path & RowLocation
Luojia 1-016 September 2018Night1301423 & 28Beijing
Luojia 1-0115 July 2018Night1308979 & 18Nanjing
Luojia 1-014 September 2018Night1306005 & 05Guangzhou
Luojia 1-015 September 2018Night1307644 & 05Haikou
Landsat 823 October 2017Day30123 & 32Beijing
Landsat 86 June 2018Day30120 & 38Nanjing
Landsat 823 October 2017Day30122 & 44Guangzhou
Landsat 817 May 2018Day30124 & 46Haikou
Table 2. Accuracy comparison among various methods of urban area extraction methods using different nighttime light indexes in Beijing.
MethodMNUACINUACIHSI
OAKCJSCOAKCJSCOAKCJSC
DL91.31%0.8260.84375.30%0.5120.51888.93%0.7790.806
GA92.33%0.8470.86179.56%0.5950.60491.31%0.8270.847
FCM92.50%0.8500.86488.59%0.7730.78190.12%0.8030.825
SVM93.36%0.8670.88389.44%0.7900.79792.67%0.8530.870
MethodEANTLINTL
OAKCJSCOAKCJSC
DL56.56%0.1490.15665.76%0.3260.347
GA64.74%0.3060.31973.59%0.4770.509
FCM80.07%0.6040.63279.90%0.5990.649
SVM84.50%0.6910.72281.43%0.6280.696
OA: Overall Accuracy; KC: Kappa Coefficient; JSC: Jaccard Similarity Index.
Table 3. Accuracy comparison among various methods of urban area extraction methods using different nighttime light indexes in Nanjing.
MethodMNUACINUACIHSI
OAKCJSCOAKCJSCOAKCJSC
DL94.71%0.8930.88884.13%0.6750.66283.89%0.6790.718
GA93.99%0.8790.87884.62%0.6850.67283.17%0.6630.702
FCM87.02%0.7430.78093.03%0.8590.85276.92%0.5490.666
SVM94.95%0.8990.89893.03%0.8590.85485.34%0.7090.750
MethodEANTLINTL
OAKCJSCOAKCJSC
DL72.60%0.4300.41576.44%0.5130.497
GA65.87%0.2840.27296.39%0.9270.925
FCM90.14%0.8000.79187.02%0.7430.780
SVM89.66%0.7900.78189.90%0.7950.791
OA: Overall Accuracy; KC: Kappa Coefficient; JSC: Jaccard Similarity Index.
Table 4. Accuracy comparison among various methods of urban area extraction methods using different nighttime light indexes in Guangzhou.
MethodMNUACINUACIHSI
OAKCJSCOAKCJSCOAKCJSC
DL86.22%0.7290.75970.78%0.4370.49469.12%0.3920.531
GA94.06%0.8790.90172.92%0.4850.52783.14%0.6530.748
FCM93.11%0.8600.88591.21%0.8250.84785.27%0.6920.787
SVM94.06%0.8790.90193.59%0.8700.89085.51%0.6980.787
MethodEANTLINTL
OAKCJSCOAKCJSC
DL57.01%0.2130.25564.37%0.3320.395
GA83.61%0.6700.74071.26%0.4470.524
FCM72.21%0.4650.53880.05%0.5960.697
SVM76.72%0.5450.61679.57%0.5880.687
OA: Overall Accuracy; KC: Kappa Coefficient; JSC: Jaccard Similarity Index.
Table 5. Accuracy comparison among various methods of urban area extraction methods using different nighttime light indexes in Haikou.
MethodMNUACINUACIHSI
OAKCJSCOAKCJSCOAKCJSC
DL76.74%0.5370.58577.52%0.5510.62267.70%0.3580.439
GA87.08%0.7410.78378.81%0.5770.64070.54%0.4110.553
FCM86.56%0.7310.77780.36%0.6080.66880.36%0.6080.668
SVM87.60%0.7520.78983.20%0.6640.72575.97%0.5170.658
MethodEANTLINTL
OAKCJSCOAKCJSC
DL71.06%0.4240.51367.96%0.3630.451
GA57.36%0.1590.19166.67%0.3380.429
FCM67.70%0.3590.41680.36%0.6080.668
SVM73.39%0.4690.56476.23%0.5240.633
OA: Overall Accuracy; KC: Kappa Coefficient; JSC: Jaccard Similarity Index.
Table 6. Correlation coefficients and RMSE of regression models for estimating impervious surface areas.
CitiesMNUACINUACIHSIEANTLINTL
R2RMSER2RMSER2RMSER2RMSER2RMSE
Beijing0.780.120.390.200.580.170.190.240.150.24
Nanjing0.730.110.510.150.390.170.320.180.330.18
Guangzhou0.720.140.520.180.510.180.160.240.230.23
Haikou0.750.130.520.180.270.220.150.240.240.23
Publisher’s Note: MDPI stays neutral with regard to jurisdictional claims in published maps and institutional affiliations.