
Comparison of Aerosol Optical Depth from MODIS Product Collection 6.1 and AERONET in the Western United States


Abstract
:1. Introduction
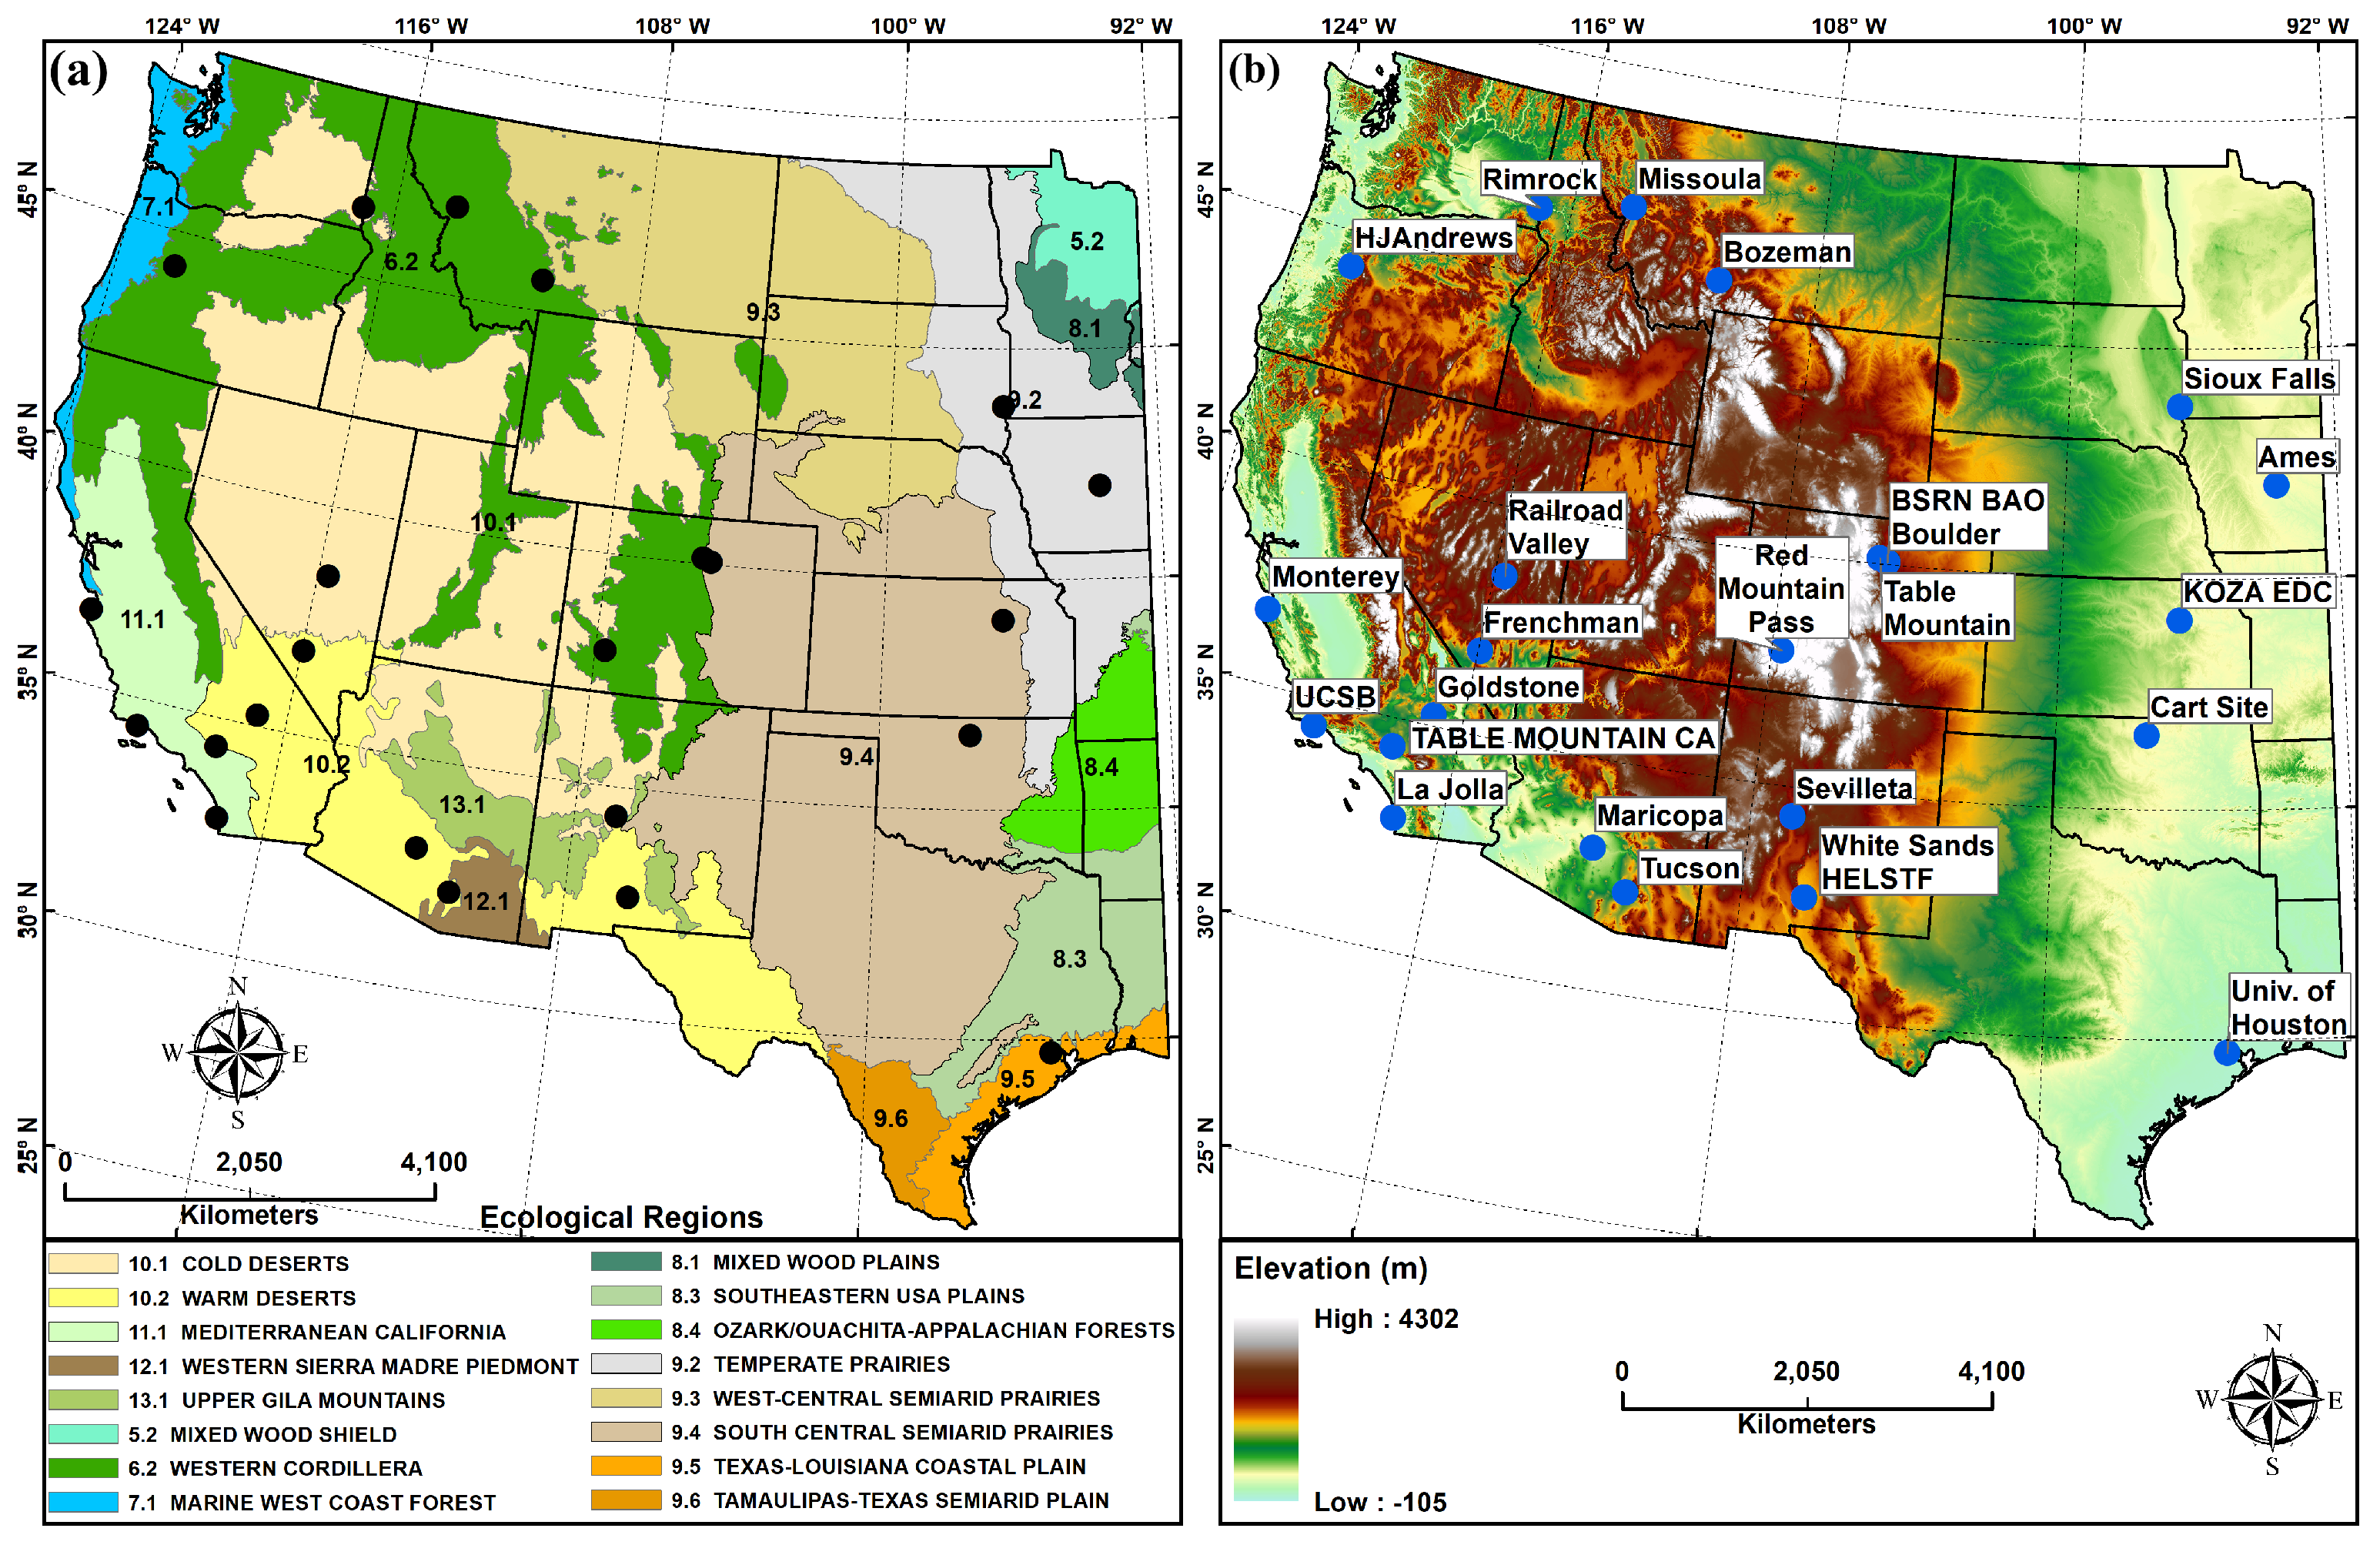
2. Study Area
3. Data
3.1. AERONET
3.2. MODIS
4. Methods
4.1. Assessment of the Number of Pixels of MODIS DB AOD Retrieval
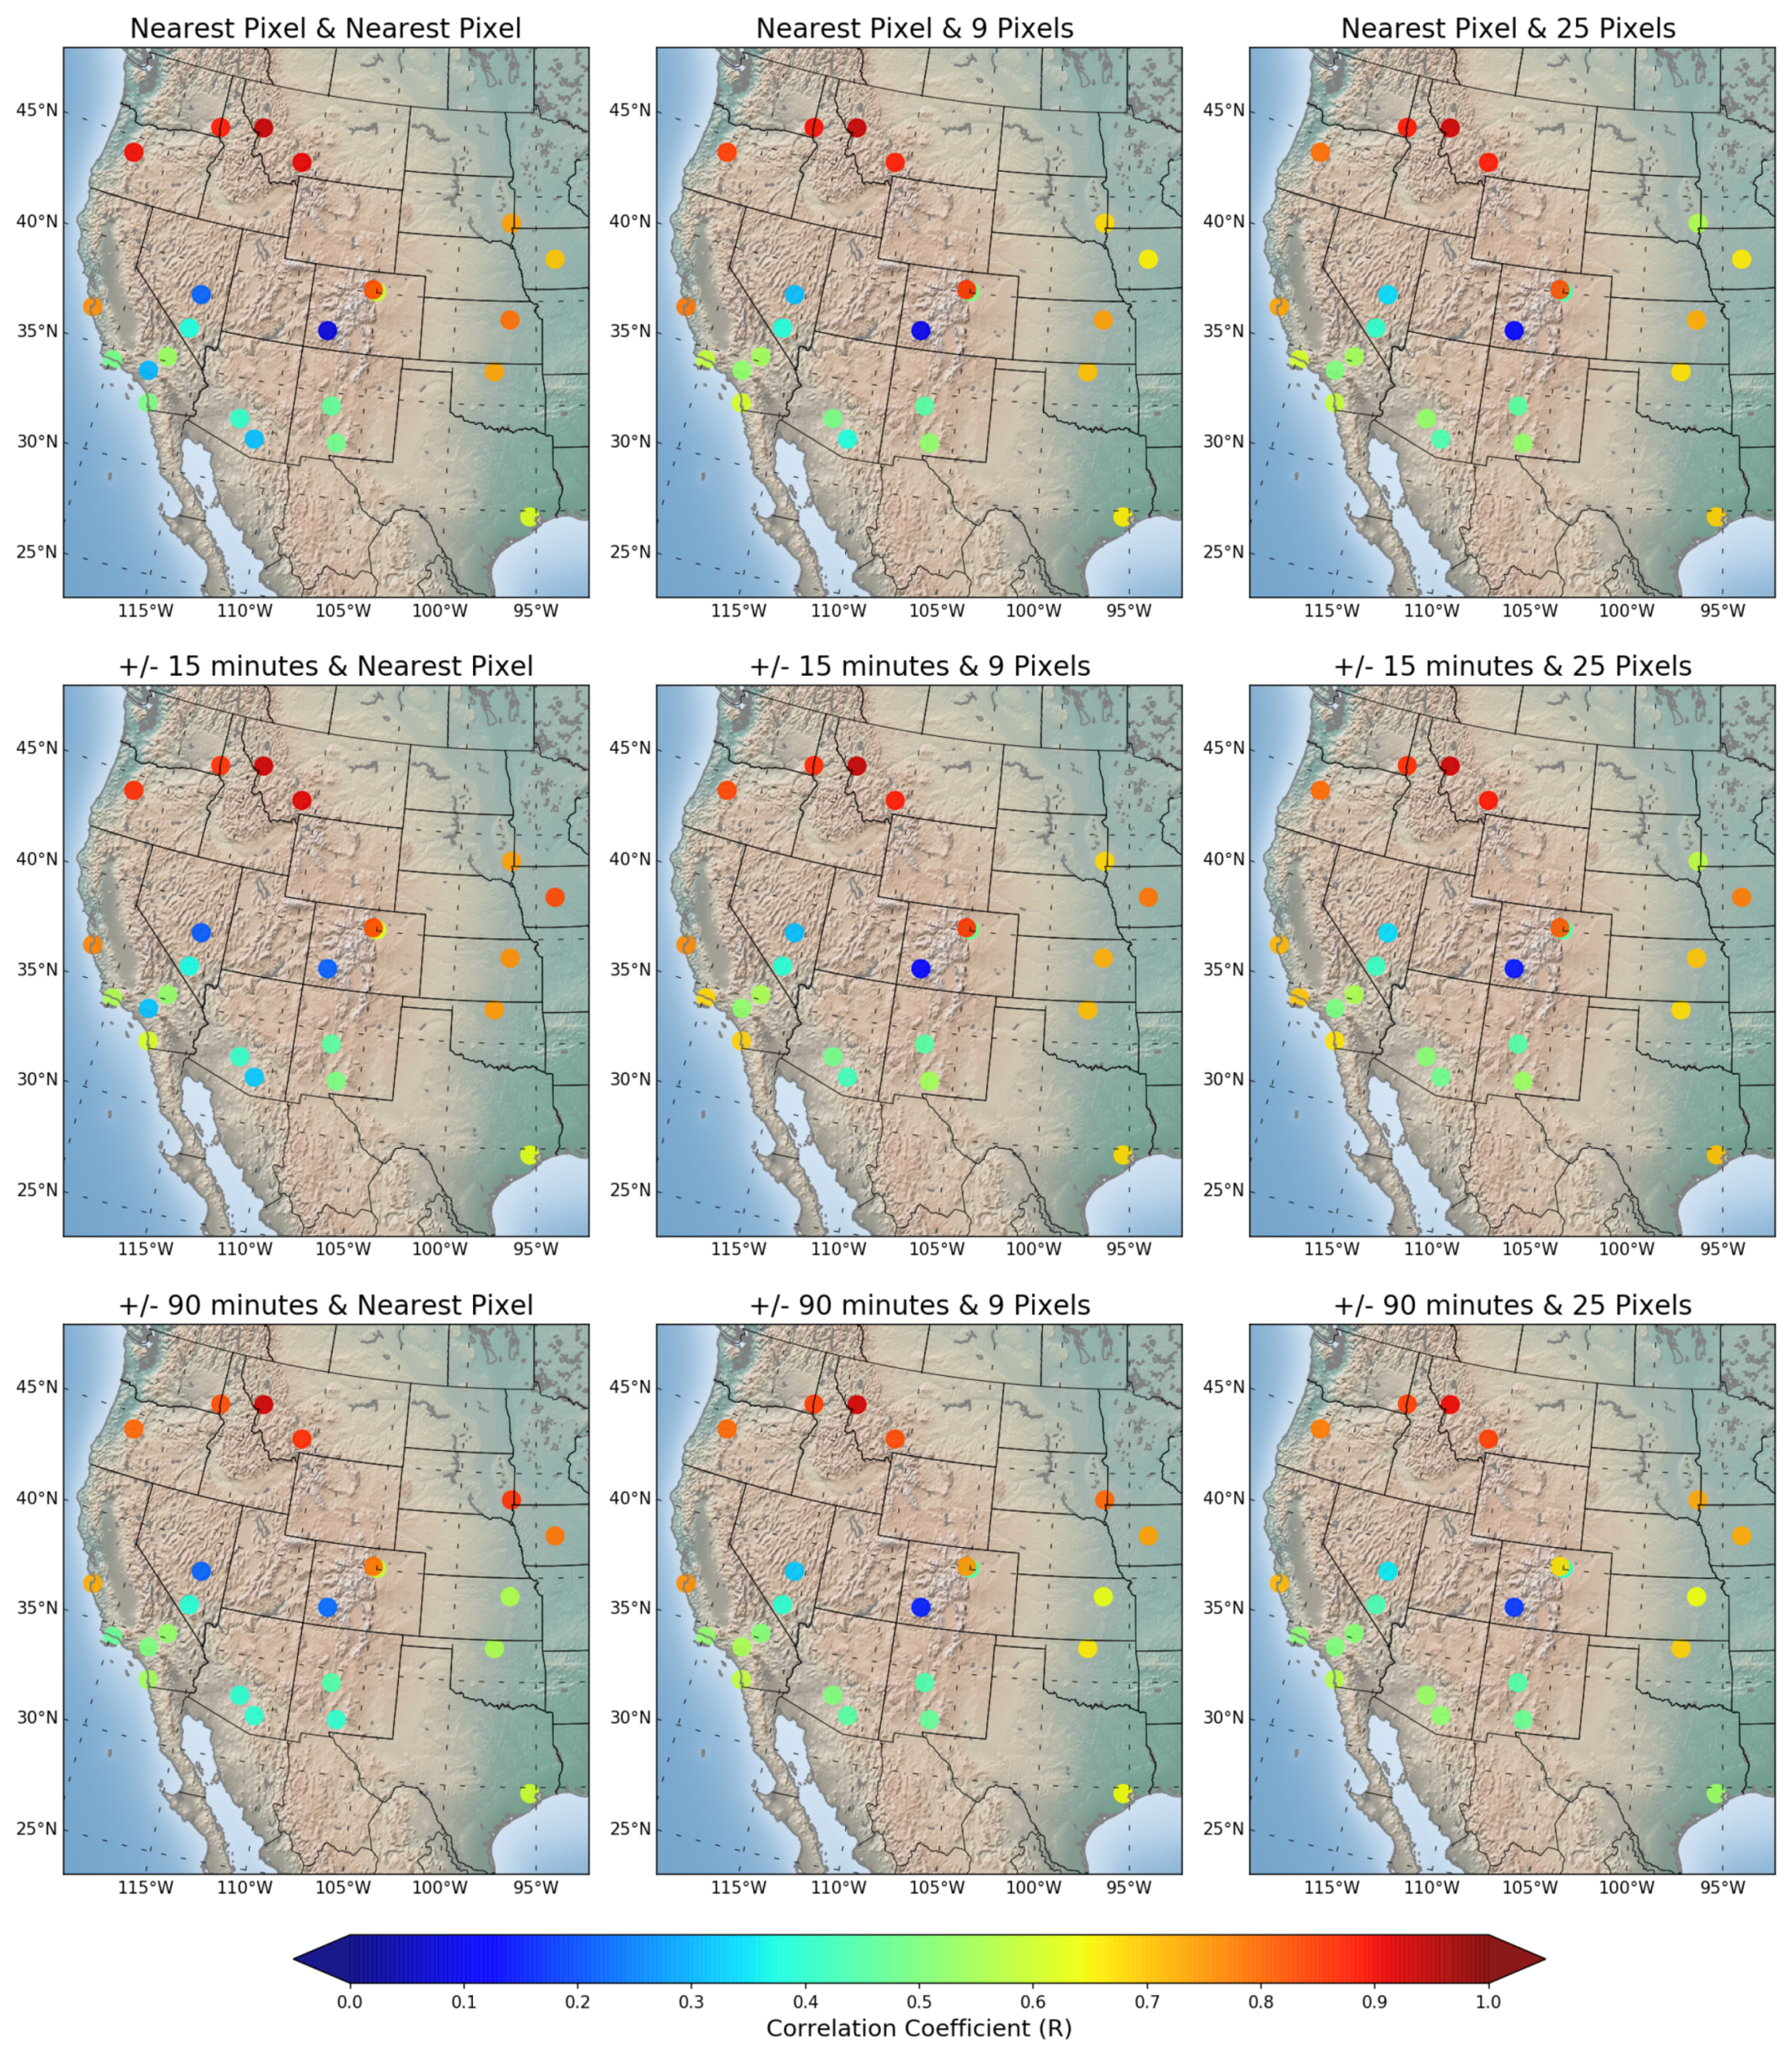
4.2. Comparison of MODIS and AERONET AOD
5. Results
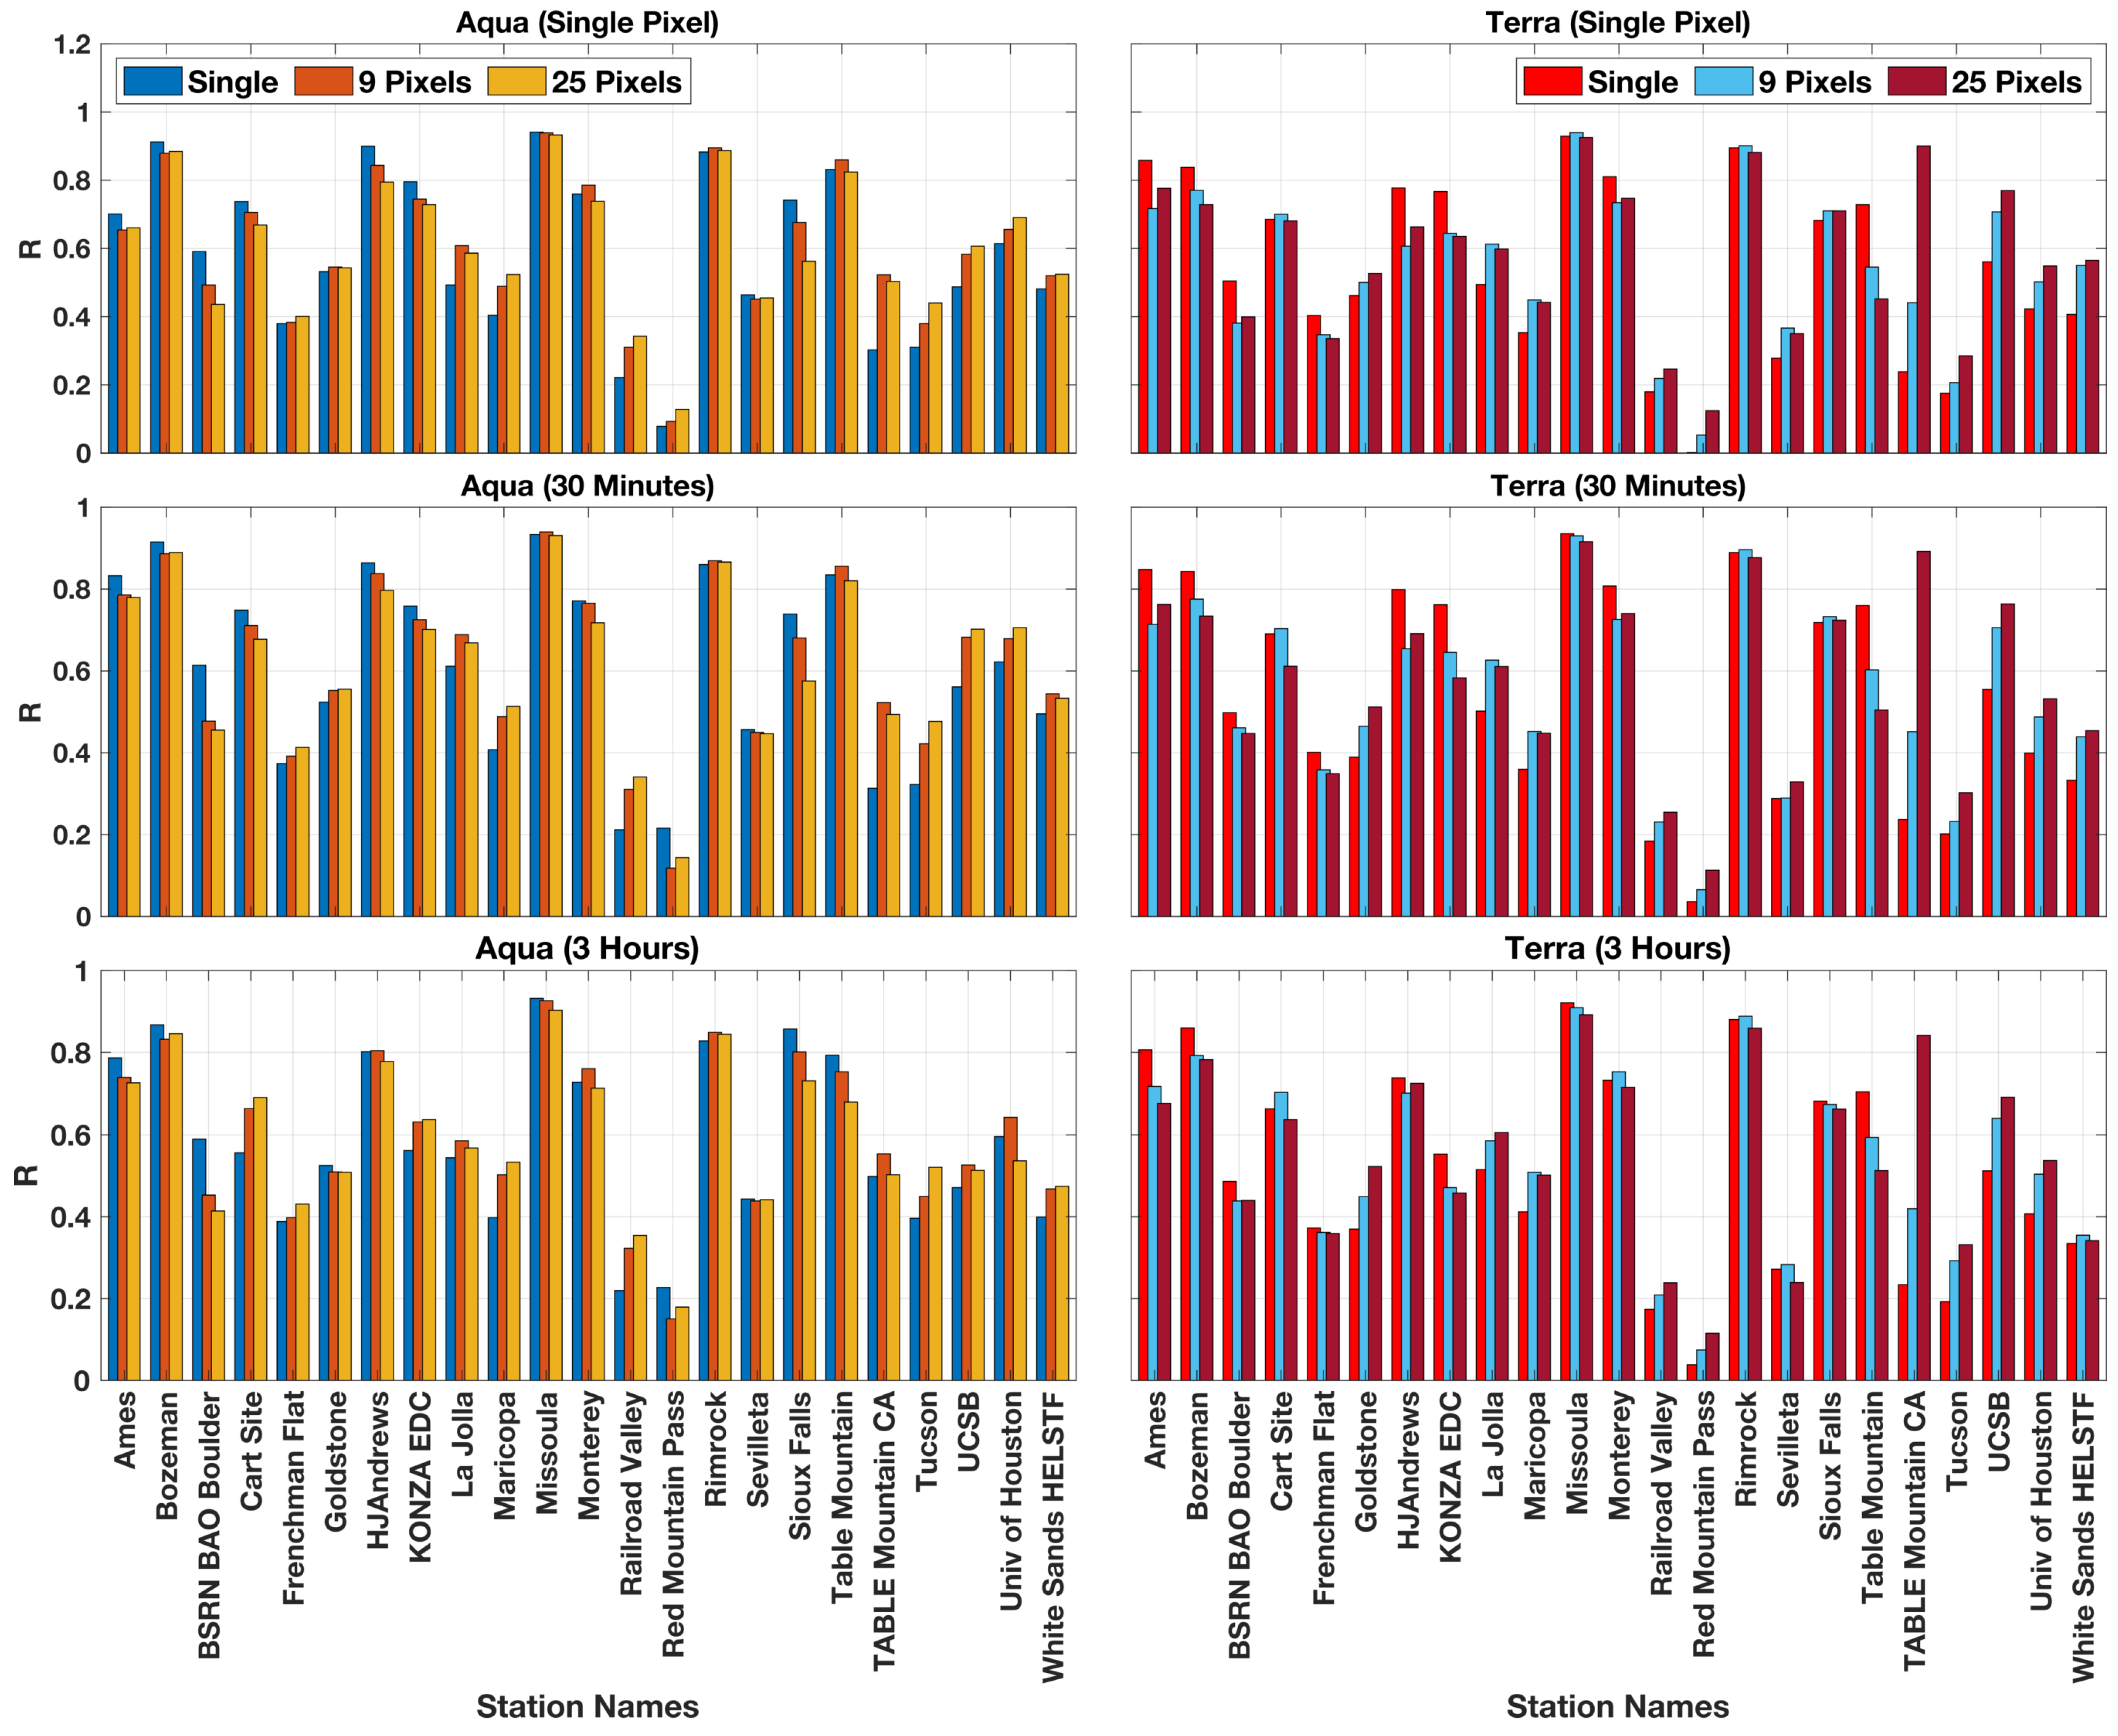
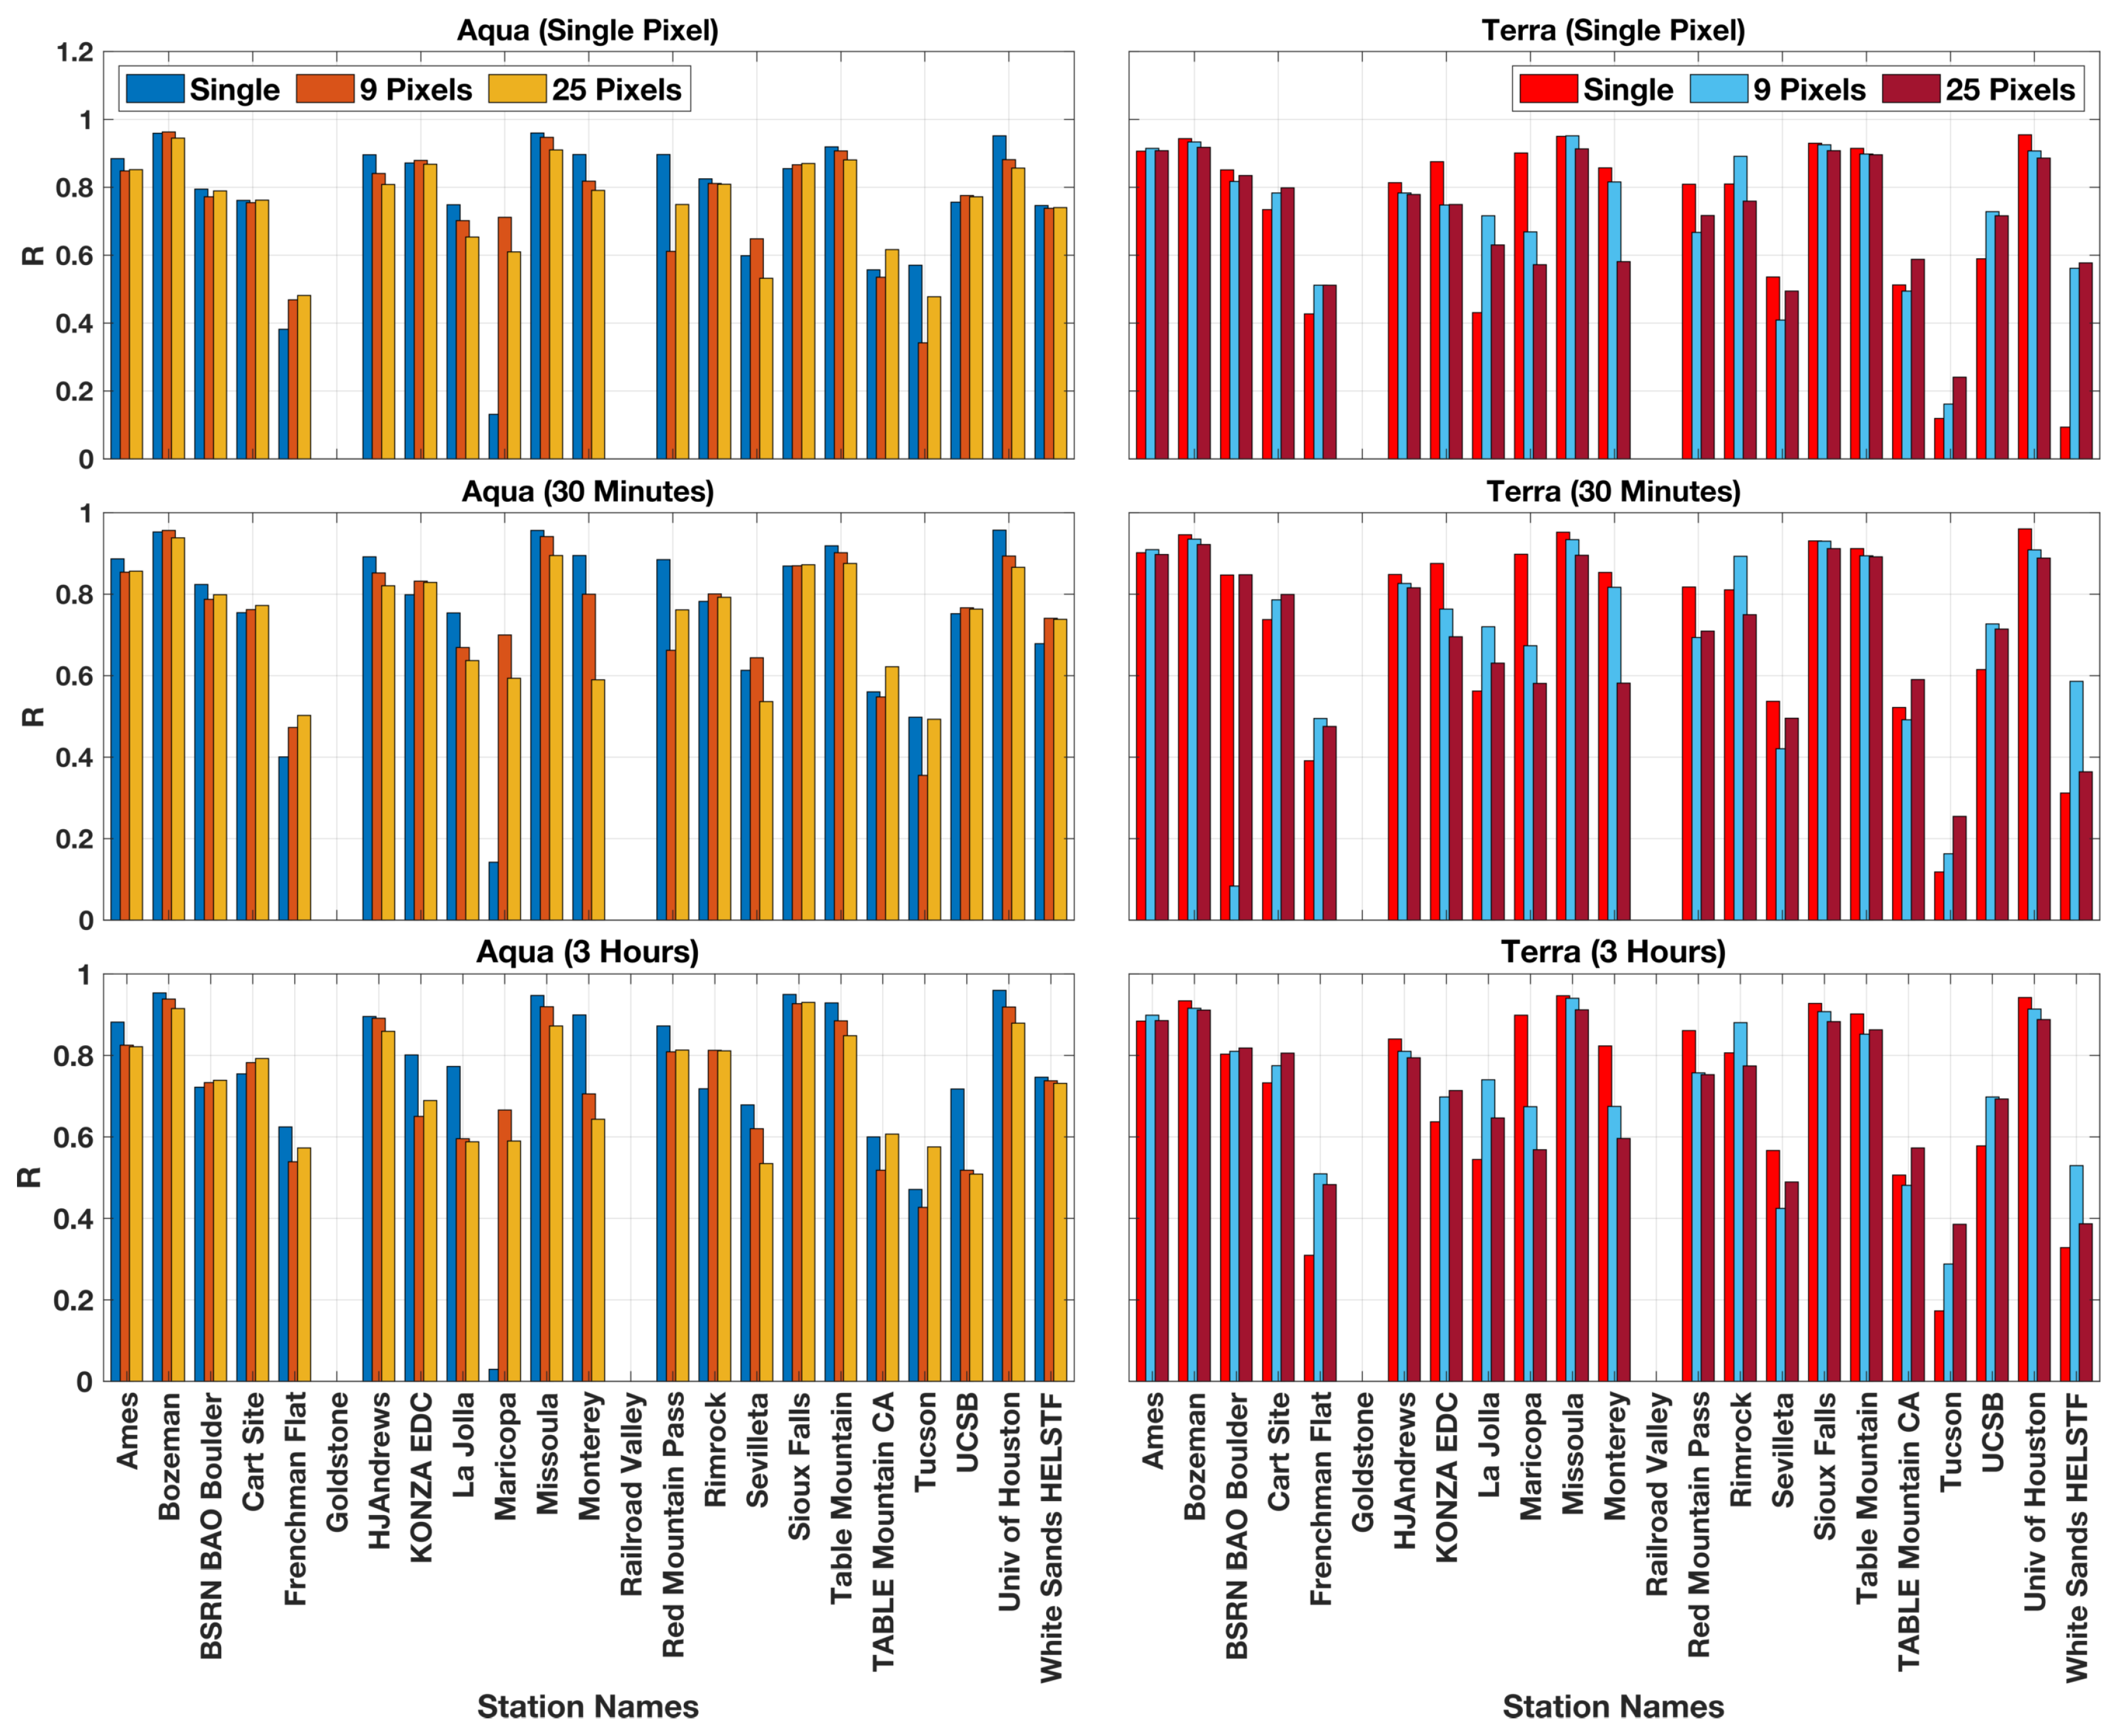
5.1. Assessment of the Number of Pixels of MODIS DB AOD Retrievals
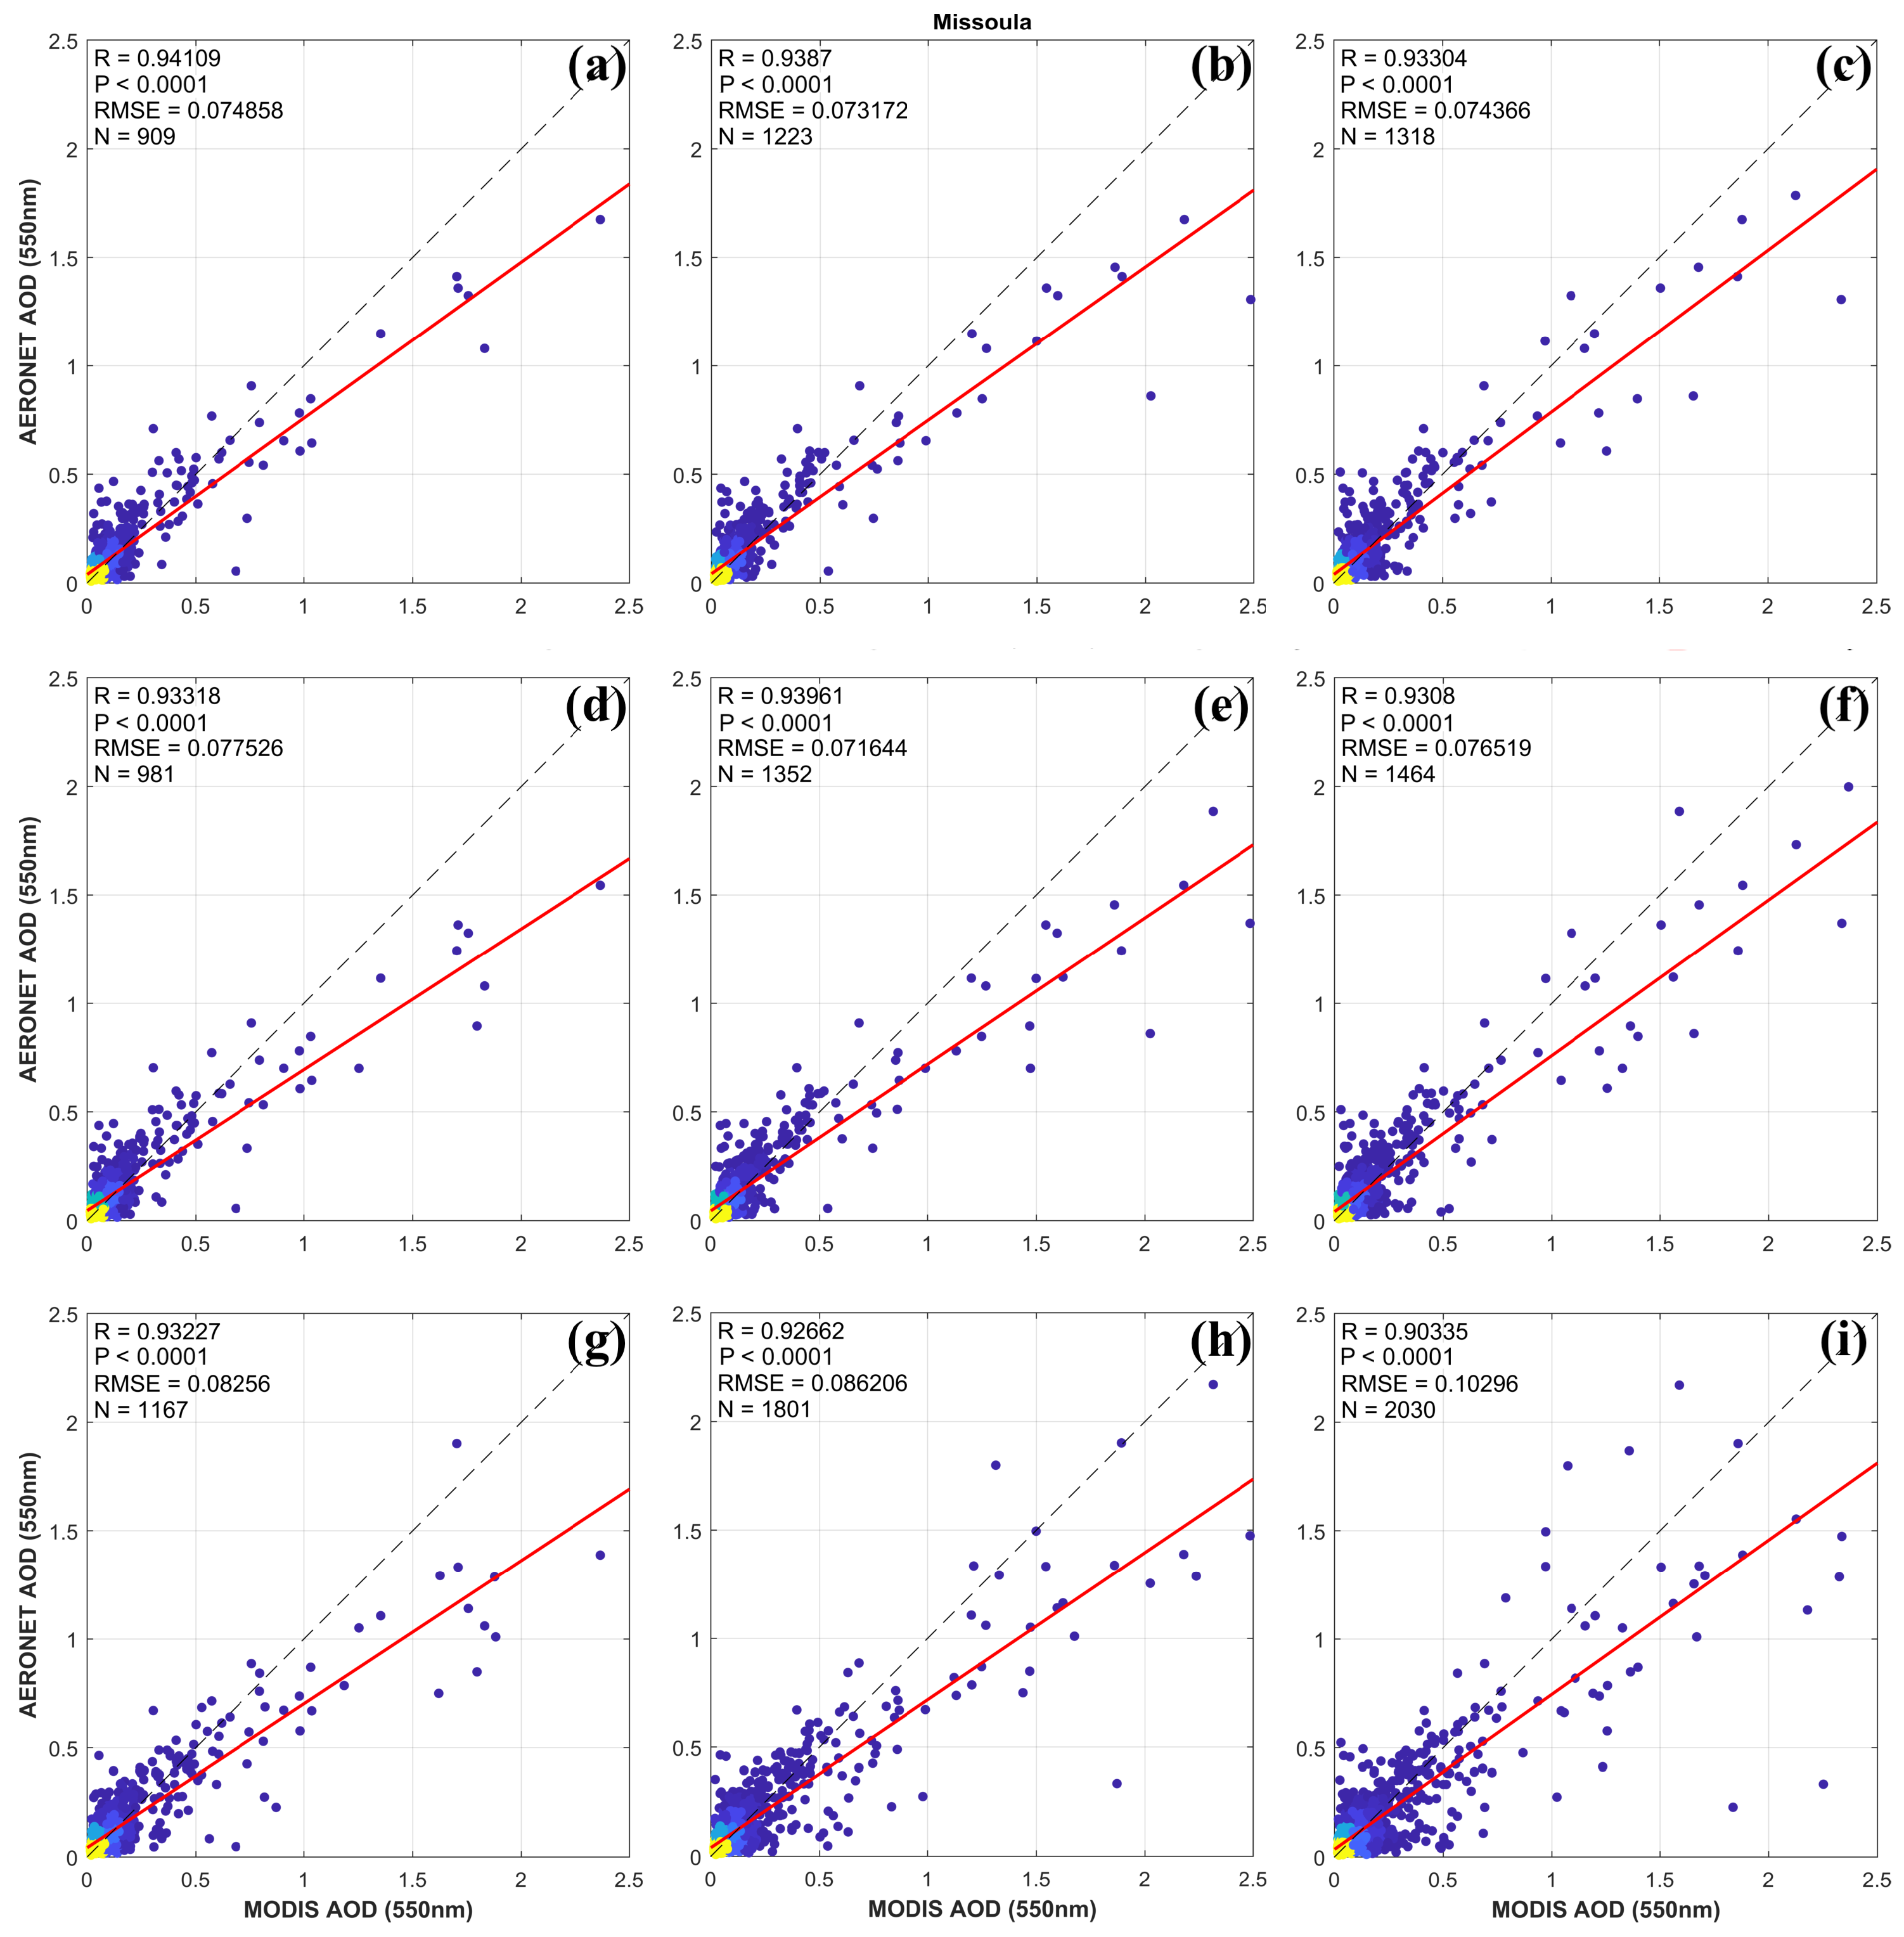
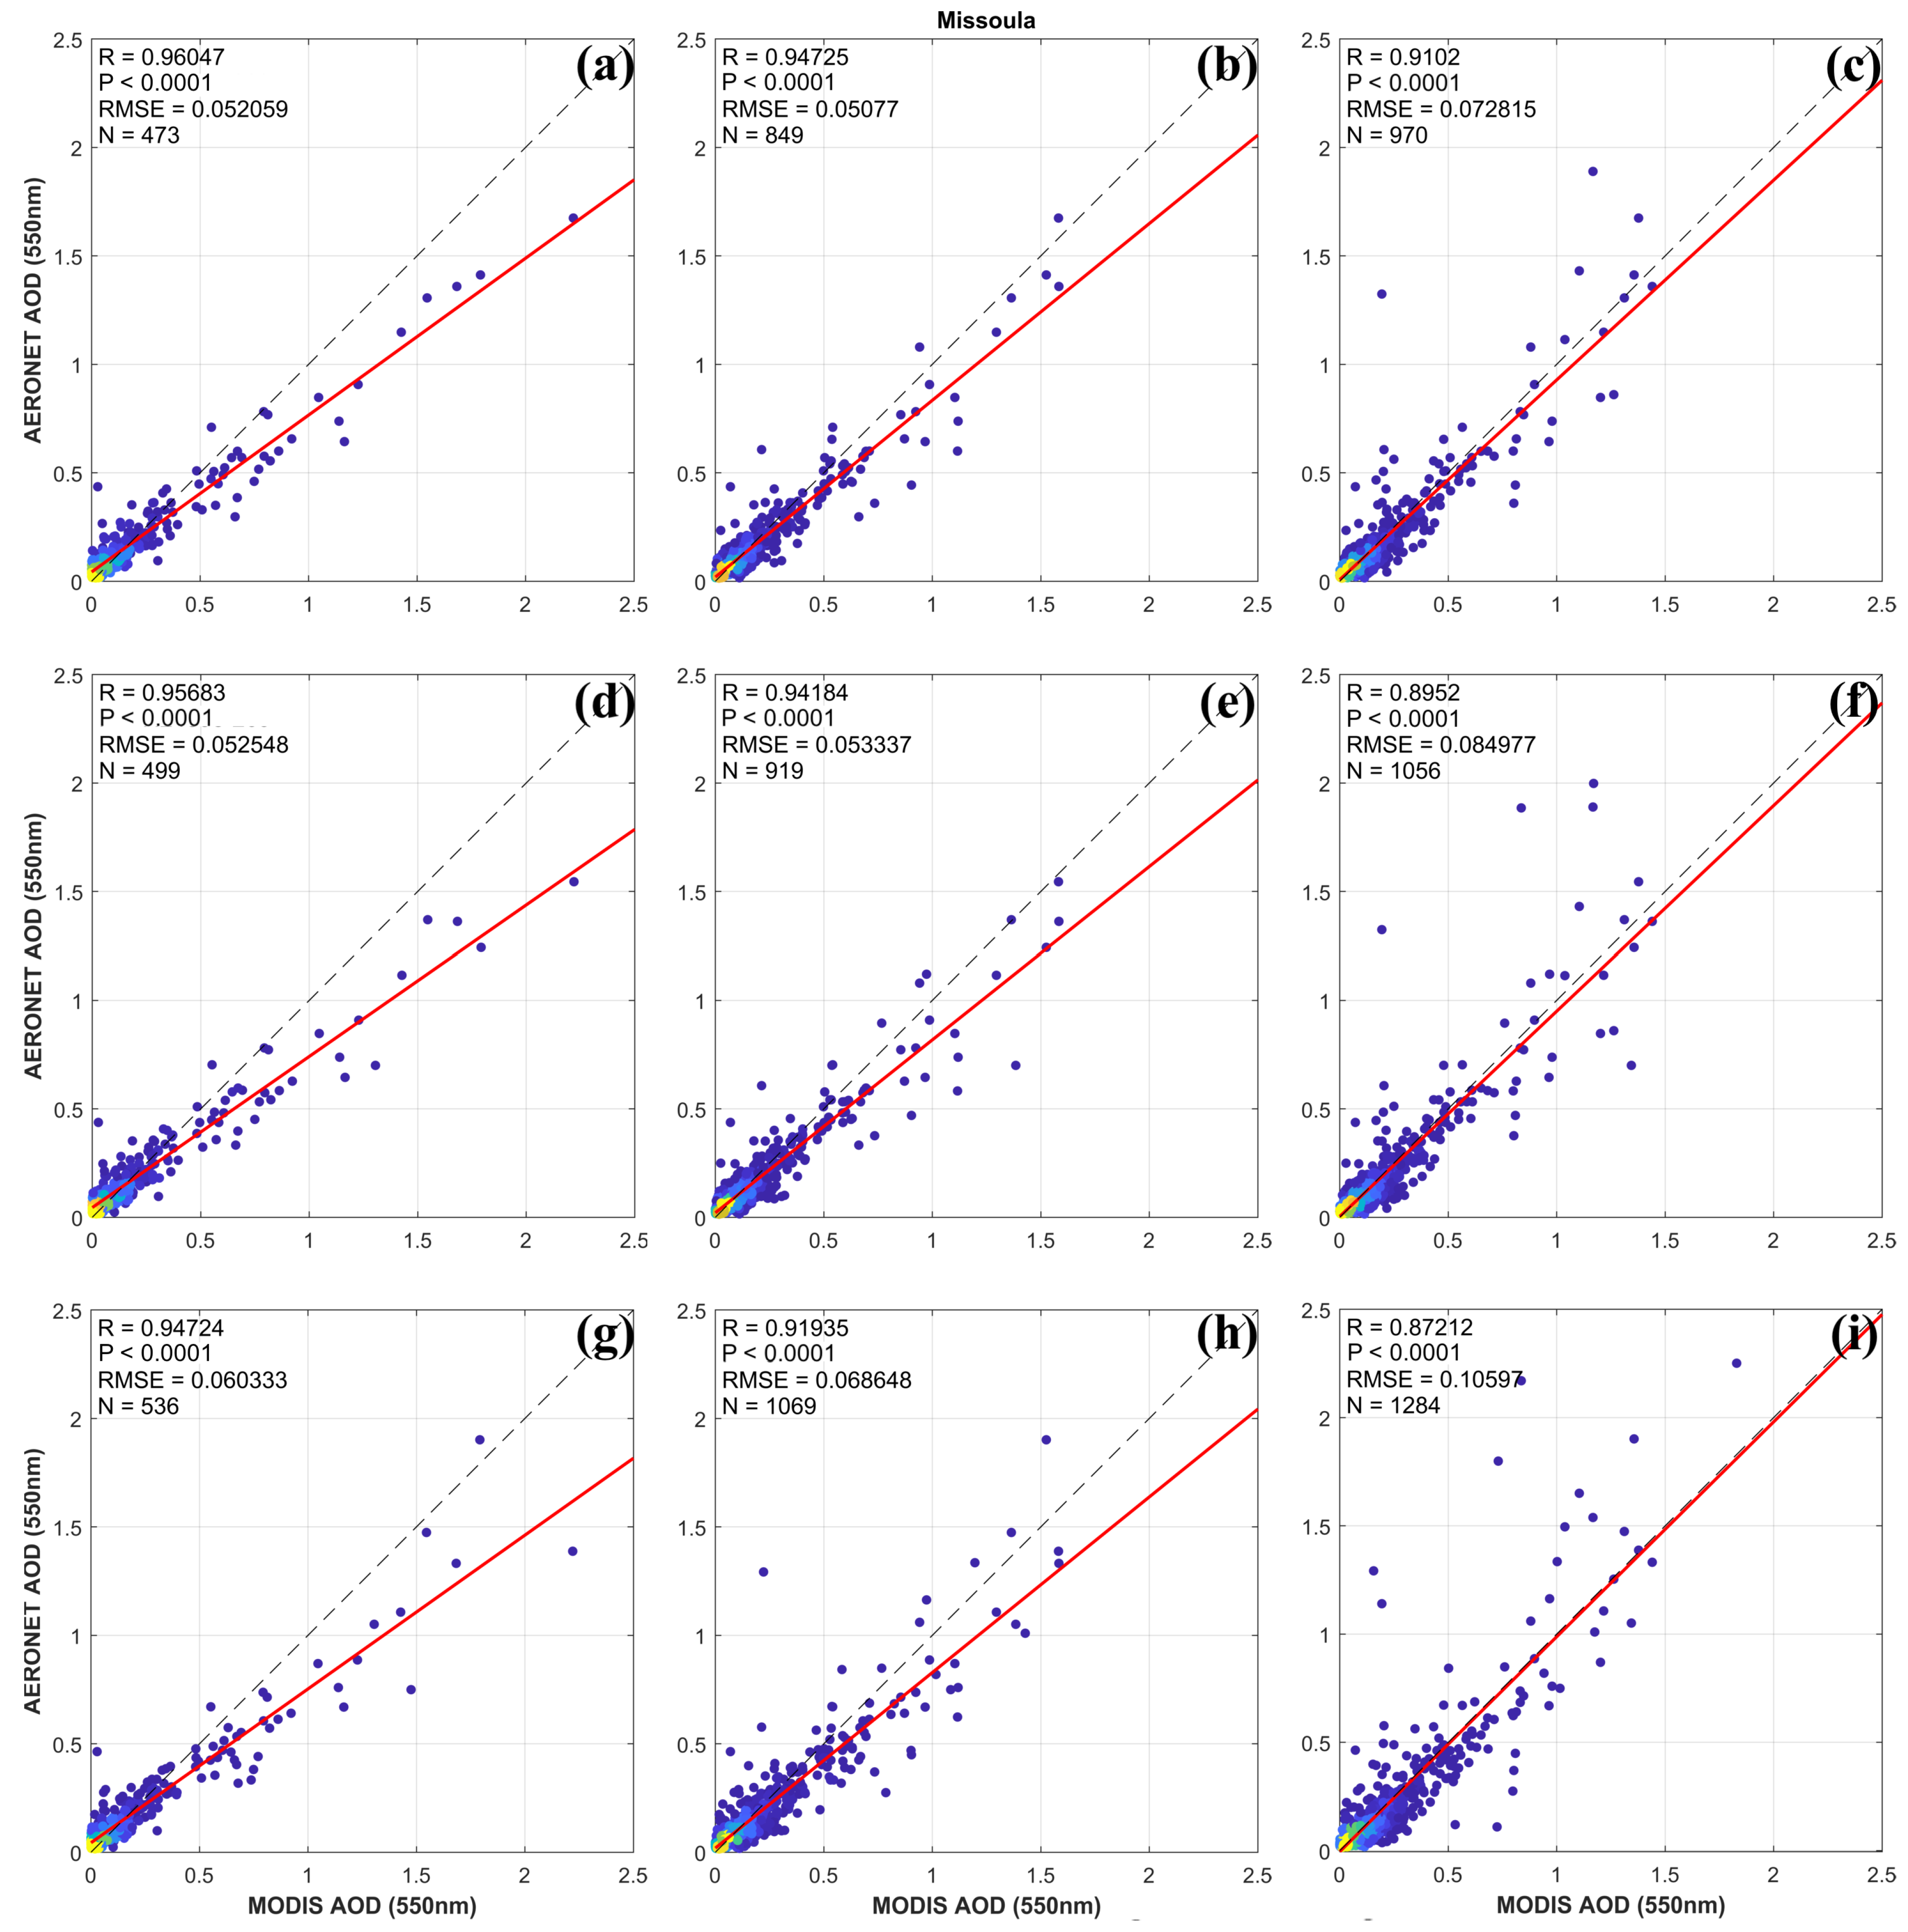
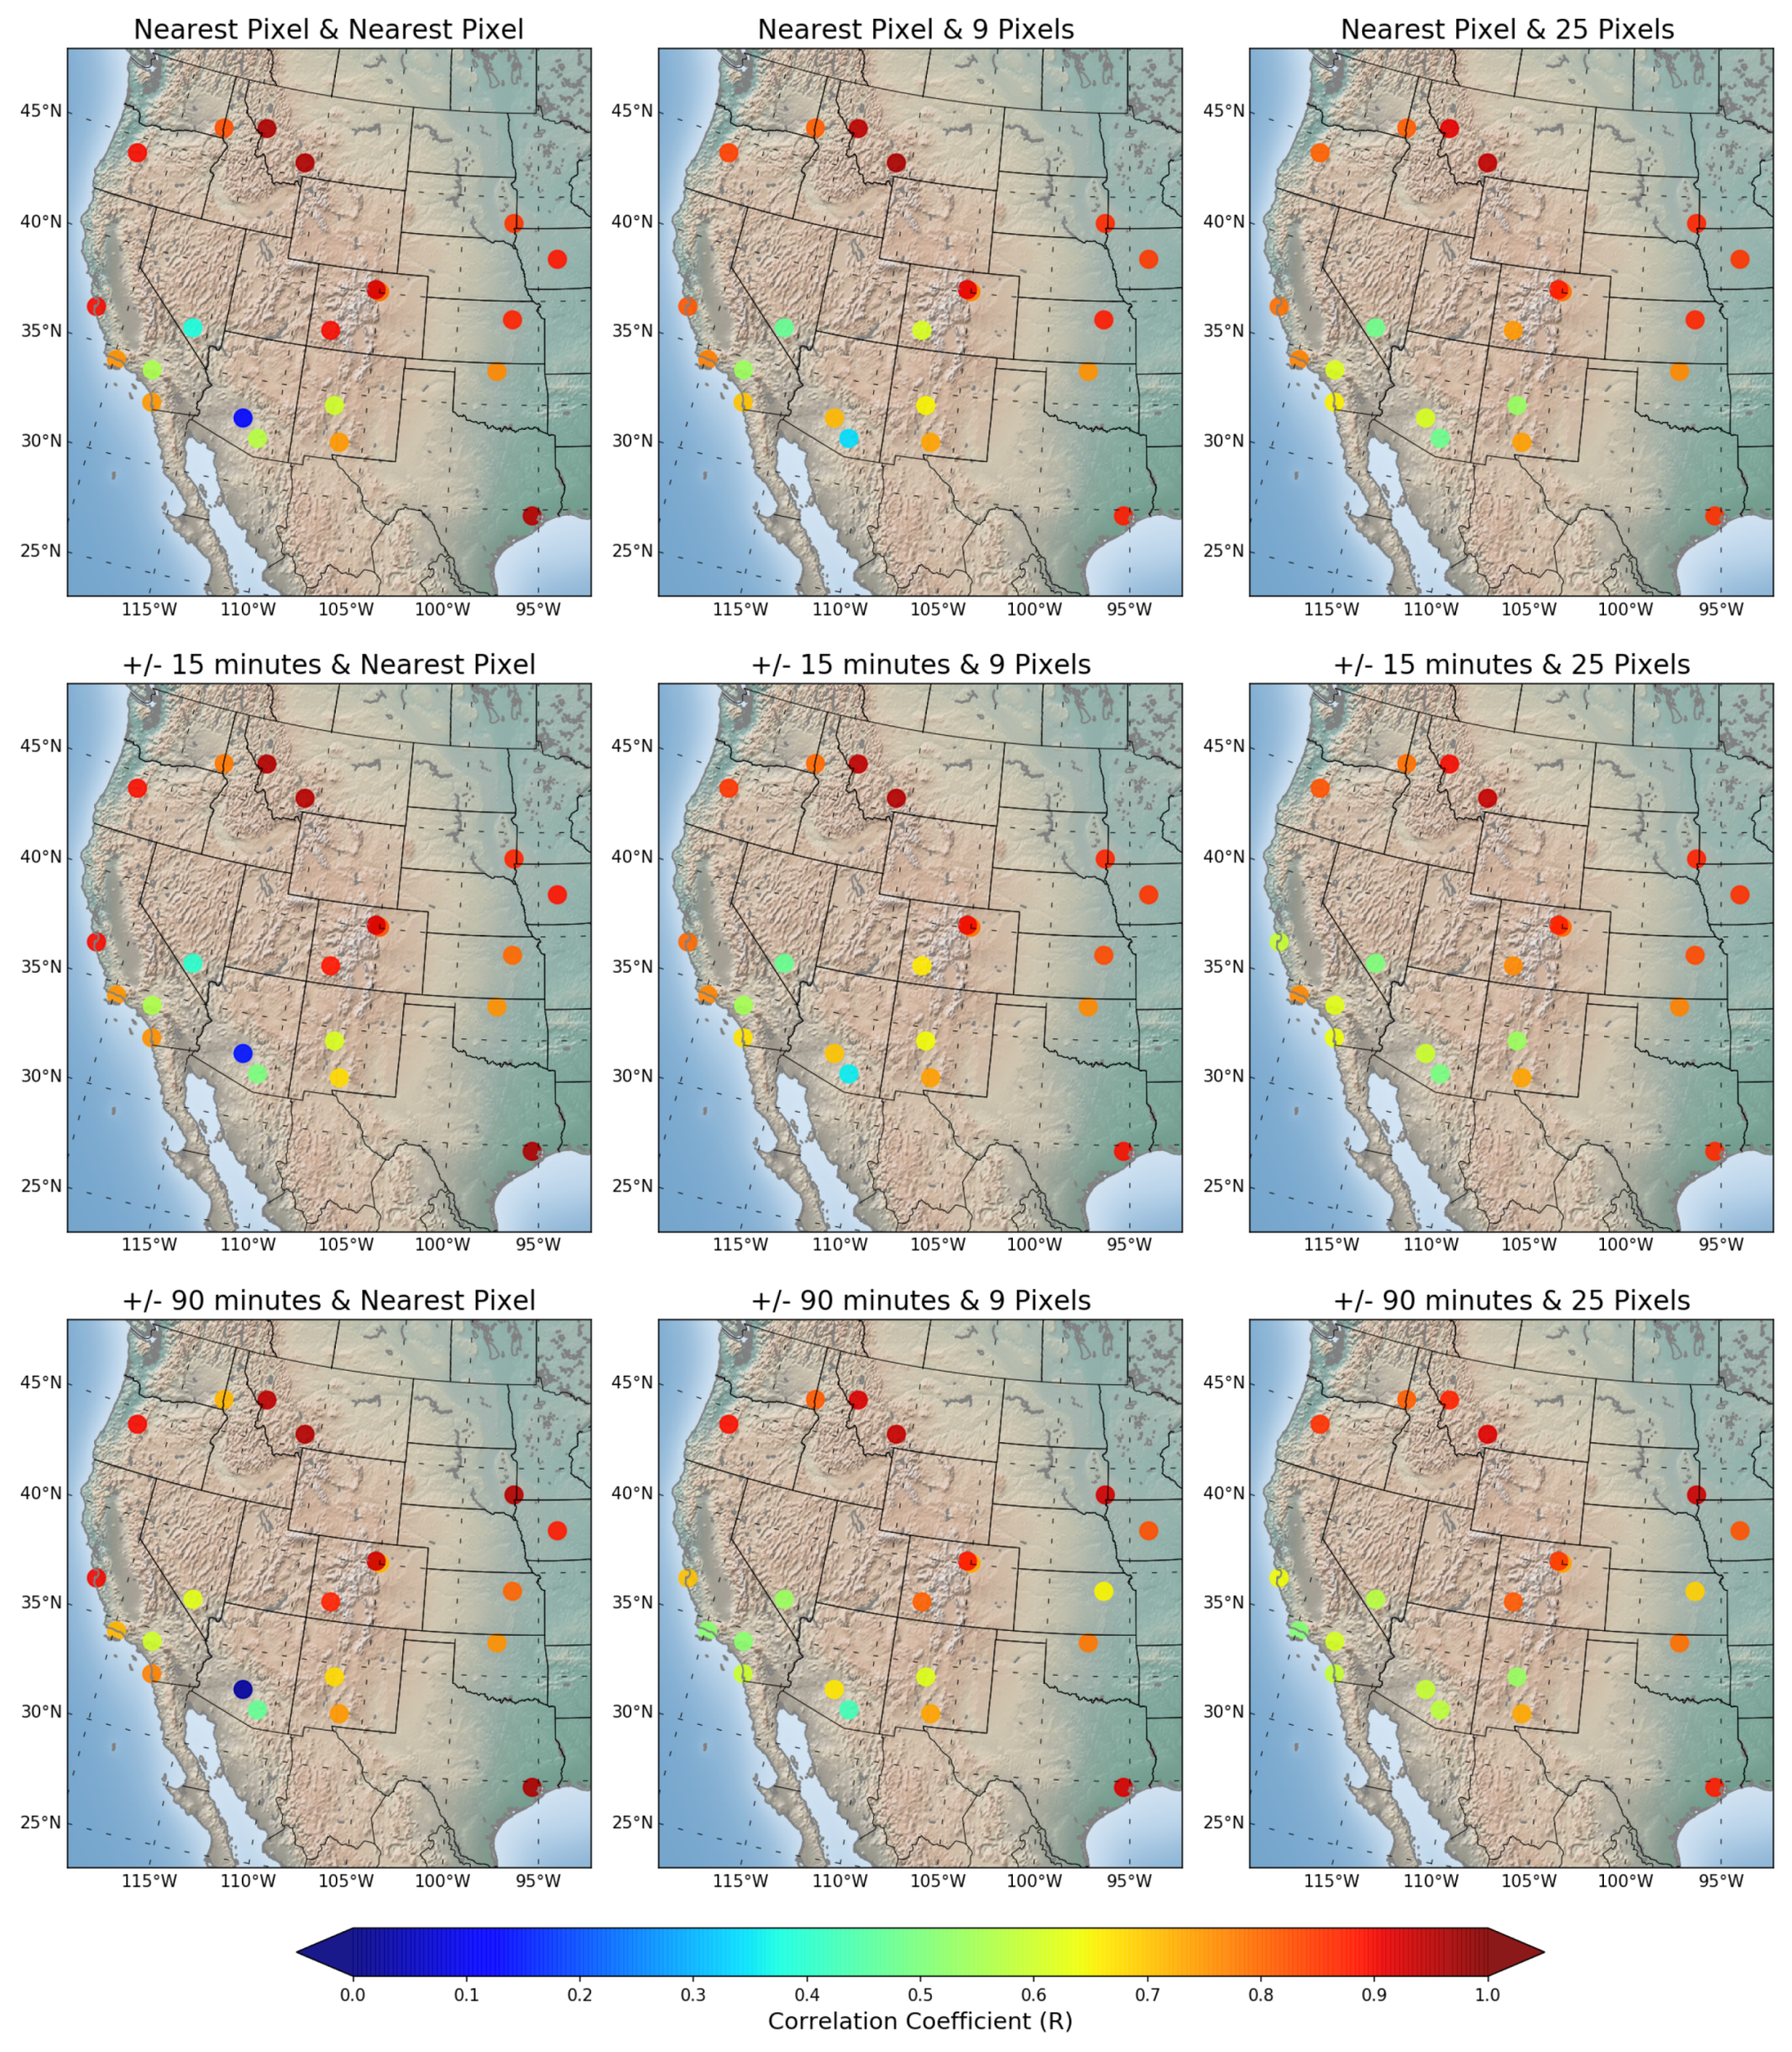
5.2. Evaluation of MODIS AOD Using AERONET AOD
6. Discussion
7. Conclusions
Author Contributions
Funding
Institutional Review Board Statement
Informed Consent Statement
Data Availability Statement
Acknowledgments
Conflicts of Interest
Abbreviations
| AOD | Aerosol Optical Depth |
| AERONET | Aerosol Robotic Network |
| MODIS | Moderate Resolution Imaging SpectroRadiometer |
| DB | Deep Blue |
| DT | Dark Target |
| GOCI | Geostationary Ocean Color Imager |
| MISR | Multi-angle Imaging SpectroRadiometer |
| SeaWiFS | Sea-viewing Wide Field-of-view Sensor |
| OMI | Ozone Monitoring Instrument |
| USGS | United States Geological Survey |
| NASA | National Aeronautics and Space Administration |
| USDA | United States Department of Agriculture |
| GOES | Geostationary Operational Environmental |
| ABI | Advanced Baseline Imager |
Appendix A

| Site ID | Nearest in Time | 30 Minutes Averaging Domain | 3 Hours Averaging Domain | |||||||||||||||
|---|---|---|---|---|---|---|---|---|---|---|---|---|---|---|---|---|---|---|
| Single | 9 Pixels | 25 Pixels | Single | 9 Pixels | 25 Pixels | Single | 9 Pixels | 25 Pixels | ||||||||||
| Aqua | Terra | Aqua | Terra | Aqua | Terra | Aqua | Terra | Aqua | Terra | Aqua | Terra | Aqua | Terra | Aqua | Terra | Aqua | Terra | |
| St. 1 | <0.05 | <0.05 | <0.05 | <0.05 | <0.05 | <0.05 | <0.05 | <0.05 | <0.05 | <0.05 | <0.05 | <0.05 | <0.05 | <0.05 | <0.05 | <0.05 | <0.05 | <0.05 |
| 488 | 473 | 594 | 608 | 644 | 642 | 540 | 521 | 672 | 668 | 729 | 713 | 709 | 681 | 953 | 951 | 1083 | 1055 | |
| St. 2 | <0.05 | <0.05 | <0.05 | <0.05 | <0.05 | <0.05 | <0.05 | <0.05 | <0.05 | <0.05 | <0.05 | <0.05 | <0.05 | <0.05 | <0.05 | <0.05 | <0.05 | <0.05 |
| 749 | 769 | 1027 | 1038 | 1092 | 1116 | 780 | 798 | 1074 | 1091 | 1146 | 1182 | 873 | 874 | 1303 | 1302 | 1461 | 1465 | |
| St. 3 | <0.05 | <0.05 | <0.05 | <0.05 | <0.05 | <0.05 | <0.05 | <0.05 | <0.05 | <0.05 | <0.05 | <0.05 | <0.05 | <0.05 | <0.05 | <0.05 | <0.05 | <0.05 |
| 1113 | 1233 | 1465 | 1682 | 1584 | 1734 | 1184 | 1305 | 1600 | 1804 | 1740 | 1865 | 1420 | 1531 | 2116 | 2316 | 2409 | 2473 | |
| St. 4 | <0.05 | <0.05 | <0.05 | <0.05 | <0.05 | <0.05 | <0.05 | <0.05 | <0.05 | <0.05 | <0.05 | <0.05 | <0.05 | <0.05 | <0.05 | <0.05 | <0.05 | <0.05 |
| 1281 | 1301 | 1685 | 1661 | 1836 | 1817 | 1369 | 1387 | 1820 | 1788 | 1989 | 1959 | 1612 | 1617 | 2283 | 2204 | 2568 | 2492 | |
| St. 5 | <0.05 | <0.05 | <0.05 | <0.05 | <0.05 | <0.05 | <0.05 | <0.05 | <0.05 | <0.05 | <0.05 | <0.05 | <0.05 | <0.05 | <0.05 | <0.05 | <0.05 | <0.05 |
| 736 | 734 | 907 | 884 | 930 | 904 | 820 | 829 | 1017 | 1004 | 1044 | 1025 | 1055 | 1038 | 1370 | 1330 | 1431 | 1372 | |
| St. 6 | <0.05 | <0.05 | <0.05 | <0.05 | <0.05 | <0.05 | <0.05 | <0.05 | <0.05 | <0.05 | <0.05 | <0.05 | <0.05 | <0.05 | <0.05 | <0.05 | <0.05 | <0.05 |
| 985 | 924 | 1172 | 1134 | 1215 | 1155 | 1024 | 957 | 1229 | 1188 | 1276 | 1212 | 1127 | 1071 | 1407 | 1377 | 1490 | 1430 | |
| St. 7 | <0.05 | <0.05 | <0.05 | <0.05 | <0.05 | <0.05 | <0.05 | <0.05 | <0.05 | <0.05 | <0.05 | <0.05 | <0.05 | <0.05 | <0.05 | <0.05 | <0.05 | <0.05 |
| 724 | 670 | 843 | 833 | 857 | 853 | 773 | 719 | 910 | 898 | 927 | 922 | 904 | 831 | 1115 | 1063 | 1158 | 1112 | |
| St. 8 | <0.05 | <0.05 | <0.05 | <0.05 | <0.05 | <0.05 | <0.05 | <0.05 | <0.05 | <0.05 | <0.05 | <0.05 | <0.05 | <0.05 | <0.05 | <0.05 | <0.05 | <0.05 |
| 806 | 818 | 1037 | 1072 | 1123 | 1106 | 870 | 880 | 1125 | 1158 | 1232 | 1197 | 1063 | 1051 | 1471 | 1490 | 1645 | 1583 | |
| St. 9 | <0.05 | <0.05 | <0.05 | <0.05 | <0.05 | <0.05 | <0.05 | <0.05 | <0.05 | <0.05 | <0.05 | <0.05 | <0.05 | <0.05 | <0.05 | <0.05 | <0.05 | <0.05 |
| 679 | 635 | 891 | 808 | 916 | 825 | 734 | 681 | 967 | 876 | 995 | 896 | 930 | 848 | 1277 | 1154 | 1342 | 1202 | |
| St. 10 | <0.05 | <0.05 | <0.05 | <0.05 | <0.05 | <0.05 | <0.05 | <0.05 | <0.05 | <0.05 | <0.05 | <0.05 | <0.05 | <0.05 | <0.05 | <0.05 | <0.05 | <0.05 |
| 775 | 651 | 954 | 822 | 982 | 841 | 813 | 685 | 1009 | 865 | 1044 | 886 | 997 | 841 | 1261 | 1104 | 1322 | 1140 | |
| St. 11 | <0.05 | <0.05 | <0.05 | <0.05 | <0.05 | <0.05 | <0.05 | <0.05 | <0.05 | <0.05 | <0.05 | <0.05 | <0.05 | <0.05 | <0.05 | <0.05 | <0.05 | <0.05 |
| 909 | 1191 | 1223 | 1388 | 1318 | 1484 | 981 | 1260 | 1352 | 1490 | 1464 | 1605 | 1167 | 1477 | 1801 | 1901 | 2030 | 2116 | |
| St. 12 | <0.05 | <0.05 | <0.05 | <0.05 | <0.05 | <0.05 | <0.05 | <0.05 | <0.05 | <0.05 | <0.05 | <0.05 | <0.05 | <0.05 | <0.05 | <0.05 | <0.05 | <0.05 |
| 1150 | 883 | 1384 | 1106 | 1405 | 1163 | 1211 | 936 | 1471 | 1172 | 1492 | 1233 | 1410 | 1134 | 1758 | 1500 | 1810 | 1609 | |
| St. 13 | <0.05 | <0.05 | <0.05 | <0.05 | <0.05 | <0.05 | <0.05 | <0.05 | <0.05 | <0.05 | <0.05 | <0.05 | <0.05 | <0.05 | <0.05 | <0.05 | <0.05 | <0.05 |
| 861 | 1190 | 2003 | 2003 | 2155 | 2160 | 903 | 1251 | 2140 | 2121 | 2308 | 2291 | 987 | 1382 | 2528 | 2507 | 2799 | 2768 | |
| St. 14 | >0.05 | >0.05 | <0.05 | >0.05 | <0.05 | <0.05 | <0.05 | >0.05 | <0.05 | >0.05 | <0.05 | <0.05 | <0.05 | >0.05 | <0.05 | <0.05 | <0.05 | <0.05 |
| 123 | 163 | 486 | 529 | 663 | 722 | 131 | 176 | 535 | 591 | 742 | 828 | 153 | 189 | 680 | 742 | 1033 | 1126 | |
| St. 15 | <0.05 | <0.05 | <0.05 | <0.05 | <0.05 | <0.05 | <0.05 | <0.05 | <0.05 | <0.05 | <0.05 | <0.05 | <0.05 | <0.05 | <0.05 | <0.05 | <0.05 | <0.05 |
| 1000 | 976 | 1237 | 1227 | 1272 | 1338 | 1095 | 1086 | 1373 | 1372 | 1412 | 1501 | 1469 | 1430 | 2012 | 1941 | 2147 | 2157 | |
| St. 16 | <0.05 | <0.05 | <0.05 | <0.05 | <0.05 | <0.05 | <0.05 | <0.05 | <0.05 | <0.05 | <0.05 | <0.05 | <0.05 | <0.05 | <0.05 | <0.05 | <0.05 | <0.05 |
| 1232 | 1390 | 1545 | 1744 | 1644 | 1842 | 1305 | 1471 | 1664 | 1862 | 1771 | 1969 | 1526 | 1676 | 2105 | 2223 | 2312 | 2391 | |
| St. 17 | <0.05 | <0.05 | <0.05 | <0.05 | <0.05 | <0.05 | <0.05 | <0.05 | <0.05 | <0.05 | <0.05 | <0.05 | <0.05 | <0.05 | <0.05 | <0.05 | <0.05 | <0.05 |
| 845 | 895 | 1086 | 1110 | 1144 | 1176 | 918 | 958 | 1190 | 1196 | 1259 | 1271 | 1114 | 1132 | 1557 | 1548 | 1731 | 1697 | |
| St. 18 | <0.05 | <0.05 | <0.05 | <0.05 | <0.05 | <0.05 | <0.05 | <0.05 | <0.05 | <0.05 | <0.05 | <0.05 | <0.05 | <0.05 | <0.05 | <0.05 | <0.05 | <0.05 |
| 695 | 861 | 965 | 1077 | 999 | 1147 | 738 | 909 | 1051 | 1152 | 1098 | 1225 | 857 | 1020 | 1374 | 1424 | 1528 | 1583 | |
| St. 19 | <0.05 | <0.05 | <0.05 | <0.05 | <0.05 | <0.05 | <0.05 | <0.05 | <0.05 | <0.05 | <0.05 | <0.05 | <0.05 | <0.05 | <0.05 | <0.05 | <0.05 | <0.05 |
| 1021 | 1035 | 1343 | 1353 | 1433 | 1430 | 1087 | 1094 | 1447 | 1438 | 1542 | 1523 | 1283 | 1276 | 1809 | 1756 | 1957 | 1880 | |
| St. 20 | <0.05 | <0.05 | <0.05 | <0.05 | <0.05 | <0.05 | <0.05 | <0.05 | <0.05 | <0.05 | <0.05 | <0.05 | <0.05 | <0.05 | <0.05 | <0.05 | <0.05 | <0.05 |
| 512 | 535 | 647 | 639 | 665 | 692 | 538 | 561 | 692 | 671 | 714 | 726 | 624 | 660 | 828 | 833 | 882 | 914 | |
| St. 21 | <0.05 | <0.05 | <0.05 | <0.05 | <0.05 | <0.05 | <0.05 | <0.05 | <0.05 | <0.05 | <0.05 | <0.05 | <0.05 | <0.05 | <0.05 | <0.05 | <0.05 | <0.05 |
| 956 | 833 | 1365 | 1246 | 1421 | 1273 | 1018 | 885 | 1454 | 1321 | 1513 | 1357 | 1225 | 1046 | 1834 | 1664 | 1926 | 1736 | |
| St. 22 | <0.05 | <0.05 | <0.05 | <0.05 | <0.05 | <0.05 | <0.05 | <0.05 | <0.05 | <0.05 | <0.05 | <0.05 | <0.05 | <0.05 | <0.05 | <0.05 | <0.05 | <0.05 |
| 491 | 440 | 664 | 660 | 778 | 728 | 530 | 476 | 744 | 731 | 884 | 811 | 592 | 547 | 947 | 930 | 1195 | 1089 | |
| St. 23 | <0.05 | <0.05 | <0.05 | <0.05 | <0.05 | <0.05 | <0.05 | <0.05 | <0.05 | <0.05 | <0.05 | <0.05 | <0.05 | <0.05 | <0.05 | <0.05 | <0.05 | <0.05 |
| 644 | 1379 | 1531 | 1717 | 1579 | 1759 | 1387 | 1450 | 1655 | 1822 | 1714 | 1872 | 1691 | 1701 | 2113 | 2232 | 2239 | 2338 | |
| Site ID | Nearest in Time | 30 Minutes Averaging Domain | 3 Hours Averaging Domain | |||||||||||||||
|---|---|---|---|---|---|---|---|---|---|---|---|---|---|---|---|---|---|---|
| Single | 9 Pixels | 25 Pixels | Single | 9 Pixels | 25 Pixels | Single | 9 Pixels | 25 Pixels | ||||||||||
| Aqua | Terra | Aqua | Terra | Aqua | Terra | Aqua | Terra | Aqua | Terra | Aqua | Terra | Aqua | Terra | Aqua | Terra | Aqua | Terra | |
| St. 1 | <0.05 | <0.05 | <0.05 | <0.05 | <0.05 | <0.05 | <0.05 | <0.05 | <0.05 | <0.05 | <0.05 | <0.05 | <0.05 | <0.05 | <0.05 | <0.05 | <0.05 | <0.05 |
| 265 | 305 | 383 | 449 | 437 | 494 | 286 | 330 | 429 | 490 | 495 | 542 | 331 | 398 | 542 | 631 | 655 | 740 | |
| St. 2 | <0.05 | <0.05 | <0.05 | <0.05 | <0.05 | <0.05 | <0.05 | <0.05 | <0.05 | <0.05 | <0.05 | <0.05 | <0.05 | <0.05 | <0.05 | <0.05 | <0.05 | <0.05 |
| 558 | 623 | 783 | 858 | 841 | 931 | 566 | 633 | 807 | 891 | 873 | 975 | 588 | 659 | 881 | 958 | 1006 | 1087 | |
| St. 3 | <0.05 | <0.05 | <0.05 | <0.05 | <0.05 | <0.05 | <0.05 | <0.05 | <0.05 | <0.05 | <0.05 | <0.05 | <0.05 | <0.05 | <0.05 | <0.05 | <0.05 | <0.05 |
| 486 | 650 | 962 | 1268 | 1109 | 1391 | 511 | 682 | 1018 | 1352 | 1184 | 1484 | 571 | 741 | 1193 | 1547 | 1464 | 1773 | |
| St. 4 | <0.05 | <0.05 | <0.05 | <0.05 | <0.05 | <0.05 | <0.05 | <0.05 | <0.05 | <0.05 | <0.05 | <0.05 | <0.05 | <0.05 | <0.05 | <0.05 | <0.05 | <0.05 |
| 792 | 912 | 1309 | 1445 | 1480 | 1624 | 832 | 959 | 1405 | 1537 | 1598 | 1735 | 905 | 1030 | 1619 | 1775 | 1936 | 2078 | |
| St. 5 | >0.05 | <0.05 | <0.05 | <0.05 | <0.05 | <0.05 | >0.05 | >0.05 | <0.05 | <0.05 | <0.05 | <0.05 | <0.05 | >0.05 | <0.05 | <0.05 | <0.05 | <0.05 |
| 18 | 23 | 115 | 137 | 248 | 276 | 19 | 25 | 122 | 148 | 263 | 310 | 21 | 30 | 149 | 186 | 339 | 378 | |
| St. 6 | n/a | n/a | n/a | n/a | n/a | n/a | n/a | n/a | n/a | n/a | n/a | n/a | n/a | n/a | n/a | n/a | n/a | n/a |
| n/a | n/a | n/a | n/a | n/a | n/a | n/a | n/a | n/a | n/a | n/a | n/a | n/a | n/a | n/a | n/a | n/a | n/a | |
| St. 7 | <0.05 | <0.05 | <0.05 | <0.05 | <0.05 | <0.05 | <0.05 | <0.05 | <0.05 | <0.05 | <0.05 | <0.05 | <0.05 | <0.05 | <0.05 | <0.05 | <0.05 | <0.05 |
| 580 | 516 | 728 | 686 | 756 | 722 | 604 | 553 | 773 | 735 | 805 | 775 | 650 | 596 | 866 | 816 | 930 | 870 | |
| St. 8 | <0.05 | <0.05 | <0.05 | <0.05 | <0.05 | <0.05 | <0.05 | <0.05 | <0.05 | <0.05 | <0.05 | <0.05 | <0.05 | <0.05 | <0.05 | <0.05 | <0.05 | <0.05 |
| 608 | 668 | 846 | 942 | 937 | 996 | 636 | 699 | 907 | 1005 | 1015 | 1072 | 690 | 758 | 1064 | 1174 | 1241 | 1309 | |
| St. 9 | <0.05 | >0.05 | <0.05 | <0.05 | <0.05 | <0.05 | <0.05 | <0.05 | <0.05 | <0.05 | <0.05 | <0.05 | <0.05 | <0.05 | <0.05 | <0.05 | <0.05 | <0.05 |
| 10 | 17 | 532 | 562 | 841 | 768 | 10 | 18 | 573 | 599 | 909 | 834 | 11 | 21 | 726 | 758 | 1203 | 1109 | |
| St. 10 | >0.05 | >0.05 | <0.05 | <0.05 | <0.05 | <0.05 | >0.05 | >0.05 | <0.05 | <0.05 | <0.05 | <0.05 | >0.05 | <0.05 | <0.05 | <0.05 | <0.05 | <0.05 |
| 6 | 4 | 35 | 25 | 309 | 318 | 6 | 4 | 36 | 25 | 318 | 333 | 6 | 5 | 39 | 27 | 372 | 390 | |
| St. 11 | <0.05 | <0.05 | <0.05 | <0.05 | <0.05 | <0.05 | <0.05 | <0.05 | <0.05 | <0.05 | <0.05 | <0.05 | <0.05 | <0.05 | <0.05 | <0.05 | <0.05 | <0.05 |
| 473 | 706 | 849 | 1016 | 970 | 1110 | 499 | 735 | 919 | 1073 | 1056 | 1174 | 536 | 792 | 1069 | 1217 | 1284 | 1394 | |
| St. 12 | <0.05 | <0.05 | <0.05 | <0.05 | <0.05 | <0.05 | <0.05 | <0.05 | <0.05 | <0.05 | <0.05 | <0.05 | <0.05 | <0.05 | <0.05 | <0.05 | <0.05 | <0.05 |
| 268 | 266 | 1135 | 803 | 1305 | 1092 | 281 | 276 | 1198 | 837 | 1381 | 1146 | 302 | 310 | 1372 | 1018 | 1633 | 1437 | |
| St. 13 | n/a | n/a | n/a | n/a | n/a | n/a | n/a | n/a | n/a | n/a | n/a | n/a | n/a | n/a | n/a | n/a | n/a | n/a |
| n/a | n/a | n/a | n/a | n/a | n/a | n/a | n/a | n/a | n/a | n/a | n/a | n/a | n/a | n/a | n/a | n/a | n/a | |
| St. 14 | <0.05 | >0.05 | <0.05 | >0.05 | <0.05 | <0.05 | <0.05 | >0.05 | <0.05 | >0.05 | <0.05 | <0.05 | <0.05 | >0.05 | <0.05 | <0.05 | <0.05 | <0.05 |
| 11 | 20 | 141 | 190 | 334 | 396 | 11 | 21 | 149 | 204 | 377 | 447 | 12 | 22 | 175 | 236 | 483 | 574 | |
| St. 15 | <0.05 | <0.05 | <0.05 | <0.05 | <0.05 | <0.05 | <0.05 | <0.05 | <0.05 | <0.05 | <0.05 | <0.05 | <0.05 | <0.05 | <0.05 | <0.05 | <0.05 | <0.05 |
| 491 | 577 | 882 | 991 | 983 | 1140 | 533 | 629 | 965 | 1091 | 1078 | 1264 | 655 | 760 | 1256 | 1390 | 1462 | 1658 | |
| St. 16 | <0.05 | <0.05 | <0.05 | <0.05 | <0.05 | <0.05 | <0.05 | <0.05 | <0.05 | <0.05 | <0.05 | <0.05 | <0.05 | <0.05 | <0.05 | <0.05 | <0.05 | <0.05 |
| 37 | 46 | 438 | 631 | 627 | 821 | 38 | 48 | 456 | 658 | 658 | 859 | 43 | 50 | 500 | 716 | 751 | 959 | |
| St. 17 | <0.05 | <0.05 | <0.05 | <0.05 | <0.05 | <0.05 | <0.05 | <0.05 | <0.05 | <0.05 | <0.05 | <0.05 | <0.05 | <0.05 | <0.05 | <0.05 | <0.05 | <0.05 |
| 500 | 616 | 756 | 877 | 849 | 969 | 528 | 641 | 814 | 933 | 920 | 1037 | 594 | 704 | 966 | 1108 | 1136 | 1298 | |
| St. 18 | <0.05 | <0.05 | <0.05 | <0.05 | <0.05 | <0.05 | <0.05 | <0.05 | <0.05 | <0.05 | <0.05 | <0.05 | <0.05 | <0.05 | <0.05 | <0.05 | <0.05 | <0.05 |
| 288 | 470 | 608 | 769 | 694 | 895 | 294 | 492 | 643 | 810 | 742 | 949 | 308 | 505 | 730 | 894 | 900 | 1094 | |
| St. 19 | <0.05 | <0.05 | <0.05 | <0.05 | <0.05 | <0.05 | <0.05 | <0.05 | <0.05 | <0.05 | <0.05 | <0.05 | <0.05 | <0.05 | <0.05 | <0.05 | <0.05 | <0.05 |
| 455 | 504 | 994 | 976 | 1230 | 1218 | 479 | 530 | 1062 | 1033 | 1318 | 1288 | 524 | 584 | 1233 | 1208 | 1572 | 1518 | |
| St. 20 | <0.05 | >0.05 | <0.05 | <0.05 | <0.05 | <0.05 | <0.05 | >0.05 | <0.05 | <0.05 | <0.05 | <0.05 | <0.05 | >0.05 | <0.05 | <0.05 | <0.05 | <0.05 |
| 55 | 70 | 292 | 363 | 365 | 455 | 57 | 73 | 302 | 376 | 381 | 474 | 67 | 86 | 337 | 446 | 433 | 568 | |
| St. 21 | <0.05 | <0.05 | <0.05 | <0.05 | <0.05 | <0.05 | <0.05 | <0.05 | <0.05 | <0.05 | <0.05 | <0.05 | <0.05 | <0.05 | <0.05 | <0.05 | <0.05 | <0.05 |
| 98 | 47 | 1337 | 1191 | 1418 | 1274 | 105 | 53 | 1425 | 1264 | 1510 | 1355 | 124 | 67 | 1769 | 1597 | 1907 | 1733 | |
| St. 22 | <0.05 | <0.05 | <0.05 | <0.05 | <0.05 | <0.05 | <0.05 | <0.05 | <0.05 | <0.05 | <0.05 | <0.05 | <0.05 | <0.05 | <0.05 | <0.05 | <0.05 | <0.05 |
| 29 | 29 | 358 | 359 | 519 | 517 | 29 | 29 | 375 | 382 | 551 | 554 | 30 | 31 | 393 | 406 | 602 | 614 | |
| St. 23 | <0.05 | >0.05 | <0.05 | <0.05 | <0.05 | <0.05 | <0.05 | >0.05 | <0.05 | <0.05 | <0.05 | <0.05 | <0.05 | >0.05 | <0.05 | <0.05 | <0.05 | <0.05 |
| 19 | 27 | 324 | 503 | 530 | 789 | 22 | 28 | 341 | 528 | 553 | 837 | 27 | 33 | 391 | 596 | 653 | 963 | |
References
- Huang, X.; Song, Y.; Zhao, C.; Cai, X.; Zhang, H.; Zhu, T. Direct radiative effect by multicomponent aerosol over China. J. Clim. 2015, 28, 3472–3495. [Google Scholar] [CrossRef]
- Peers, F.; Waquet, F.; Cornet, C.; Dubuisson, P.; Ducos, F.; Goloub, P.; Szczap, F.; Tanré, D.; Thieuleux, F. Absorption of aerosols above clouds from POLDER/PARASOL measurements and estimation of their direct radiative effect. Atmos. Chem. Phys. 2015, 15, 4179–4196. [Google Scholar] [CrossRef] [Green Version]
- Zhang, S.; Wang, M.; Ghan, S.J.; Ding, A.; Wang, H.; Zhang, K.; Neubauer, D.; Lohmann, U.; Ferrachat, S.; Takeamura, T.; et al. On the characteristics of aerosol indirect effect based on dynamic regimes in global climate models. Atmos. Chem. Phys. 2016, 16, 2765–2783. [Google Scholar] [CrossRef] [Green Version]
- Jolivet, D.; Ramon, D.; Bernard, E.; Deschamps, P.Y.; Riedi, J.; Nicolas, J.M.; Hagolle, O. Aerosol monitoring over land using MSG/SEVIRI. In Proceedings of the EUMETSAT Meteorological Satellite Conference, Darmstadt, Germany, 8–12 September 2008; pp. 8–12. [Google Scholar]
- Li, Y.; Henze, D.K.; Jack, D.; Henderson, B.H.; Kinney, P.L. Assessing public health burden associated with exposure to ambient black carbon in the United States. Sci. Total Environ. 2016, 539, 515–525. [Google Scholar] [CrossRef] [Green Version]
- Shiraiwa, M.; Ueda, K.; Pozzer, A.; Lammel, G.; Kampf, C.J.; Fushimi, A.; Enami, S.; Arangio, A.M.; Fröhlich-Nowoisky, J.; Fujitani, Y.; et al. Aerosol Health Effects from Molecular to Global Scales. Environ. Sci. Technol. 2017, 51, 13545–13567. [Google Scholar] [CrossRef] [PubMed]
- Reisen, F.; Meyer, C.P.M.; Keywood, M.D. Impact of biomass burning sources on seasonal aerosol air quality. Atmos. Environ. 2013, 67, 437–447. [Google Scholar] [CrossRef]
- Viana, M.; Hammingh, P.; Colette, A.; Querol, X.; Degraeuwe, B.; de Vlieger, I.; van Aardenne, J. Impact of maritime transport emissions on coastal air quality in Europe. Atmos. Environ. 2014, 90, 96–105. [Google Scholar] [CrossRef]
- Gao, M.; Guttikunda, S.K.; Carmichael, G.R.; Wang, Y.; Liu, Z.; Stanier, C.O.; Saide, P.E.; Yu, M. Health impacts and economic losses assessment of the 2013 severe haze event in Beijing area. Sci. Total Environ. 2015, 511, 553–561. [Google Scholar] [CrossRef] [PubMed]
- Chin, M.; Diehl, T.; Ginoux, P.; Malm, W. Intercontinental transport of pollution and dust aerosols: Implications for regional air quality. Atmos. Chem. Phys. 2007, 7, 5501–5517. [Google Scholar] [CrossRef] [Green Version]
- Schlosser, J.S.; Braun, R.A.; Bradley, T.; Dadashazar, H.; MacDonald, A.B.; Aldhaif, A.A.; Aghdam, M.A.; Mardi, A.H.; Xian, P.; Sorooshian, A. Analysis of aerosol composition data for western United States wildfires between 2005 and 2015: Dust emissions, chloride depletion, and most enhanced aerosol constituents. J. Geophys. Res. Atmos. 2017, 122, 8951–8966. [Google Scholar] [CrossRef]
- Tong, D.Q.; Wang, J.X.L.; Gill, T.E.; Lei, H.; Wang, B. Intensified dust storm activity and Valley fever infection in the southwestern United States. Geophys. Res. Lett. 2017, 44, 4304–4312. [Google Scholar] [CrossRef] [Green Version]
- Brahney, J.; Ballantyne, A.P.; Sievers, C.; Neff, J.C. Increasing Ca2+ deposition in the western US: The role of mineral aerosols. Aeolian Res. 2013, 10, 77–87. [Google Scholar] [CrossRef] [Green Version]
- Hand, J.L.; White, W.H.; Gebhart, K.A.; Hyslop, N.P.; Gill, T.E.; Schichtel, B.A. Earlier onset of the spring fine dust season in the southwestern United States. Geophys. Res. Lett. 2016, 43, 4001–4009. [Google Scholar] [CrossRef] [Green Version]
- Dennison, P.E.; Brewer, S.C.; Arnold, J.D.; Moritz, M.A. Large wildfire trends in the western United States, 1984–2011. Geophys. Res. Lett. 2014, 41, 2928–2933. [Google Scholar] [CrossRef]
- Littell, J.S.; Mckenzie, D.; Peterson, D.L.; Westerling, A.L. Climate and wildfire area burned in western U.S. ecoprovinces, 1916–2003. Ecol. Appl. 2009, 19, 1003–1021. [Google Scholar] [CrossRef]
- Liu, J.C.; Mickley, L.J.; Sulprizio, M.P.; Dominici, F.; Yue, X.; Ebisu, K.; Anderson, G.B.; Khan, R.F.; Bravo, M.A.; Bell, M.L. Particulate air pollution from wildfires in the Western US under climate change. Clim. Chang. 2016, 138, 655–666. [Google Scholar] [CrossRef] [PubMed] [Green Version]
- McClure, C.D.; Jaffe, D.A. US particulate matter air quality improves except in wildfire-prone areas. Proc. Natl. Acad. Sci. USA 2018, 115, 7901–7906. [Google Scholar] [CrossRef] [PubMed] [Green Version]
- Harvey, B.J. Human-caused climate change is now a key driver of forest fire activity in the western United States. Proc. Natl. Acad. Sci. USA 2016, 113, 11649–11650. [Google Scholar] [CrossRef] [PubMed] [Green Version]
- Chung, C.E.; Ramanathan, V.; Kim, D.; Podgorny, I.A. Global anthropogenic aerosol direct forcing derived from satellite and ground-based observations. J. Geophys. Res. Atmos. 2005, 110, 1–17. [Google Scholar] [CrossRef]
- Van Donkelaar, A.; Martin, R.V.; Pasch, A.N.; Szykman, J.J.; Zhang, L.; Wang, Y.X.; Chen, D. Improving the accuracy of daily satellite-derived ground-level fine aerosol concentration estimates for North America. Environ. Sci. Technol. 2012, 46, 11971–11978. [Google Scholar] [CrossRef]
- Hersey, S.P.; Garland, R.M.; Crosbie, E.; Shingler, T.; Sorooshian, A.; Piketh, S.; Burger, R. An overview of regional and local characteristics of aerosols in South Africa using satellite, ground, and modeling data. Atmos. Chem. Phys. 2015, 15, 4259–4278. [Google Scholar] [CrossRef] [PubMed] [Green Version]
- Kim, P.S.; Jacob, D.; Fisher, J.A.; Travis, K.; Yu, K.; Zhu, L.; Yantosca, R.M.; Sulprizio, M.P.; Jimenez, J.L.; Campuzano-Jost, P.; et al. Sources, seasonality, and trends of southeast US aerosol. Atmos. Chem. Phys. 2015, 15, 10411–10433. [Google Scholar] [CrossRef] [Green Version]
- Torres, O.; Bhartia, P.K.; Herman, J.R.; Sinyuk, A.; Ginoux, P.; Holben, B. A Long-Term Record of Aerosol Optical Depth from TOMS Observations and Comparison to AERONET Measurements. J. Atmos. Sci. 2002, 59, 398–413. [Google Scholar] [CrossRef] [Green Version]
- Xu, Y.; Bahadur, R.; Zhao, C.; Ruby Leung, L. Estimating the radiative forcing of carbonaceous aerosols over California based on satellite and ground observations. J. Geophys. Res. Atmos. 2013, 118, 11148–11160. [Google Scholar] [CrossRef]
- Bibi, H.; Alam, K.; Chishtie, F.; Bibi, S.; Shahid, I.; Blaschke, T. Intercomparison of MODIS, MISR, OMI, and CALIPSO aerosol optical depth retrievals for four locations on the Indo-Gangetic plains and validation against AERONET data. Atmos. Environ. 2015, 111, 113–126. [Google Scholar] [CrossRef]
- Justice, C.; Belward, A.; Morisette, J.; Lewis, P.; Privette, J.; Baret, F. Developments in the ‘validation’ of satellite sensor products for the study of the land surface. Int. J. Remote Sens. 2000, 21, 3383–3390. [Google Scholar] [CrossRef]
- Loew, A.; Bell, W.; Brocca, L.; Bulgin, C.E.; Burdanowitz, J.; Calbet, X.; Donner, R.V.; Ghent, D.; Gruber, A.; Kaminski, T.; et al. Validation practices for satellite-based Earth observation data across communities. Rev. Geophys. 2017, 55, 779–817. [Google Scholar] [CrossRef] [Green Version]
- Filonchyk, M.; Yan, H.; Zhang, Z.; Yang, S.; Li, W.; Li, Y. Combined use of satellite and surface observations to study aerosol optical depth in different regions of China. Sci. Rep. 2019, 9. [Google Scholar] [CrossRef]
- Remer, L.A.; Tanré, D.; Kaufman, Y.J.; Levy, R.; Mattoo, S. Algorithm for remote sensing of tropospheric aerosol from MODIS: Collection 005. Natl. Aeronaut. Space Adm. 2006, 1490, 1–88. [Google Scholar]
- Levy, R.C.; Remer, L.A.; Mattoo, S.A.; Vermote, E.F.; Kaufman, Y.J. Second-generation operational algorithm: Retrieval of aerosol properties over land from inversion of Moderate Resolution Imaging Spectroradiometer spectral reflectance. J. Geophys. Res. Atmos. 2007, 112. [Google Scholar] [CrossRef] [Green Version]
- Kumar, N.; Chu, A.D.; Foster, A.D.; Peters, T.; Willis, R. Satellite remote sensing for developing time and space resolved estimates of ambient particulate in Cleveland, OH. Aerosol Sci. Technol. 2011, 45, 1090–1108. [Google Scholar] [CrossRef] [PubMed] [Green Version]
- Bréon, F.M.; Vermeulen, A.; Descloitres, J. An evaluation of satellite aerosol products against sunphotometer measurements. Remote Sens. Environ. 2011, 115, 3102–3111. [Google Scholar] [CrossRef]
- Mishchenko, M.I.; Liu, L.; Geogdzhayev, I.V.; Travis, L.D.; Cairns, B.; Lacis, A.A. Toward unified satellite climatology of aerosol properties. 3. MODIS versus MISR versus AERONET. J. Quant. Spectrosc. Radiat. Transf. 2010, 111, 540–552. [Google Scholar] [CrossRef]
- Saide, P.E.; Kim, J.; Song, C.H.; Choi, M.; Cheng, Y.; Carmichael, G.R. Assimilation of next generation geostationary aerosol optical depth retrievals to improve air quality simulations. Geophys. Res. Lett. 2014, 41, 9188–9196. [Google Scholar] [CrossRef]
- Vijayakumar, K.; Devara, P.C.; Rao, S.V.B.; Jayasankar, C.K. Dust aerosol characterization and transport features based on combined ground-based, satellite and model-simulated data. Aeolian Res. 2016, 21, 75–85. [Google Scholar] [CrossRef]
- Drury, E.; Jacob, D.J.; Spurr, R.J.; Wang, J.; Shinozuka, Y.; Anderson, B.E.; Clarke, A.D.; Dibb, J.; McNaughton, C.; Weber, R. Synthesis of satellite (MODIS), aircraft (ICARTT), and surface (IMPROVE, EPA-AQS, AERONET) aerosol observations over eastern North America to improve MODIS aerosol retrievals and constrain surface aerosol concentrations and sources. J. Geophys. Res. Atmos. 2010, 115. [Google Scholar] [CrossRef] [Green Version]
- Lei, H.; Wang, J.X.L. Observed characteristics of dust storm events over the western United States using meteorological, satellite, and air quality measurements. Atmos. Chem. Phys. 2014, 14, 7847–7857. [Google Scholar] [CrossRef] [Green Version]
- Li, J.; Carlson, B.E.; Lacis, A.A. How well do satellite AOD observations represent the spatial and temporal variability of PM2.5 concentration for the United States? Atmos. Environ. 2015, 102, 260–273. [Google Scholar] [CrossRef]
- Roy, B.; Mathur, R.; Gilliland, A.B.; Howard, S.C. A comparison of CMAQ-based aerosol properties with IMPROVE, MODIS, and AERONET data. J. Geophys. Res. Atmos. 2007, 112. [Google Scholar] [CrossRef] [Green Version]
- Raman, A.; Arellano, A.F.; Sorooshian, A. Decreasing aerosol loading in the north American monsoon region. Atmosphere 2016, 7, 24. [Google Scholar] [CrossRef] [PubMed] [Green Version]
- Clay, K.; Muller, N.Z. Recent Increases in Air Pollution: Evidence and Implications for Mortality; Technical Report; National Bureau of Economic Research: Cambridge, MA, USA, 2019. [Google Scholar] [CrossRef]
- US EPA. National Air Quality: Status and Trends of Key Air Pollutants|US EPA; US EPA: Washington, DC, USA, 2019.
- Bryson, R.A.; Hare, F.K. Climates of North America: Volume 11 of World Survey of Climatology; Elsevier: Amsterdam, The Netherlands, 1974. [Google Scholar]
- Holben, B.N.; Eck, T.F.; Slutsker, I.; Tanré, D.; Buis, J.P.; Setzer, A.; Vermote, E.; Reagan, J.A.; Kaufman, Y.J.; Nakajima, T.; et al. AERONET—A federated instrument network and data archive for aerosol characterization. Remote Sens. Environ. 1998, 66, 1–16. [Google Scholar] [CrossRef]
- Rainwater, M.; Gregory, L. Cimel Sunphotometer (CSPHOT) Handbook; Technical Report; Citeseer: Princeton, NJ, USA, 2005. [Google Scholar]
- Mishra, A.K.; Rudich, Y.; Koren, I. Spatial boundaries of Aerosol Robotic Network observations over the Mediterranean basin. Geophys. Res. Lett. 2016, 43, 2259–2266. [Google Scholar] [CrossRef] [Green Version]
- Shi, Y.; Zhang, J.; Reid, S.; Holben, B.; Hyer, J.; Curtis, C. An analysis of the collection 5 MODIS over-ocean aerosol optical depth product for its implication in aerosol assimilation. Atmos. Chem. Phys. 2011, 11, 557–565. [Google Scholar] [CrossRef] [Green Version]
- Yang, J.; Hu, M. Filling the missing data gaps of daily MODIS AOD using spatiotemporal interpolation. Sci. Total Environ. 2018, 633, 677–683. [Google Scholar] [CrossRef] [PubMed]
- Sayer, A.M.; Munchak, L.A.; Hsu, N.C.; Levy, R.C.; Bettenhausen, C.; Jeong, M.J.J. Modis collection 6 aerosol products: Comparison between aqua’s e-deep blue, dark target, and “merged” data sets, and usage recommendations. J. Geophys. Res. 2014, 119, 13965–13989. [Google Scholar] [CrossRef]
- Levy, R.C.; Mattoo, S.; Munchak, L.A.; Remer, L.A.; Sayer, A.M.; Patadia, F.; Hsu, N.C. The Collection 6 MODIS aerosol products over land and ocean. Atmos. Meas. Tech. 2013, 6, 2989–3034. [Google Scholar] [CrossRef] [Green Version]
- Hsu, N.C.; Tsay, S.C.; King, M.D.; Herman, J.R. Aerosol properties over bright-reflecting source regions. IEEE Trans. Geosci. Remote Sens. 2004, 42, 557–569. [Google Scholar] [CrossRef]
- Hsu, N.C.; Tsay, S.C.; King, M.; Herman, J. Deep Blue Retrievals of Asian Aerosol Properties During ACE-Asia. IEEE Trans. Geosci. Remote Sens. 2006, 44, 3180–3195. [Google Scholar] [CrossRef]
- Hsu, N.C.; Jeong, M.J.; Bettenhausen, C.; Sayer, A.M.; Hansell, R.; Seftor, C.S.; Huang, J.; Tsay, S.C. Enhanced Deep Blue aerosol retrieval algorithm: The second generation. J. Geophys. Res. Atmos. 2013, 118, 9296–9315. [Google Scholar] [CrossRef]
- Hsu, N.C. Changes to Modis Deep Blue Aerosol Products betwwen Collection 6 and Collection 6.1; NASA GSFC: Greenbelt, MD, USA, 2017.
- Wei, J.; Li, Z.; Peng, Y.; Sun, L. MODIS Collection 6.1 aerosol optical depth products over land and ocean: Validation and comparison. Atmos. Environ. 2019, 201, 428–440. [Google Scholar] [CrossRef]
- Ginoux, P.; Garbuzov, D.; Hsu, N.C. Identification of anthropogenic and natural dust sources using Moderate Resolution Imaging Spectroradiometer (MODIS) Deep Blue level 2 data. J. Geophys. Res. 2010, 115, D05204. [Google Scholar] [CrossRef] [Green Version]
- Petrenko, M.; Ichoku, C.; Leptoukh, G. Multi-sensor aerosol products sampling system (MAPSS). Atmos. Meas. Tech. 2012, 5, 913–926. [Google Scholar] [CrossRef] [Green Version]
- Eck, T.F.; Holben, B.N.; Reid, J.S.; Dubovik, O.; Smirnov, A.; O’Neill, N.T.; Slutsker, I.; Kinne, S. Wavelength dependence of the optical depth of biomass burning, urban, and desert dust aerosols. J. Geophys. Res. Atmos. 1999, 104, 31333–31349. [Google Scholar] [CrossRef]
- Hamonou, E.; Chazette, P.; Balis, D.; Dulac, F.; Schneider, X.; Galani, E.; Ancellet, G.; Papayannis, A. Characterization of the vertical structure of Saharan dust export to the Mediterranean basin. J. Geophys. Res. Atmos. 1999, 104, 22257–22270. [Google Scholar] [CrossRef] [Green Version]
- Loría-Salazar, S.M.; Holmes, H.A.; Patrick Arnott, W.; Barnard, J.C.; Moosmüller, H. Evaluation of MODIS columnar aerosol retrievals using AERONET in semi-arid Nevada and California, U.S.A., during the summer of 2012. Atmos. Environ. 2016, 144, 345–360. [Google Scholar] [CrossRef]
- Gupta, P.; Remer, L.A.; Patadia, F.; Levy, R.C.; Christopher, S.A. High-resolution gridded level 3 aerosol optical depth data from modis. Remote Sens. 2020, 12, 2847. [Google Scholar] [CrossRef]
- Drury, E.; Jacob, D.J.; Wang, J.; Spurr, R.J.; Chance, K. Improved algorithm for MODIS satellite retrievals of aerosol optical depths over western North America. J. Geophys. Res. Atmos. 2008, 113, 16204. [Google Scholar] [CrossRef] [Green Version]
- Shi, H.; Xiao, Z.; Zhan, X.; Ma, H.; Tian, X. Evaluation of MODIS and two reanalysis aerosol optical depth products over AERONET sites. Atmos. Res. 2019, 220, 75–80. [Google Scholar] [CrossRef]


| Site ID | Site Name | State | Coordinates | Elevation (m) | Period of Record | LULC Type | ||
|---|---|---|---|---|---|---|---|---|
| Long. | Lat. | Start | End | |||||
| St. 1 | Ames | IA | −93.775 | 42.021 | 338.0 | 20040521 | 20160102 | Rural, dryland cropland, and pasture |
| St. 2 | Bozeman | MT | −111.045 | 45.662 | 1507.0 | 20080411 | 20170419 | Urban, shrubland, and grassland |
| St. 3 | BSRN BAO Boulder | CO | −105.006 | 40.045 | 1604.0 | 20010507 | 20160713 | Urban and cropland/grassland mosaic |
| St. 4 | CART Site | OK | −97.486 | 36.607 | 318.0 | 19940407 | 20170623 | Rural, dryland cropland, and pasture |
| St. 5 | Frenchman Flat | NV | −115.935 | 36.809 | 940.0 | 20061212 | 20150126 | Rural and shrubland |
| St. 6 | Goldstone | CA | −116.792 | 35.233 | 1100.0 | 20091216 | 20170816 | Rural and shrubland |
| St. 7 | HJAndrews | OR | −122.224 | 44.239 | 830.0 | 19950622 | 20111221 | Evergreen Needleleaf Forest |
| St. 8 | Konza EDC | KS | −96.610 | 39.102 | 341.0 | 20000616 | 20151203 | Rural and cropland/grassland mosaic |
| St. 9 | La Jolla | CA | −117.251 | 32.868 | 80.0 | 20000229 | 20131021 | Urban, ocean, grassland, and builtup land |
| St. 10 | Maricopa | AZ | −111.972 | 33.069 | 360.0 | 20000324 | 20100709 | Rural and shrubland |
| St. 11 | Missoula | MT | −114.083 | 46.917 | 976.0 | 20000824 | 20170815 | Urban, grassland, and needleleaf forest |
| St. 12 | Monterey | CA | −121.855 | 36.593 | 50.0 | 19980513 | 20161004 | Urban, built-up land, and needleleaf forest |
| St. 13 | Railroad Valley | NV | −115.691 | 38.497 | 1437.0 | 20110626 | 20150825 | Rural, barren, and mixed shrubland/grassland |
| St. 14 | Red Mountain Pass | CO | −107.711 | 37.907 | 3376.0 | 20051005 | 20170928 | Rural and mixed forest |
| St. 15 | Rimrock | ID | −116.992 | 46.487 | 824.0 | 19990414 | 20170316 | Grassland, dryland cropland, and pasture |
| St. 16 | Sevilleta | NM | −106.885 | 34.355 | 1477.0 | 19940411 | 20170423 | Rural and shrubland |
| St. 17 | Sioux Falls | SD | −96.626 | 43.736 | 505.0 | 19970718 | 20171024 | Rural, dryland cropland, and pasture |
| St. 18 | Table Mountain | CO | −105.237 | 40.125 | 1689.0 | 19980805 | 20171228 | Grassland |
| St. 19 | Table Mountain CA | CA | −117.680 | 34.380 | 2200.0 | 19980805 | 20171228 | Evergreen needleleaf forest |
| St. 20 | Tucson | AZ | −110.953 | 32.233 | 779.0 | 19931119 | 20161122 | Urban and built-up land |
| St. 21 | UCSB | CA | −119.845 | 34.415 | 33.0 | 20021208 | 20170917 | Urban, ocean, grassland, and built-up land |
| St. 22 | Univ. of Houston | TX | −95.342 | 29.718 | 65.0 | 20060820 | 20160902 | Urban, ocean, and built-up land |
| St. 23 | White Sands HELSTF | NM | −106.338 | 32.635 | 1207.2 | 20061117 | 20170626 | Rural, shrubland, and barren |
Publisher’s Note: MDPI stays neutral with regard to jurisdictional claims in published maps and institutional affiliations. |
© 2021 by the authors. Licensee MDPI, Basel, Switzerland. This article is an open access article distributed under the terms and conditions of the Creative Commons Attribution (CC BY) license (https://creativecommons.org/licenses/by/4.0/).
Share and Cite
Eibedingil, I.G.; Gill, T.E.; Van Pelt, R.S.; Tong, D.Q. Comparison of Aerosol Optical Depth from MODIS Product Collection 6.1 and AERONET in the Western United States. Remote Sens. 2021, 13, 2316. https://doi.org/10.3390/rs13122316
Eibedingil IG, Gill TE, Van Pelt RS, Tong DQ. Comparison of Aerosol Optical Depth from MODIS Product Collection 6.1 and AERONET in the Western United States. Remote Sensing. 2021; 13(12):2316. https://doi.org/10.3390/rs13122316
Chicago/Turabian StyleEibedingil, Iyasu G., Thomas E. Gill, R. Scott Van Pelt, and Daniel Q. Tong. 2021. "Comparison of Aerosol Optical Depth from MODIS Product Collection 6.1 and AERONET in the Western United States" Remote Sensing 13, no. 12: 2316. https://doi.org/10.3390/rs13122316
APA StyleEibedingil, I. G., Gill, T. E., Van Pelt, R. S., & Tong, D. Q. (2021). Comparison of Aerosol Optical Depth from MODIS Product Collection 6.1 and AERONET in the Western United States. Remote Sensing, 13(12), 2316. https://doi.org/10.3390/rs13122316