Abstract
Tropical dry forest is vulnerable to increased climate variability with more frequent and severe storms. Studies of hurricane impact on tropical dry forest often focused on individual tree traits. How trees in tropical dry forests work together to combat wind damage is still unclear. To address this, we integrated ground-observed ecosystem structure from National Ecological Observation Network (NEON) with airborne-LiDAR images and analyzed resistance in forest structure of Guánica dry forest in Puerto Rico to major hurricanes in 2017 at the forest-stand level. Using each plot instead of the individual tree as the base unit, we regressed mean changes in stem height and fractions of lost or damaged stems at 15 plots on mean stem diameter, mean and standard deviation of stem height, stem density, and topography. Meanwhile, using the LiDAR-derived canopy heights, we compared the changes in canopy height before and after the hurricanes and regressed spatially the canopy height change on prior-hurricane tree cover, canopy height, and rugosity. We found that the damage was small in places with high stem density or high tree cover. Ground-observed damage in terms of height reduction significantly increased with the standard deviation of stem height, an index of roughness, but decreased with the mean stem diameter of the plots. LiDAR-detected damage in terms of reduction in canopy height was also found to decrease with tree cover and mean canopy height when the canopy height was small or moderate but increase with the rugosity. The fraction of lost stems significantly decreased with the stem density, and the fraction of damaged stems significantly increased with the roughness and the plot elevation. The collective parameters of forest stand quantified from ground-observation and LiDAR, such as stem density, tree cover, and canopy roughness or rugosity, highlighted mutual supports of trees and played important roles in resisting damages to the tropical dry forest during major hurricanes.
1. Introduction
Tropical and subtropical dry forest accounts for 42% of the global tropical and subtropical forest cover [1] and spans climate regions with annual rainfall ranging from 250 to 2000 mm, annual mean bio-temperature greater than 17 °C, and the annual ratio of potential evapotranspiration to precipitation greater than 1 [2]. The C stock of tropical dry forest accounts for 8–9% of the global estimate, yet the net primary production was 620 g C m−2, which is only lower than that of the tropical wet forest [3,4]. There are always 2–6 months of dry season, and the water-limited nature makes tropical dry forests especially sensitive to climate variability and extreme climate events such as drought and storms [5,6,7,8].
The structure of the tropical dry forest is substantially different from that of the tropical wet and moist forests. The dry forest has, in general, lower tree richness than wet forest, and the low diversity is especially found in island forests [1]. According to the negative exponential relationship between root to shoot ratio and annual rainfall [9], the tropical dry forest has a larger root:shoot ratio (0.57–0.71) than moist and wet forests (0.17–0.35) to facilitate water and nutrient uptake [10], which might help resist root–soil failure during strong winds [11,12]. Limited by the hydraulic transporting capacity, the tropical dry forest also has a smaller stem height to diameter ratio than wet and moist forests have. For diameters in the ranges of 10–20 cm and 21–40 cm, the mean heights were 11.8 and 18.1 m for the tropical dry forest, 14.7 and 23.3 m for the moist forest, and 16.7 and 25.6 m for the wet forest, respectively [13]. Lower diversity, larger root:shoot ratio, and lower height:diameter (taper, lower slenderness) ratio make tropical dry forests differ from wet or moist forests in response and resistance to tropical storms.
Resistance to tropical storms and recovery of the tropical dry forest after disturbance also depend on other structural and functional traits. For example, wood density correlates to rupture modulus and elasticity modulus, and high wood density, associating with mechanical strength, might indicate less likely the wind snap (e.g., trunk breakage) but more likely the windthrown (e.g., uprooting) [14]. A tree species with a greater specific leaf area (SLA) may intercept more wind drag forces to rupture the stems and branches; however, thinner leaves are also easily torn by the wind and may be more advantageous to avoid damage to branches and trunks. On the other hand, a species with a smaller SLA has a longer leaf life span, stronger leaves, stronger ties with branches and twigs, and less likely to shed its leaves [15]. Since wind-induced load can be increased 2–3 times with foliage, compared to that without foliage, mechanically strong leaves make them hard to shed and may lead to severe damage to branches and trunks during storms [16]. After hurricane disturbance, tree species with greater SLA have a higher relative growth rate [17]. SLA and maximum height are positively associated with resprouting and recovery, whereas wood density and slenderness are negatively associated with resprouting and recovery [7].
Recent studies emphasized the important role of stand-level parameters in wind damages to forests [11,18]. Hart et al. [18] found that the random forest models on wind damage to forests provided high accuracy and the discriminatory power remained high with the removal of individual-level characteristics; however, the accuracy and the discriminatory power would be lost if the stand-level information is removed. Compared to a single-tree situation, trees in a closed forest stand provide sheltering effect and/or mechanically mutual supports during wind disturbance [11]. Moore and Lin [19] reported that stand density and height:diameter ratio are the most important factors associated with wind damage in terms of basal area loss. Compared to dense stands, winds inside a stand with widely spaced trees are higher [11]. Forest structure also affects its vulnerability to wind damage [12]. By analyzing the impacts of Typhoon Songda in northern Japan using the random forest algorithm, Morimoto et al. [20] reported that the natural mixed forest stand with a complex structure was less vulnerable to the catastrophic wind compared to the Abies plantation with a simple structure.
Monitoring wind damage in forests is mostly based on small-scale ground observations [7,21,22] and large-scale optical remote-sensed images [23,24]. Based on the fused vegetation index from Sentinel-2 and Landsat-8, the dynamic of forest greenness, indicating ecosystem functions, was assessed to explore how topography, drainage capability, and legacy of drought differentiated tropical ecosystem response to and recovery from major hurricanes [24]. Compared to ecosystem functions, ecosystem structures showed much slower recovery after hurricanes [22] and divergence [25]; thus, structural changes are better indicators of hurricane impacts in the short to long term. However, structural changes especially at scales larger than plots are still rare in existing studies. The recent rapid advance in remote sensing technology, particularly LiDAR, provides us necessary data and metrics such as canopy height, cover, or rugosity [26,27] to monitor structural changes at a larger scale and to explore underlying mechanisms of forests in response to storms.
The Caribbean region is prone to tropical storms. In September 2017, two successive major hurricanes impacted the region [24,28]. Recent research mostly focused on the impact of hurricanes on windward wet and moist forests [21], while the study of the impact on the leeward tropical dry forest is largely left untouched. On the other hand, compared to the trait-based individual-level studies mentioned above, the quantitative roles of stand-level parameters of tropical dry forest, such as stem density and canopy roughness, in the ecosystem resistance to tropical storms remain unclear.
This study aims to explore how the two major hurricanes impact a tropical dry forest at stand level by integrating damages to trees based on the National Ecological Observation Network (NEON) ground observations with changes in canopy height within the forest via the airborne LiDAR observations. We associated the impact of the hurricanes to the ground-measured stem density and stem diameter, unevenness of the stem height, and topography such as elevation, aspect, or topographic position, as well as to the LiDAR-sensed canopy height, tree cover, and rugosity. We hypothesized that more unevenness of the canopy or rugosity and higher plot elevation tend to bring more damage, whereas higher tree cover, higher stem density, and larger stem diameter tend to resist the damage. On the other hand, the rain brought by hurricanes may alleviate the drought stress during the years before the storms.
2. Materials and Methods
2.1. Study Area
NEON Guánica site (−66.86°W, 17.97°N, Figure 1) is located within the dry-forest life zone in southwest Puerto Rico near the coast of the Caribbean Sea. The site has a mean annual precipitation of 860 mm and a mean annual temperature of 25 °C [1]. Guánica dry forest was designated as a state forest in 1919 and a UNESCO International Biosphere Reserve in 1981. In 2017, Hurricane Irma passed by the tropical island Puerto Rico on 6 September with the sustaining wind speed of 298 km h−1, and Hurricane Maria traversed the island on 20 September with 249 km h−1 at its landfall, incurring enormous damage to the tropical ecosystem over the island (Figure 1). Prior to the two hurricanes, Puerto Rico experienced a severe drought in 2014–2016 with the island-wide water rationing lasting for months [29]. Historically, Hurricane Georges in 1998 and Hurricane San Felipe in 1928 affected the structures of the Guánica dry forest [30].
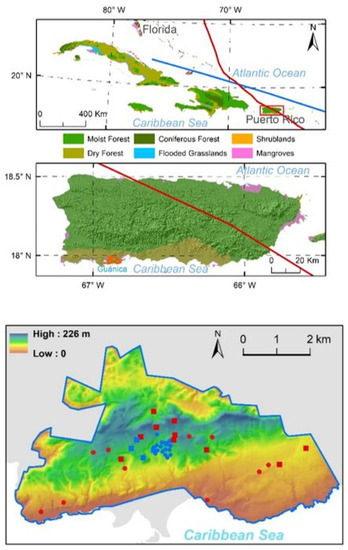
Figure 1.
Location of NEON Guánica dry forest site (upper panel). Red and blue lines indicate the paths of Hurricane Maria and Hurricane Irma in September 2017, respectively. Guánica dry forest site is located in the southwest of the island. Distribution of 20 NEON tower plots (blue dots) and 20 distributed plots (red dots) on top of the elevation map (lower panel). Squares are plots that have observations both before and after the hurricanes in 2017.
2.2. NEON Plot Ground Data Analysis
NEON started the forest structure observation in 2015 at scattered plots (Figure 1). The 20 NEON tower plots are distributed close to the instrument tower, and each plot is 40 m × 40 m with two subplots sampled, each of which is 20 m × 20 m. The 20 distributed plots of 20 m × 20 m each are scattered in the farther distance but around the tower. We acquired the forest structure observations from the NEON sites [31], and the data showed that among the 40 plots, only 10 distributed and 5 tower plots had measurements both before and after the hurricanes. The distribution of these plots almost covered all the elevation ranges from lowland, mid slope, to top of the hill (Figure 1, Table 1).

Table 1.
The 15 plots used for vegetation structural change assessment before and after the major hurricanes in September 2017.
NEON woody vegetation structural measurement includes stem height, diameter (mostly DBH ≥ 10 cm, diameter at breast height, https://data.neonscience.org/data-products/DP1.10098.001, accessed on 8 June 2021), crown diameter, etc. For this particular site with small trees and dense canopy of the dry forest, i.e., greater than 3000 stems per hectare, stem diameter ≥ 0.8 cm were measured. Among these metrics, stem height and diameter were mostly measured.
For each plot, we selected those individual stems labeled with “Live” as the plant status and stem height measured before the hurricanes and compared with their plant status and stem height after the hurricanes. We then analyzed these changes in plant status and stem height for each of the 15 plots and explored the underlying mechanisms that lead to the changes. The plant status after the hurricanes can be grouped into three categories: “Live”, “Lost”, and “Damaged”, and the latter two reflect a change in status. The “Lost” category included plant status marked as “Standing dead”, “Removed”, “Lost, fate unknown”, “Dead, broken bole”, and “Lost, presumed dead”; and the “Damaged” category included those marked as “Live, broken bole”, “Live, physically damaged”, and “Live, other damage”. The five tower plots were measured in early 2017 and early 2018 (Table 1). Nine out of the ten distributed plots were measured in 2016 and the end of 2017 to early 2018, and the remaining one (GUAN_0002) was measured in 2015 and early 2018. We assume the comparison between the measurements before and after is mostly caused by the major hurricanes in September 2017, but to a less extent, by the growth after the pulse rainfall brought by the hurricanes.
Multiple and logistic (quasibinomial) regressions were applied to explore the possible factors that contribute to the loss and/or damage of stems and the change in stem height. Quasibinomial is often used to eliminate the overdispersion of a generalized linear model. The explanatory variables are plot elevation and topographic position, the density of stems, the mean and standard deviation of stem height, and mean stem diameter. The topographic position index, representing the topographic position, was calculated as the elevation minus the average elevation of a circular neighborhood with a radius of five cells.
2.3. Canopy Height Change by Airborne Light Detection and Ranging (LiDAR)
Changes in canopy height were examined with the LiDAR-derived canopy height model (CHM). The NASA G-LiHT mission collected the LiDAR images along a few transects across the Guánica dry forest on 8 March 2017 [32], and the NEON Airborne Observation Platform (AOP) collected the LiDAR images covering the whole site on 28 May 2018. We selected the transect of PR_8March_2017_45_46, which crosses the forest and spans all the elevation range (Figure 2). The section of the transect within the NEON Guánica site was chosen for further analyses. The vertical and horizontal accuracies of both NEON [33,34] and G-LiHT images (glihtdata.gsfc.nasa.gov/, accessed on 8 June 2021) are within 1 m. Aside from the CHM images, we also used the digital surface model (DSM), digital terrain model (DTM), topographical slope and aspect, and rugosity based on the DSM. All images have a spatial resolution of 1 m. We obtained the data from the NEON data portal with the “neonUtilities” R Package and from the G-LiHT site (glihtdata.gsfc.nasa.gov/, accessed on 8 June 2021).
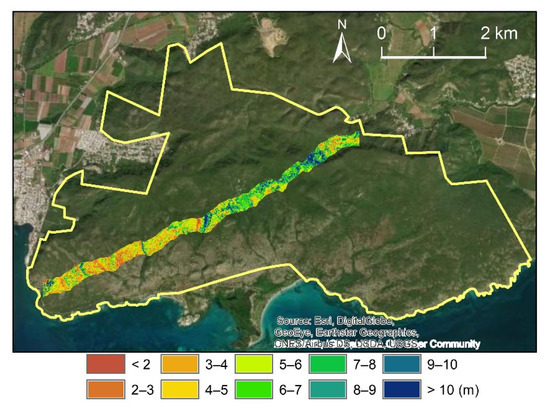
Figure 2.
Location of the transect of “PR_8March2017_45_46” flew by the NASA G-LiHT, about 7 km long and 280 m wide. The greenness indicates the canopy height measured before the hurricanes.
Both the NEON and NASA CHM were calibrated with the ground-measured stem height of the NEON plots located within the transect before performing the statistical comparison. Stem heights measured in early 2017 and early 2018 (from 1 January to 30 May) were used to calibrate the CHM of G-LiHT before the hurricanes and the CHM of NEON after the hurricanes, respectively. Changes in canopy height were obtained by subtracting the calibrated CHM before the hurricanes from the calibrated CHM after the hurricanes. We also calculated the tree cover as the proportion of pixels with canopy height above 2 m. Changes in canopy height, together with the prior-hurricane CHM, DSM, slope, aspect, tree cover, and rugosity, were averaged for a grid of 50 m within the transect.
A spatial error model was then applied to find whether and how the canopy height change depends on the prior-hurricane covariables including topography. The spatial error model [35] considers the spatial autocorrelation of error of a linear regression model as follows:
where y is the dependent variable represented as an n × 1 matrix (n, number of cases in the dataset), x is one or multiple (m) independent variables represented by an n × p matrix with p = m + 1, β is a p × 1 coefficient matrix to be estimated, and u is an n × 1 spatial error matrix. W is an n × n weight matrix determined by the neighborhood structure, λ is the spatial autocorrelation coefficient, and ε is the normal i.i.d. (independent and identically distributed) residual.
Before proceeding, we averaged all these variables over a 50 m × 50 m grid. We then divided canopy height change by the canopy height prior to the hurricanes to obtain the relative height change (), calculated a function of aspect as
with α as the aspect angle, and normalized rugosity (r), elevation (Z), and canopy height (h) to [0,1] range. Tree cover is already in the range, and cosine of aspect is in the range from −1 to 1. We then regressed spatially the relative canopy height change on the normalized covariates with the spatial error model. The spatial correlation of errors was defined within eight nearest neighboring grid cells. Variables were selected with the ANOVA model comparison. Data preparation and analyses were performed in ArcGIS (ESRI, Redlands, CA, USA) and R [36]. Error assessment was performed using R2 for the multivariate regression and the spatial error model and using the residual deviance versus the null-model (model with intercept only) deviance for the quasibinomial regression.
3. Results
3.1. Mean Change in Stem Height at Plot Level
The mean height change in the 15 plots showed that the reduction (negative change) prevailed (Figure 3) over the stimulated growth by the pulse rainfall brought by the hurricanes, 11 out of 15 plots exhibiting a reduction in mean stem height and 7 of them being significant (t-test at α = 0.05). The average mean height change at plot level was −0.14 m with a standard deviation of 0.22 m. The regression of the mean height change on topography, stem density, mean stem diameter, mean stem height, and standard deviation of the stem height measured before the hurricanes resulted in the equation via a stepwise selection of independent variables as follows:
where is the mean stem height change with negative values for damage, is the standard deviation of stem height within the plot, and is the mean stem diameter. Standard errors of the estimated parameters are shown in the parentheses. The regression yielded an of 0.59, and all the coefficients and the F-statistic were significant (p-value < 0.05). is a measurement of canopy unevenness connecting to the surface roughness. The equation implies that the roughness of the canopy tends to bring more reduction in stem height, whereas plot with trees having greater stem diameters tends to resist the reduction in stem height. Pooling the individual stems from all the 15 plots, we found a significant correlation coefficient of 0.157 between the height change and the stem diameter before the hurricanes, which means the larger the stem diameter, the less reduction was observed in height. Positive changes in plots 04, 08, 43, and 44 showed that the post-hurricane growth benefited from moisture brought by the storms exceeded the minor hurricane damage in these plots (Figure 3).
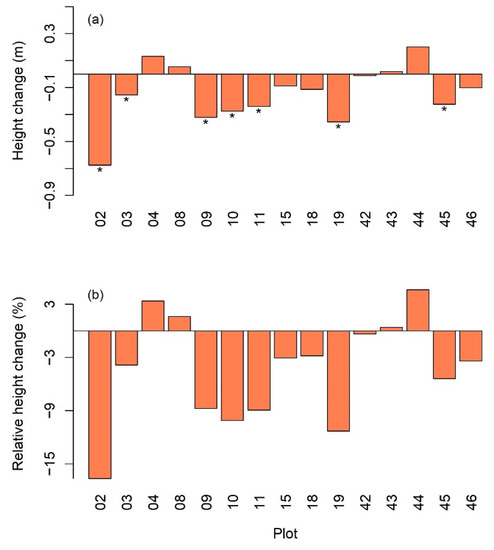
Figure 3.
(a) Mean changes in stem height in the 15 plots. The “*” under the bar indicates significant decrease at α = 0.05; (b) relative mean height change.
3.2. Lost and Damaged Stems
The number of affected stems (Figure 4), including the categories of “Lost” and “Damaged”, showed a wide range of variation with the mean ± standard deviation as 4 ± 3.7 for the number of lost stems and as 4.6 ± 4.1 for the number of damaged stems. The mean of the lost plus damaged stems was 8.6 (±4.9). The proportion of lost or damaged stems, that is, the number of lost or damaged stems divided by the total number of stems of the plot (Figure 4 lower panel), showed that the mean ± standard deviation of the fraction of the lost stem and that of the damaged stem were 2.2% ± 1.7% and 2.3% ± 1.9%, respectively. On average, 4.5% of plant stems were affected by the hurricanes.
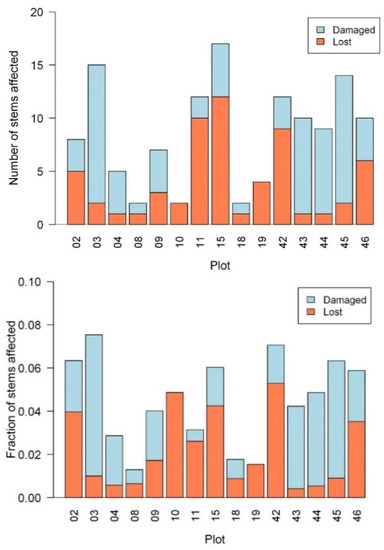
Figure 4.
The number (upper) and the fraction (lower) of affected plant stems in the 15 plots, including the categories of Lost and Damaged.
After regressing the fraction of lost stems in the plots on pertinent covariates including plot topography, the density of stems, the mean and standard deviation of stem height, and mean stem diameter with assumed quasibinomial (logit) distribution, we obtained the following equation after stepwise selection of the covariates:
where is the fraction of lost stems, and is the stem density. The regression yielded residual deviance Equation (2) of 8.56, in comparison with the null deviance (the null model with intercept only) of 16.88. All the coefficients were significant (p-value < 0.01). Therefore, the proportion of lost stems decreased significantly with the stem density. Similarly, the regression of the fraction of damaged stems gave,
where is the fraction of damaged stems and is the elevation at the plot centroid. The regression had residual deviance of 22.68, in comparison with the null deviance of 46.4. All coefficients were significant at α = 0.01, except the coefficient in front of Elev which had a p-value of 0.21. Therefore, greater canopy unevenness and higher elevation were more likely to result in more damage.
3.3. Impact at Species Level
Table 2 lists the species names with stems either lost or damaged (affected), the number of stems for each affected species in the site, the number of affected, and the percent of affected calculated as the number of affected divided by the number of stems. One of the species is marked as an unknown plant, and two of them have only their genus known. Due to the lack of complete information about the structural and functional traits, we could not analyze the relationship between impact and traits. However, the most affected species such as Gymnanthes lucida Sw., Eugenia foetida Pers., Bucida buceras L., Croton lucidus L., Thouinia striata, and Guaiacum sanctum L. are recorded as hardwood species (http://tropical.theferns.info/, accessed on 8 June 2021). The six species constituted more than 52% of all the affected stems. From the global wood density database [37], we found the wood density of 10 major species including Bursera simaruba (L.) Sarg., Cocoloba diversifolia Jacq., Exostema caribaeum (Jacq.) Schult., Guaiacum officinale L., Guaiacum sanctum L., Gymnathes lucida Sw., Leucaena leucocephala (Lam.) de Wit, Pictetia aculeata (Vahl) Urb., Swietenia mahagonia (L.) Jacq., and Thouinia striata. However, the percent of affected (fourth column in Table 2) did not have a significant correlation with the wood density of the 10 species. In the study of the impact of Hurricane Georges on the Guánica dry forest in 1998, van Bloem and Murphy [38] also found wood density did not play a significant role in resisting hurricane damage. However, they found the pioneer species in the forest were damaged more.
Table 2.
The affected species (encountering lost or/and damaged stem), number of stems, number of affected, and proportion of affected in the 15 plots at NEON Guánica dry forest site.
3.4. LiDAR-Derived Canopy Height Change along the Transect
Averaging the pixels across the width direction of the transect, we found that canopy height change was correlated with both prior-hurricane canopy height and tree cover. Canopy height change was mostly negative in the lower left of the transect with relatively lower tree cover and average canopy height but positive in part of the upper-right section with greater tree cover and average canopy height (Figure 5a,b). On average, the canopy height decreased by 0.23 m, in comparison with a 0.14 m decrease in stem height from plot measurement, probably because ground stem height only measures the top height of the stems, whereas LiDAR-derived canopy height includes both treetop and canopy foliage. At 50 m × 50 m grid scale, spatial regression of the relative canopy height change (), i.e., canopy height change divided by the canopy height prior to the hurricanes, on the normalized covariates resulted in the following Equation:
where C and hc are prior-hurricane tree cover and normalized canopy height, respectively, with α as the aspect angle, and r is normalized rugosity. The model had a regression standard error of 0.03, in comparison with the range of relative canopy height as [–0.6, 0.17]. All the coefficients had p-values less than 0.01. The spatial error model did not provide a statistic similar to that of R2; however, we calculated a similar value of 0.81 based on the definition of the ordinary linear model (Figure 5d). The spatial autocorrelation coefficient, λ, was estimated as 0.79. The regression showed that increased with C and hc in a second-order (squared) fashion; however, decreases with r derived from the digital surface model. As negative indicates decreased canopy height or damaged canopy, the result implied that canopy height reduction was resisted by the tree cover, canopy height when the canopy was low or moderate, but promoted by the rugosity, canopy height when the canopy was high. The aspect function made southwest as +1 and northeast as −1, so that the result showed that slopes facing southwest experienced more damage than slopes facing northeast, using Equation (4).
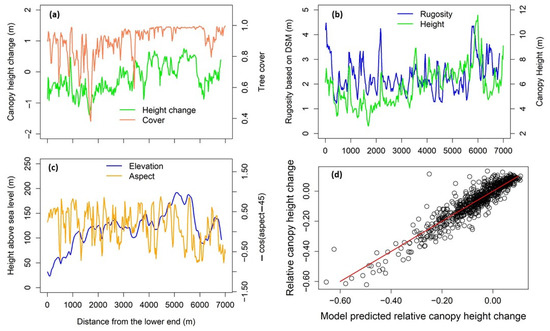
Figure 5.
The canopy height change calculated by subtracting the LiDAR-derived canopy height model on 8 March 2017 from the LiDAR-derived canopy height model on 28 May 2018 along the transect within the Guánica forest (a): tree cover (a), rugosity based on digital surface model (DSM) (b), canopy height (b), elevation (c), and cosine function of aspect (c) were derived from the G-LiHT LiDAR data, indicating the status before the hurricanes. The predicted versus monitored relative canopy height change is shown in (d).
4. Discussion
Instead of using the individual-level tree traits to explain the hurricane damage, we integrated the NEON ground observations of vegetation structure and the airborne LiDAR-derived continuous structural information, which allowed us to use forest stands as base units to explore the underlying mechanisms of ecosystem resistance to hurricanes. Our analyses of the response of the tropical dry forest in Guánica to major hurricanes highlighted the importance of stand-level parameters such as stem density and rugosity. At the stand level, trees function interactively to resist wind damage. The results are aligned with recent modeling studies reporting that stand-level characteristics play more important roles in wind damage to forests, compared to the individual-level characteristics [11,18].
At the stand level, stem density is one of the primary parameters as seen in Equation (2). A forest can be viewed as a windbreak system. In general, the denser the stems are, the denser the canopy, and the more support among trees with the interaction of their branches and leaves in the wind. The bending of stems and branches and friction among leaves dissipate the wind energy. Stem density is especially important for tropical dry forests with small trees to resist winds. The NEON Guánica dry forest has a mean density of 3990 ± 2250 stems ha−1 in the 15 plots, whereas the estimated mean density for the tropical moist forest is around 800 globally [39] and 2278 ha−1 for a moist forest in the same island [40]. Even for a forest with large trees and low apparent density, two or multiple trees growing together can support each other [41]. For a stand with low density, wind speed inside the canopy will be higher than that of a denser stand [11], thus leading to more severe wind damage.
Mean stem diameter is another essential parameter to resist forest height reduction as seen in Equation (1). Wind force at the canopy constitutes a turning moment to snap or uproot trees. In the Amazon forest, the strength to sustain a large turning moment is positively correlated to the DBH of the experimental trees [11,42]. Trees with larger DBH are more resistant to snapping or uprooting. A recent study of tree adaptation and acclimation to wind based on long-term windthrow datasets also revealed that taper or lower height:diameter ratio was related to reduced wind damage [12,19]. The forest risk model ForestGALES [43] indicates that critical wind speed to rupture stems is proportional to the order of 3/2 of stem diameter and to the stem density, aligned with our findings in the tropical dry forest as seen in Equations (1) and (2).
The standard deviation of stem heights is an index for unevenness of the canopy height reflecting surface roughness or rugosity as derived from the digital surface model (Figure 5). We found that the rugosity is important in explaining the reduction of stem height or canopy height (Equations (1) and (4)) and the proportion of damaged stems (Equation (3)) during major hurricanes. Storm intensity increases with surface roughness [44], which implies that higher surface roughness tends to bring more damage. More surface roughness makes a boundary layer thinner [45] so that storm winds can traverse the forest with a faster speed at the lower height to bring more damage. Hence, a forest with a uniform stem height is resistant to hurricane damage. Surface roughness can be enhanced by forests with emergent high trees or exceedingly low stem density with heterogeneous height arrangements, which may create gaps. During strong winds, emergent high trees might be knocked down first due to the negative correlation between critical wind speed to topple trees and tree height, and then greater wind penetration into the stand through the newly created gaps might induce higher wind load to the remaining trees [11]. Therefore, more damages are expected as gaps propagate. As to a specific case of plantations, in general, they have uniform stem height and simple structure. When the storm wind is lower than the critical wind speed to topple trees, plantations are expected to resist wind damage due to low surface roughness. However, due to their simple structure, plantation trees have similar critical wind speed to topple trees. Therefore, when the wind exceeds the critical wind speed to topple plantation trees, few trees could resist the winds, and the structure might collapse [20].
Topography-related factors, such as elevation, topographic position, and aspect, reflect the exposure of forests to different wind speeds during storms. The higher the elevation, the stronger the hurricane winds encountered, thus more damage, e.g., Equation (3) [46]. The Guánica dry forest, located at the left side of hurricanes Irma and Maria, which spun counterclockwise and moved toward the northwest, might encounter the strongest winds coming from the west to southwest, and our results showed that more damages (Equation (4)) were associated with areas facing southwest.
Our model for LiDAR-detected change in canopy height along a transect Equation (4) basically confirms the finding with the ground plot measurements in Equations (1)–(3). Tree cover may be associated with stem density if the crown size is relatively uniform, which is approximately the case in this dry forest with dense stems of small trees. Higher tree cover might imply higher stem density and fewer gaps so that trees help each other to resist damage. Higher tree cover might also indicate a higher leaf area index (LAI), whereas gust wind is negatively related to LAI [11,47]. Therefore, a larger tree cover might weaken gust wind and reduce wind damage. Canopy rugosity derived from DSM Equation (4) and stem height unevenness Equations (1) and (3) both tend to enlarge wind damage. We found a significant Pearson’s correlation coefficient of 0.65 between stem diameter and stem height in the NEON ground measurements. Hence, a greater mean canopy height in the low and moderate range may indicate a greater mean stem diameter. We also found a significant correlation of 0.63 between tree cover and mean canopy height derived from LiDAR. Therefore, a higher canopy may also mean greater tree cover to resist wind damage. Mean canopy height is negatively correlated to the gust wind profile [11,47] and thus tends to protect the emergent trees, which agrees with the role of mean canopy height in Equation (4).
On average, 4.5% of stems in the Guánica forest were affected by the hurricanes in 2017, similar to the impact of Hurricane Gilbert on the subtropical dry forest in Jamaica in 1988 with 5% structural damage [48] and that of Hurricane David on a dry forest in Dominica in 1979 with 4% [49]. Hurricane Georges in 1998 caused 12.4% structural damage to the Guánica forest [38], probably because the path of Georges was much closer to the forest than the hurricanes in 2017; however, the 2% of lost stems in this study is close to the 2% mortality nine months after Hurricane Georges [30]. In the Guánica dry forest, the conspecific percentage of affected stems was on average 2.7% when only the known species having at least 10 stems were counted (Table 2).
Puerto Rico experienced a severe drought in 2014–2016, and the large pulse rain brought by the major hurricanes in 2017 might release the drought stress (e.g., positive height change in Figure 3) and help the recovery of the dry forest [24]. Climate models predict intensified climate variability [50,51], and tropical dry forests might face increasing extreme climate events [52]. While tropical dry forests have adapted to moisture-deficit environments and might show resistance to further drought, a recent review still pointed out that altered species distribution and ecosystem processes are likely in the altered rainfall regime [8]. A great challenge to be addressed by future studies would be the resistance and resilience of tropical dry forests in response to alternating severe drought and major storms.
5. Conclusions
Tropical dry forests are vulnerable to hurricane disturbances and function differently from tropical moist or wet forests in their response, resistance, and recovery after the disturbances. As individuals’ functional traits prevail in the literature on hurricanes’ impact, we hereby addressed it at forest stand level and tried to answer how trees in tropical dry forest work together to combat the wind damage. To achieve this, we integrated the NEON ground observations of ecosystem structure with the airborne-LiDAR-derived continuous structural information, which allowed us to use forest stand as a base unit to explore the underlying mechanisms of ecosystem resistance of the NEON Guánica dry forest to the two major hurricanes of Irma and Maria in 2017. Our results highlighted the mutual supports among trees during storms and the important roles of stand-level collective parameters such as stem density and rugosity in resisting wind damages to the tropical dry forest. At the stand level, trees function interactively to resist wind damage, especially in the case of tropical dry forests with low profile but dense canopy. The conclusion on the tropical dry forest reemphasizes the finding from recent modeling studies, namely, that stand-level characteristics are more essential in explaining wind damage to forests, compared to the individual-level characteristics. Coupling remote sensing with ground observations provides an effective and promising approach to advancing our mechanistic understanding of ecosystem responses to disturbances.
Author Contributions
Conceptualization, Q.G. and M.Y.; methodology, Q.G. and M.Y.; formal analysis, Q.G. and M.Y.; writing—original draft preparation, Q.G.; writing—review and editing, Q.G. and M.Y. Both authors have read and agreed to the published version of the manuscript.
Funding
This research is supported by NASA EPSCoR and NOAA Puerto Rico Sea Grant.
Institutional Review Board Statement
Not applicable.
Informed Consent Statement
Not applicable.
Data Availability Statement
Publicly available datasets were analyzed in this study. This data can be found here: https://data.neonscience.org/data-products/explore, accessed on 8 June 2021, and https://glihtdata.gsfc.nasa.gov/, accessed on 8 June 2021.
Acknowledgments
We acknowledge NEON for providing the ecosystem structure data and the LiDAR after the hurricanes, publicly available at the NEON data portal (https://data.neonscience.org/data-products/explore, accessed on 8 June 2021), and NASA for providing the LiDAR data before the hurricanes, publicly accessible at NASA G-LiHT (https://glihtdata.gsfc.nasa.gov/, accessed on 8 June 2021).
Conflicts of Interest
The authors declare no conflict of interest. The funders had no role in the design of the study; in the collection, analyses, or interpretation of data; in the writing of the manuscript, or in the decision to publish the results.
References
- Murphy, P.G.; Lugo, A.E. Ecology of Tropical Dry Forest. Annu. Rev. Ecol. Syst. 1986, 17, 67–88. [Google Scholar] [CrossRef]
- Holdrige, L.R. Life Zone Ecology; Tropical Science Center: San Jose, Coast Rica, 1967. [Google Scholar]
- Holm, J.A.; Van Bloem, S.J.; Larocque, G.R.; Shugart, H.H. Shifts in biomass and productivity for a subtropical dry forest in response to simulated elevated hurricane disturbances. Environ. Res. Lett. 2017, 12, 025007. [Google Scholar] [CrossRef]
- Schlesinger, W.H.; Bernhardt, E.S. Biogeochemistry—An Analysis of Global Change; Academic Press: Boston, MA, USA, 2013. [Google Scholar]
- Stan, K.; Sanchez-Azofeifa, A. Tropical Dry Forest Diversity, Climatic Response, and Resilience in a Changing Climate. Forests 2019, 10, 443. [Google Scholar] [CrossRef]
- Powers, J.S.; Feng, X.; Sanchez-Azofeifa, A.; Medvigy, D. Focus on tropical dry forest ecosystems and ecosystem services in the face of global change. Environ. Res. Lett. 2018, 13, 090201. [Google Scholar] [CrossRef]
- Álvarez-Yépiz, J.C.; Martínez-Yrízar, A.; Fredericksen, T.S. Special Issue: Resilience of tropical dry forests to extreme disturbance events. For. Ecol. Manag. 2018, 426, 1–6. [Google Scholar] [CrossRef]
- Allen, K.; Dupuy, J.M.; Gei, M.G.; Hulshof, C.; Medvigy, D.; Pizano, C.; Salgado-Negret, B.; Smith, C.M.; Trierweiler, A.; Van Bloem, S.J.; et al. Will seasonally dry tropical forests be sensitive or resistant to future changes in rainfall regimes? Environ. Res. Lett. 2017, 12, 023001. [Google Scholar] [CrossRef]
- Waring, B.; Powers, J. Overlooking what is underground: Root:shoot ratios and coarse root allometric equations for tropical forests. For. Ecol. Manag. 2017, 385, 10–15. [Google Scholar] [CrossRef][Green Version]
- Qi, Y.; Wei, W.; Chen, C.; Chen, L. Plant root-shoot biomass allocation over diverse biomes: A global synthesis. Glob. Ecol. Conserv. 2019, 18, e00606. [Google Scholar] [CrossRef]
- Peterson, C.J.; Ribeiro, G.H.P.d.M.; Negrón-Juárez, R.; Marra, D.M.; Chambers, J.Q.; Higuchi, N.; Lima, A.; Cannon, J.B. Critical wind speeds suggest wind could be an important disturbance agent in Amazonian forests. For. Int. J. For. Res. 2019, 92, 444–459. [Google Scholar] [CrossRef]
- Gardiner, B.; Achim, A.; Nicoll, B.; Ruel, J.-C. Understanding the interactions between wind and trees: An introduction to the IUFRO 8th Wind and Trees Conference (2017). For. Int. J. For. Res. 2019, 92, 375–380. [Google Scholar] [CrossRef]
- Feldpausch, T.R.; Banin, L.; Phillips, O.L.; Baker, T.R.; Lewis, S.L.; Quesada, C.A.; Affum-Baffoe, K.; Arets, E.J.M.M.; Berry, N.J.; Bird, M.; et al. Height-diameter allometry of tropical forest trees. Biogeosciences 2011, 8, 1081–1106. [Google Scholar] [CrossRef]
- Curran, T.J.; Brown, R.L.; Edwards, E.; Hopkins, K.; Kelley, C.; Mccarthy, E.; Pounds, E.; Solan, R.; Wolf, J. Plant functional traits explain interspecific differences in immediate cyclone damage to trees of an endangered rainforest community in north Queensland. Austral Ecol. 2008, 33, 451–461. [Google Scholar] [CrossRef]
- Reich, P.B.; Uhl, C.; Walters, M.B.; Ellsworth, D.S. Leaf lifespan as a determinant of leaf structure and function among 23 amazonian tree species. Oecologia 1991, 86, 16–24. [Google Scholar] [CrossRef]
- Angelou, N.; Dellwik, E.; Mann, J. Wind load estimation on an open-grown European oak tree. For. Int. J. For. Res. 2019, 92, 381–392. [Google Scholar] [CrossRef]
- Antúnez, I.; Retamosa, E.C.; Villar, R. Relative growth rate in phylogenetically related deciduous and evergreen woody species. Oecologia 2001, 128, 172–180. [Google Scholar] [CrossRef] [PubMed]
- Hart, E.; Sim, K.; Kamimura, K.; Meredieu, C.; Guyon, D.; Gardiner, B. Use of machine learning techniques to model wind damage to forests. Agric. For. Meteorol. 2019, 265, 16–29. [Google Scholar] [CrossRef]
- Moore, J.; Lin, Y. Determining the extent and drivers of attrition losses from wind using long-term datasets and machine learning techniques. For. Int. J. For. Res. 2019, 92, 425–435. [Google Scholar] [CrossRef]
- Morimoto, J.; Nakagawa, K.; Takano, K.T.; Aiba, M.; Oguro, M.; Furukawa, Y.; Mishima, Y.; Ogawa, K.; Ito, R.; Takemi, T.; et al. Comparison of vulnerability to catastrophic wind between Abies plantation forests and natural mixed forests in northern Japan. For. Int. J. For. Res. 2019, 92, 436–443. [Google Scholar] [CrossRef]
- Uriarte, M.; Thompson, J.; Zimmerman, J.K. Hurricane María tripled stem breaks and doubled tree mortality relative to other major storms. Nat. Commun. 2019, 10, 1362. [Google Scholar] [CrossRef] [PubMed]
- Beard, K.H.; Vogt, K.A.; Vogt, D.J.; Scatena, F.N.; Covich, A.P.; Sigurdardottir, R.; Siccama, T.G.; Crowl, T.A. Structural and functional responses of a subtropical forest to 10 years of hurricanes and droughts. Ecol. Monogr. 2005, 75, 345–361. [Google Scholar] [CrossRef]
- Miller, P.W.; Kumar, A.; Mote, T.L.; Moraes, F.D.S.; Mishra, D.R. Persistent Hydrological Consequences of Hurricane Maria in Puerto Rico. Geophys. Res. Lett. 2019, 46, 1413–1422. [Google Scholar] [CrossRef]
- Yu, M.; Gao, Q. Topography, drainage capability, and legacy of drought differentiate tropical ecosystem response and recovery to major hurricanes. Environ. Res. Lett. 2020, 15, 104046. [Google Scholar] [CrossRef]
- Lugo, A.E. Visible and invisible effects of hurricanes on forest ecosystems: An international review. Austral Ecol. 2008, 33, 368–398. [Google Scholar] [CrossRef]
- Stovall, A.E.L.; Shugart, H.; Yang, X. Tree height explains mortality risk during an intense drought. Nat. Commun. 2019, 10, 4385. [Google Scholar] [CrossRef]
- Atkins, J.W.; Bohrer, G.; Fahey, R.T.; Hardiman, B.S.; Morin, T.H.; Stovall, A.E.L.; Zimmerman, N.; Gough, C.M. Quantifying vegetation and canopy structural complexity from terrestrial LiDAR data using the forestr r package. Methods Ecol. Evol. 2018, 9, 2057–2066. [Google Scholar] [CrossRef]
- Eisemann, E.; Dunkin, L.; Hartman, M.; Wozencraft, J. JALBTCX/NCMP emergency-response airborne Lidar coastal mapping & quick response data products for 2016/2017/2018 hurricane impact assessments. Shore Beach 2019, 87, 31–40. [Google Scholar] [CrossRef]
- Herrera, D.A.; Ault, T.R.; Fasullo, J.T.; Coats, S.J.; Carrillo, C.M.; Cook, B.I.; Williams, A.P. Exacerbation of the 2013-2016 Pan-Caribbean Drought by Anthropogenic Warming. Geophys. Res. Lett. 2018, 45, 10619–10626. [Google Scholar] [CrossRef]
- Van Bloem, S.J.; Murphy, P.G. The inflluence of hurricane winds on Caribbean dry forest structure and nutrient pools. Biotropica 2005, 37, 571–583. [Google Scholar] [CrossRef]
- National Ecological Observation Networks. NEON DP1.10098.001; Battelle: Boulder, CO, USA, 2020; Available online: http://data.neonscience.org (accessed on 15 January 2020).
- Cook, B.; Corp, L.; Nelson, R.; Middleton, E.; Morton, D.; McCorkel, J.; Masek, J.; Ranson, K.; Ly, V.; Montesano, P. NASA Goddard’s LiDAR, Hyperspectral and Thermal (G-LiHT) Airborne Imager. Remote Sens. 2013, 5, 4045. [Google Scholar] [CrossRef]
- National Ecological Observatory Networks. Ecosystem Structure (DP3.30015.001); National Ecological Observatory Network (NEON); Battelle: Boulder, CO, USA, 2021. [Google Scholar] [CrossRef]
- National Ecological Observatory Networks. Elevation—LiDAR (DP3.30024.001); National Ecological Observatory Network (NEON); Battelle: Boulder, CO, USA, 2021. [Google Scholar] [CrossRef]
- Anselin, L.; Griffith, D.A. Do Spatial Effecfs Really Matter in Regression Analysis? Pap. Reg. Sci. 1988, 65, 11–34. [Google Scholar] [CrossRef]
- R Core Team. R: A Language and Environment for Statistical Computing; R Foundation for Statistical Computing: Vienna, Austria, 2017; Available online: https://www.gbif.org/tool/81287/r-a-language-and-environment-for-statistical-computing (accessed on 8 June 2021).
- Chave, J.; Coomes, D.; Jansen, S.; Lewis, S.L.; Swenson, N.G.; Zanne, A.E. Towards a worldwide wood economics spectrum. Ecol. Lett. 2009, 12, 351–366. [Google Scholar] [CrossRef]
- Van Bloem, S.J.; Lugo, A.E.; Murphy, P.G. Structural response of Caribbean dry forests to hurricane winds: A case study from Guanica Forest, Puerto Rico. J. Biogeogr. 2006, 33, 517–523. [Google Scholar] [CrossRef]
- Crowther, T.W.; Glick, H.B.; Covey, K.R.; Bettigole, C.; Maynard, D.S.; Thomas, S.M.; Smith, J.R.; Hintler, G.; Duguid, M.C.; Amatulli, G.; et al. Mapping tree density at a global scale. Nature 2015, 525, 201–205. [Google Scholar] [CrossRef]
- Frangi, J.L.; Lugo, A. Hurricane damage to a flood plain forests in the Luquillo mountain of Puerto Rico. Biotropica 1991, 23, 324–335. [Google Scholar] [CrossRef]
- Duryea, M.L.; Kampf, E. Wind and Trees: Lessons Learned from Hurricanes; Institute of Food and Agricultural Sciences Extension, University of Florida: Gainesville, FL, USA, 2017. [Google Scholar]
- Ribeiro, G.H.P.M.; Chambers, J.Q.; Peterson, C.J.; Trumbore, S.E.; Magnabosco Marra, D.; Wirth, C.; Cannon, J.B.; Négron-Juárez, R.I.; Lima, A.J.N.; de Paula, E.V.C.M.; et al. Mechanical vulnerability and resistance to snapping and uprooting for Central Amazon tree species. For. Ecol. Manag. 2016, 380, 1–10. [Google Scholar] [CrossRef]
- Hale, S.E.; Gardiner, B.; Peace, A.; Nicoll, B.; Taylor, P.; Pizzirani, S. Comparison and validation of three versions of a forest wind risk model. Environ. Model. Softw. 2015, 68, 27–41. [Google Scholar] [CrossRef]
- Zhu, P. Impact of land-surface roughness on surface winds during hurricane landfall. Q. J. R. Meteorol. Soc. 2008, 134, 1051–1057. [Google Scholar] [CrossRef]
- Nilsson, E.D. Planetary boundary layer structure and air mass transport during the International Arctic Ocean Expedition 1991. Tellus B 1996, 48, 178–196. [Google Scholar] [CrossRef][Green Version]
- Hu, T.; Smith, R.B. The Impact of Hurricane Maria on the Vegetation of Dominica and Puerto Rico Using Multispectral Remote Sensing. Remote Sens. 2018, 10, 827. [Google Scholar] [CrossRef]
- Santana, R.A.S.d.; Dias-Júnior, C.Q.; Vale, R.S.d.; Tóta, J.; Fitzjarrald, D.R. Observing and Modeling the Vertical Wind Profile at Multiple Sites in and above the Amazon Rain Forest Canopy. Adv. Meteorol. 2017, 2017, 5436157. [Google Scholar] [CrossRef]
- Wunderle, J.J.; Lodge, D.; Waide, R. Short-Term Effects of Hurricane Gilbert on Terrestrial Bird Populations on Jamaica. Auk 1992, 109, 148–166. [Google Scholar] [CrossRef]
- Lugo, A.E.; Applefield, M.; Pool, D.J.; McDonald, R.B. The impact of Hurricane David on the forests of Dominica. Can. J. For. Res. 1983, 13, 201–211. [Google Scholar] [CrossRef]
- Cai, W.J.; Wang, G.J.; Santoso, A.; McPhaden, M.J.; Wu, L.X.; Jin, F.F.; Timmermann, A.; Collins, M.; Vecchi, G.; Lengaigne, M.; et al. Increased frequency of extreme La Nina events under greenhouse warming. Nat. Clim. Chang. 2015, 5, 132–137. [Google Scholar] [CrossRef]
- Cai, W.J.; Borlace, S.; Lengaigne, M.; van Rensch, P.; Collins, M.; Vecchi, G.; Timmermann, A.; Santoso, A.; McPhaden, M.J.; Wu, L.X.; et al. Increasing frequency of extreme El Nino events due to greenhouse warming. Nat. Clim. Chang. 2014, 4, 111–116. [Google Scholar] [CrossRef]
- Feng, X.; Porporato, A.; Rodriguez-Iturbe, I. Changes in rainfall seasonality in the tropics. Nat. Clim. Chang. 2013, 3, 811–815. [Google Scholar] [CrossRef]
Publisher’s Note: MDPI stays neutral with regard to jurisdictional claims in published maps and institutional affiliations. |
© 2021 by the authors. Licensee MDPI, Basel, Switzerland. This article is an open access article distributed under the terms and conditions of the Creative Commons Attribution (CC BY) license (https://creativecommons.org/licenses/by/4.0/).