1. Introduction
An important advance in the field of earth observation is the discovery of spectral indices, they have proved their effectiveness in surface description. Several studies have been conducted using remote sensing indices, often applied to a specific field of study like evaluations of vegetation cover, vigor, or growth dynamics [
1,
2,
3,
4] for precision agriculture using multi-spectral sensors. Some spectral indices have been developed using RGB or HSV color space to detect vegetation from ground cameras [
5,
6,
7]. Remote sensing indices can also be used for other surfaces analysis like water, road, snow [
8] cloud [
9] or shadow [
10].
There are two main problems with these indices. Firstly they are almost all empirically defined, although the selection of wavelengths comes from observation, like NDVI for vegetation indices. It is possible to obtain better spectral combinations or equations to characterize a surface with specific acquisitions parameters. It is important to optimize upstream the index, as the data transformation leads to a loss of essential information and features for classification [
11]. Most studies have tried to optimize some parameters of existing indices. For example, an optimization of NDVI
was proposed by [
12] under the name of WDRVI (Wide Dynamic Range Vegetation Index)
. The author tested different values for
between 0 and 1. The ROC curve was used to determine the best coefficient for a given ground truth. Another optimized NDVI was designed and named EVI (Enhanced Vegetation Index). It takes into account the blue band for atmospheric resistance by including various parameters
, where
are respectively the gain factor and the canopy background adjustment, in addition the coefficients
are used to compensate for the influence of clouds and shadows. Many other indices can be found in an online database of indices (IDB:
www.indexdatabase.de accessed 10 August 2019) [
10] including the choice of wavelengths and coefficients depending on the selected sensors or applications. But none of the presented indices are properly optimized. Thus, in the standard approach, the best index is determined by testing all available indices against the spectral bands of the selected sensor with a Pearson correlation between these indices and a ground truth [
13,
14]. Furthermore, correlation is not the best estimator because it neither considers the class ratio nor the shape of the obtained segmentation and may again result in a non-optimal solution for a specific segmentation task. Finally, these indices are generally not robust because they are still very sensitive to shadows [
11]. For vegetation, until recently, all of the referenced popular indices were man-made and used few spectral bands (usually NIR, red, sometimes blue or RedEdge).
The second problem with standard indices is that they work with reflectance-calibrated data. Three calibration methods can be used in proximal-sensing. (i) The first method use an image taken before acquisition containing a color patch as a reference [
15,
16], and is used for correction. The problem with this approach is that if the image is partially shaded, the calibration is only relevant on the non-shaded part. Moreover ideally the reference must be updated to reduce the interference of weather change on the spectrum measurement, which is not always possible since it’s a human task. (ii) An other method is the use of an attached sunshine sensor [
17], which also requires calibration but does not allow to correct a partially shaded image. (iii) The last method is the use of a controlled lighting environment [
18,
19], e.g., natural light is suppressed by a curtain and replaced by artificial lighting. All of these approaches are sometimes difficult to implement for automatic, outdoor use, and moreover in real time like detecting vegetation while a tractor is driving through a crop field.
In recent years, machine learning algorithms have been increasingly used to improve the definition of presented indices in the first main problem. Some studies favor the use of multiple indices and advanced classification techniques (RandomForest, Boosting, DecisionTree, etc.) [
4,
20,
21,
22,
23,
24]. Another study has proposed to optimize the weights in an NDVI equation form based on a genetic algorithm [
25] but does not optimize the equation forms. An other approach has been proposed to automatically construct a vegetation index using a genetic algorithm [
26]. They optimize the equation forms by building a set of arithmetic graphs with mutations, crossovers and replications to change the shape of each equation during learning but it does not take into account the weights, since it’s use calibrated data. Finally, with the emergence of deep learning, current studies try to adapt popular CNN architectures (UNet, AlexNet, etc.) to earth observation applications: [
27,
28,
29,
30].
However there is no study that optimize both the equation forms and spectral bands weights. The present study explicitly optimize both of them by looking for a form of remote sensing indices by learning weights in functions approximators. These functions approximators will then reconstruct any equation forms of the desired remote sensing index for a given acquisition system. To solve the presented second problem, this study evaluates the functions approximators on an uncalibrated dataset containing various acquisition conditions. This is not a common approach but can be found in the literature [
31,
32]. This will lead to creating indices that do not require data calibration. The deep learning framework has been used as a general regression toolkit. Thus, several CNN function approximators architectures are proposed. DeepIndices is presented as a regression problem, which is totally new, as is the use of signal and image processing.
4. Results and Discussion
4.1. Fixed Models
All standard vegetation models have been optimized using the same training and validation datasets. Each of them has been optimized using a min-max normalization followed by a single
2D convolution layer and a last clipped ReLU activation function is used like the generic models implemented. The top nine standard indices are presented in
Table 2. Their respective equations are available in
Table A1 in
Appendix A.
It is interesting to note that most of them are very similar to NDVI indices in their form. This shows that according to all previous studies, these forms based on a ratio of linear combination are the most stable against light variation. For example the following NDVI based indices are tested and show very different performances, highlighting the importance of weight optimization:
The Modified Triangular Vegetation Index 1 is given by which shows that a simple linear combination can be as much efficient as NDVI like indices by taking one additional spectral band () and more adapted coefficients. However, the other 80 spectral indices do not seem to be stable against of light variation and saturation. It is thus not relevant to present them.
4.2. Deepindices
Finally, each baseline model such as
linear,
linear ratio,
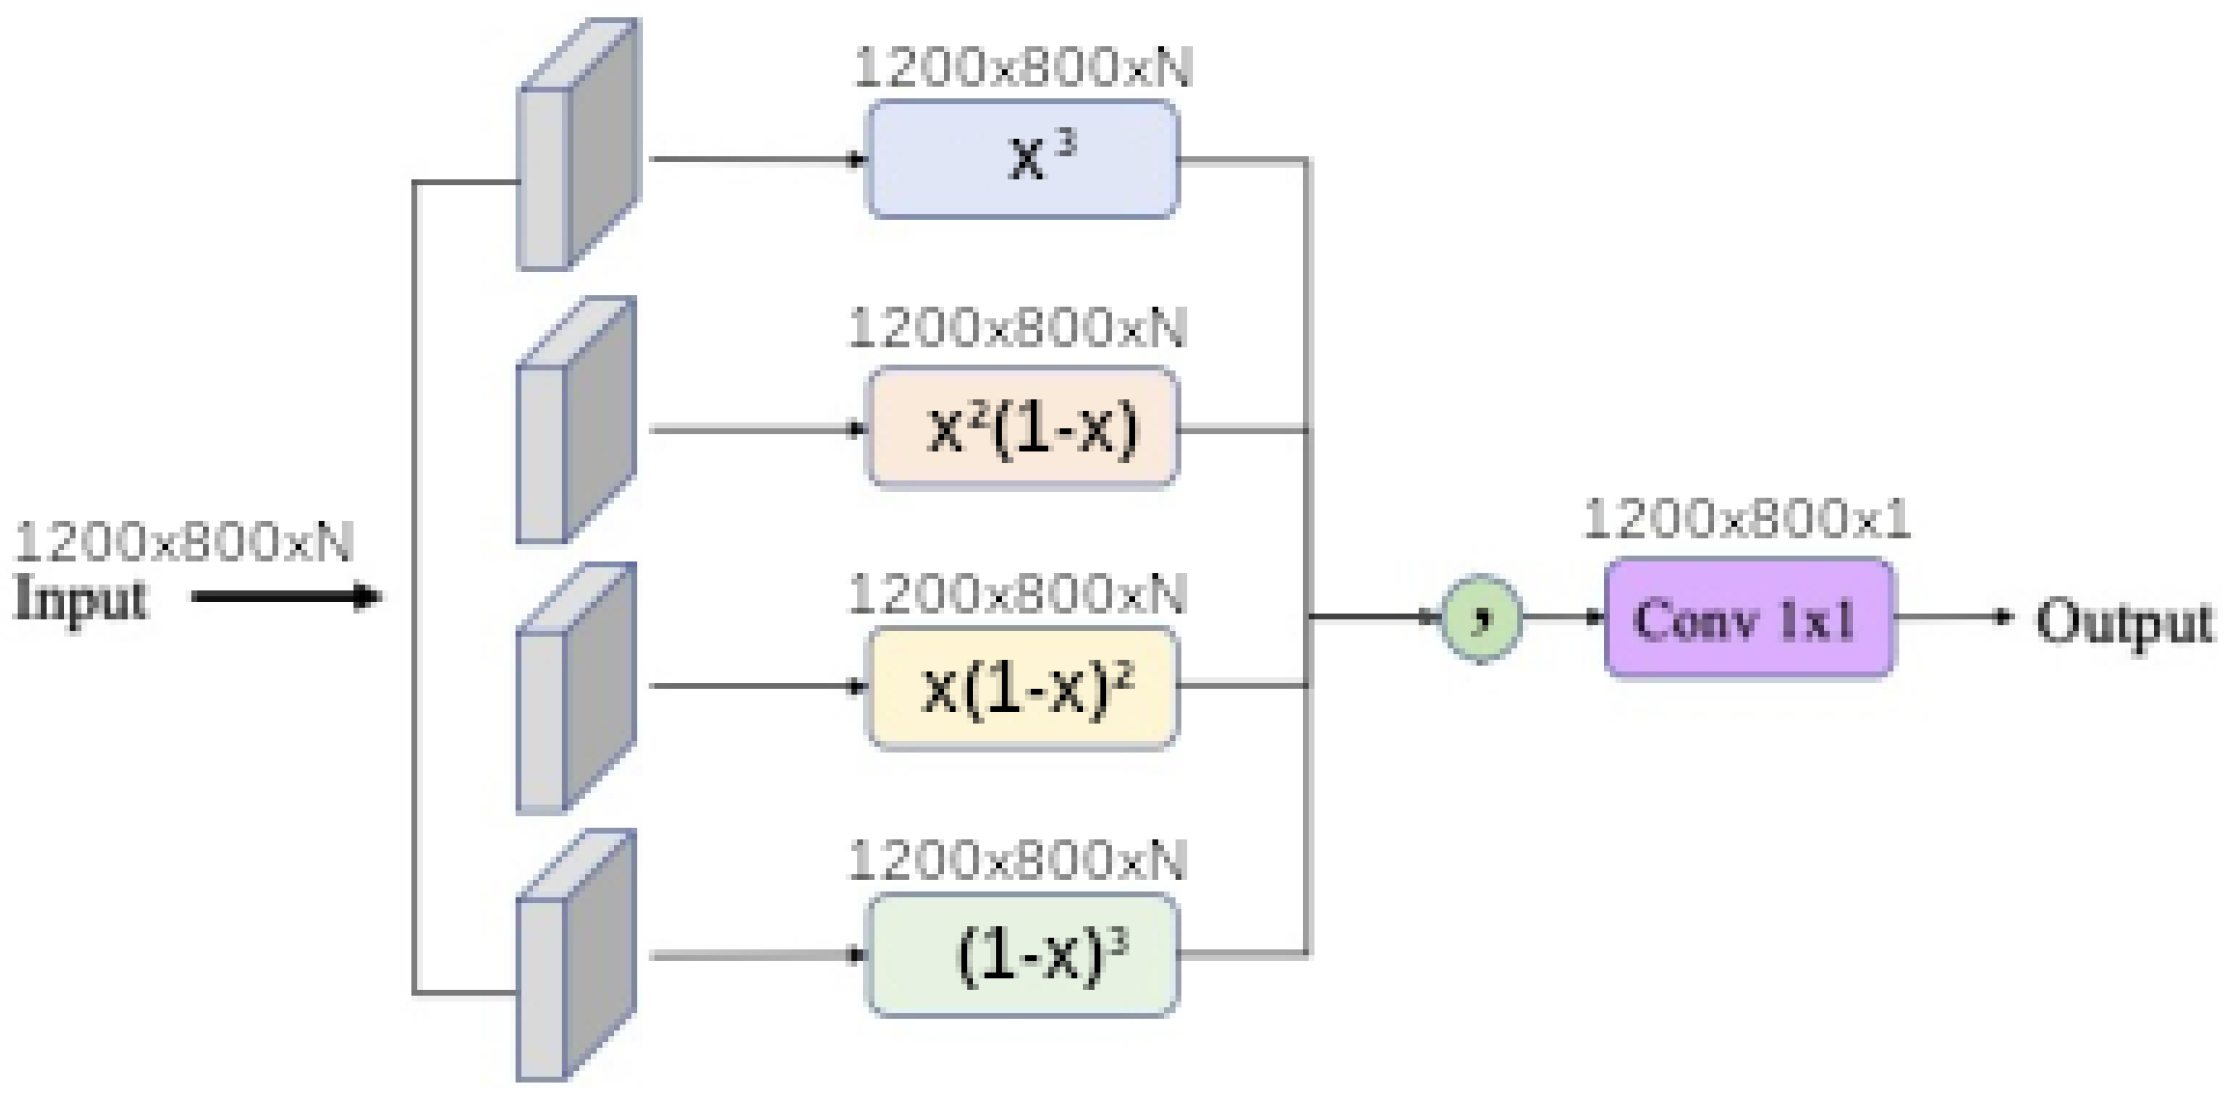
polynomial,
universal function approximation and
dense morphological function approximation are evaluated with 4 different modalities of each kernel size
,
,
and
. In addition
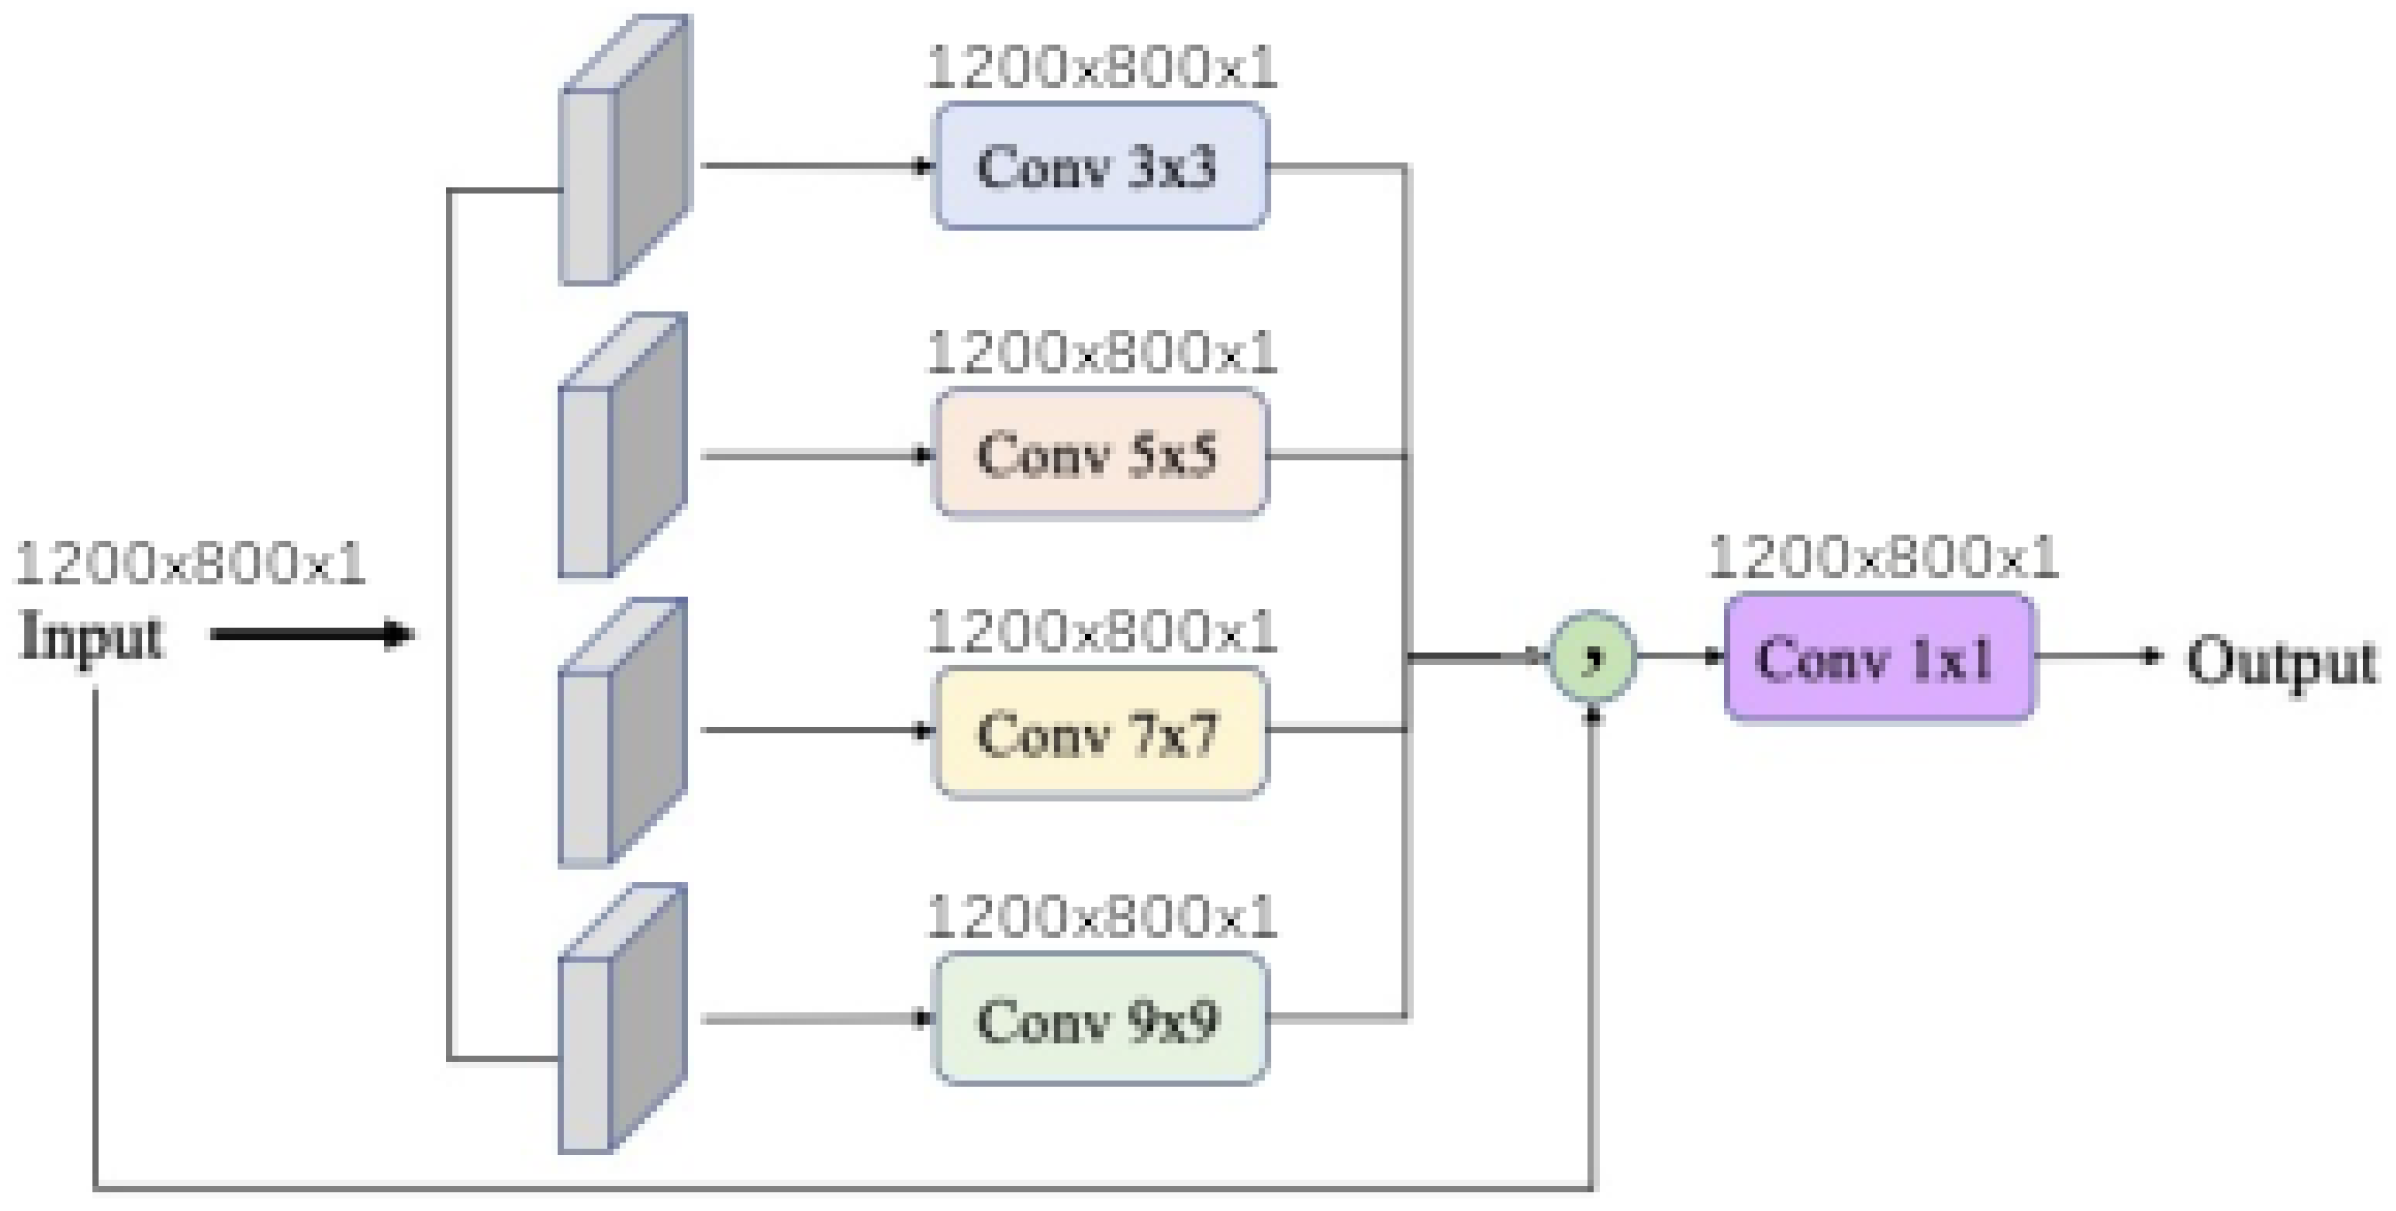
input band filter (ibf) and
spatial pyramid refinement block (sprb) are put respectively at the upstream and downstream of the network.
Figure 11 shows that network synthesis. To deal with lighting variation and saturation a BatchNormalization is put in the upstream of the network in all cases. The
ibf and
sprb modules are optional and can be disabled.
When the input band filter (ibf) is enabled, the incoming tensor size of is transformed to a tensor of size and passed to the generic equation. When it is not, the generic equations get the raw input tensor of size . In all cases the baseline model output a tensor of shape . The spatial pyramid refinement block transforms the output tensor of the baseline model to a new tensor of the same size.
All models are evaluated with two metrics, respectively the dice and mIoU score. For each kernel size, the results are presented in
Table 3,
Table 4,
Table 5 and
Table 6. All models are also evaluated with and without
ibf and
sprb for each kernel size.
For all baseline models, the results (in term of mIoU) show that increasing the kernel size also increases performances. The gain performance between best models in kernel size 1 and 7 are approximately and then correspond to the influence of spectral mixing. So searching for spectral mixing 3 pixels farther (kernel size 7) still increases performance. It could also be possible that function approximation allows to spatially reconstruct some missing information.
For all kernel sizes, the ibf module enhance the mIoU score up to . So the ibf greatly prune the unneeded part of the input signal which increases the separability and the performances of all models. The sprb module allows to smooth the output by taking into account neighborhood indices, but their performance are not always better or generally negligible when it is used alone with the baseline model.
The baseline polynomial model is probably over-fitted, because it’s hard to find the good polynomial order. But enabling the ibf fixes this issue. However further study should be done to setup the order of Bernstein expansion.
The
dense morphological with a kernel size of 5 and 7 using both
ibf and
sprb modules is the best model in term of dice (≈
) and mIoU score (≈
). Followed by
universal function approximator with a kernel size of 1 or 3 with both
ibf and
sprb modules (dice up to
and mIoU up to
). Further studies on the width of the universal function approximator could probably increase performance. According to [
43] it seems normal that the potential of
dense morphological is higher although the hyper-parameters optimization of
universal function approximator could increase their performance.
4.3. Initial Image Processing
To show the importance of the initial image processing, each model has been trained without the various input transformations, such as
, Gxx, Gxy, Gyy filters, Laplacian filter, minimum and maximum Eigen values.
Table 7 shows the score of DeepIndices considering only kernel size of 1 in different model.
The results shows that none of optimized models outperforms the previous performance with the initial image processing (best mIoU at ). The maximum benefit is approximately for mIoU score depending on the model and module, especially when using combination of ibf, sprb and small kernel size. Meaning that signal processing is much more important than spectral mixing and texture.
4.4. Discussion
Further improvements can be set on hyper-parameters of the previously defined equations, such as the degree of the polynomial (set to 11), the CNN depth and width for Taylor series (set to 3) and the number of operations in morphological network (set to 10). In particular the learning of 2D convolution kernel of Taylor series may be replaced by a structured receptive field [
41]. In addition it would be interesting to transpose our study with new data for other surfaces such as shadows, waters, clouds or snows.
The training dataset is randomly split with a fixed seed, which is used for every learned models. As previously noted, this is important to ensure reproducible results but could also favor specific models. Further work to evaluate the impact of varying training datasets could be conducted.
4.4.1. Model Convergence
Another way to estimate the robustness of a model against its initialization is to compare the model’s convergence speed. Models with faster convergence should be less sensitive to the training dataset. As an example, the convergence speed of few different models is shown in
Figure 12. The baseline model convergence is the same, as well as
sprb module. However the speed of convergence also increases with the size of the kernel but does not alter subsequent observations. For greater readability only models with
ibf are presented.
An important difference in the speed of convergence between models is observed. An analysis of this figure allows the aggregation of model types and speed:
Slow converging models: polynomials models converge slowly as well as the majority of linear or linear-ratio models.
Fast converging models: universal-functions and dense-morphological are the fastest to converge (less than 30 iterations)
A subset of slow and fast converging models could be evaluated in term of sensitivity against initialization. It shows that the dense morphological followed by universal function approximator convergence faster than the other. Regardless of the used module nor kernel size.
4.4.2. Limits of Deepindices
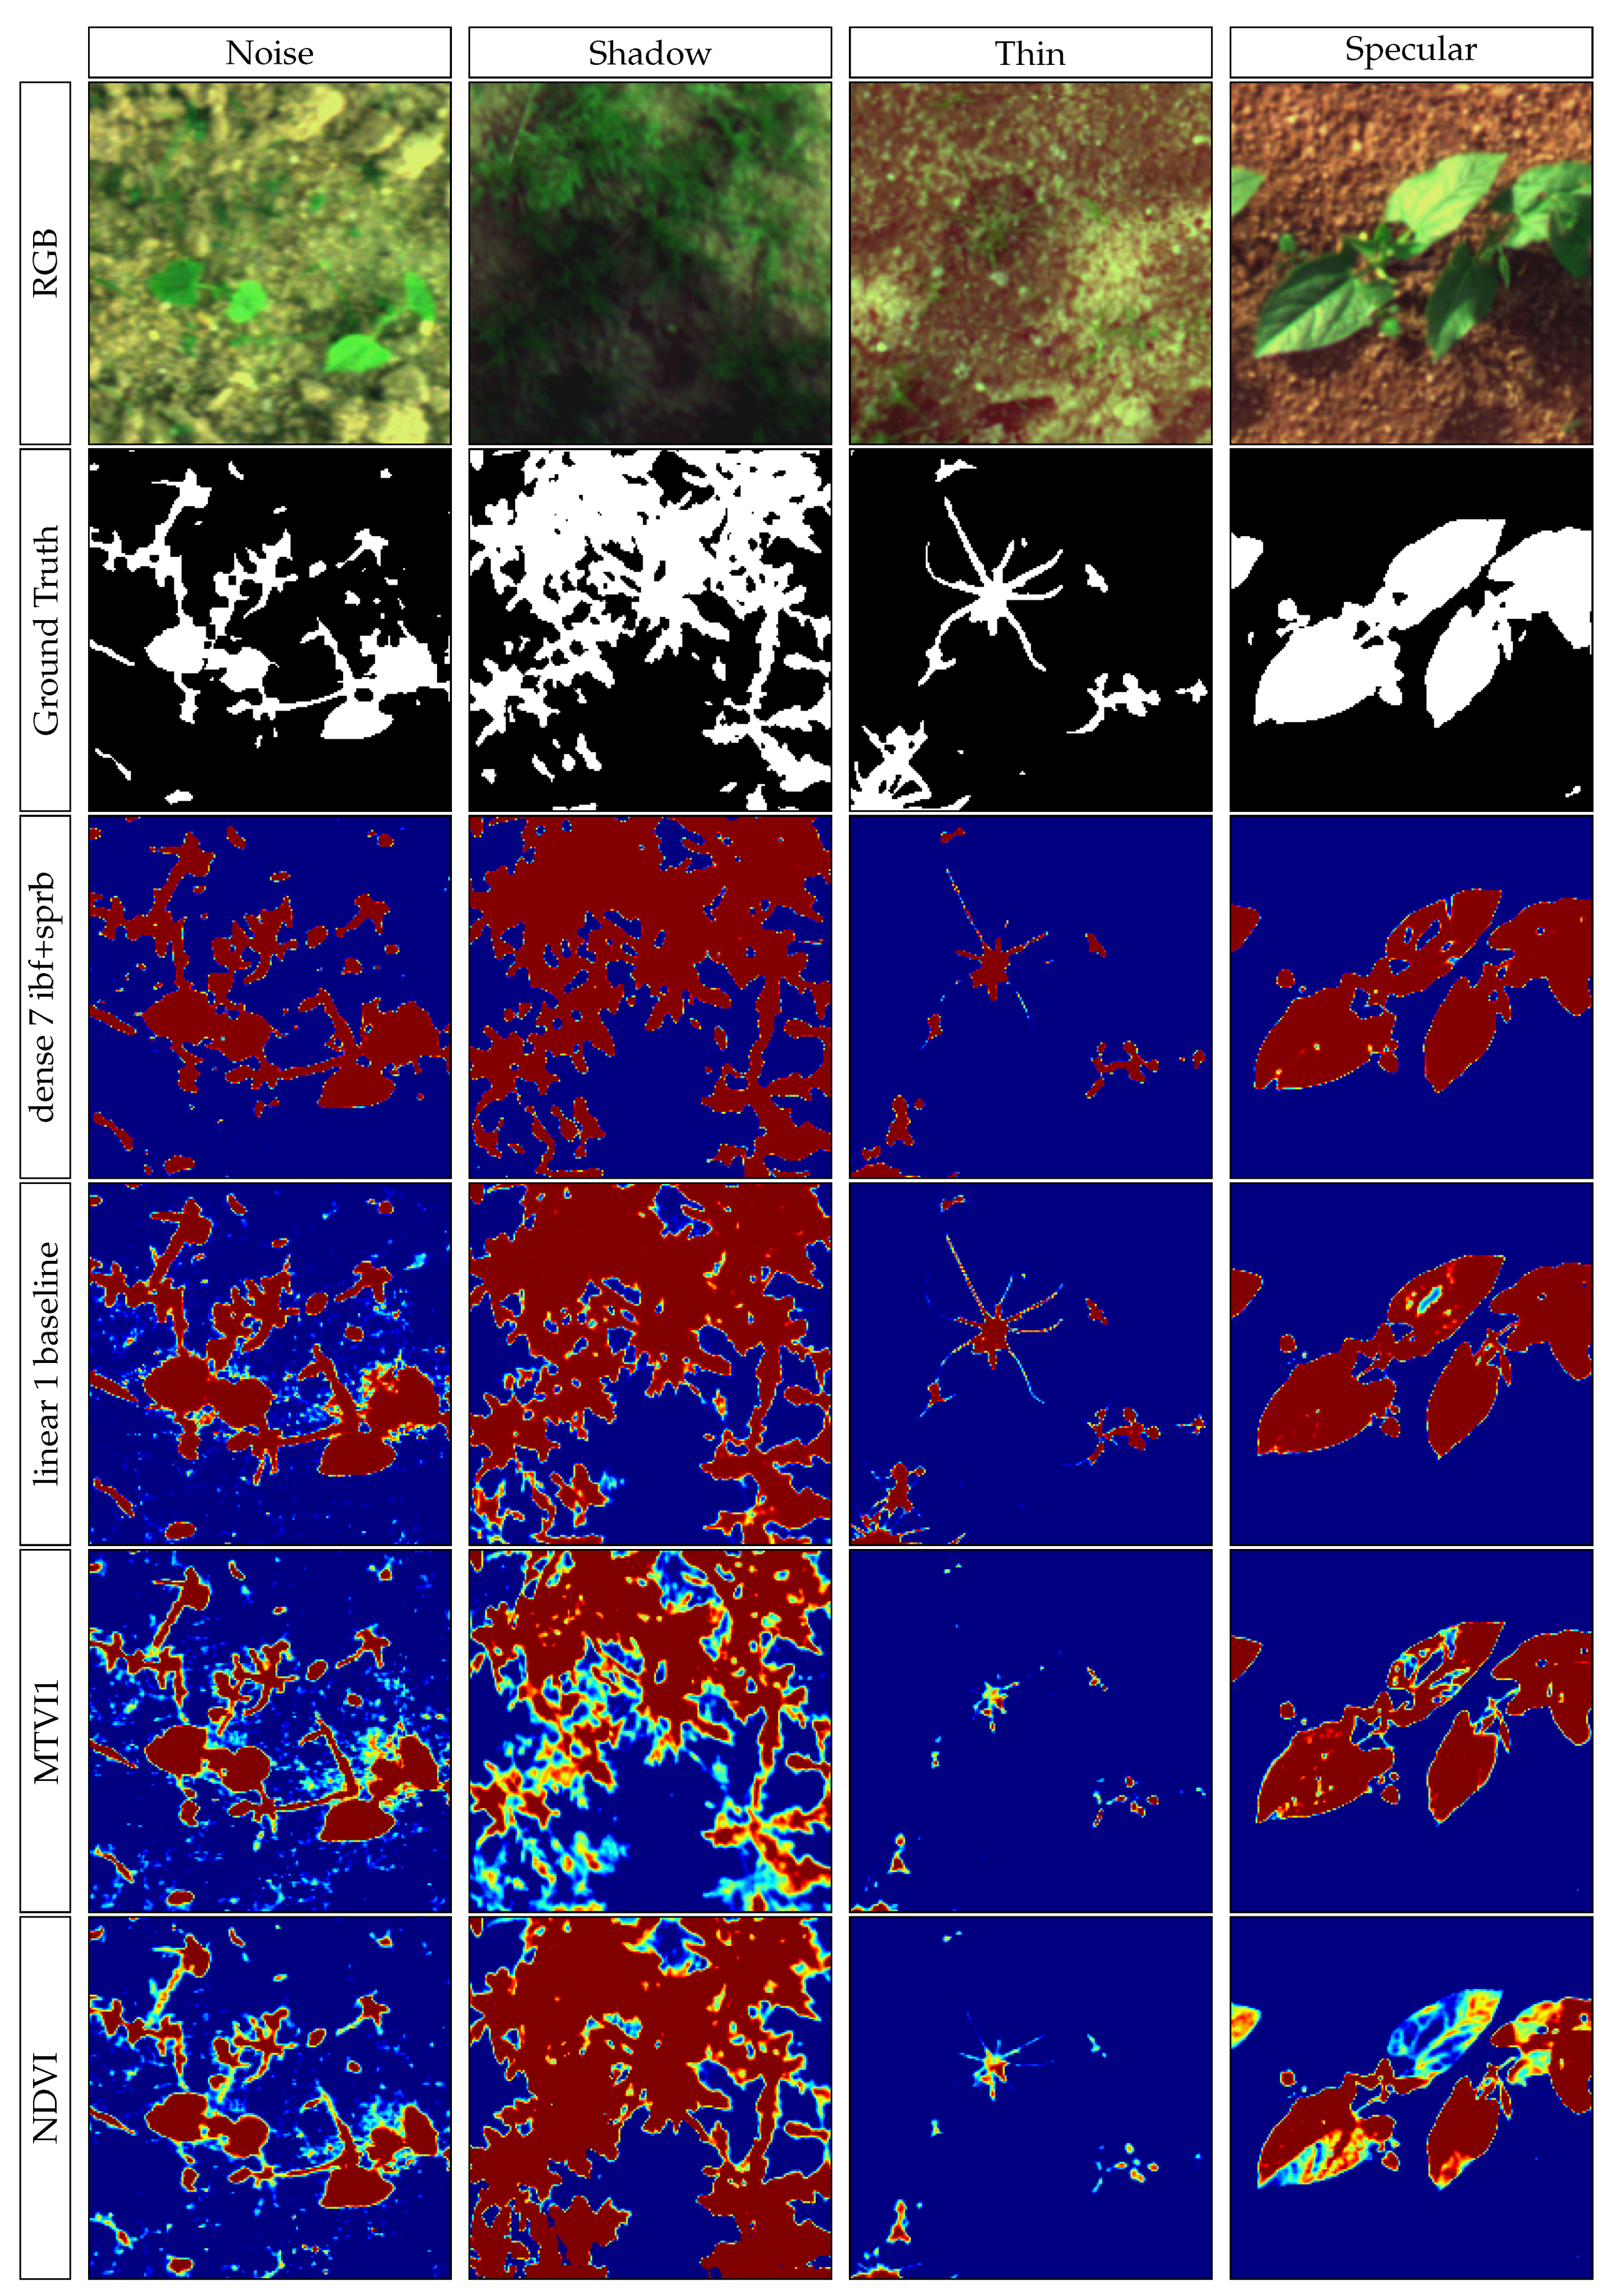
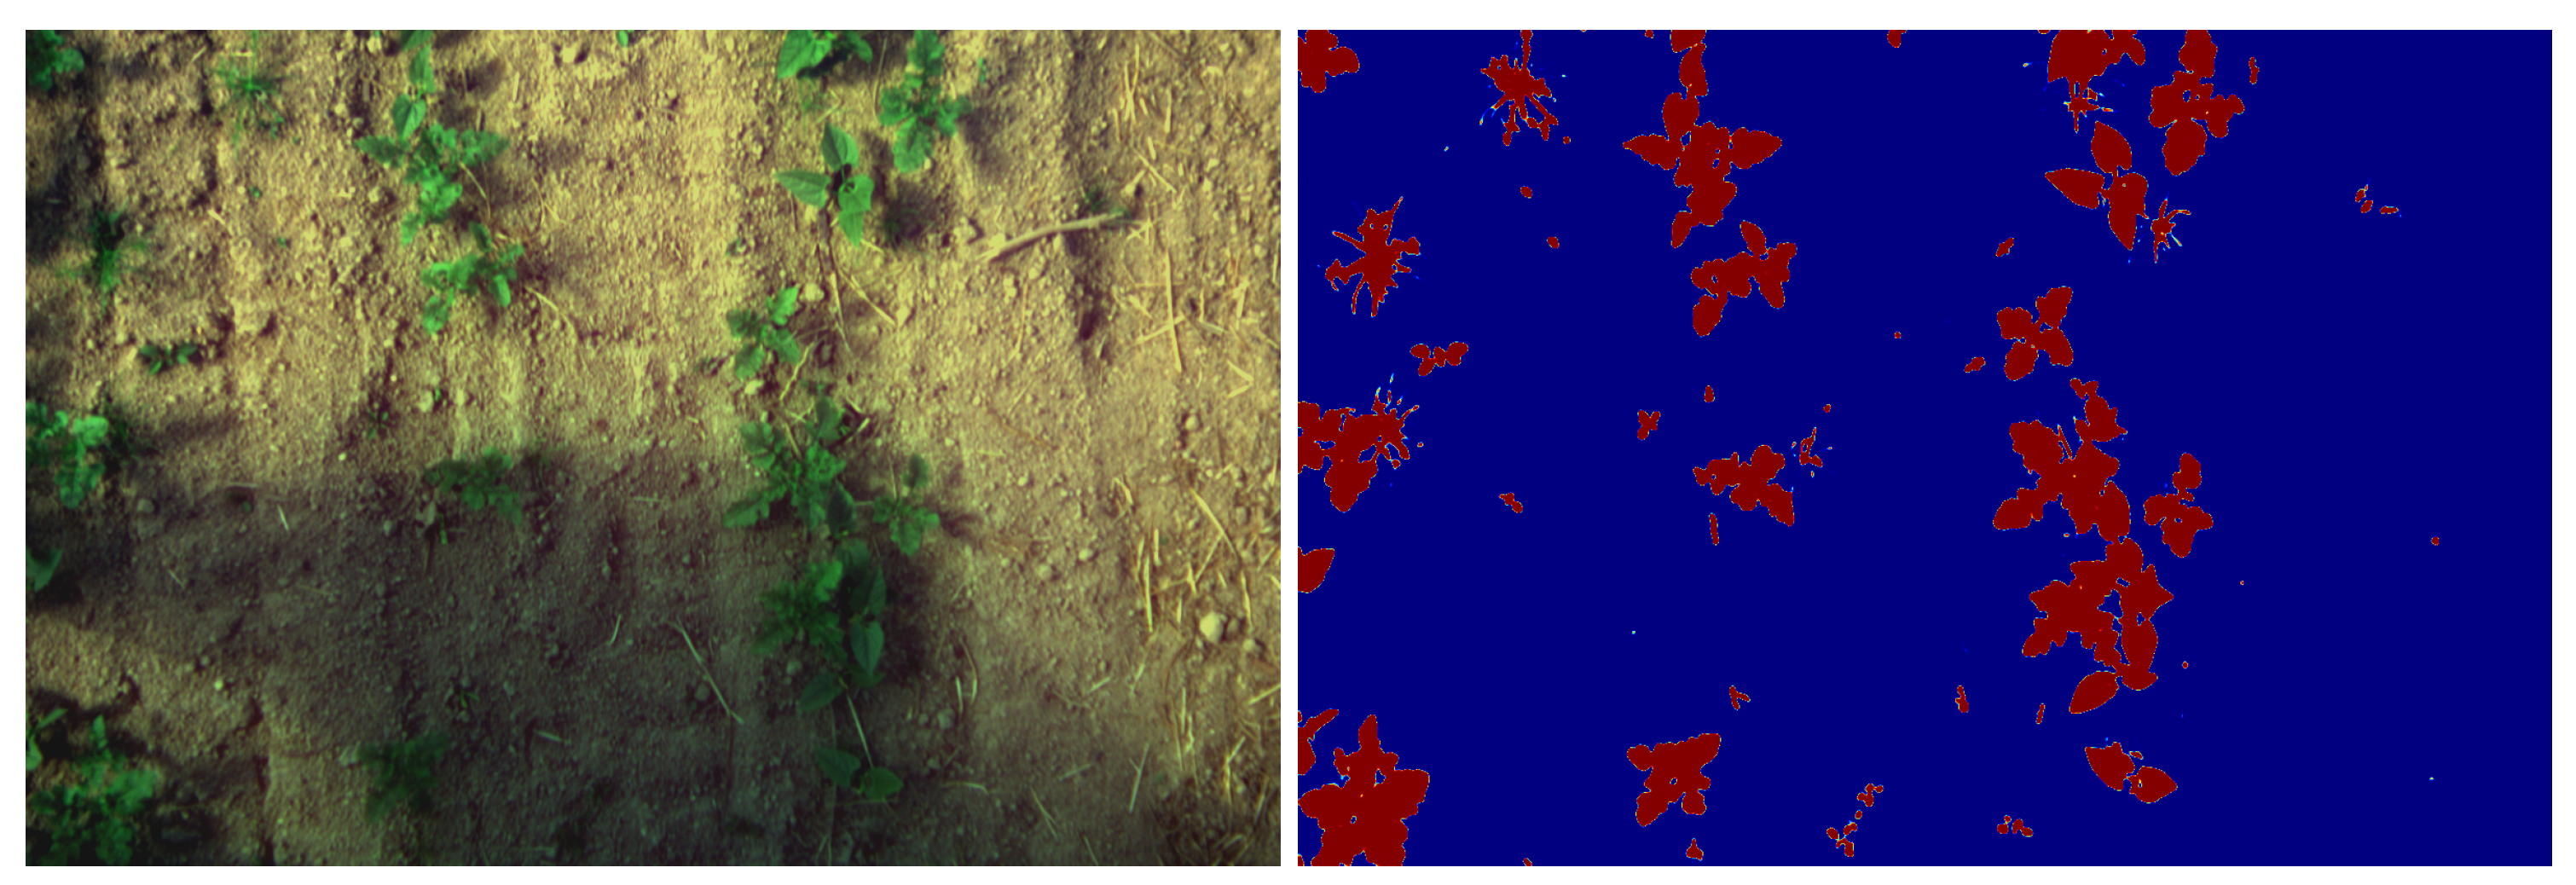
Shadows can be a relatively hard problem to solve in image processing, the proposed models are able to correctly separate vegetation from soil even with shadowy images, as shown in
Figure 13. In addition, the
Figure A1 in the
Appendix A shows the impacts of various acquisition factors, such as shadow, noise, specular or thin vegetation features.
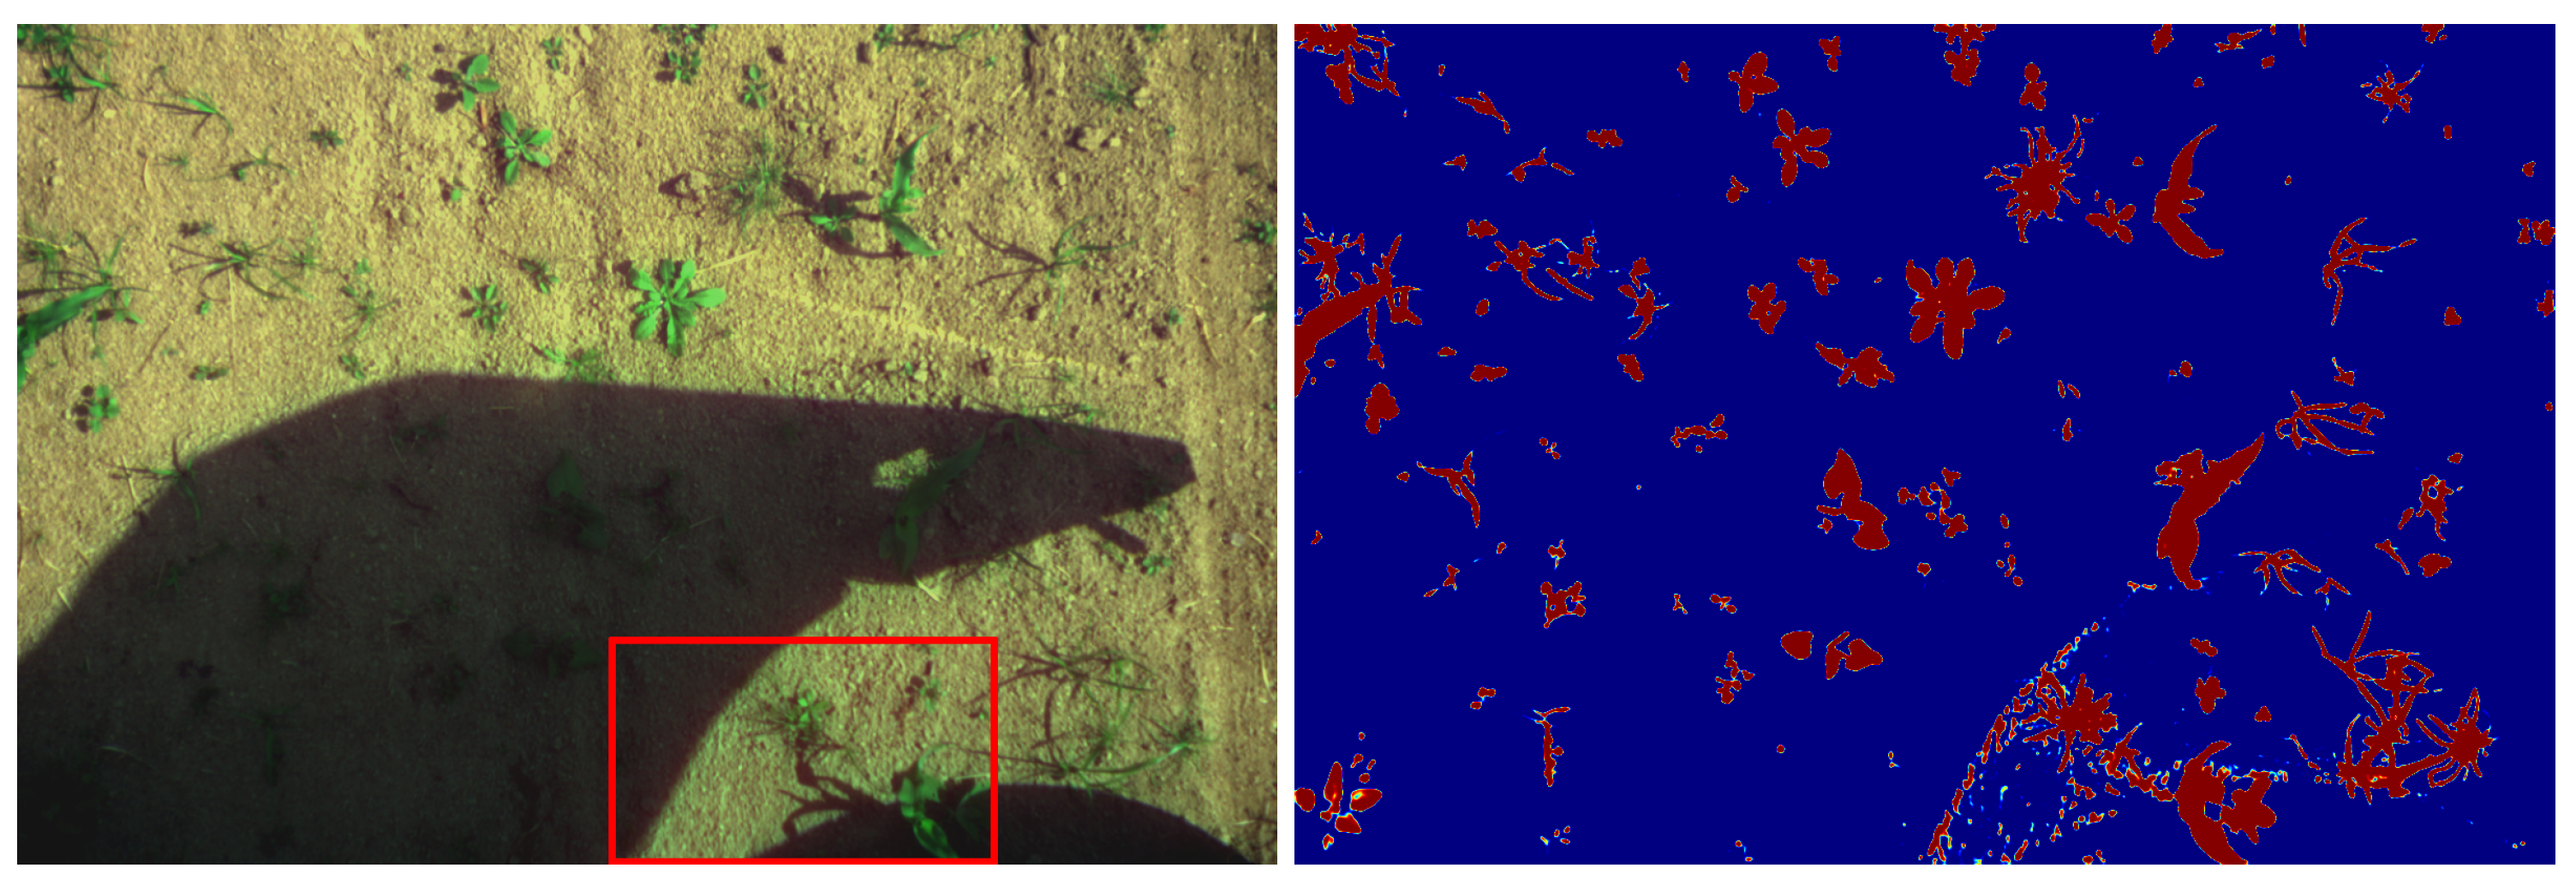
Some problem occurs when there are abrupt transitions between shadowed and light areas of an image as shown in
Figure 14.
It appears that the discrimination error appears where the shadow is cast by a solid object, resulting in edge diffraction that creates small fringes on the soil and vegetation. A lack of such images in the training dataset could explain the model failure. Data augmentation could be used to obtain a training model containing such images, from cloud shadows to solid objects shadows. Further work is needed to estimate the benefit of such a data augmentation on the developed models.
The smallest parts of the vegetation (less than 1 pixel, such as small monocotyledon leaves or plant stems) cannot be detected because of a strong spectral mixture. This limitation is due to the acquisition conditions (optics, CCD resolution and elevation) and should be considered as is. As vegetation with a width over 1 pixel is correctly segmented by our approach, the acquisition parameters should be chosen so that the smallest parts of vegetation that are required by an application are larger than 1 pixel in the resulting image.
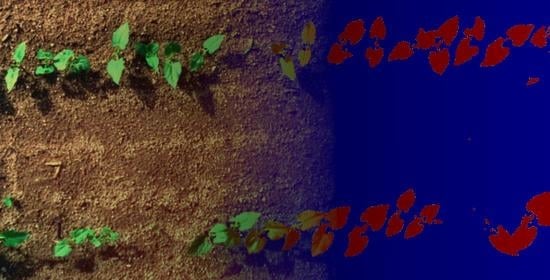
A few spots of specular light can also be observed on images, particularly on leaves. These spots are often unclassified (or classified as soil). This modifies the shape of the leaves by creating holes inside them. This problem can be seen on
Figure 15. Leaves with holes are visible on the left and the middle of the top bean row. It would be interesting to train the network to detect and assign them to a dedicated class.
Next the location of the detected spots could be studied to re-assign them to two classes: specular-soil and specular-vegetation. To perform this step, a semantic segmentation could be set up to identify the surrounding objects of the holes specifically. It would be based on the UNet model, which performs a multi-scale approach by calculating, treating and re-convolving images of lower resolutions.
More generally, the quality of the segmentation between soil and vegetation strongly influences the discrimination between crop and weed, which remains a major application following this segmentation task. Three categories of troubles have been identified: the plants size, the ambient light variations (shades, specular light spots), and the morphological complexity of the studied objects.
The size of the plants mainly impacts their visibility on the acquired images. It is not obviously related to the ability of the algorithm to classify them. However, it leads to the absence of essential elements such as monocotyledon weeds at an early vegetation stage. A solution is proposed by setting the acquisition conditions to let the smallest vegetation part be over 1 pixel.
Conversely, the variations of ambient light should be treated by the classification algorithm. As previously mentioned, shadow management needs an improvement of the learning base, and specular light spots could be treated by a multi-scale approach. Their influence on the discrimination step should be major. Indeed, they influence the shape of the objects classified as plants, which is a useful criterion to discriminate crops from weeds. The morphological complexity of the plants can be illustrated by the presence of stems. In our case, bean stems are similar to weed leaves. This problem should be treated by the discrimination step. The creation of a stem class (in addition to the weed and crop classes) will be studied in particular.
5. Conclusions
In this work, different standard vegetation indices have been evaluated as well as different methods to estimate new DeepIndices through different types of equations that can reconstruct the others. Among the 89 standard vegetation indices tested, the MTVI (Modified Triangular Vegetation Index 1) gives the best vegetation segmentation. Standard indices remain sub-optimal even if they are downstream optimized with a linear regression because they are usually used on calibrated reflectance data. The results allow us to conclude that any simple linear combination is just more efficient ( mIoU) than any standard indices by taking into account all spectral bands and few transformations. The results also suggest that un-calibrated data can be used in proximal sensing applications for both standard indices and DeepIndices with good performances.
We therefore agree that it is important to optimize both the arithmetic structure of the equation and the coefficients of the spectral bands, that is why our automatically generated indices are much more accurate. The best model is much more efficient by compared to the best standard indices and by compared to NDVI. Also the two modules ibf, sprb and the initial image transformation show a significant improvement. The developed DeepIndices allow to take into account the lighting variation within the equation. It makes possible to abstract from a difficult problem which is the data calibration. Thus, partially shaded images are correctly evaluated, which is not possible with standard indices since they use sprectum measurement that change with shades. However, it would be interesting to evaluate the performance of standard indices and DeepIndices on calibrated reflectance data.
These results suggest that deep learning algorithms are a useful tool to discover the spectral band combinations that identify the vegetation in multi spectral camera. Another conclusion from this research is about the genericity of the methodology developed. This study presents a first experiment employed in field images with the objective of finding deep vegetation indices and demonstrates their effectiveness compared to standard vegetation indices. This paper’s contribution improves the classical methods of vegetation index development and allows the generation of more precise indices (i.e., DeepIndices). The same kind of conclusion may arise from this methodology applied on remote sensing indices to discriminates other surfaces (roads, water, snow, shadows, etc).
