
Climate Variability May Delay Post-Fire Recovery of Boreal Forest in Southern Siberia, Russia

 ,
,  , and
, and
Abstract
1. Introduction
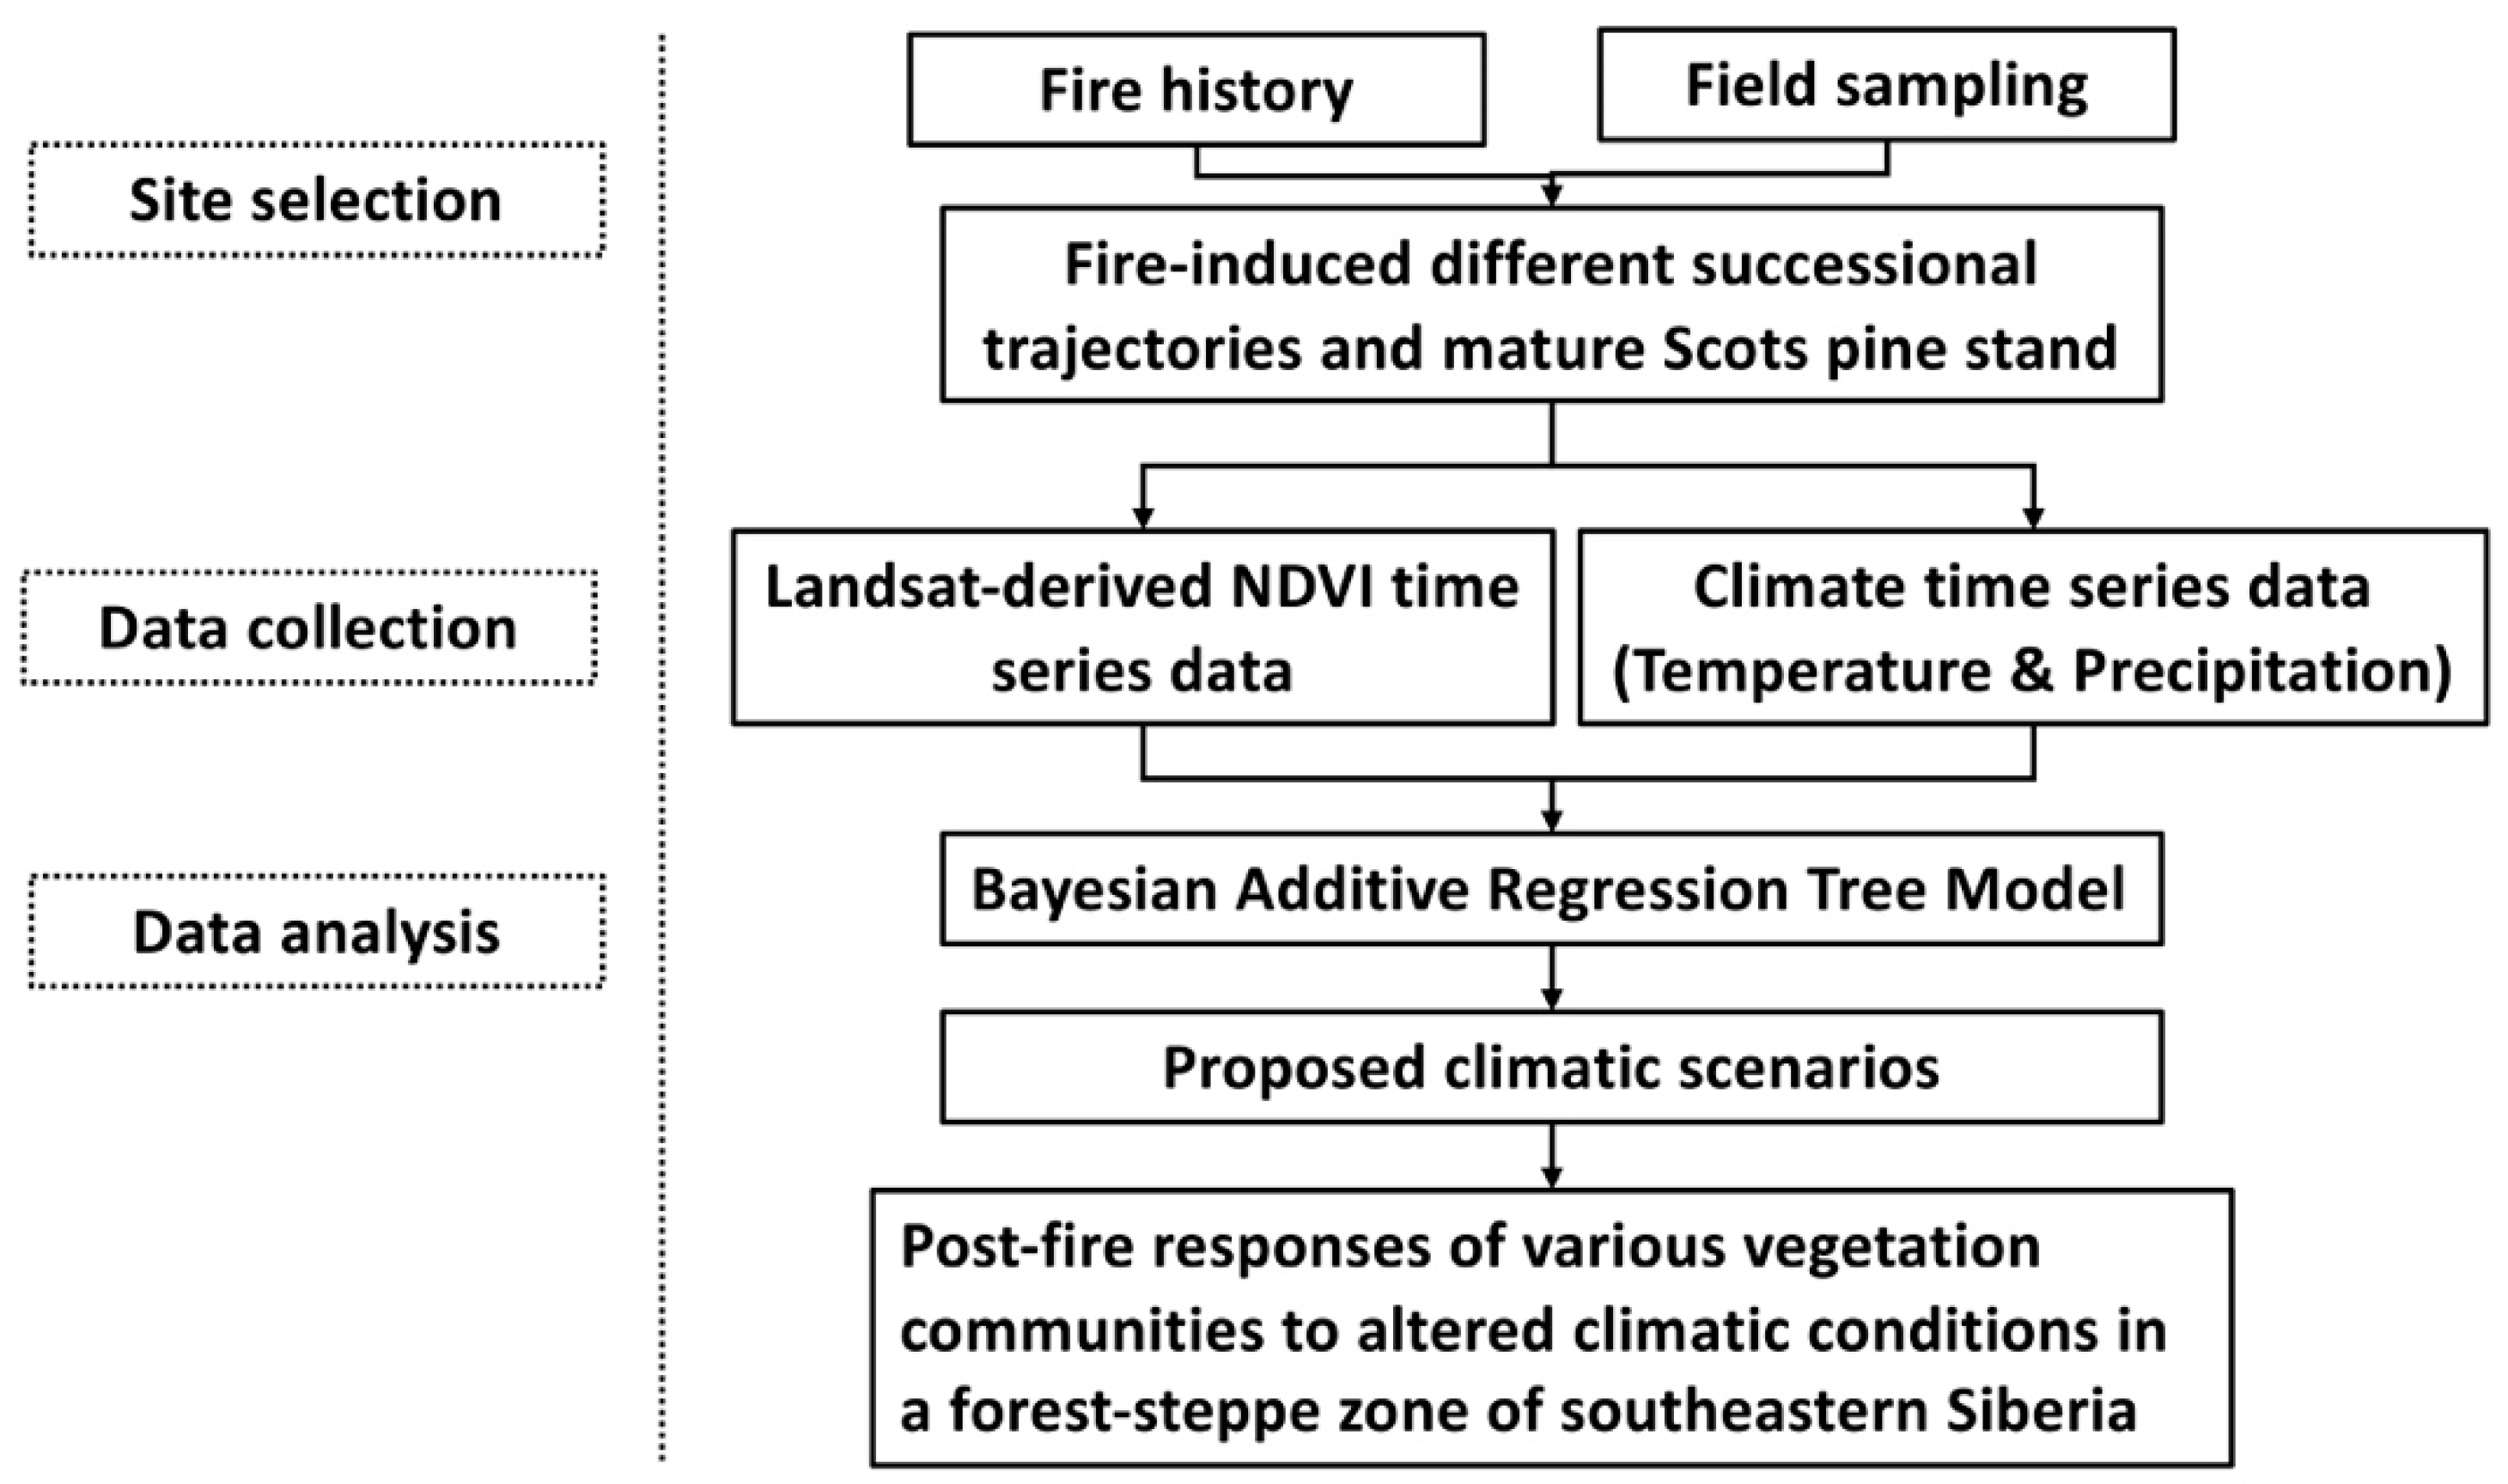
2. Materials and Methods
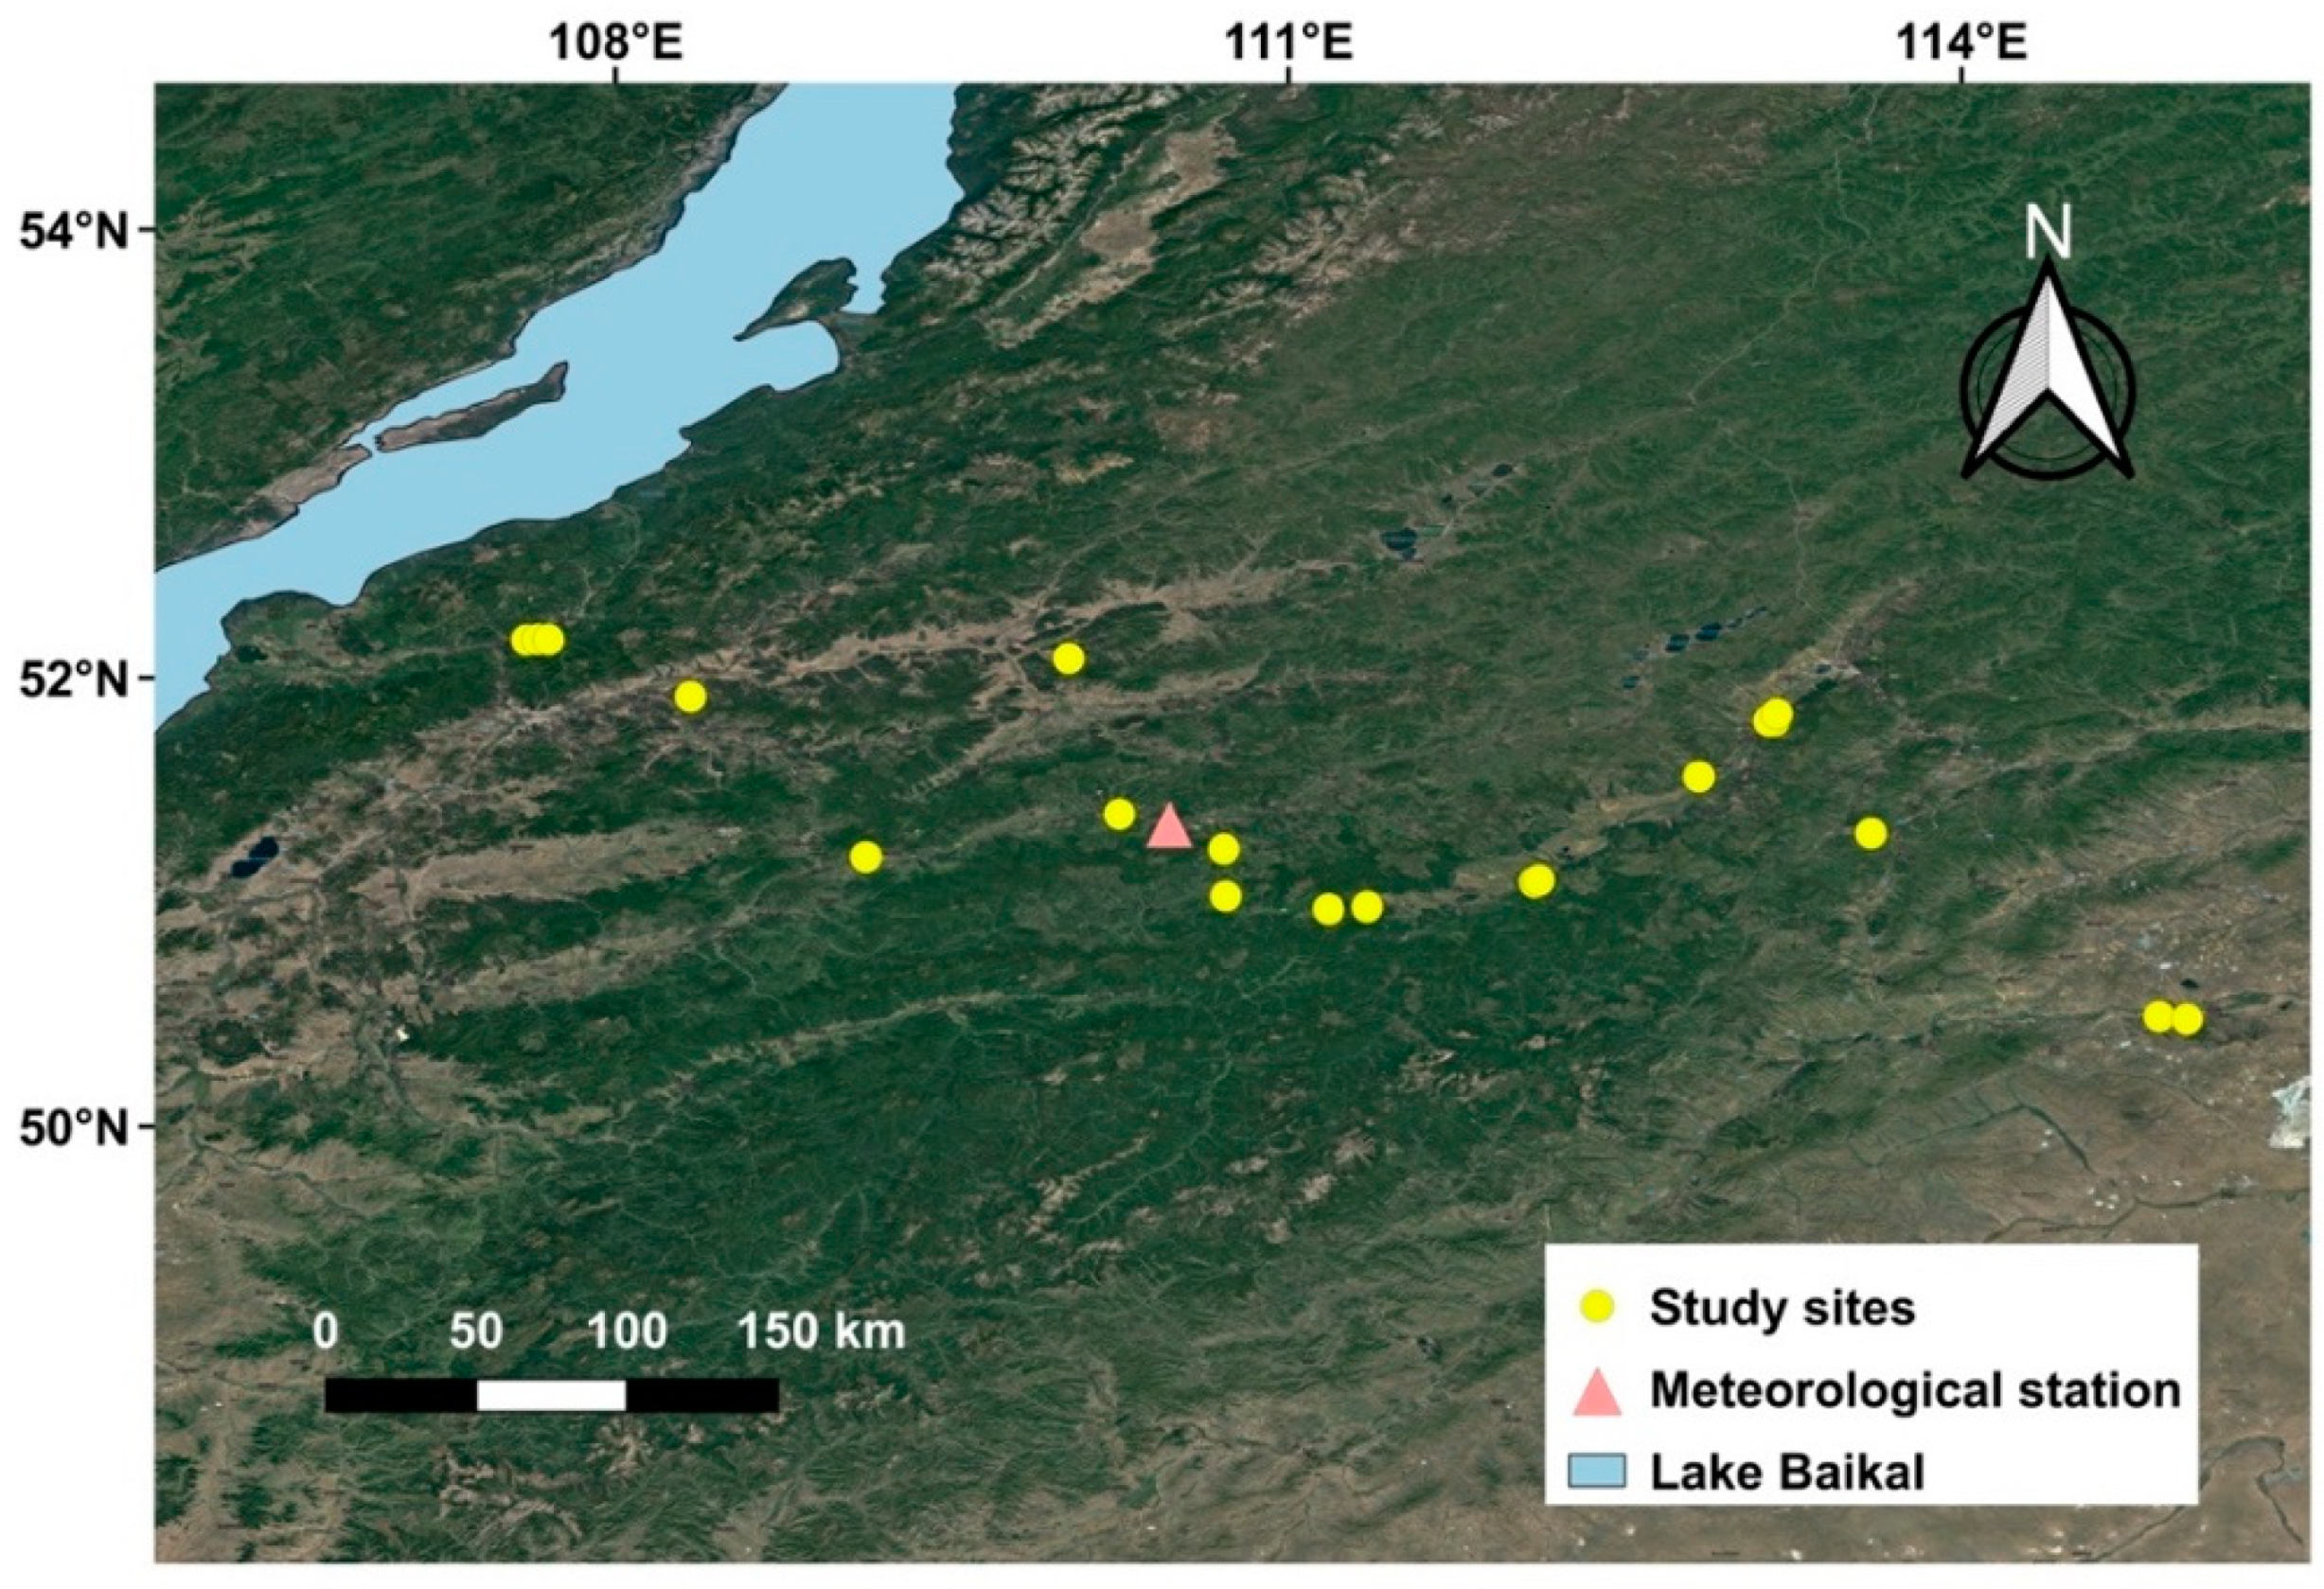
2.1. Study Area
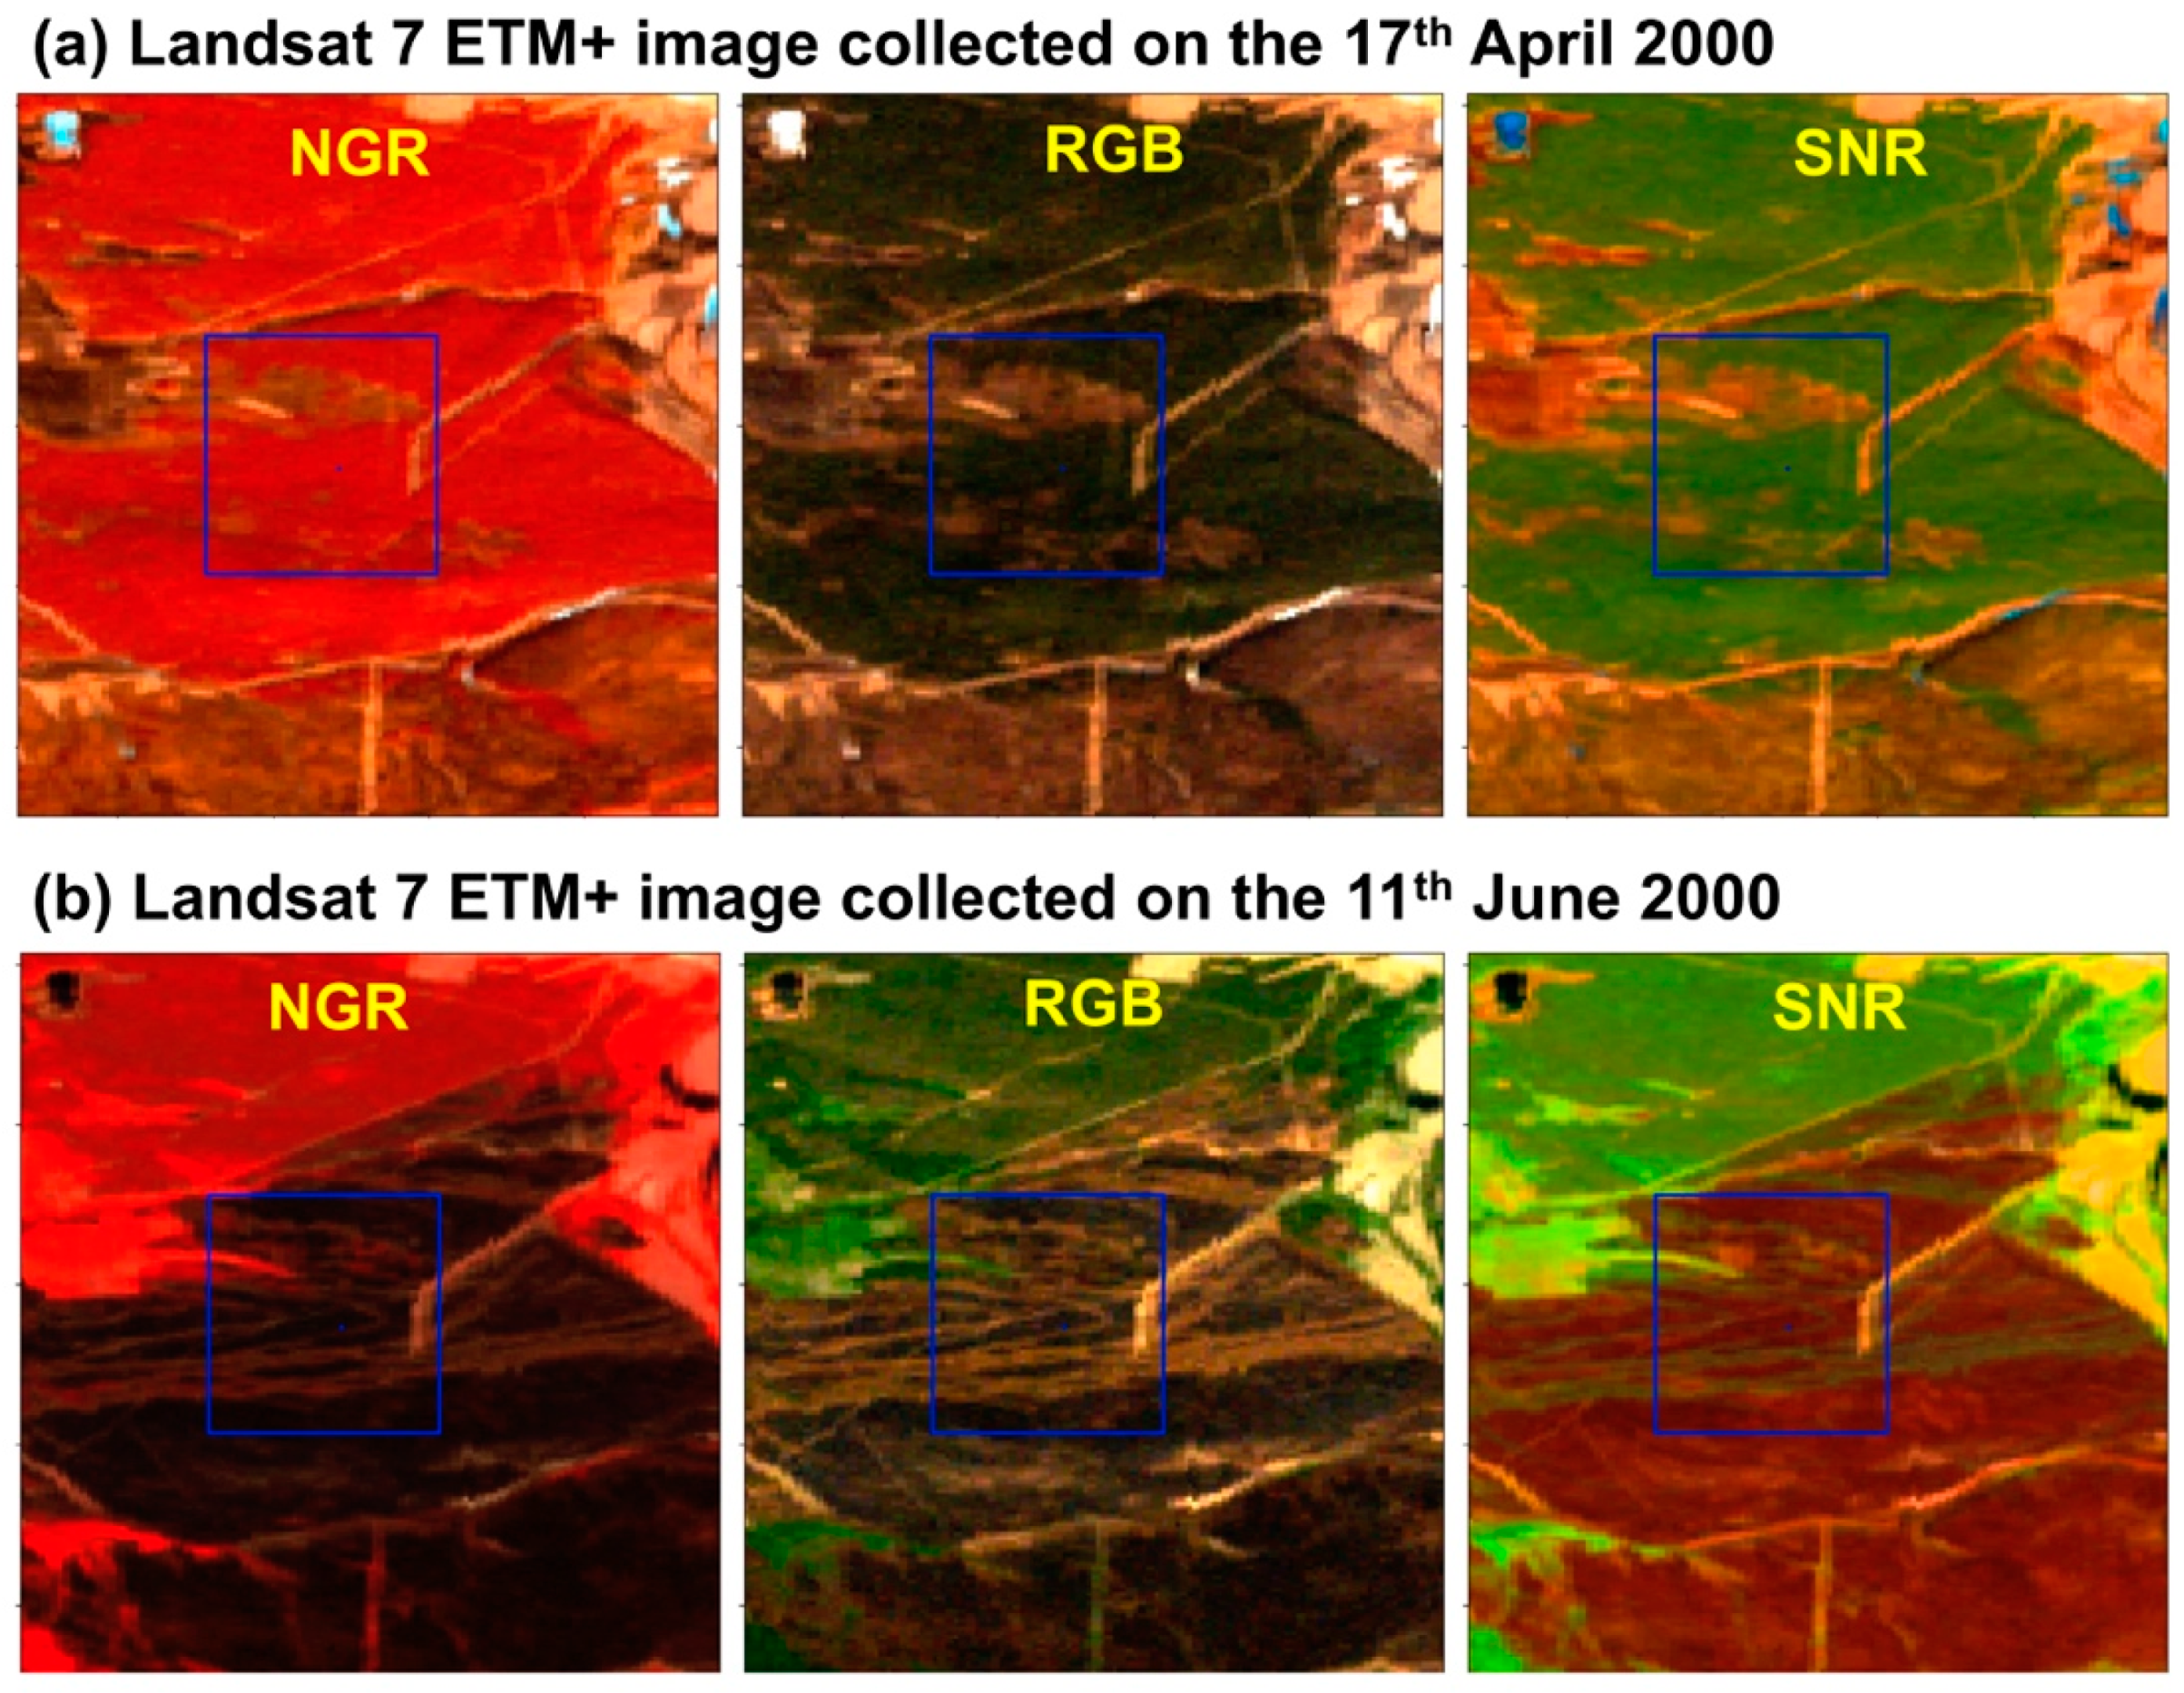
2.2. Site Selection
2.3. Fire History Data
2.4. Field Data
2.5. Landsat-Derived NDVI Time Series Data
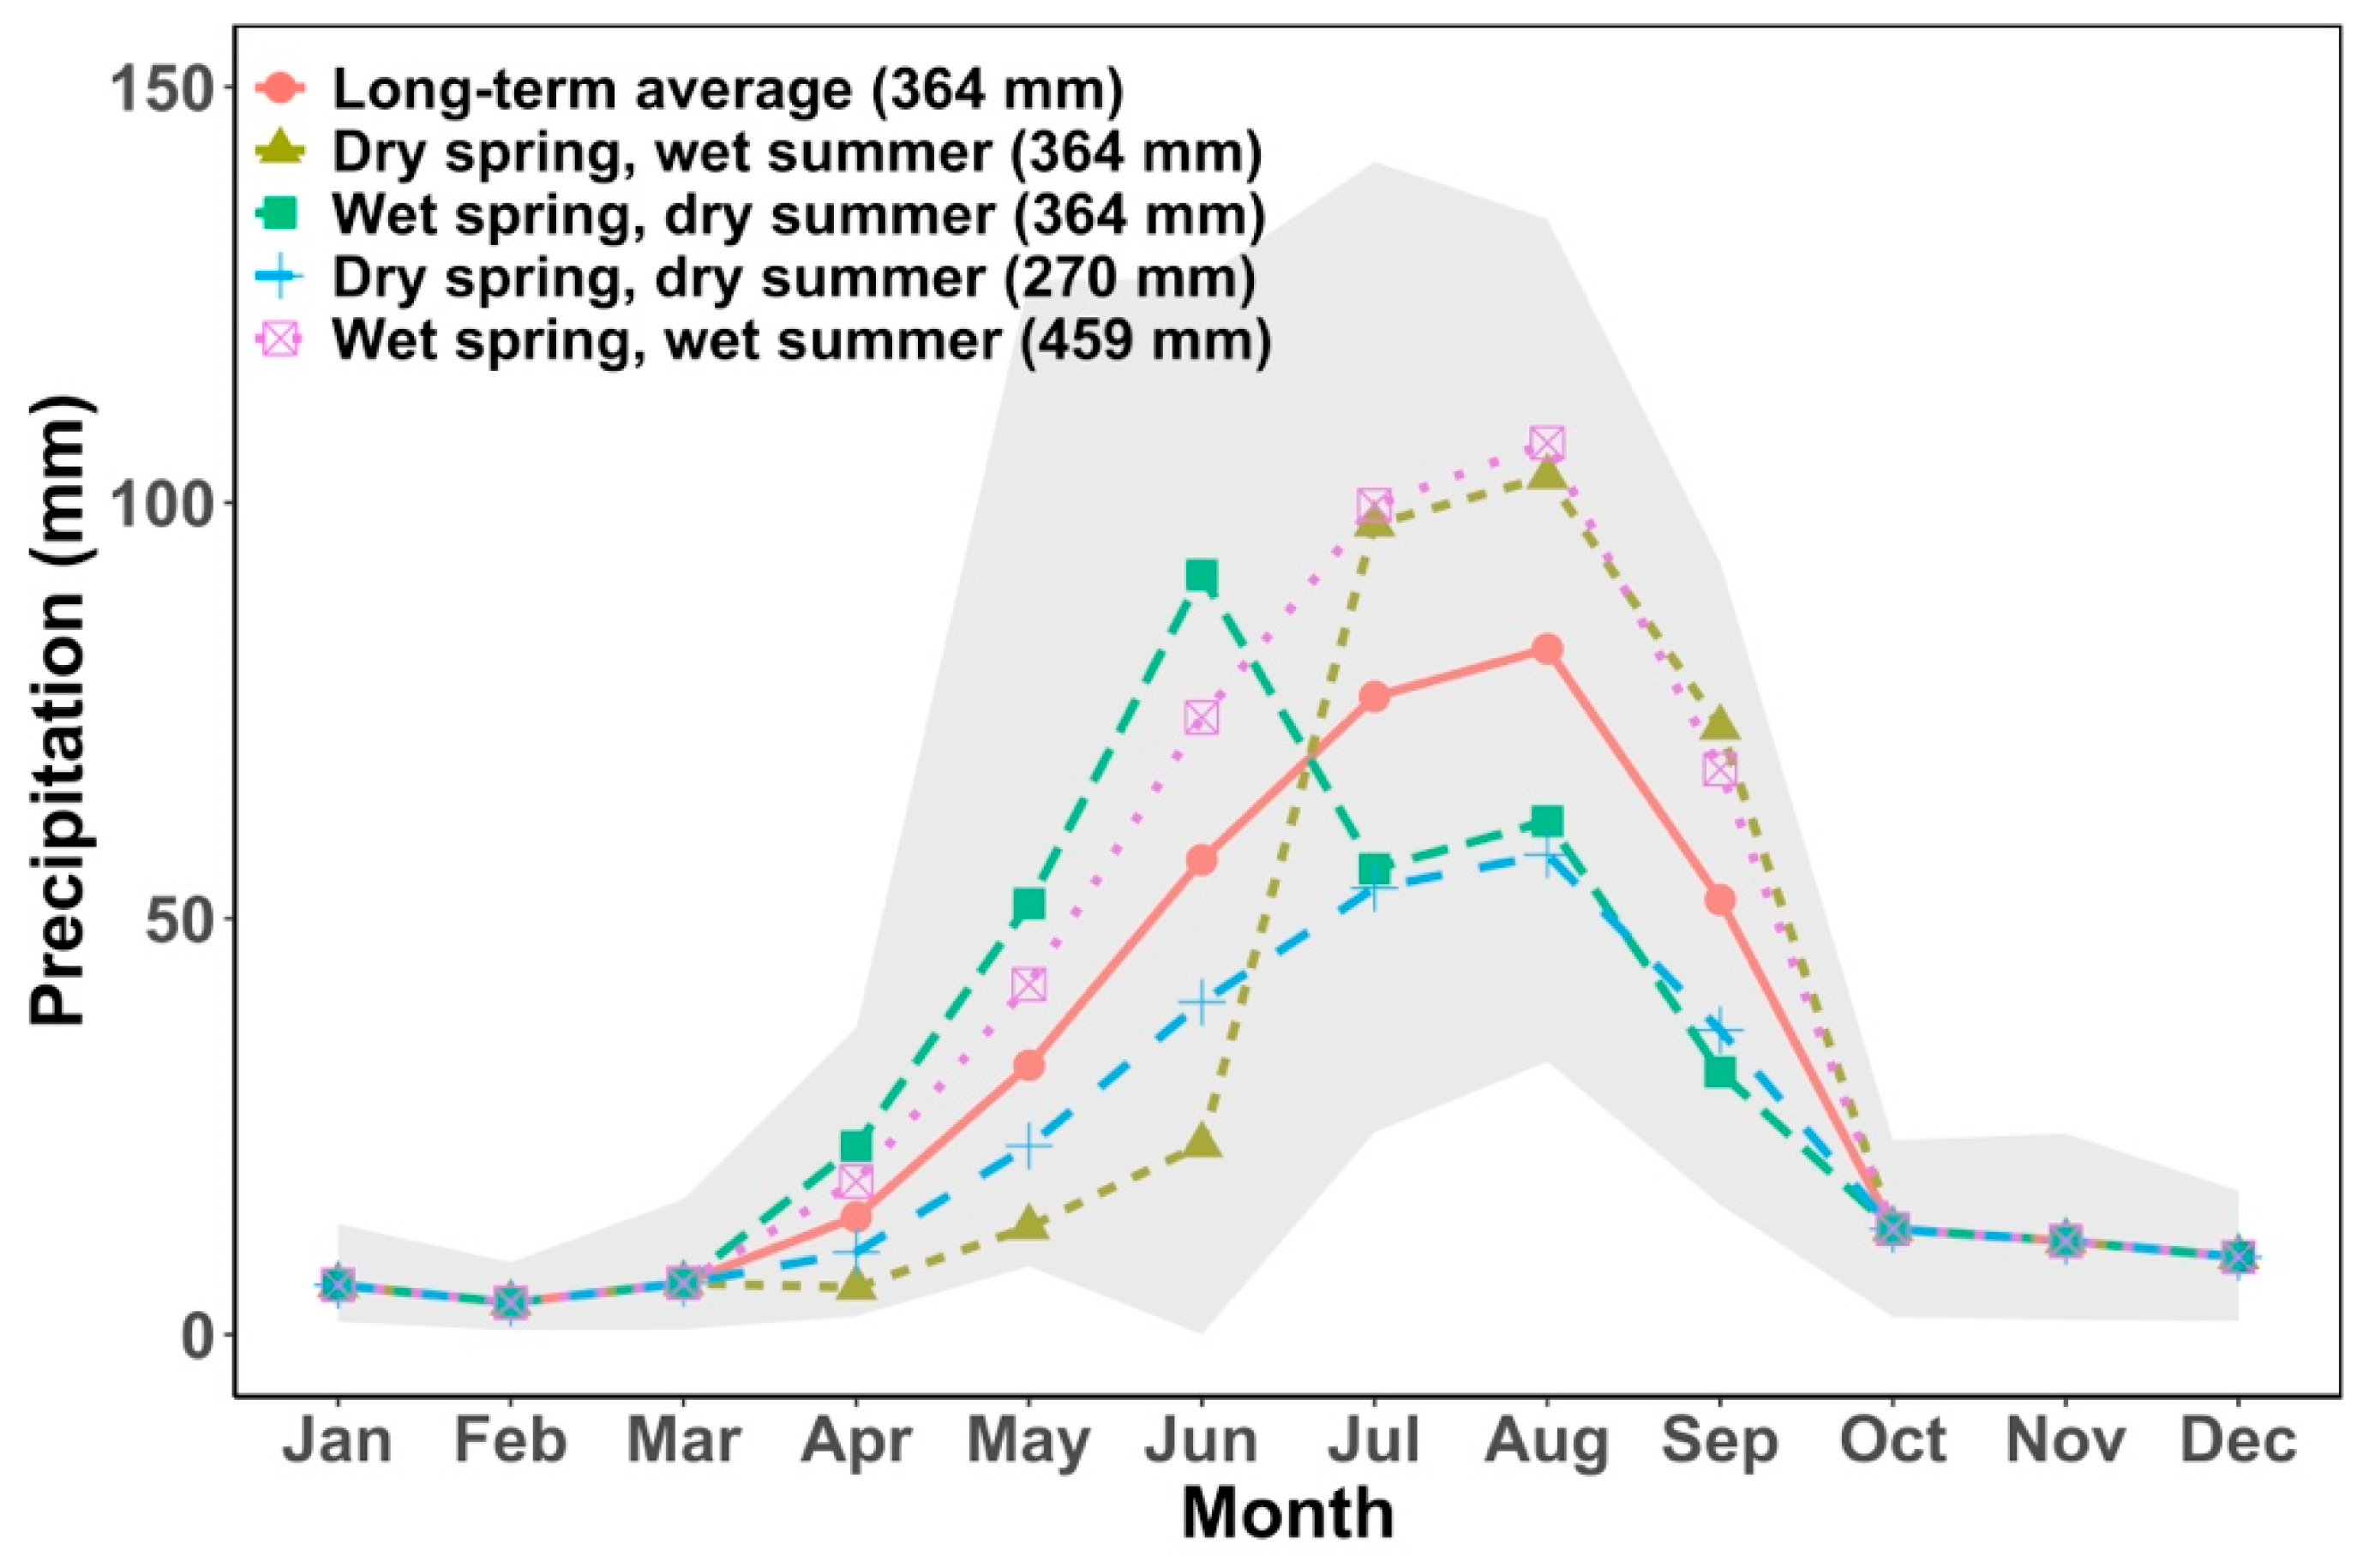
2.6. Climate Sensitivity Analysis
3. Results
3.1. Fire History and Tree Regeneration Post-Fire
3.2. Response of NDVI to Temperature, Precipitation and Post-Fire Climate Sensitivity
4. Discussion
4.1. Current Climate Sensitivity
4.2. Recovery under Changes in Climatology
4.3. Recovery under Changes in Climate Seasonality
5. Conclusions
Supplementary Materials
Author Contributions
Funding
Data Availability Statement
Acknowledgments
Conflicts of Interest
References
- Malevsky-Malevich, S.P.; Molkentin, E.K.; Nadyozhina, E.D.; Shklyarevich, O.B. An assessment of potential change in wildfire activity in the russian boreal forest zone induced by climate warming during the twenty-first century. Clim. Chang. 2008, 86, 463–474. [Google Scholar] [CrossRef]
- Vivchar, A. Wildfires in russia in 2000–2008: Estimates of burnt areas using the satellite modis mcd45 data. Remote Sens. Lett. 2011, 2, 81–90. [Google Scholar] [CrossRef]
- Ponomarev, E.; Kharuk, V.; Ranson, K. Wildfires dynamics in siberian larch forests. Forests 2016, 7, 125. [Google Scholar] [CrossRef]
- García-Lázaro, J.; Moreno-Ruiz, J.; Riaño, D.; Arbelo, M. Estimation of burned area in the northeastern siberian boreal forest from a long-term data record (ltdr) 1982–2015 time series. Remote Sens. 2018, 10, 940. [Google Scholar] [CrossRef]
- Kukavskaya, E.A.; Buryak, L.V.; Shvetsov, E.G.; Conard, S.G.; Kalenskaya, O.P. The impact of increasing fire frequency on forest transformations in southern siberia. For. Ecol. Manag. 2016, 382, 225–235. [Google Scholar] [CrossRef]
- Kukavskaya, E.A.; Ivanova, G.A.; Conard, S.G.; McRae, D.J.; Ivanov, V.A. Biomass dynamics of central siberian scots pine forests following surface fires of varying severity. Int. J. Wildland Fire 2014, 23, 872–886. [Google Scholar] [CrossRef]
- Johnstone, J.F.; Allen, C.D.; Franklin, J.F.; Frelich, L.E.; Harvey, B.J.; Higuera, P.E.; Mack, M.C.; Meentemeyer, R.K.; Metz, M.R.; Perry, G.L.W.; et al. Changing disturbance regimes, ecological memory, and forest resilience. Front. Ecol. Environ. 2016, 14, 369–378. [Google Scholar] [CrossRef]
- Schulze, E.D.; Wirth, C.; Mollicone, D.; von Lupke, N.; Ziegler, W.; Achard, F.; Mund, M.; Prokushkin, A.; Scherbina, S. Factors promoting larch dominance in central siberia: Fire versus growth performance and implications for carbon dynamics at the boundary of evergreen and deciduous conifers. Biogeosciences 2012, 9, 1405–1421. [Google Scholar] [CrossRef]
- Wirth, C. Fire regime and tree diversity in boreal forests: Implications for the carbon cycle. In Forest Diversity and Function: Temperate and Boreal Systems; Scherer-Lorenzen, M., Körner, C., Schulze, E.-D., Eds.; Springer: Berlin/Heidelberg, Germany, 2005; pp. 309–344. [Google Scholar]
- Kharuk, V.I.; Ranson, K.J.; Oskorbin, P.A.; Im, S.T.; Dvinskaya, M.L. Climate induced birch mortality in trans-baikal lake region, siberia. For. Ecol. Manag. 2013, 289, 385–392. [Google Scholar] [CrossRef]
- Kharuk, V.I.; Dvinskaya, M.L.; Ranson, K.J. Fire return intervals within the northern boundary of the larch forest in central siberia. Int. J. Wildland Fire 2013, 22, 207–211. [Google Scholar] [CrossRef]
- Danilin, I.M.; Crow, T.R. The great siberian forest: Challenges and opportunities of scale. In Patterns and Processes in Forest Landscapes; Lafortezza, R., Chen, J., Sanesi, G., Crow, T.R., Eds.; Springer: Dordrecht, The Netherlands, 2008; pp. 47–66. [Google Scholar]
- Cai, W.H.; Yang, J.; Liu, Z.H.; Hu, Y.M.; Weisberg, P.J. Post-fire tree recruitment of a boreal larch forest in northeast china. For. Ecol. Manag. 2013, 307, 20–29. [Google Scholar] [CrossRef]
- Tautenhahn, S.; Lichstein, J.W.; Jung, M.; Kattge, J.; Bohlman, S.A.; Heilmeier, H.; Prokushkin, A.; Kahl, A.; Wirth, C. Dispersal limitation drives successional pathways in central siberian forests under current and intensified fire regimes. Glob. Chang. Biol. 2016, 22, 2178–2197. [Google Scholar] [CrossRef]
- Heon, J.; Arseneault, D.; Parisien, M.A. Resistance of the boreal forest to high burn rates. Proc. Natl. Acad. Sci. USA 2014, 111, 13888–13893. [Google Scholar] [CrossRef] [PubMed]
- Johnstone, J.F.; Hollingsworth, T.N.; Chapin Iii, F.S.; Mack, M.C. Changes in fire regime break the legacy lock on successional trajectories in alaskan boreal forest. Glob. Chang. Biol. 2010, 16, 1281–1295. [Google Scholar] [CrossRef]
- Barrett, K.; Baxter, R.; Kukavskaya, E.; Balzter, H.; Shvetsov, E.; Buryak, L. Postfire recruitment failure in scots pine forests of southern siberia. Remote Sens. Environ. 2020, 237, 111539. [Google Scholar] [CrossRef]
- Stevens-Rumann, C.S.; Kemp, K.B.; Higuera, P.E.; Harvey, B.J.; Rother, M.T.; Donato, D.C.; Morgan, P.; Veblen, T.T. Evidence for declining forest resilience to wildfires under climate change. Ecol. Lett. 2018, 21, 243–252. [Google Scholar] [CrossRef]
- Moser, B.; Temperli, C.; Schneiter, G.; Wohlgemuth, T. Potential shift in tree species composition after interaction of fire and drought in the central alps. Eur. J. For. Res. 2010, 129, 625–633. [Google Scholar] [CrossRef]
- Enright, N.J.; Fontaine, J.B.; Bowman, D.M.J.S.; Bradstock, R.A.; Williams, R.J. Interval squeeze: Altered fire regimes and demographic responses interact to threaten woody species persistence as climate changes. Front. Ecol. Environ. 2015, 13, 265–272. [Google Scholar] [CrossRef]
- Choat, B.; Jansen, S.; Brodribb, T.J.; Cochard, H.; Delzon, S.; Bhaskar, R.; Bucci, S.J.; Feild, T.S.; Gleason, S.M.; Hacke, U.G.; et al. Global convergence in the vulnerability of forests to drought. Nature 2012, 491, 752–755. [Google Scholar] [CrossRef]
- Sun, Q.; Meyer, W.S.; Koerber, G.R.; Marschner, P. Rapid recovery of net ecosystem production in a semi-arid woodland after a wildfire. Agric. For. Meteorol. 2020, 291, 108099. [Google Scholar] [CrossRef]
- Bulygina, O.N.; Razuvaev, V.N.; Korshunova, N.N.; Groisman, P.Y. Climate variations and changes in extreme climate events in russia. Environ. Res. Lett. 2007, 2, 045020. [Google Scholar] [CrossRef]
- Degefie, D.T.; Fleischer, E.; Klemm, O.; Soromotin, A.V.; Soromotina, O.V.; Tolstikov, A.V.; Abramov, N.V. Climate extremes in south western siberia: Past and future. Stoch. Environ. Res. Risk A 2014, 28, 2161–2173. [Google Scholar] [CrossRef]
- IPCC. Climate Change 2014: Synthesis Report. Contribution of Working Groups I, II and III to the Fifth Assessment Report of the Intergovernmental Panel on Climate Change; IPCC: Geneva, Switzerland, 2014; pp. 1–151. [Google Scholar]
- Seidl, R.; Thom, D.; Kautz, M.; Martin-Benito, D.; Peltoniemi, M.; Vacchiano, G.; Wild, J.; Ascoli, D.; Petr, M.; Honkaniemi, J.; et al. Forest disturbances under climate change. Nat. Clim. Chang. 2017, 7, 395–402. [Google Scholar] [CrossRef] [PubMed]
- Liu, H.; Randerson, J.T. Interannual variability of surface energy exchange depends on stand age in a boreal forest fire chronosequence. J. Geophys. Res. Biogeosci. 2008, 113. [Google Scholar] [CrossRef]
- Oris, F.; Asselin, H.; Ali, A.A.; Finsinger, W.; Bergeron, Y. Effect of increased fire activity on global warming in the boreal forest. Environ. Rev. 2014, 22, 206–219. [Google Scholar] [CrossRef]
- Harris, R.M.B.; Remenyi, T.A.; Williamson, G.J.; Bindoff, N.L.; Bowman, D. Climate-vegetation-fire interactions and feedbacks: Trivial detail or major barrier to projecting the future of the earth system? Wiley Interdiscip. Rev. Clim. Chang. 2016, 7, 910–931. [Google Scholar] [CrossRef]
- Ciavarella, A.; Cotterill, D.; Stott, P.; Kew, S.; Philip, S.; Oldenborgh, G.J.v.; Skålevåg, A.; Lorenz, P.; Robin, Y.; Otto, F.; et al. Prolonged Siberian Heat of 2020; World Weather Attribution: Oxford, UK, 2020; pp. 1–35. [Google Scholar]
- Brown, P.T.; Caldeira, K. Greater future global warming inferred from earth’s recent energy budget. Nature 2017, 552, 45–50. [Google Scholar] [CrossRef]
- Berner, L.T.; Beck, P.S.; Bunn, A.G.; Goetz, S.J. Plant response to climate change along the forest-tundra ecotone in northeastern siberia. Glob. Chang. Biol. 2013, 19, 3449–3462. [Google Scholar] [CrossRef]
- Abatzoglou, J.T.; Dobrowski, S.Z.; Parks, S.A.; Hegewisch, K.C. Terraclimate, a high-resolution global dataset of monthly climate and climatic water balance from 1958–2015. Sci. Data 2018, 5, 170191. [Google Scholar] [CrossRef]
- Arzac, A.; Babushkina, E.A.; Fonti, P.; Slobodchikova, V.; Sviderskaya, I.V.; Vaganov, E.A. Evidences of wider latewood in pinus sylvestris from a forest-steppe of southern siberia. Dendrochronologia 2018, 49, 1–8. [Google Scholar] [CrossRef]
- Groisman, P.Y.; Sherstyukov, B.G.; Razuvaev, V.N.; Knight, R.W.; Enloe, J.G.; Stroumentova, N.S.; Whitfield, P.H.; Førland, E.; Hannsen-Bauer, I.; Tuomenvirta, H.; et al. Potential forest fire danger over northern eurasia: Changes during the 20th century. Glob. Planet. Chang. 2007, 56, 371–386. [Google Scholar] [CrossRef]
- Fujinami, H.; Yasunari, T.; Watanabe, T. Trend and interannual variation in summer precipitation in eastern siberia in recent decades. Int. J. Climatol. 2016, 36, 355–368. [Google Scholar] [CrossRef]
- Myneni, R.B.; Hall, F.G.; Sellers, P.J.; Marshak, A. The interpretation of spectral vegetation indexes. IEEE Trans. Geosci. Remote 1995, 33, 481–486. [Google Scholar] [CrossRef]
- Cuevas-Gonzalez, M.; Gerard, F.; Balzter, H.; Riano, D. Analysing forest recovery after wildfire disturbance in boreal siberia using remotely sensed vegetation indices. Glob. Chang. Biol. 2009, 15, 561–577. [Google Scholar] [CrossRef]
- Shvetsov, E.G.; Kukavskaya, E.A.; Buryak, L.V.; Barrett, K. Assessment of post-fire vegetation recovery in southern siberia using remote sensing observations. Environ. Res. Lett. 2019, 14, 055001. [Google Scholar] [CrossRef]
- Khatancharoen, C.; Tsuyuki, S.; Bryanin, S.V.; Sugiura, K.; Seino, T.; Lisovsky, V.V.; Borisova, I.G.; Wada, N. Long-time interval satellite image analysis on forest-cover changes and disturbances around protected area, zeya state nature reserve, in the russian far east. Remote Sens. 2021, 13, 1285. [Google Scholar] [CrossRef]
- Hislop, S.; Jones, S.; Soto-Berelov, M.; Skidmore, A.; Haywood, A.; Nguyen, T. Using landsat spectral indices in time-series to assess wildfire disturbance and recovery. Remote Sens. 2018, 10, 460. [Google Scholar] [CrossRef]
- Walker, J.J.; Soulard, C.E. Phenology patterns indicate recovery trajectories of ponderosa pine forests after high-severity fires. Remote Sens. 2019, 11, 2782. [Google Scholar] [CrossRef]
- Pádua, L.; Guimarães, N.; Adão, T.; Sousa, A.; Peres, E.; Sousa, J.J. Effectiveness of sentinel-2 in multi-temporal post-fire monitoring when compared with uav imagery. ISPRS Int. J. Geoinf. 2020, 9, 225. [Google Scholar] [CrossRef]
- Knorre, A.A.; Kirdyanov, A.V.; Vaganov, E.A. Climatically induced interannual variability in aboveground production in forest-tundra and northern taiga of central siberia. Oecologia 2006, 147, 86–95. [Google Scholar] [CrossRef]
- Erdős, L.; Ambarlı, D.; Anenkhonov, O.A.; Bátori, Z.; Cserhalmi, D.; Kiss, M.; Kröel-Dulay, G.; Liu, H.; Magnes, M.; Molnár, Z.; et al. The edge of two worlds: A new review and synthesis on eurasian forest-steppes. Appl. Veg. Sci. 2018, 21, 345–362. [Google Scholar] [CrossRef]
- Anenkhonov, O.A.; Korolyuk, A.Y.; Sandanov, D.V.; Liu, H.; Zverev, A.A.; Guo, D. Soil-moisture conditions indicated by field-layer plants help identify vulnerable forests in the forest-steppe of semi-arid southern siberia. Ecol. Indic 2015, 57, 196–207. [Google Scholar] [CrossRef]
- Kharuk, V.I.; Im, S.T.; Oskorbin, P.A.; Petrov, I.A.; Ranson, K.J. Siberian pine decline and mortality in southern siberian mountains. For. Ecol. Manag. 2013, 310, 312–320. [Google Scholar] [CrossRef]
- Kulmatiski, A.; Beard, K.H. Woody plant encroachment facilitated by increased precipitation intensity. Nat. Clim. Chang. 2013, 3, 833–837. [Google Scholar] [CrossRef]
- Kukavskaya, E.A.; Buryak, L.V.; Ivanova, G.A.; Conard, S.G.; Kalenskaya, O.P.; Zhila, S.V.; McRae, D.J. Influence of logging on the effects of wildfire in siberia. Environ. Res Lett. 2013, 8, 045034. [Google Scholar] [CrossRef]
- Macfarlane, C.; Hoffman, M.; Eamus, D.; Kerp, N.; Higginson, S.; McMurtrie, R.; Adams, M. Estimation of leaf area index in eucalypt forest using digital photography. Agric. For. Meteorol. 2007, 143, 176–188. [Google Scholar] [CrossRef]
- Forkel, M.; Wutzler, T. Greenbrown—Land Surface Phenology and Trend Analysis. A Package for the R Software. Version 2.2, 2015-04-15. 2015. Available online: http://greenbrown.R-forge.R-project.Org/ (accessed on 8 June 2021).
- R development Core Team. R: A Language and Environment for Statistical Computing; R Foundation for Statistical Computing: Vienna, Austria, 2014. [Google Scholar]
- Kapelner, A.; Bleich, J. Bartmachine: Machine learning with bayesian additive regression trees. J. Stat. Softw. 2016, 70, 1–40. [Google Scholar] [CrossRef]
- Chipman, H.A.; George, E.I.; McCulloch, R.E. Bart: Bayesian additive regression trees. Ann. Appl. Stat. 2010, 4, 266–298. [Google Scholar] [CrossRef]
- Bates, D.; Mächler, M.; Bolker, B.; Walker, S. Fitting linear mixed-effects models usinglme4. J. Stat. Softw. 2015, 67, 1–48. [Google Scholar] [CrossRef]
- Kuznetsova, A.; Brockhoff, P.B.; Christensen, R.H.B. Lmertest: Tests in Linear Mixed Effects Models. R Package Version 2.0-30. 2016. Available online: https://cran.r-project.org/web/packages/lmerTest/ (accessed on 8 June 2021).
- Graves, S.; Piepho, H.-P.; Selzer, L.; Dorai-Raj, S. Multcompview: Visualizations of Paired Comparisons. R Package Version 0.1-7. 2015. Available online: https://cran.r-project.org/web/packages/multcompView/index.html (accessed on 8 June 2021).
- Xu, C.; Liu, H.; Anenkhonov, O.A.; Korolyuk, A.Y.; Sandanov, D.V.; Balsanova, L.D.; Naidanov, B.B.; Wu, X. Long-term forest resilience to climate change indicated by mortality, regeneration, and growth in semiarid southern siberia. Glob. Chang. Biol. 2017, 23, 2370–2382. [Google Scholar] [CrossRef]
- Thom, D.; Golivets, M.; Edling, L.; Meigs, G.W.; Gourevitch, J.D.; Sonter, L.J.; Galford, G.L.; Keeton, W.S. The climate sensitivity of carbon, timber, and species richness covaries with forest age in boreal-temperate north america. Glob. Chang. Biol. 2019, 25, 2446–2458. [Google Scholar] [CrossRef]
- Shestakova, T.A.; Gutierrez, E.; Kirdyanov, A.V.; Camarero, J.J.; Genova, M.; Knorre, A.A.; Linares, J.C.; Resco de Dios, V.; Sanchez-Salguero, R.; Voltas, J. Forests synchronize their growth in contrasting eurasian regions in response to climate warming. Proc. Natl. Acad. Sci. USA 2016, 113, 662–667. [Google Scholar] [CrossRef]
- Ichii, K.; Kondo, M.; Okabe, Y.; Ueyama, M.; Kobayashi, H.; Lee, S.-J.; Saigusa, N.; Zhu, Z.; Myneni, R. Recent changes in terrestrial gross primary productivity in asia from 1982 to 2011. Remote Sens. 2013, 5, 6043–6062. [Google Scholar] [CrossRef]
- Hansen, W.D.; Braziunas, K.H.; Rammer, W.; Seidl, R.; Turner, M.G. It takes a few to tango: Changing climate and fire regimes can cause regeneration failure of two subalpine conifers. Ecology 2018, 99, 966–977. [Google Scholar] [CrossRef] [PubMed]
- Tchebakova, N.M.; Parfenova, E.I.; Korets, M.A.; Conard, S.G. Potential change in forest types and stand heights in central siberia in a warming climate. Environ. Res. Lett. 2016, 11, 35016. [Google Scholar] [CrossRef]
- Zhu, Z.; Piao, S.; Myneni, R.B.; Huang, M.; Zeng, Z.; Canadell, J.G.; Ciais, P.; Sitch, S.; Friedlingstein, P.; Arneth, A.; et al. Greening of the earth and its drivers. Nat. Clim. Chang. 2016, 6, 791–795. [Google Scholar] [CrossRef]
- Tanja, S.; Berninger, F.; Vesala, T.; Markkanen, T.; Hari, P.; Mäkelä, A.; Ilvesniemi, H.; Hänninen, H.; Nikinmaa, E.; Huttula, T.; et al. Air temperature triggers the recovery of evergreen boreal forest photosynthesis in spring. Glob. Chang. Biol. 2003, 9, 1410–1426. [Google Scholar] [CrossRef]
- Ensminger, I.; Sveshnikov, D.; Campbell, D.A.; Funk, C.; Jansson, S.; Lloyd, J.; Shibistova, O.; Öquist, G. Intermittent low temperatures constrain spring recovery of photosynthesis in boreal scots pine forests. Glob. Chang. Biol. 2004, 10, 995–1008. [Google Scholar] [CrossRef]
- Piao, S.; Tan, J.; Chen, A.; Fu, Y.H.; Ciais, P.; Liu, Q.; Janssens, I.A.; Vicca, S.; Zeng, Z.; Jeong, S.J.; et al. Leaf onset in the northern hemisphere triggered by daytime temperature. Nat. Commun. 2015, 6, 6911. [Google Scholar] [CrossRef] [PubMed]
- Shestakova, T.; Voltas, J.; Saurer, M.; Siegwolf, R.; Kirdyanov, A. Warming effects on pinus sylvestris in the cold–dry siberian forest–steppe: Positive or negative balance of trade? Forests 2017, 8, 490. [Google Scholar] [CrossRef]
- Kaufmann, R.K.; D’Arrigo, R.D.; Laskowski, C.; Myneni, R.B.; Zhou, L.; Davi, N.K. The effect of growing season and summer greenness on northern forests. Geophys. Res. Lett. 2004, 31. [Google Scholar] [CrossRef]
- Lapenis, A.; Shvidenko, A.; Shepaschenko, D.; Nilsson, S.; Aiyyer, A. Acclimation of russian forests to recent changes in climate. Glob. Chang. Biol. 2005, 11, 2090–2102. [Google Scholar] [CrossRef]
- Mencuccini, M.; Grace, J. Climate influences the leaf area/sapwood area ratio in scots pine. Tree Physiol. 1994, 15, 1–10. [Google Scholar] [CrossRef]
- Korotaeva, N.E.; Ivanova, M.V.; Suvorova, G.G.; Borovskii, G.B. The impact of the environmental factors on the photosynthetic activity of common pine (pinus sylvestris) in spring and in autumn in the region of eastern siberia. J. For. Res. (Harbin) 2017, 29, 1465–1473. [Google Scholar] [CrossRef]
- Rigling, A.; Waldner, P.O.; Forster, T.; Bräker, O.U.; Pouttu, A. Ecological interpretation of tree-ring width and intraannual density fluctuations in pinus sylvestris on dry sites in the central alps and siberia. Can. J. For. Res. 2001, 31, 18–31. [Google Scholar] [CrossRef]
- Knorre, A.A.; Siegwolf, R.T.W.; Saurer, M.; Sidorova, O.V.; Vaganov, E.A.; Kirdyanov, A.V. Twentieth century trends in tree ring stable isotopes (δ13c andδ18o) oflarix sibiricaunder dry conditions in the forest steppe in siberia. J. Geophys. Res. 2010, 115. [Google Scholar] [CrossRef]
- Tchebakova, N.M.; Kolle, O.; Zolotoukhine, D.; Arneth, A.; Styles, J.M.; Vygodskaya, N.N.; Schulze, E.D.; Shibistova, O.; Lloyd, J. Inter-annual and seasonal variations of energy and water vapour fluxes above a pinus sylvestris forest in the siberian middle taiga. Tellus B Chem. Phys. Meteorol. 2002, 54, 537–551. [Google Scholar] [CrossRef]
- Urban, J.; Rubtsov, A.V.; Urban, A.V.; Shashkin, A.V.; Benkova, V.E. Canopy transpiration of a larix sibirica and pinus sylvestris forest in central siberia. Agric. For. Meteorol. 2019, 271, 64–72. [Google Scholar] [CrossRef]
- Holloway, J.; Mengersen, K. Statistical machine learning methods and remote sensing for sustainable development goals: A review. Remote Sens. 2018, 10, 1365. [Google Scholar] [CrossRef]
- Koehler, J.; Kuenzer, C. Forecasting spatio-temporal dynamics on the land surface using earth observation data—A review. Remote Sens. 2020, 12, 3513. [Google Scholar] [CrossRef]


| Site | Bulk Density | Sand | Silt | Clay | Year of Fire | Recovery Trajectory towards: |
|---|---|---|---|---|---|---|
| (g/cm3) | (%) | (%) | (%) | |||
| G1 | 1.16 | 69.6 | 13.4 | 16.9 | 2002 | Grassland |
| G2 | 1.57 | 82.2 | 2.1 | 15.8 | 2000 | Grassland |
| G3 | - | - | - | - | 2000 | Grassland |
| G4 | 1.33 | 81.5 | 6.5 | 12.1 | 1999 | Grassland |
| G5 | 1.31 | 70.2 | 13.9 | 16.0 | 2000 | Grassland |
| G6 | 1.32 | 74.2 | 11.2 | 14.6 | 2000 | Grassland |
| G7 | 1.19 | 59.3 | 19.2 | 21.6 | 1997 | Grassland |
| SP1 | 1.53 | 81.5 | 2.3 | 16.2 | 2000 | Scots pine stand |
| SP2 | 1.59 | 67.5 | 16.9 | 15.6 | 1996 | Scots pine stand |
| SP3 | 1.37 | 73.2 | 14.4 | 12.4 | 1994 | Scots pine stand |
| SP4 | 1.49 | 72.4 | 12.5 | 15.1 | 1994 | Scots pine stand |
| SP5 | 1.45 | 78.4 | 4.5 | 17.2 | 2000 | Scots pine stand |
| Mix1 | 1.44 | 79.6 | 9.9 | 10.4 | 2003 | Mixed stand |
| Mix2 | 1.43 | 57.8 | 18.9 | 23.3 | 2003 | Mixed stand |
| Mix3 | 1.36 | 60.6 | 21.7 | 17.7 | 1987 | Mixed stand |
| Mix4 | 1.39 | 72.4 | 11.1 | 16.5 | 2003 | Mixed stand |
| C1 | 1.40 | 66.1 | 13.7 | 20.1 | - | Mature Scots pine stand |
| C2 | 1.42 | 64.7 | 16.6 | 18.7 | - | Mature Scots pine stand |
| C3 | 1.32 | 52.3 | 22.3 | 25.4 | - | Mature Scots pine stand |
Publisher’s Note: MDPI stays neutral with regard to jurisdictional claims in published maps and institutional affiliations. |
© 2021 by the authors. Licensee MDPI, Basel, Switzerland. This article is an open access article distributed under the terms and conditions of the Creative Commons Attribution (CC BY) license (https://creativecommons.org/licenses/by/4.0/).
Share and Cite
Sun, Q.; Burrell, A.; Barrett, K.; Kukavskaya, E.; Buryak, L.; Kaduk, J.; Baxter, R. Climate Variability May Delay Post-Fire Recovery of Boreal Forest in Southern Siberia, Russia. Remote Sens. 2021, 13, 2247. https://doi.org/10.3390/rs13122247
Sun Q, Burrell A, Barrett K, Kukavskaya E, Buryak L, Kaduk J, Baxter R. Climate Variability May Delay Post-Fire Recovery of Boreal Forest in Southern Siberia, Russia. Remote Sensing. 2021; 13(12):2247. https://doi.org/10.3390/rs13122247
Chicago/Turabian StyleSun, Qiaoqi, Arden Burrell, Kirsten Barrett, Elena Kukavskaya, Ludmila Buryak, Jörg Kaduk, and Robert Baxter. 2021. "Climate Variability May Delay Post-Fire Recovery of Boreal Forest in Southern Siberia, Russia" Remote Sensing 13, no. 12: 2247. https://doi.org/10.3390/rs13122247
APA StyleSun, Q., Burrell, A., Barrett, K., Kukavskaya, E., Buryak, L., Kaduk, J., & Baxter, R. (2021). Climate Variability May Delay Post-Fire Recovery of Boreal Forest in Southern Siberia, Russia. Remote Sensing, 13(12), 2247. https://doi.org/10.3390/rs13122247