1. Introduction
The recent development of carbon balance instrumental control technology is aimed at, but not limited to, highly accurate evaluation of sources and sinks of major greenhouse gases (GHG) by natural landscapes, cities, industrial and agricultural objects. In particular, precise measurements of GHG distribution in the atmosphere with global coverage and sufficient spatial and temporal resolution may facilitate the characterization of carbon balance at the macroregional level [
1]. As the role of particular natural systems in such a balance may evolve following climate change, it is essential to provide continuous monitoring with sufficient spatial and temporal resolution. To date, the connection between global GHG transport models and the characterization of local GHG sources/sinks processes remains a serious challenge for global monitoring systems [
2]. Direct assimilation of monitoring data by atmospheric models is complicated because CO
2 is a well-mixed gas whose mixing ratio varies only by a few percent. One way to improve the characterization of carbon dioxide atmospheric transport is its precise vertical profiling which, along with detailed mapping provided by the existing and future spaceborne instruments, may efficiently augment the datasets employed in global carbon balance models.
Besides monitoring carbon dioxide, the most abundant GHG, it is essential to precisely measure tropospheric methane and stratospheric water vapor. Methane is the second strongest GHG, which provides a major contribution to the greenhouse effect after carbon dioxide and plays a crucial role in forming atmospheric aerosol at the tropopause [
3]. In turn, water vapor, albeit not an anthropogenic GHG, contributes a lot to the thermal forcing in the upper layers of the troposphere and lower layers of the stratosphere. Water vapor is also an active component of atmospheric chemistry, particularly providing hydroxyl in the upper atmosphere and contributing to the synthesis of tropospheric ozone, methane, and other components [
4]. Simultaneous measurement of molecular oxygen, which is well distributed in the atmosphere with the known mixing ratio, allows taking dry gas correction factor and gather pressure and temperature data for GHG profiling [
5]. For these reasons, accurate measurements of CO
2, H
2O, CH
4 and O
2 distributions and their variations in space and time on a global scale up to the mesopause is crucial for the understanding of climate forcing processes. The existing satellite missions measure only column GHG abundances, while the ground-based platforms, capable of vertical profiling, are limited by a height of 30 km and insensitive to GHG contents at a higher level. However, essential processes related to GHG advection and photochemical destruction occur in the stratosphere, where highly accurate measurements are needed to verify existing models [
6].
Although stratospheric circulation models are well developed and assimilate extended datasets of both remote and in situ aerologic sounding, simultaneous retrievals of wind speed field along with GHG concentration may further improve quantitative assessment of their fluxes. Eddy covariance technique is known to provide accurate GHG flux assessment based on simultaneous local measurements of target species mixing ratio and wind variations [
7], which may be extrapolated on the macro-regional level [
8]. Therefore, it is challenging to employ a remote sensing technique for tracking eddy variations of both GHG mixing ratios and wind speed at larger scales to better access carbon balance at a global scale. There are various techniques of remote sensing atmospheric flows, in particular, Doppler measurements of O
2 and OH emission lines with the Fabry–Perot interferometer [
9] or radar sounding [
10] that provide information about wind speed in the middle and upper atmosphere. Tropospheric winds could be measured with infrared lidars [
11] and with the help of in situ probes [
12]. A capability of remote wind speed Doppler measurements up to 50 km height employing heterodyne spectroscopy in the NIR spectral range has been recently demonstrated [
13]. Direct wind speed measurements in the upper layers of the atmosphere for a nearly 20-year period have been accomplished by Fabry–Perot interferometer TIDI onboard TIMED orbiter [
14]. TIDI measures wind speed in the range of heights of 85–105 km with a vertical resolution of 2 km and accuracy of 3 m/s. Another space mission for wind measurements is ADM-Aeolus [
15] with an accuracy of less than 2 m/s.
Ground-based GHG measurements have been continuously carried out since the 1950s. Numerous measurement techniques were exploited for this purpose [
16]. To develop long-term monitoring infrastructure and increase data quality, global networks of GHG monitoring ground stations, such as Total Carbon Column Observing Network (TCCON), have been created [
17]. This network is remarkable as it is based on commercial Fourier spectrometers with a high spectral resolution of 0.02 cm
−1 as the main instrument. In addition to highly accurate column abundance measurement, this instrument is also capable of vertical GHG profiling. TCCON datasets are widely used for assimilation in climate models [
18] and satellite data validation [
19].
Space missions dedicated to GHG monitoring from orbit are SCIAMACHY, GOSAT, and OCO-2, which have been taking GHG measurements with high accuracy and global coverage for the last decade. SCIAMACHY stopped its mission in 2012 [
20] while GOSAT and OCO-2 are still in operation. GOSAT’s primary instrument is a Fourier spectrometer, which measures column abundance of CO
2, H
2O, CH
4, O
2, O
3 in the visible, NIR, and mid-infrared (MIR) spectral ranges in the nadir mode from a Sun-synchronous orbit [
21]. OCO-2 carries onboard a grating spectrometer, which measures CO
2 and O
2 in the NIR, and SWIR spectral ranges in a similar observation geometry as GOSAT [
22]. In a further development of these missions’ success, new generation probes GOSAT-2, and OCO-3 with minor changes and improvements have been recently launched to continue monitoring GHG abundance variations in the atmosphere [
23,
24]. To close the gap in the continuity of air pollutants observations after lost ENVISAT a new mission TROPOMI was launched in 2017 [
25]. Nowadays, according to the calendar of current and future missions, the area of compact orbital probes for GHG remote sensing is actively expanding [
26,
27].
The power of high-resolution spectroscopy employing both diffraction and Fourier transform techniques for the orbital remote sensing of the Earth’s and planetary atmospheres have been demonstrated by numerous space missions, including SCIAMACHY, GOSAT, OCO-2, Mars Global Surveyor, Mars-Express, ExoMars 2016, and Venus-Express [
20,
21,
22,
28,
29,
30,
31,
32]. Instruments involved in the enlisted missions implement spectral resolution limited to about 0.2 cm
−1, are heavyweight, have a high cost, and large dimensions. Further increase of spectral resolution available for Earth observation spaceborne instruments and optimization of their dimensions, weight and cost is an ambitious challenge for the future space missions design.
Solar occultation sounding is known to be a highly sensitive method of remote sounding the stratosphere and mesosphere in the optical spectral range. However, a major disadvantage of this technique is low spatial resolution, as the procedure of vertical profile retrievals usually implies the assumption that the atmosphere is uniform in the horizontal direction. Based on high-resolution heterodyne spectroscopy, one may overcome this limitation by estimating concentration variations of target species along the slant-sounding path. Indeed, for a pressure-broadened spectral line, each specific part of its contour is formed under conditions corresponding to the frequency offset from the line center. The central Doppler broadened part of the line contour is formed mainly in the upper part of the line of sight under lower pressure, whereas its wings are formed at lower altitudes under higher pressure. This circumstance provides an opportunity to retrieve horizontal variations along the line of sight and therefore improve the results of solar occultation spectroscopic sounding.
Heterodyne near-infrared spectroscopy is known to be capable of providing unprecedented spectral resolution up to λ/δλ~10
7, which corresponds to ~10
−4 cm
−1. Not only such a resolution allows studying the composition and structure of the atmosphere, but its dynamics as well [
13], with the equipment remaining compact and low cost. Moreover, this mission may be implemented based on the CubeSat 6U form factor. Significant progress in the development of NIR heterodyne spectroradiometers utilizing commercial telecom components has been recently achieved [
33,
34,
35,
36,
37]. Besides several ground-based instruments operating in the direct Sun observation mode, a mission implementing a compact heterodyne spectroradiometer for atmospheric CO
2, CH
4, and δ
13CH
4 measurements in the range of tangent heights of 10–55 km was proposed [
38]. This project implies atmospheric sounding in two spectral ranges, MIR and NIR, where the NIR spectroradiometer has a multichannel configuration of the heterodyne receiver based on a balanced detector scheme. Another group presented a detailed technical description of a compact NIR heterodyne spectroradiometer for CO
2, H
2O, and CH
4 profiling in the range of tangent heights of 6–35 km [
39]. The instrument includes one local oscillator that provides absorption features measurement of three gases within a single laser frequency scan. However, according to the presented synthetic spectra in the work [
39], one may suppose that measurements in the range of 6–18 km would have a larger systematic error at the postprocessing stage than in the range 18–35 km due to the baseline retrieval problem. Additionally, due to the bandpass of the intermediate frequency (IF) receiver of 1.5 GHz, the spectral resolution of the instrument is insufficient to retrieve Doppler information on the atmospheric flows. The instrument has been adapted to the CubeSat 6U platform and launched in 2019 [
40]. Unfortunately, according to the flight report, the probe failed to achieve solar alignment in time due to the failure of the search algorithm in the attitude control unit. After 17 h of operation, its power storage was exhausted, and the connection with the probe was lost [
41]. Despite this setback, the mission gave a unique experience, from developing a ground-based prototype [
33] to the production and flight test of the first spaceborne NIR heterodyne spectroradiometer.
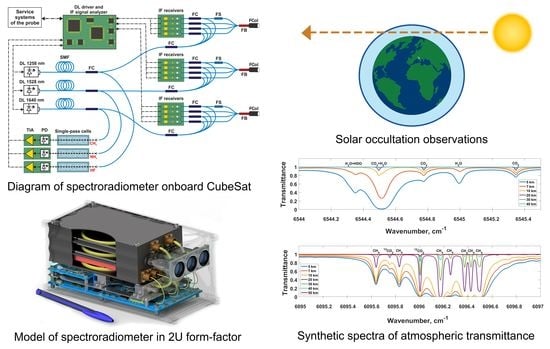
This paper describes the concept of a spaceborne multichannel heterodyne spectroradiometer for GHG remote sensing to be flown as a microsatellite’s science payload. This work is focused on the payload structure, whereas the engineering details of a satellite platform and service systems are mainly omitted. The estimates of the proposed spectroradiometer’s measurement capabilities are based on laboratory and field experiments carried out with a ground-based prototype of the Multichannel Laser Heterodyne Spectroradiometer (MLHS).
2. Mission Objectives
The main goal of this work is the proof of concept of a compact, lightweight, and low-cost heterodyne spectroradiometer for continuous GHG monitoring from the upper troposphere to the mesosphere. We propose developing a network of small probes with such a payload for better coverage of the Earth and a shorter period of time lasting between consecutive measurements over the same area. Due to the heterodyne spectroradiometer’s advantages, it may be used as an additional payload for future spacecraft constellations such as Starlink or Sfera as well as for individual spacecraft. As an initial step in the implementation of such a project, in this paper, we analyze measurement capabilities of the heterodyne spectroradiometer operating as a separate 6U CubeSat, placed on low Earth orbit (LEO), e.g., the International Space Station’s (ISS) orbit.
The science goal of the proposed instrument is the study of atmospheric structure, chemical composition, and dynamics in the range of tangent heights from 5 to 50 km in the NIR spectral range. The spectrometer is capable of continuous monitoring of CO2, H2O, CH4, and O2 in the solar occultation mode with expected integration time allowing for GHG vertical profiling. At the same time, O2 measurements provide information on the basic atmospheric parameters, such as temperature and density profiles, crucial for precise mixing ratios retrievals. In addition, wind speed projection to the line of sight, i.e., to the Sun direction, may be retrieved by analyzing Doppler distortion of observed spectral lines. Among other applications, observations in the proposed heights range may provide information on the dynamics of the stratospheric polar vortex, including its collapse associated with polar warmings, and clarify the potential role of GHG in the Arctic region, most affected by climate change today.
Evidently, the mission lacks the lower troposphere, where the carbon exchange between the atmosphere and surface inventories occurs.
3. Ground-Based Prototype of the MLHS
An introduction to the laser heterodyne spectroscopy in the NIR spectral range and details of different multichannel infrared heterodyne receiver implementation techniques could be found in [
35,
36,
42,
43,
44,
45]. This section presents the ground-based prototype of the MLHS employed for field measurements and discusses its analytical characteristics and capabilities.
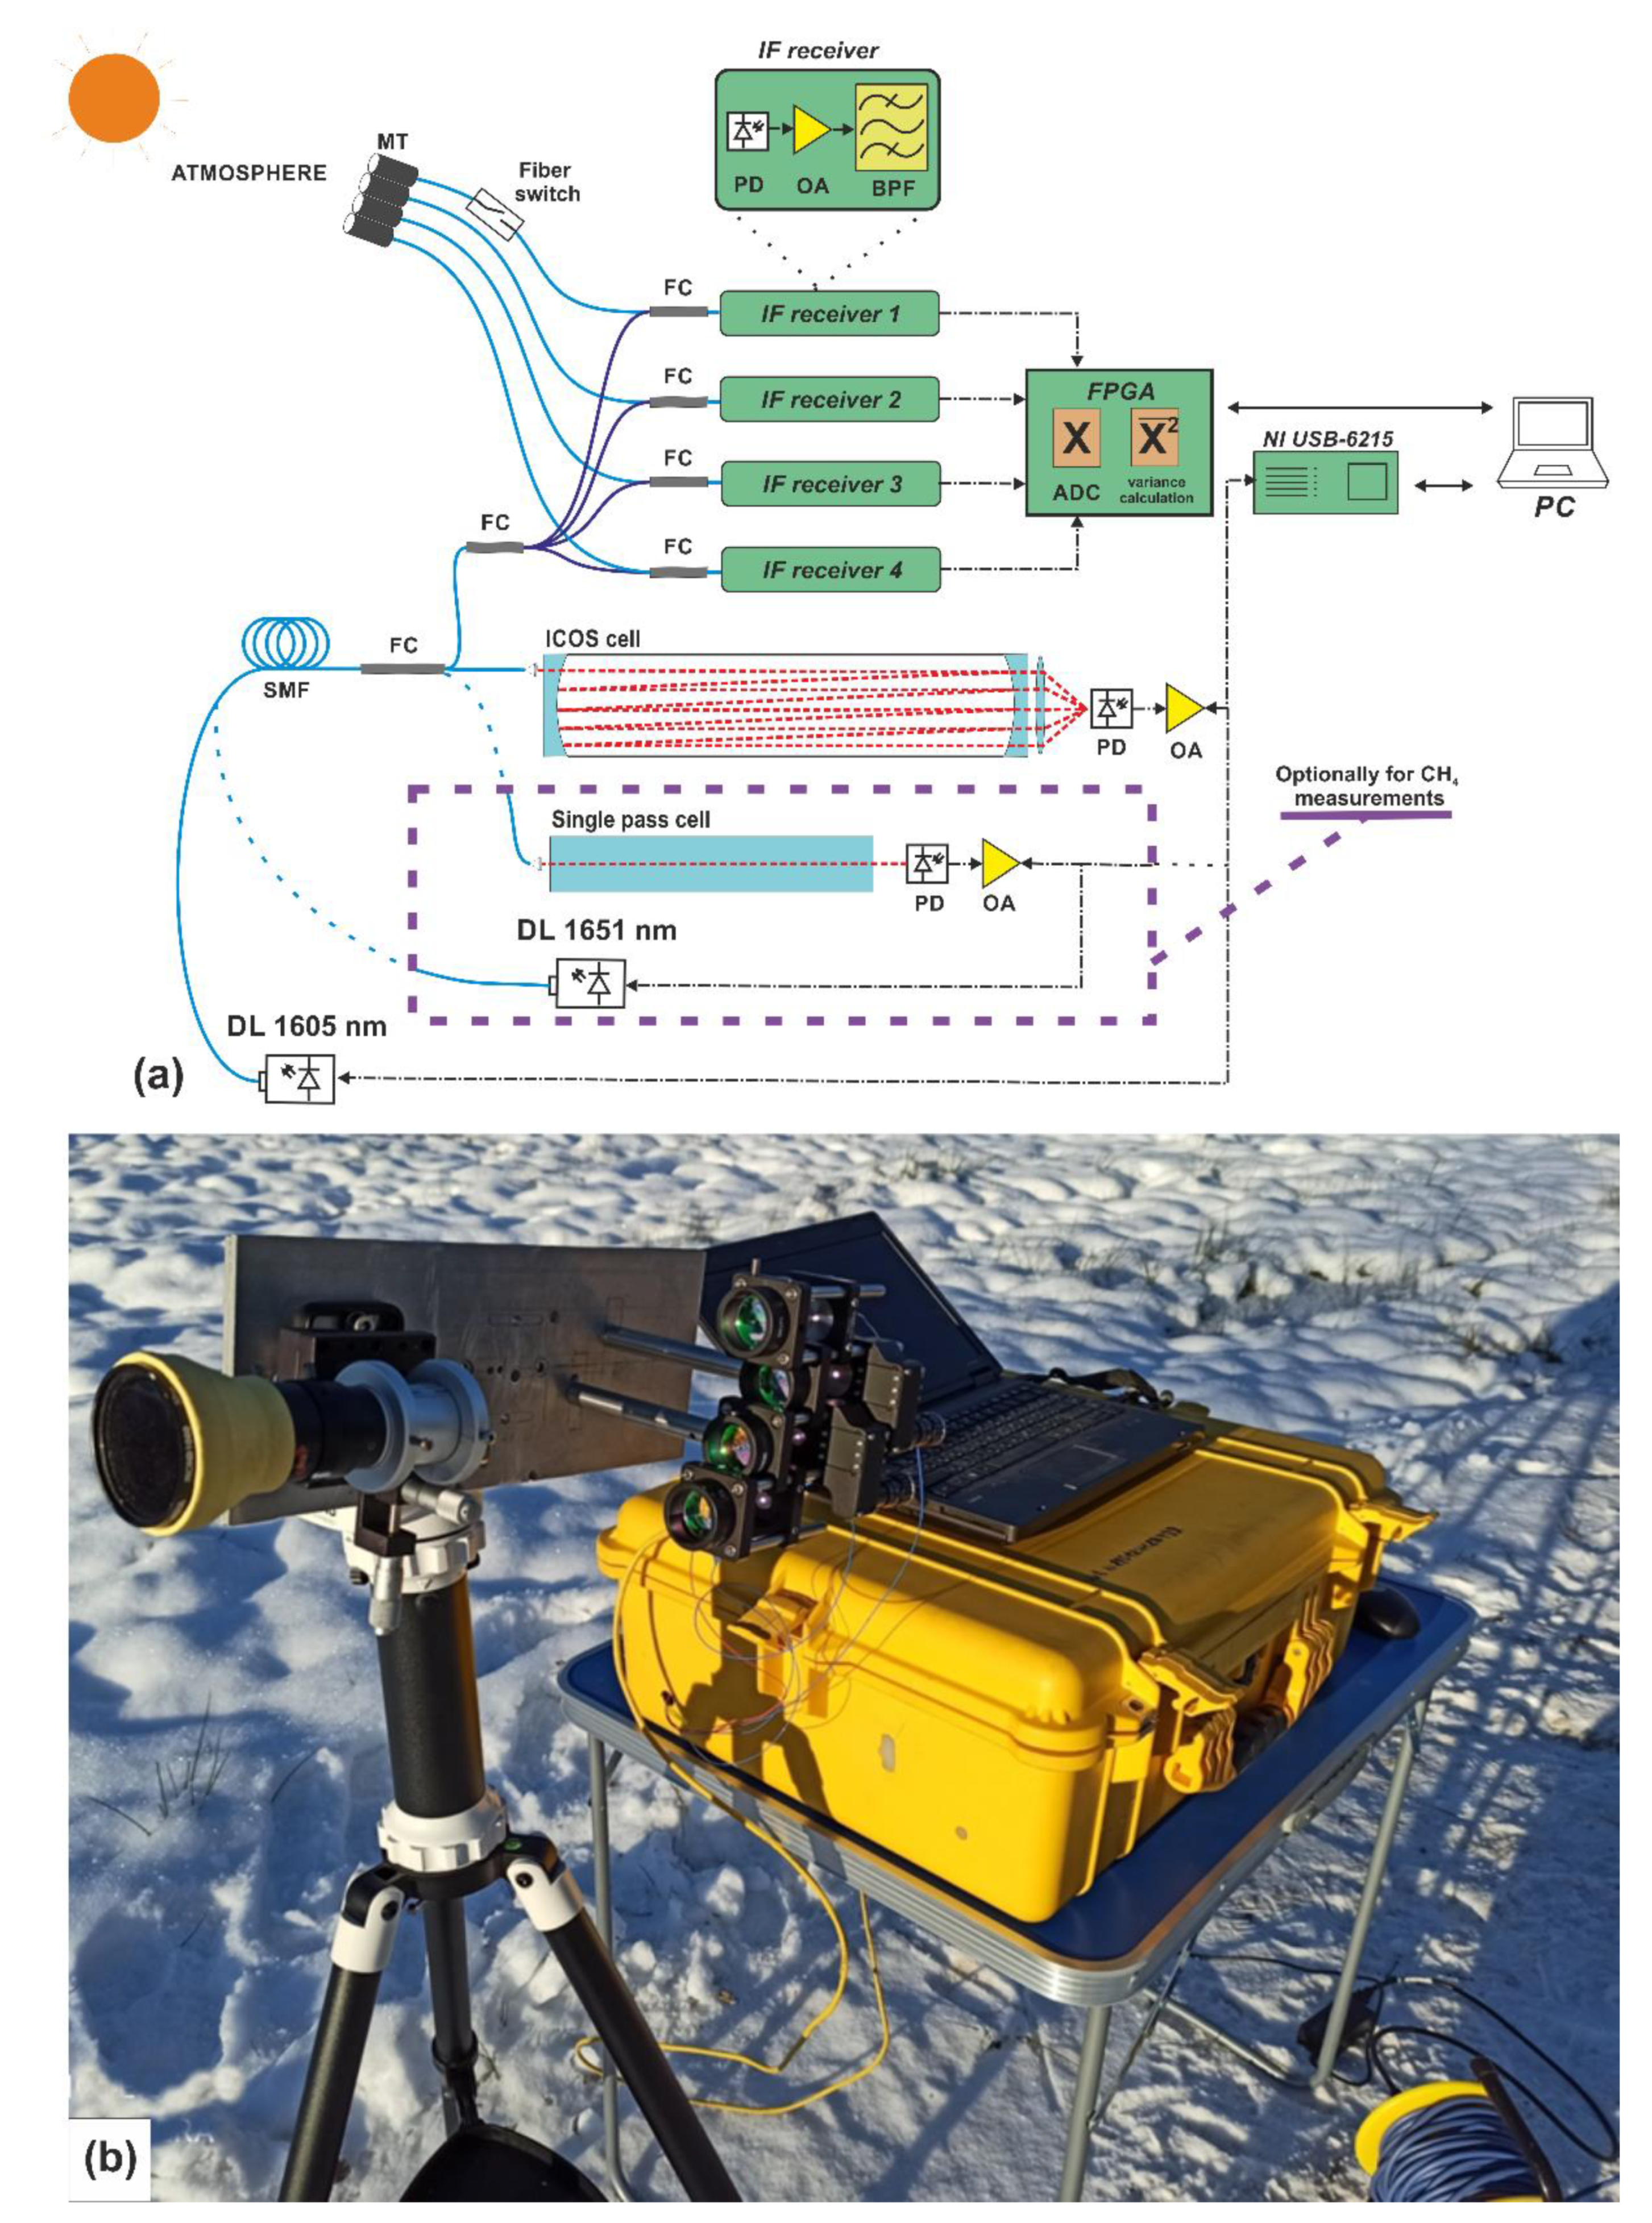
Figure 1 demonstrates a sketch and real form of the MLHS prototype capable of measuring atmospheric absorption of carbon dioxide and methane in the vicinity of 1605 and 1651 nm, respectively, by direct Sun observation. The spectroradiometer has four identical heterodyne channels, each consisting of entrance optics, photodetectors, and intermediate frequency (IF) receivers. The role of these channels is to detect laser radiation superimposed by a fiber coupler (FC) with solar radiation passed through the atmosphere. The IF receiver circuit, which extracts the IF beat signal, has a transimpedance amplifier with a feedback resistance of 5 kOhm, and a sequence of cascades with the gain factor of G ~750 and bandwidth of B ~20 MHz. The signal from each IF receiver is digitized by an 8-bit analog-to-digital converter (ADC) at the sampling frequency of 75 MHz and then processed by a field-programmable gate array (FPGA)-based IF signal analyzer. Next step of IF signal processing is variance calculation provided by the IF signal analyzer to form a line contour. Final data treatment, including integration and averaging of measured spectra, are organized on the PC. Diode laser (DL), which plays a local oscillator role in the MLHS prototype, is controlled by the electronic board NI USB-6215 (NATIONAL INSTRUMENTS CORP., Austin, TX, USA) synchronized with the IF signal analyzer. For accurate stabilization of the DL frequency, a reference gas cell channel is included in the feedback contour. The following instrument’s components are used to measure atmospheric carbon dioxide: a distributed feedback (DFB) DL emitting at the wavelength of 1605 nm; an Integrated Cavity Output Spectroscopy (ICOS) cell [
46] with an effective optical path of 30 m, which was filled with CO
2 and employed as a reference channel. For methane measurements, a DFB DL emitting at the wavelength of 1651 nm was employed, while the ICOS cell was replaced by a single-pass optical cell of 4 cm length filled with CH
4 (these components highlighted by a dashed purple rectangle in
Figure 1a).
While in the previous developments of a heterodyne spectroradiometer presented in [
13,
44,
45] the IF bandwidth of the heterodyne receiver was a few MHz,now, the electronic bandwidth is B = 20 MHz for signal-to-noise ratio (SNR) improvement, as it has a root dependency of the bandwidth.
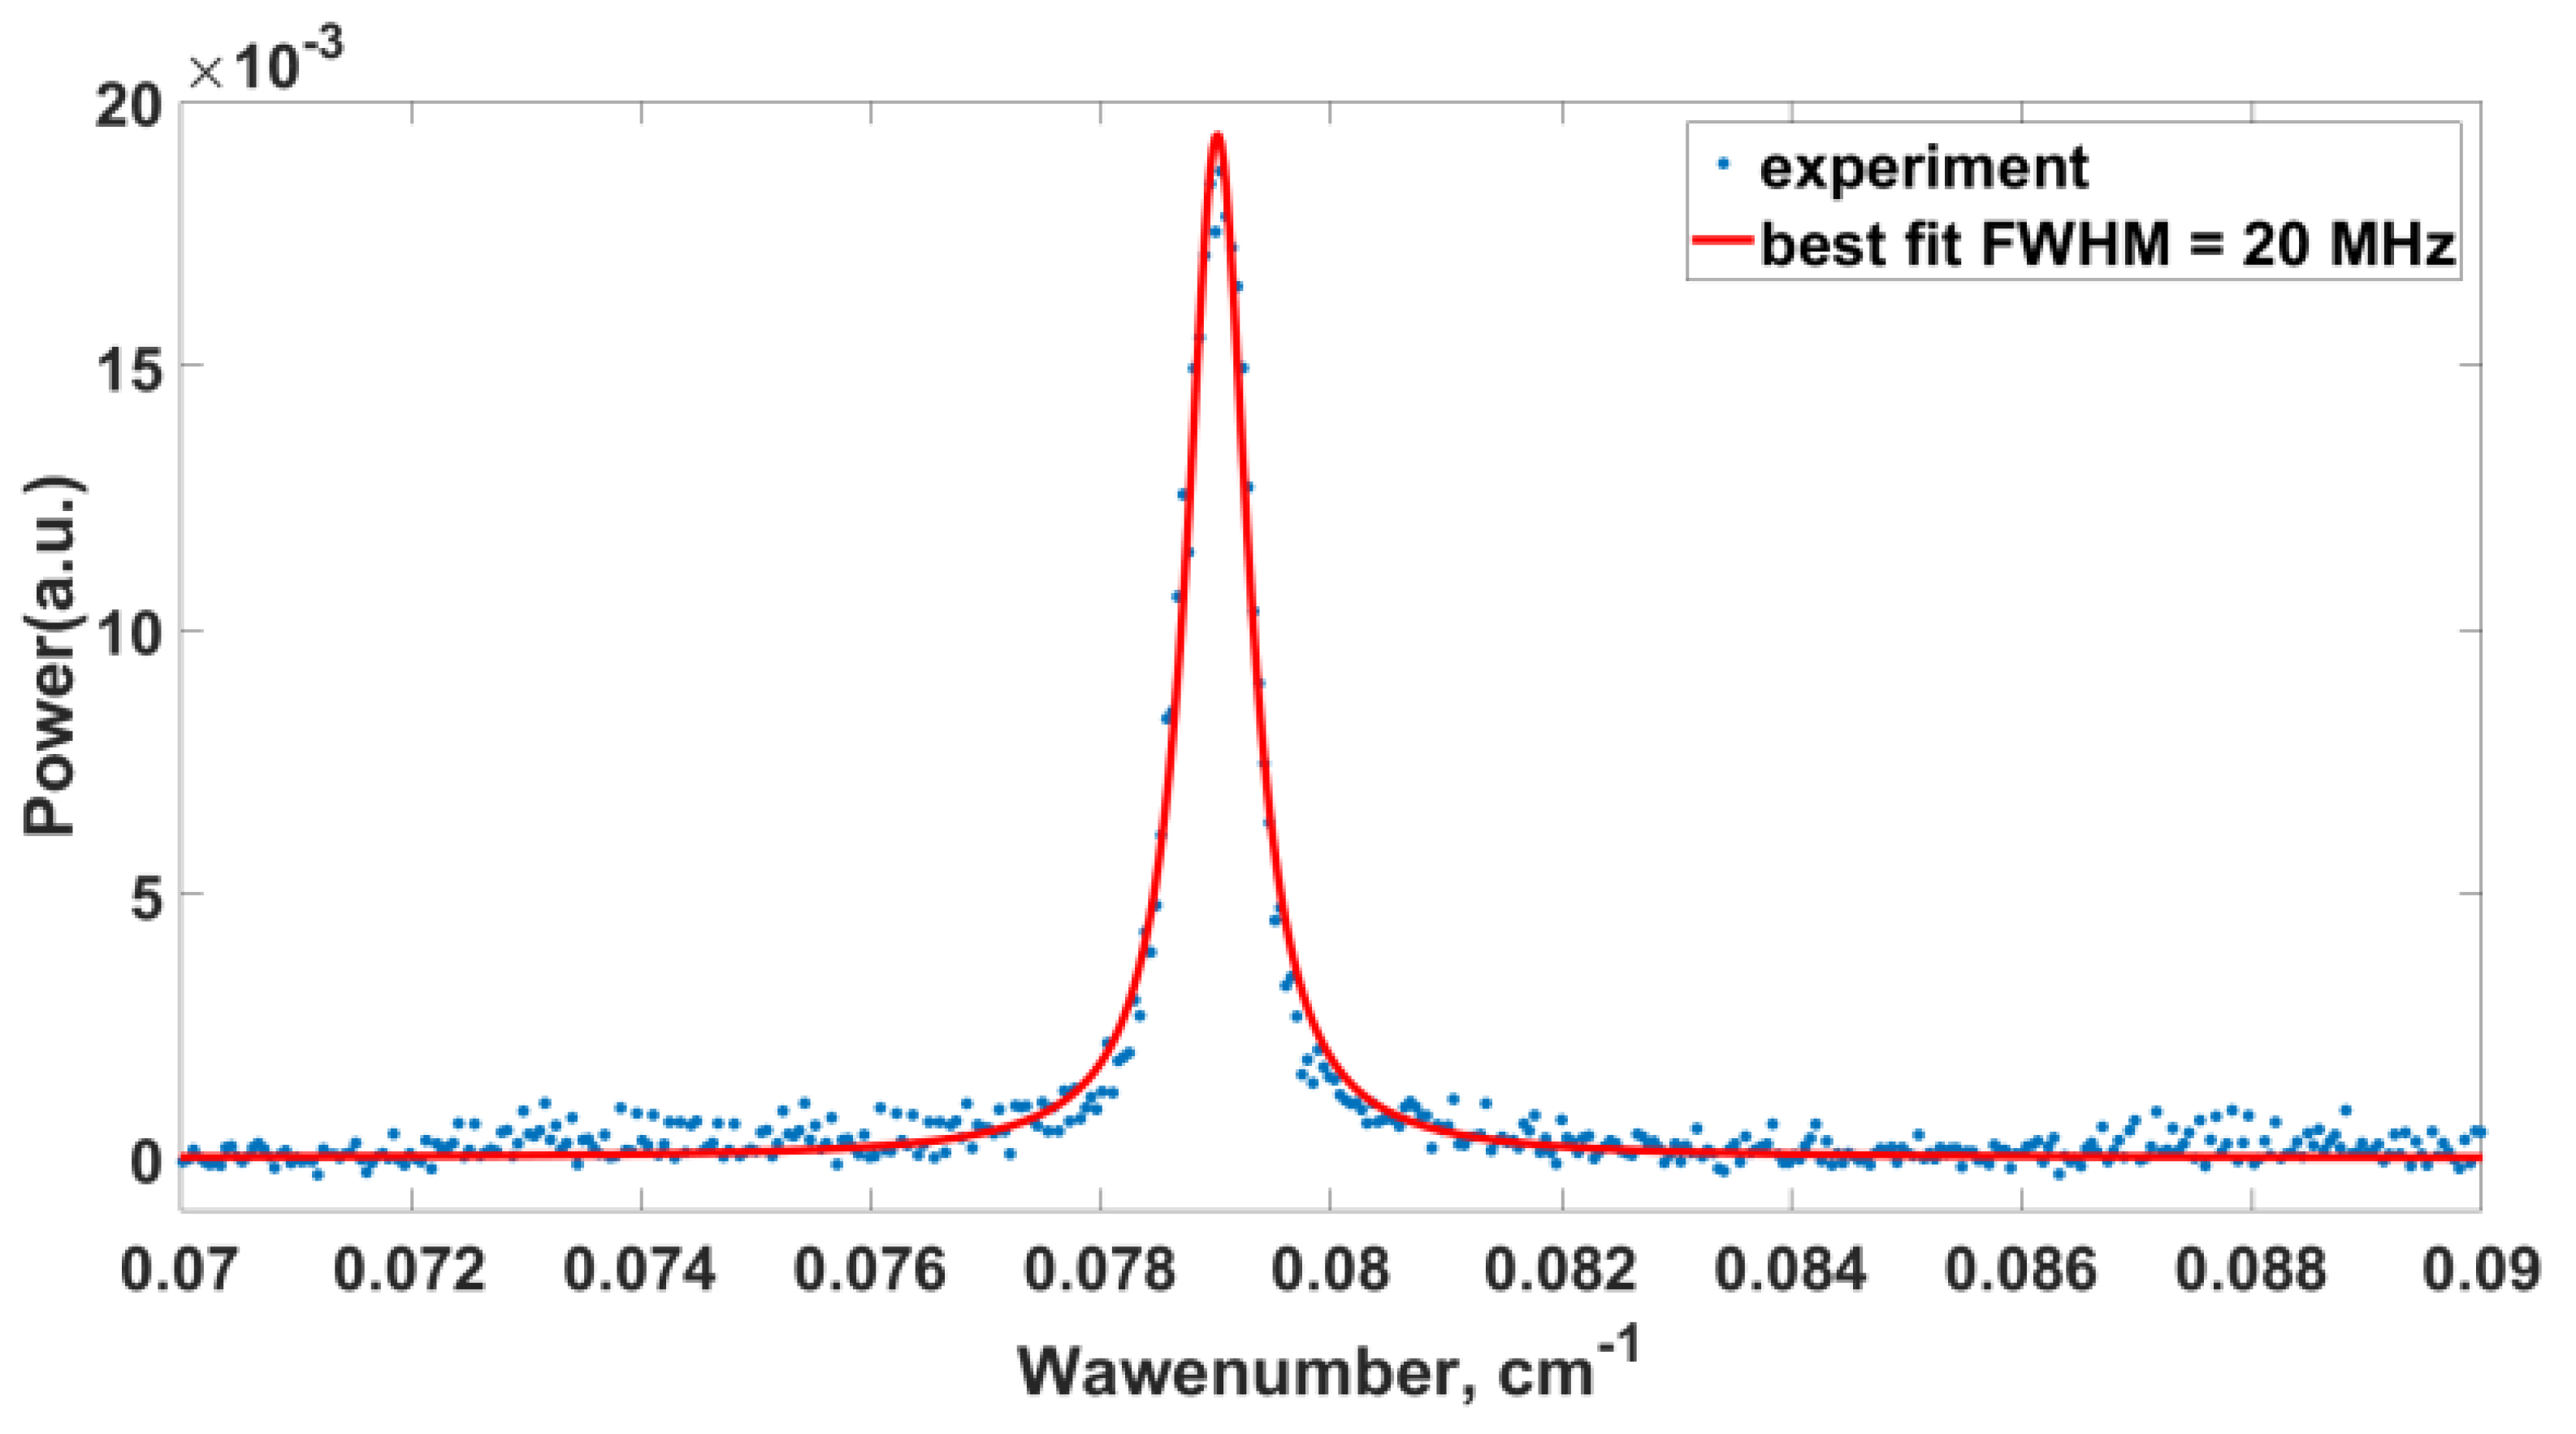
Figure 2 presents a beat signal on the single IF receiver (blue dots) registered by coupling radiation beams from two identical DLs with a wavelength of 1651 nm for IF bandwidth validation. One laser worked in the pump current modulation mode, while the other laser emitted radiation at the fixed frequency, with an accuracy of 3 MHz. The IF beat signal with the Lorentzian best fit (red curve in
Figure 2) has a full width at half maximum (FWHM) = 20 MHz and provides a spectral resolution of the MLHS ground-based prototype about 40 MHz, or 0.0013 cm
−1 due to the double-sideband treatment.
Precise stabilization of the DL frequency is crucial for measurements with a high spectral resolution to avoid distortion of the measured spectral line profile. As mentioned above, the reference channel with the optical cell, where the absorption line of the interest is continuously observed, was employed for DL frequency stabilization. Based on the line peak position, additional feedback is implemented to keep the DL frequency with defined accuracy.
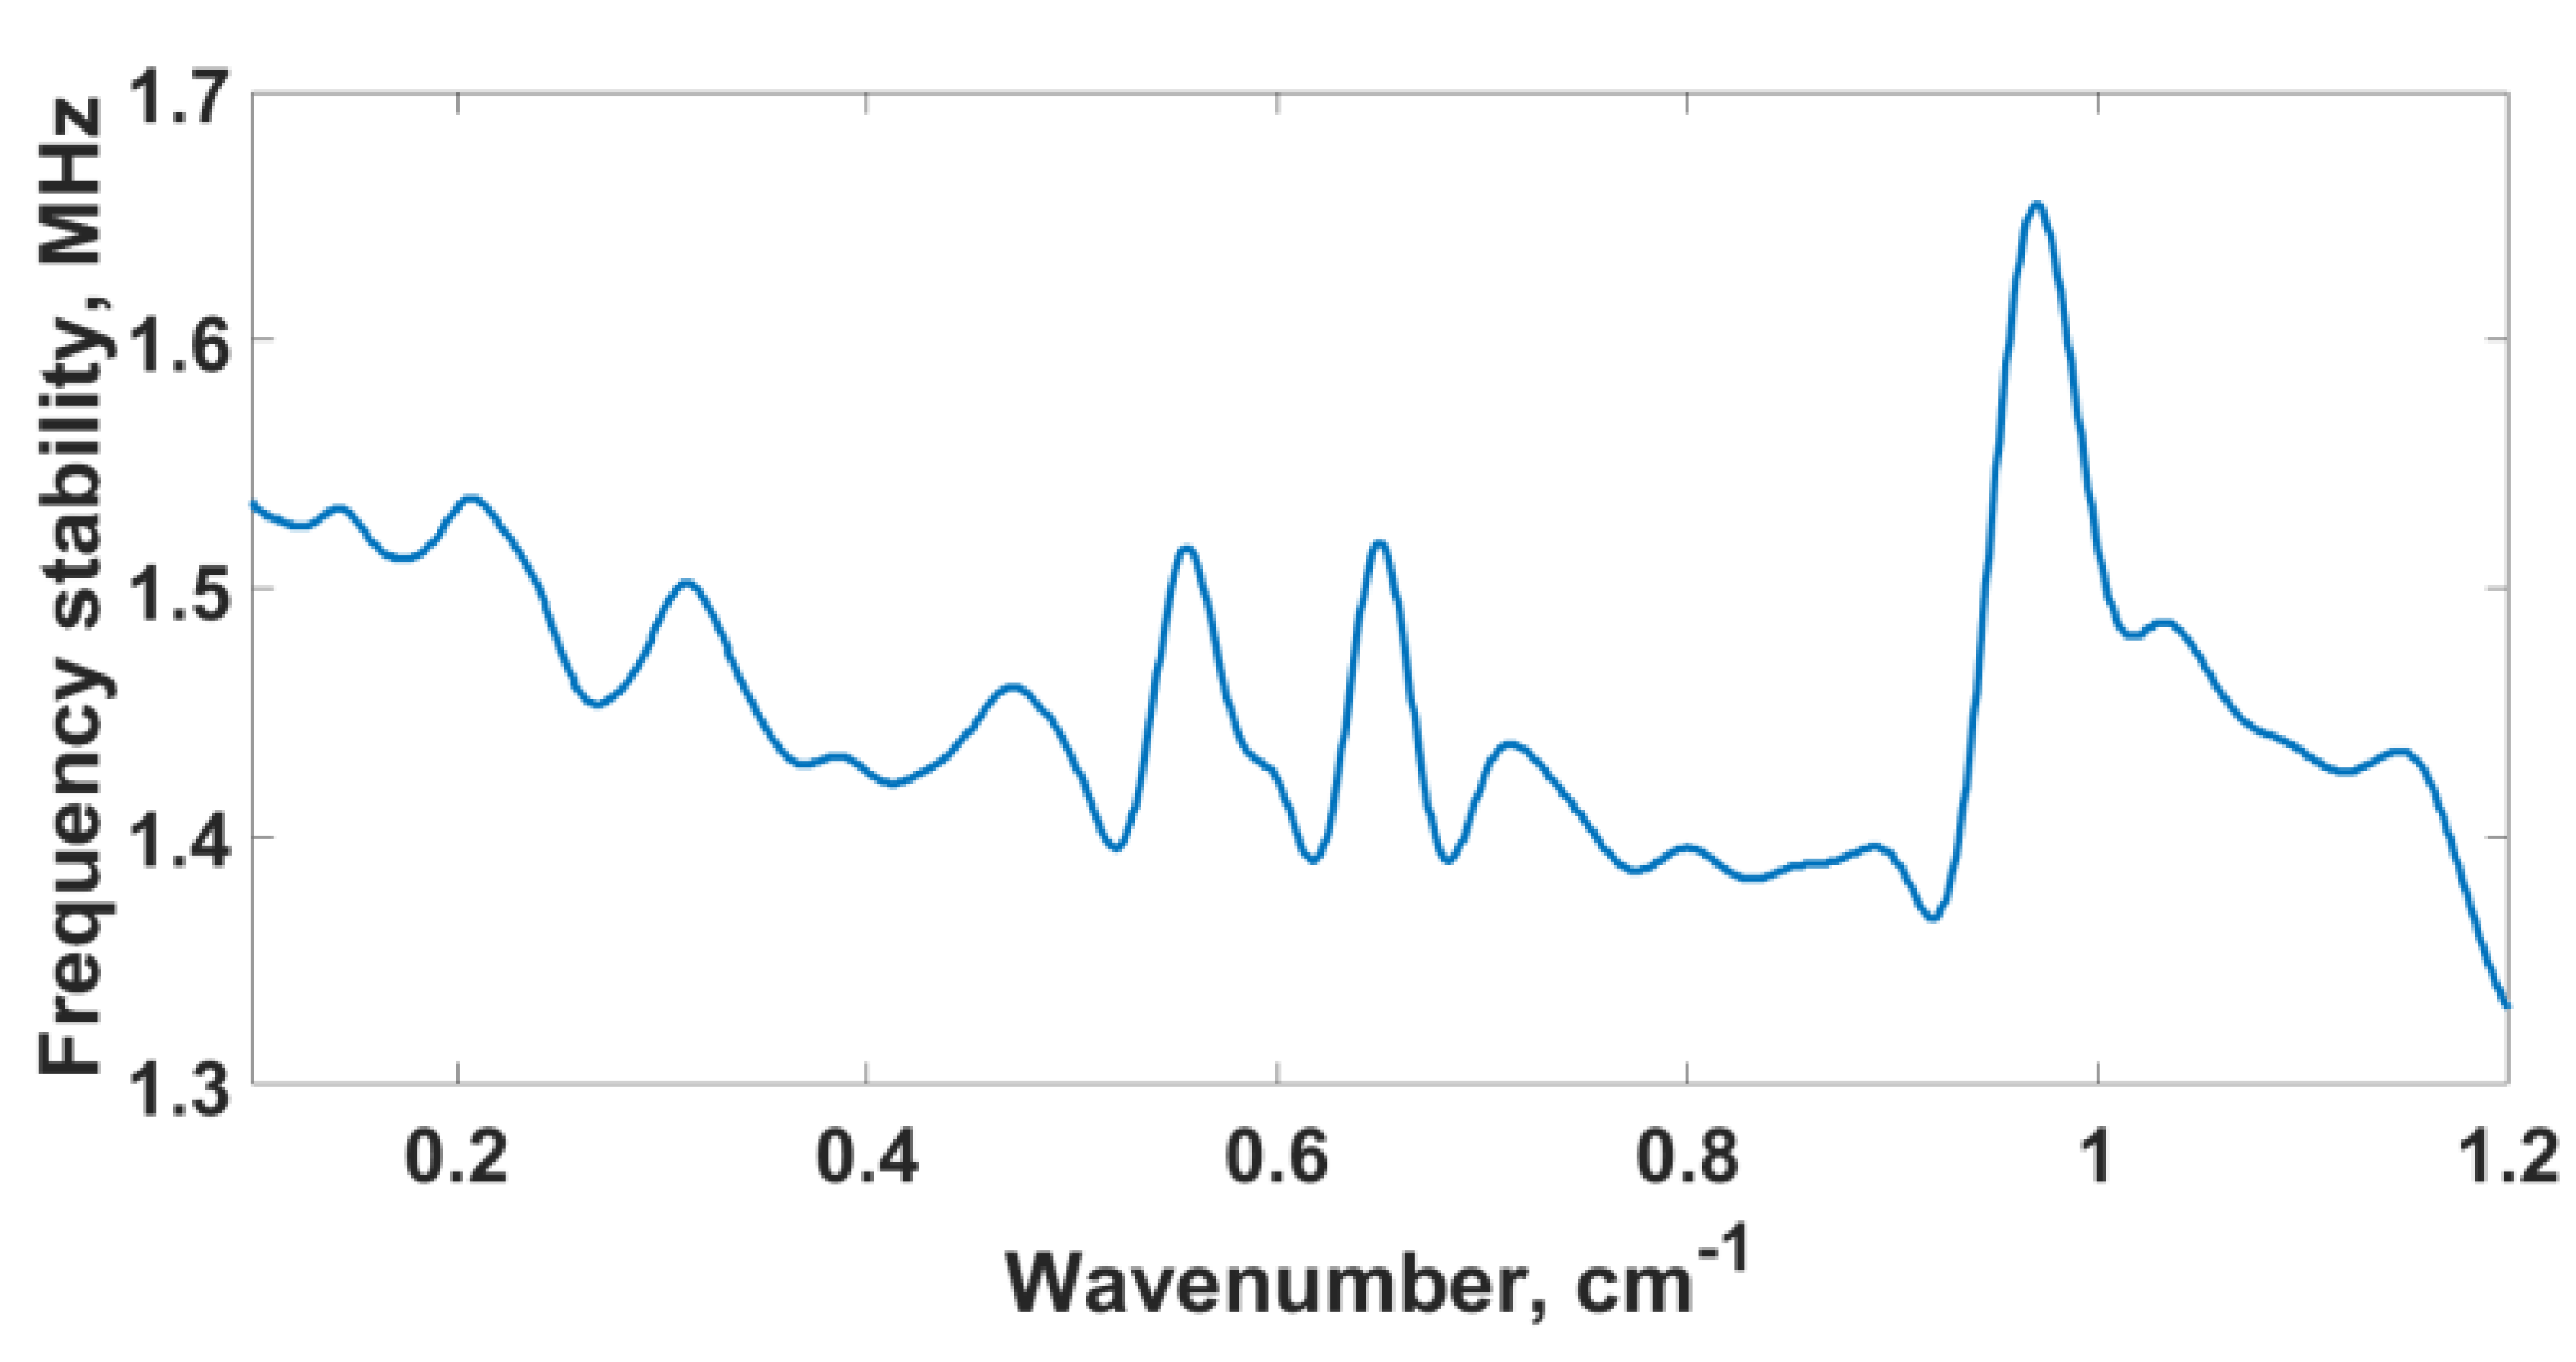
Figure 3 demonstrates the uncertainty of the DL frequency stabilization inside the current modulation pulse. Although this uncertainty varies in the course or the DL frequency scan, its mean value is about 1.5 MHz, which means that every spectral point of the DL pulse has a frequency uncertainty of 1.5 MHz. The data were obtained by accumulating and processing DL signal passed through the Fabry–Perrot etalon within 2 min period (typical time of single spectra integration).
The DL emits in quasi-continuous mode with the repetition frequency of 16 Hz, where 54 ms is taken for pump current modulation in the range of 50–100 mA, resulting in the DL frequency sweep within the range of 1 cm
−1, while 8 ms are spent for the IF receiver background radiation measurement. The whole frequency sweep cycle includes 270 timeslots so that the DL frequency step is about 111 MHz. The DL frequency sweep cycle is the same for both DLs involved emitting at 1605 and 1651 nm.
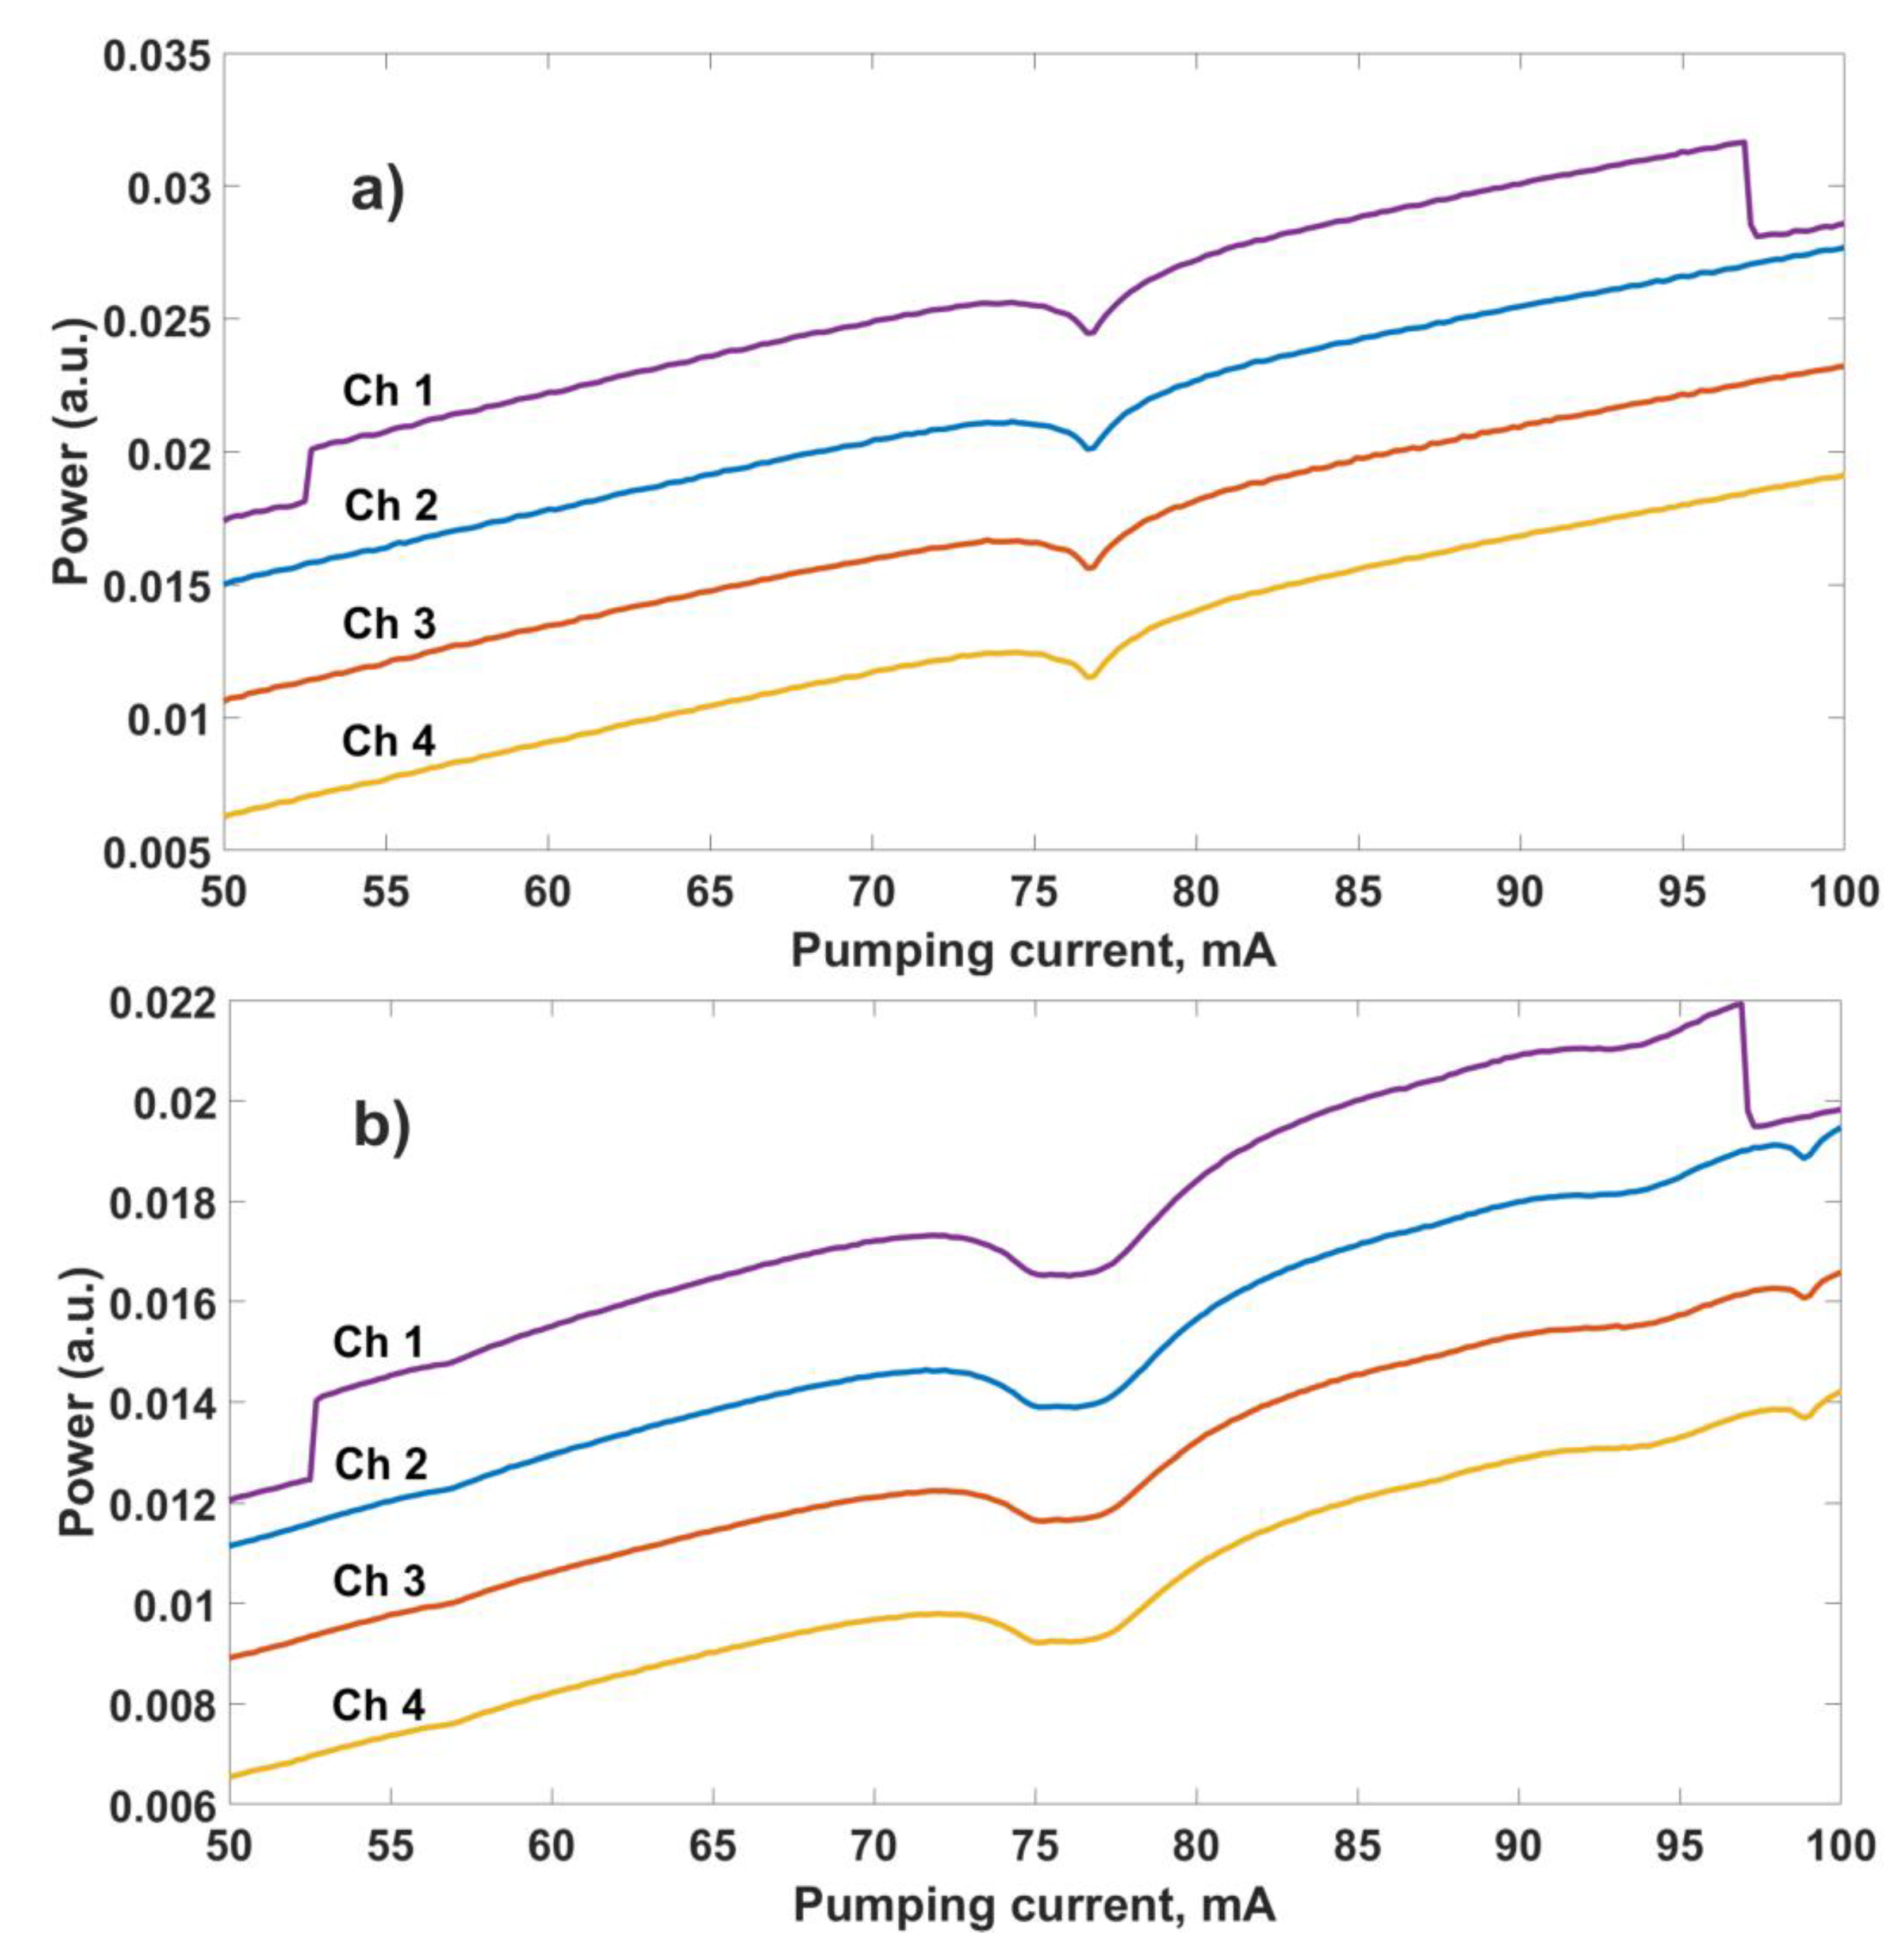
Figure 4a,b presents raw data from four IF receivers with CO
2 and CH
4 absorption lines, respectively. The signal levels of four IF receivers (i.e., channels) are shifted from each other for demonstration purposes. In
Figure 4a,b, the first channel’s signal has a different shape compared to other channels. Shoulders of the first channel signal are caused by a fiber switch, which is installed into the fiber system after the microtelescope of the first channel, as shown in
Figure 1, with the purpose of dark signal evaluation. The interested reader may find more details about the technique of dark signal evaluation and its advantages in [
45].
The primary motivation to develop a multichannel configuration of the instrument is the limitation of the antenna theorem [
47] that constrains the field of view of a heterodyne receiver to the diffraction limit and implies a related constraint on the SNR of a single receiver observing extended source like the Sun. Multichannel mode provides an increase in SNR on the factor of √N for the same exposure time, where N is the number of independent receivers. Thus, for CO
2 measurements by direct Sun observation, the SNR of a single receiver is 125, while after averaging the signals from four receivers it increases up to 250. In the case of CH
4 measurements, SNR was 500. Different weather conditions caused such a difference in the SNR levels of CO
2 and CH
4 datasets: during CH
4 measurements the power of solar radiation inserted in the optical fiber was 5–6 μW; CO
2 measurements were carried out at conditions when only 2.5–3 μW of solar radiation was in the fiber.
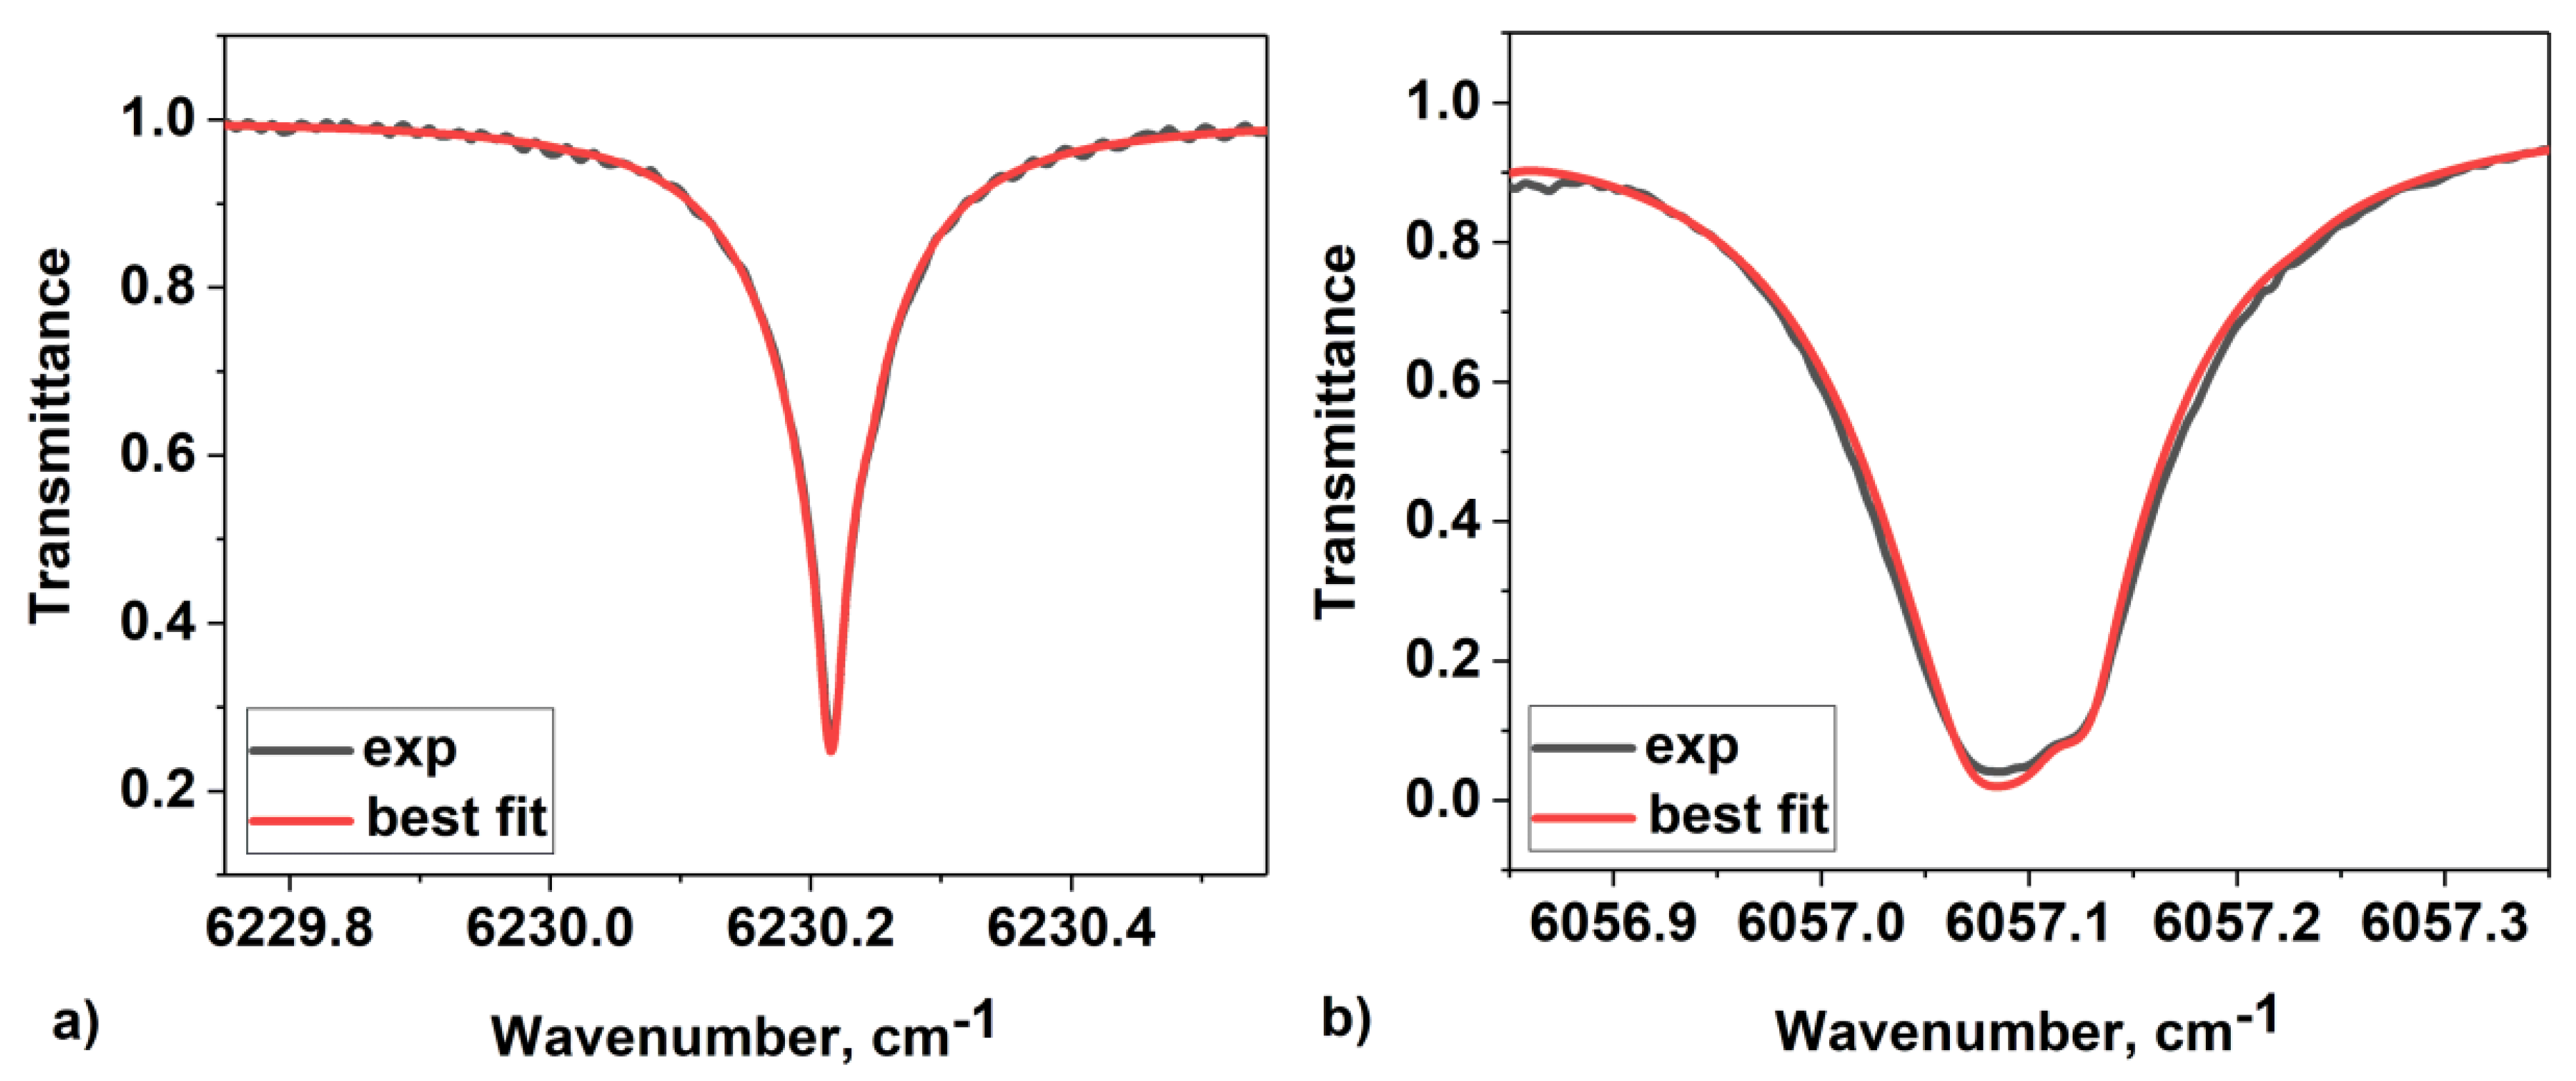
Atmospheric measurements were carried out in the Moscow Institute of Physics and Technology (MIPT) campus territory in late September and early October 2020. Linearized, normalized, and averaged from four IF receivers, atmospheric transmittance spectra (black curves) in the vicinity of wavelengths 1605 and 1651 nm are presented in
Figure 5a,b, respectively. The spectra were recorded within 2 min of integration time. Red curves are synthetic atmospheric spectra based on the plane-parallel radiative transfer model involving HITRAN 2016 molecular absorption parameters [
48] with temperature and pressure profiles from ERA-interim [
49] and NCEP/NCAR [
50]. The synthetic spectra retrieval and the column concentration calculation procedure are described in detail in [
44].
As shown previously [
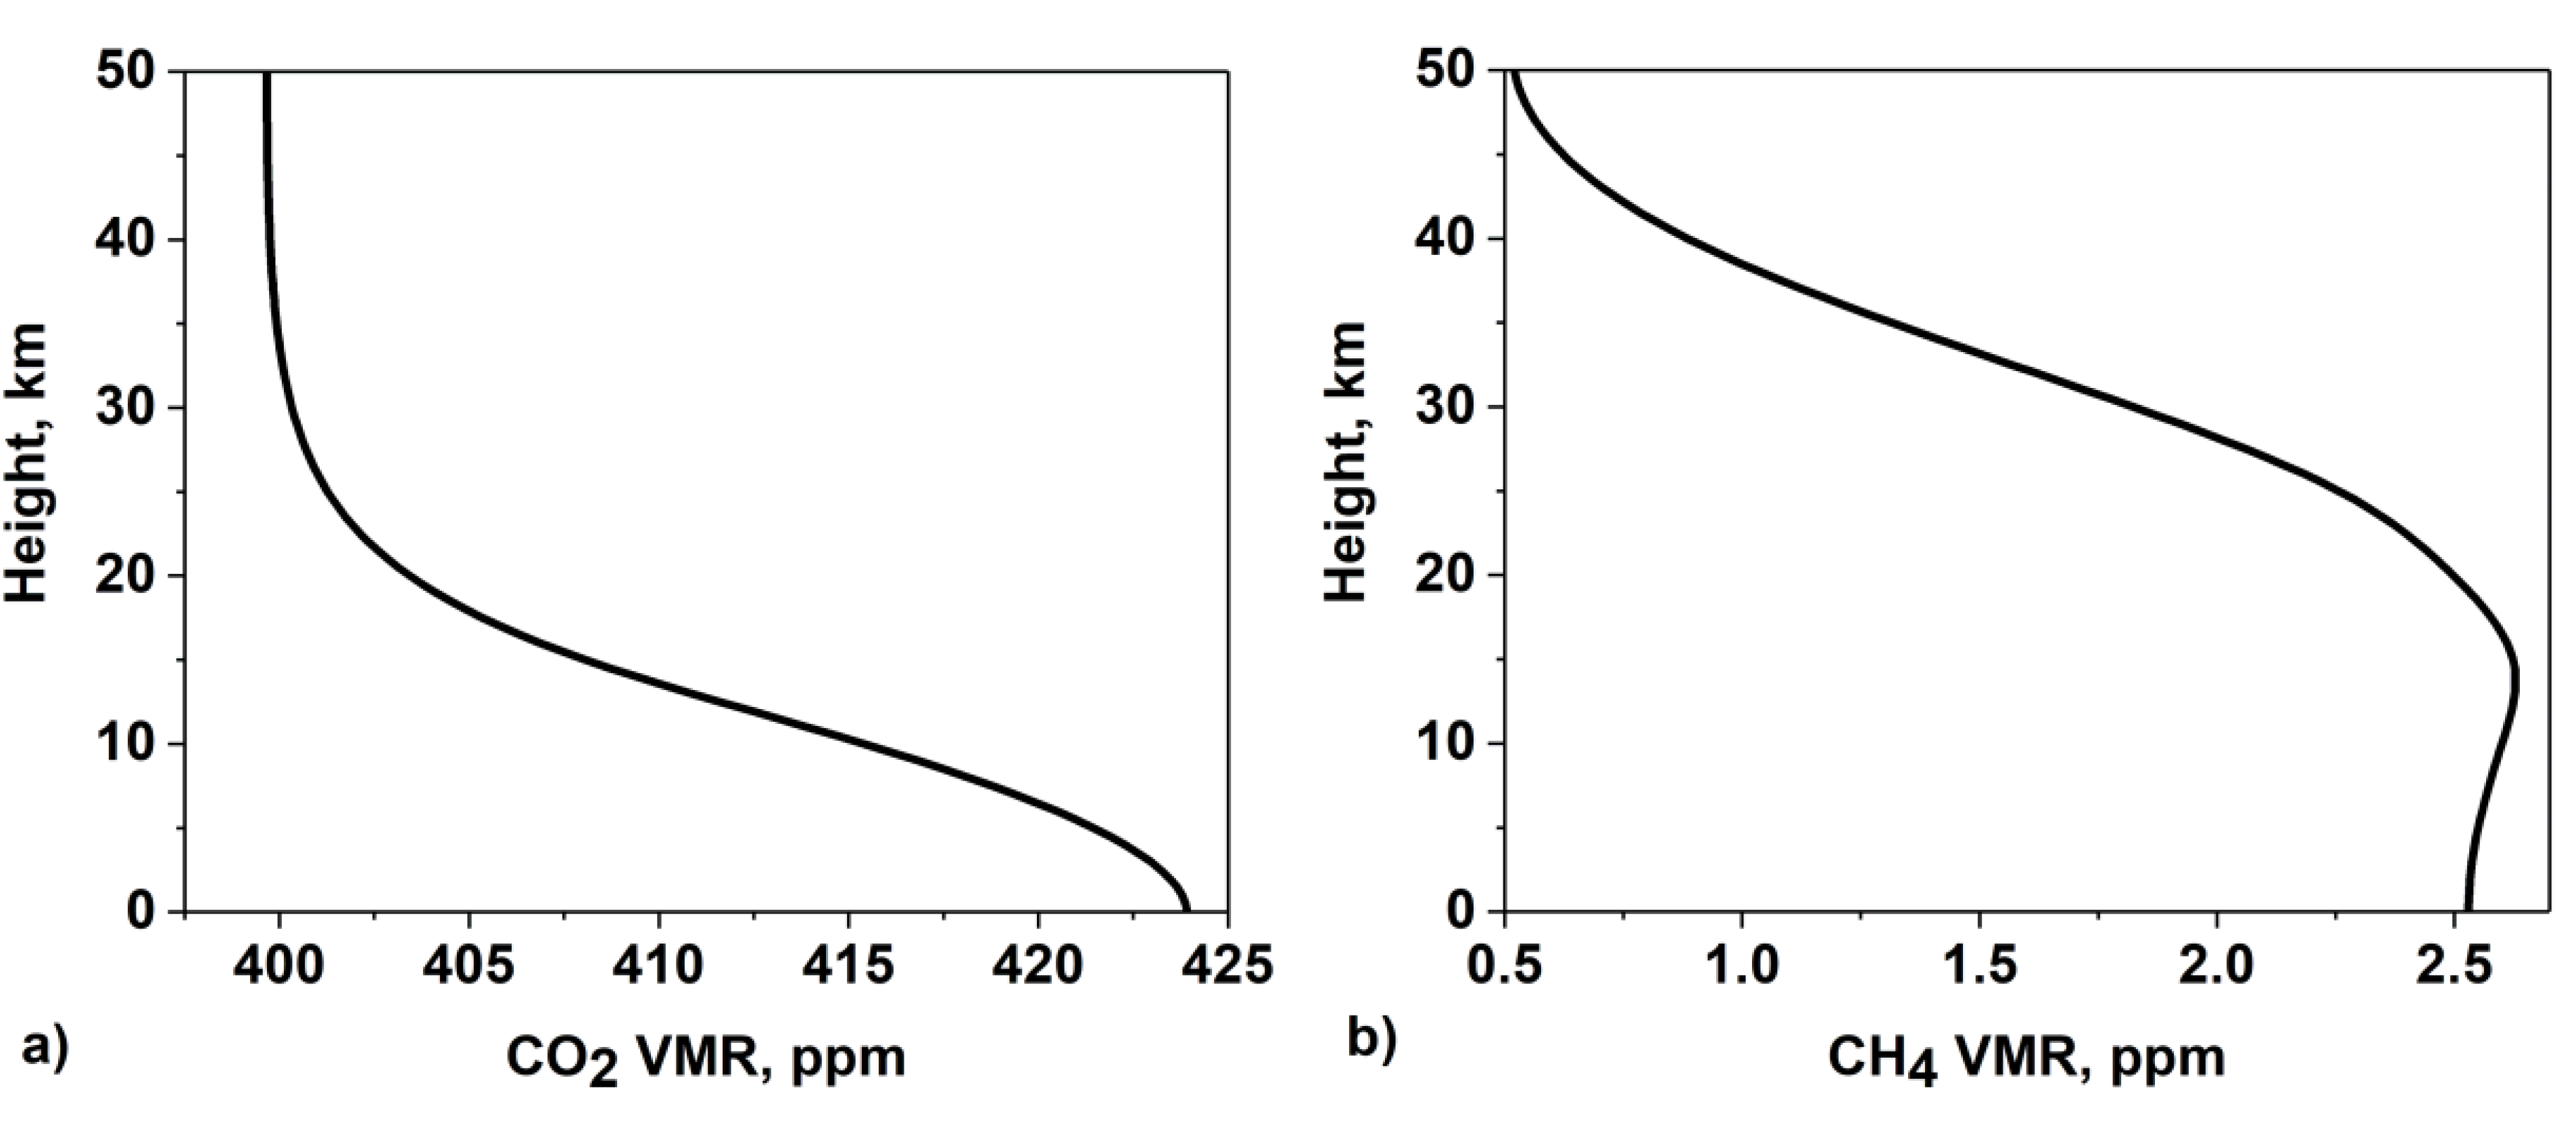
51], due to the strict link between spectral line broadening mechanisms and thermodynamic parameters of the atmosphere at a particular altitude, it is possible to retrieve a vertical distribution of the measured GHG in the atmosphere column.
Figure 6a,b shows vertical profiles of CO
2 and CH
4 retrieved from atmospheric spectra of
Figure 5a,b, respectively. The retrieval procedure is based on the method of Tikhonov regularization. A detailed description of the retrieval procedure could be found in [
51]. As demonstrated in [
44], a major source of uncertainty in the solution to the inverse problem on GHG mixing ratio retrievals is a problem of baseline level identification. This problem is common for the NIR heterodyne spectroscopy and is caused by the narrow spectral range of the DL frequency sweep. As a result, GHG vertical profiles are retrieved with higher accuracy than the absolute column abundance.
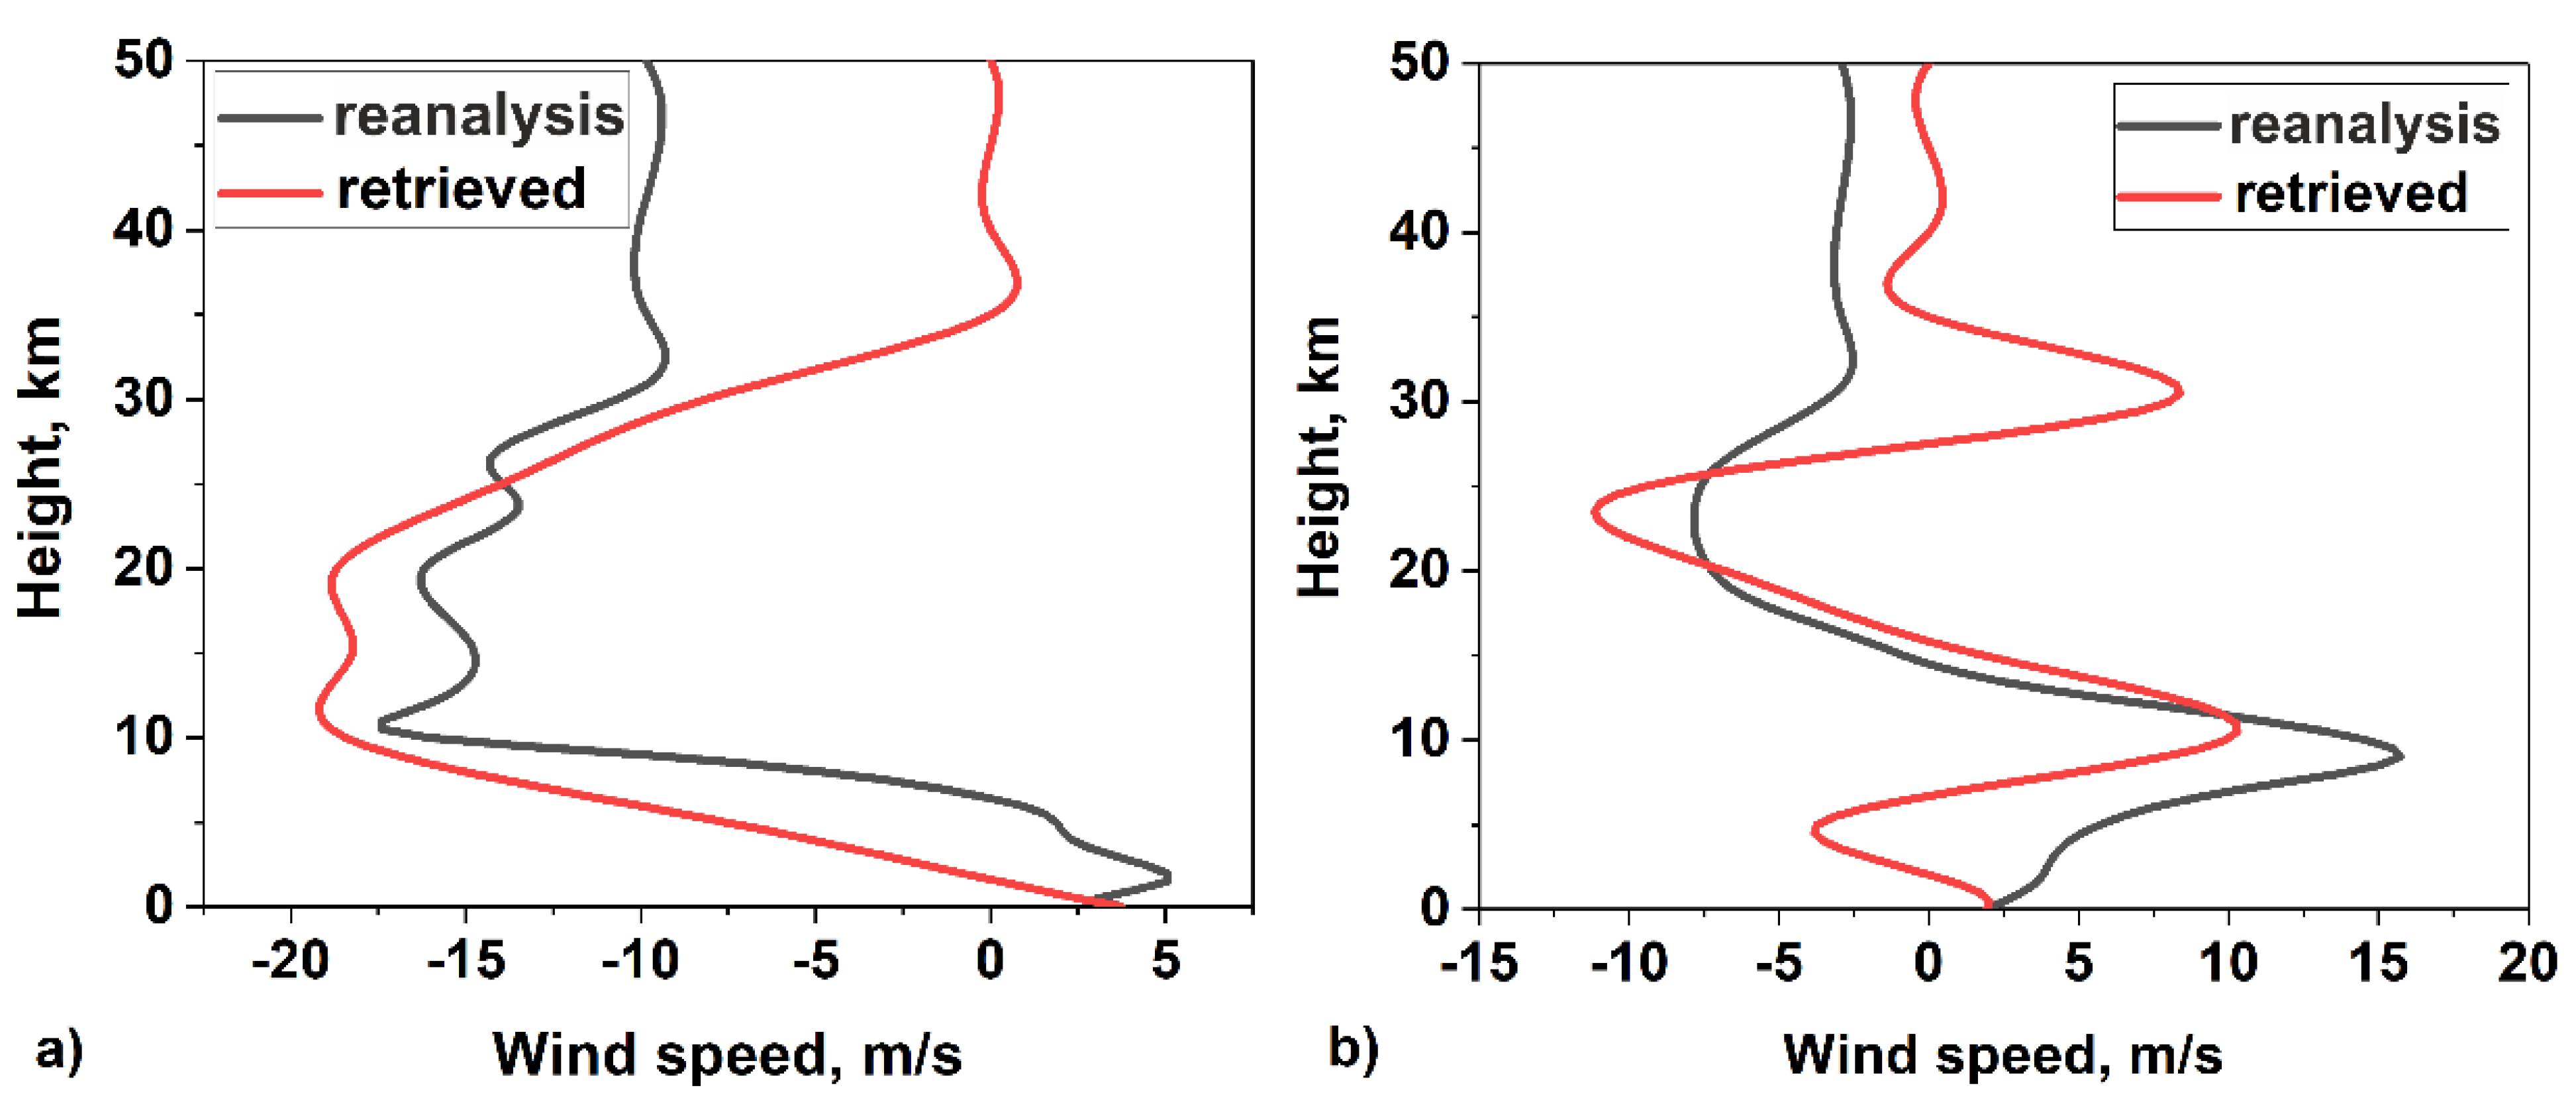
Besides vertical profiling of GHG mixing ratio, vertical profiles of wind projection on the line of sight could also be retrieved from MLHS prototype data utilizing Doppler analysis of the observed line contour, as reported in [
13].
Figure 7a,b presents vertical profiles of the wind speed projection on the line of sight (red curves) retrieved from atmospheric spectra of
Figure 5a,b, respectively. Black curves are reanalysis data taken from [
49].
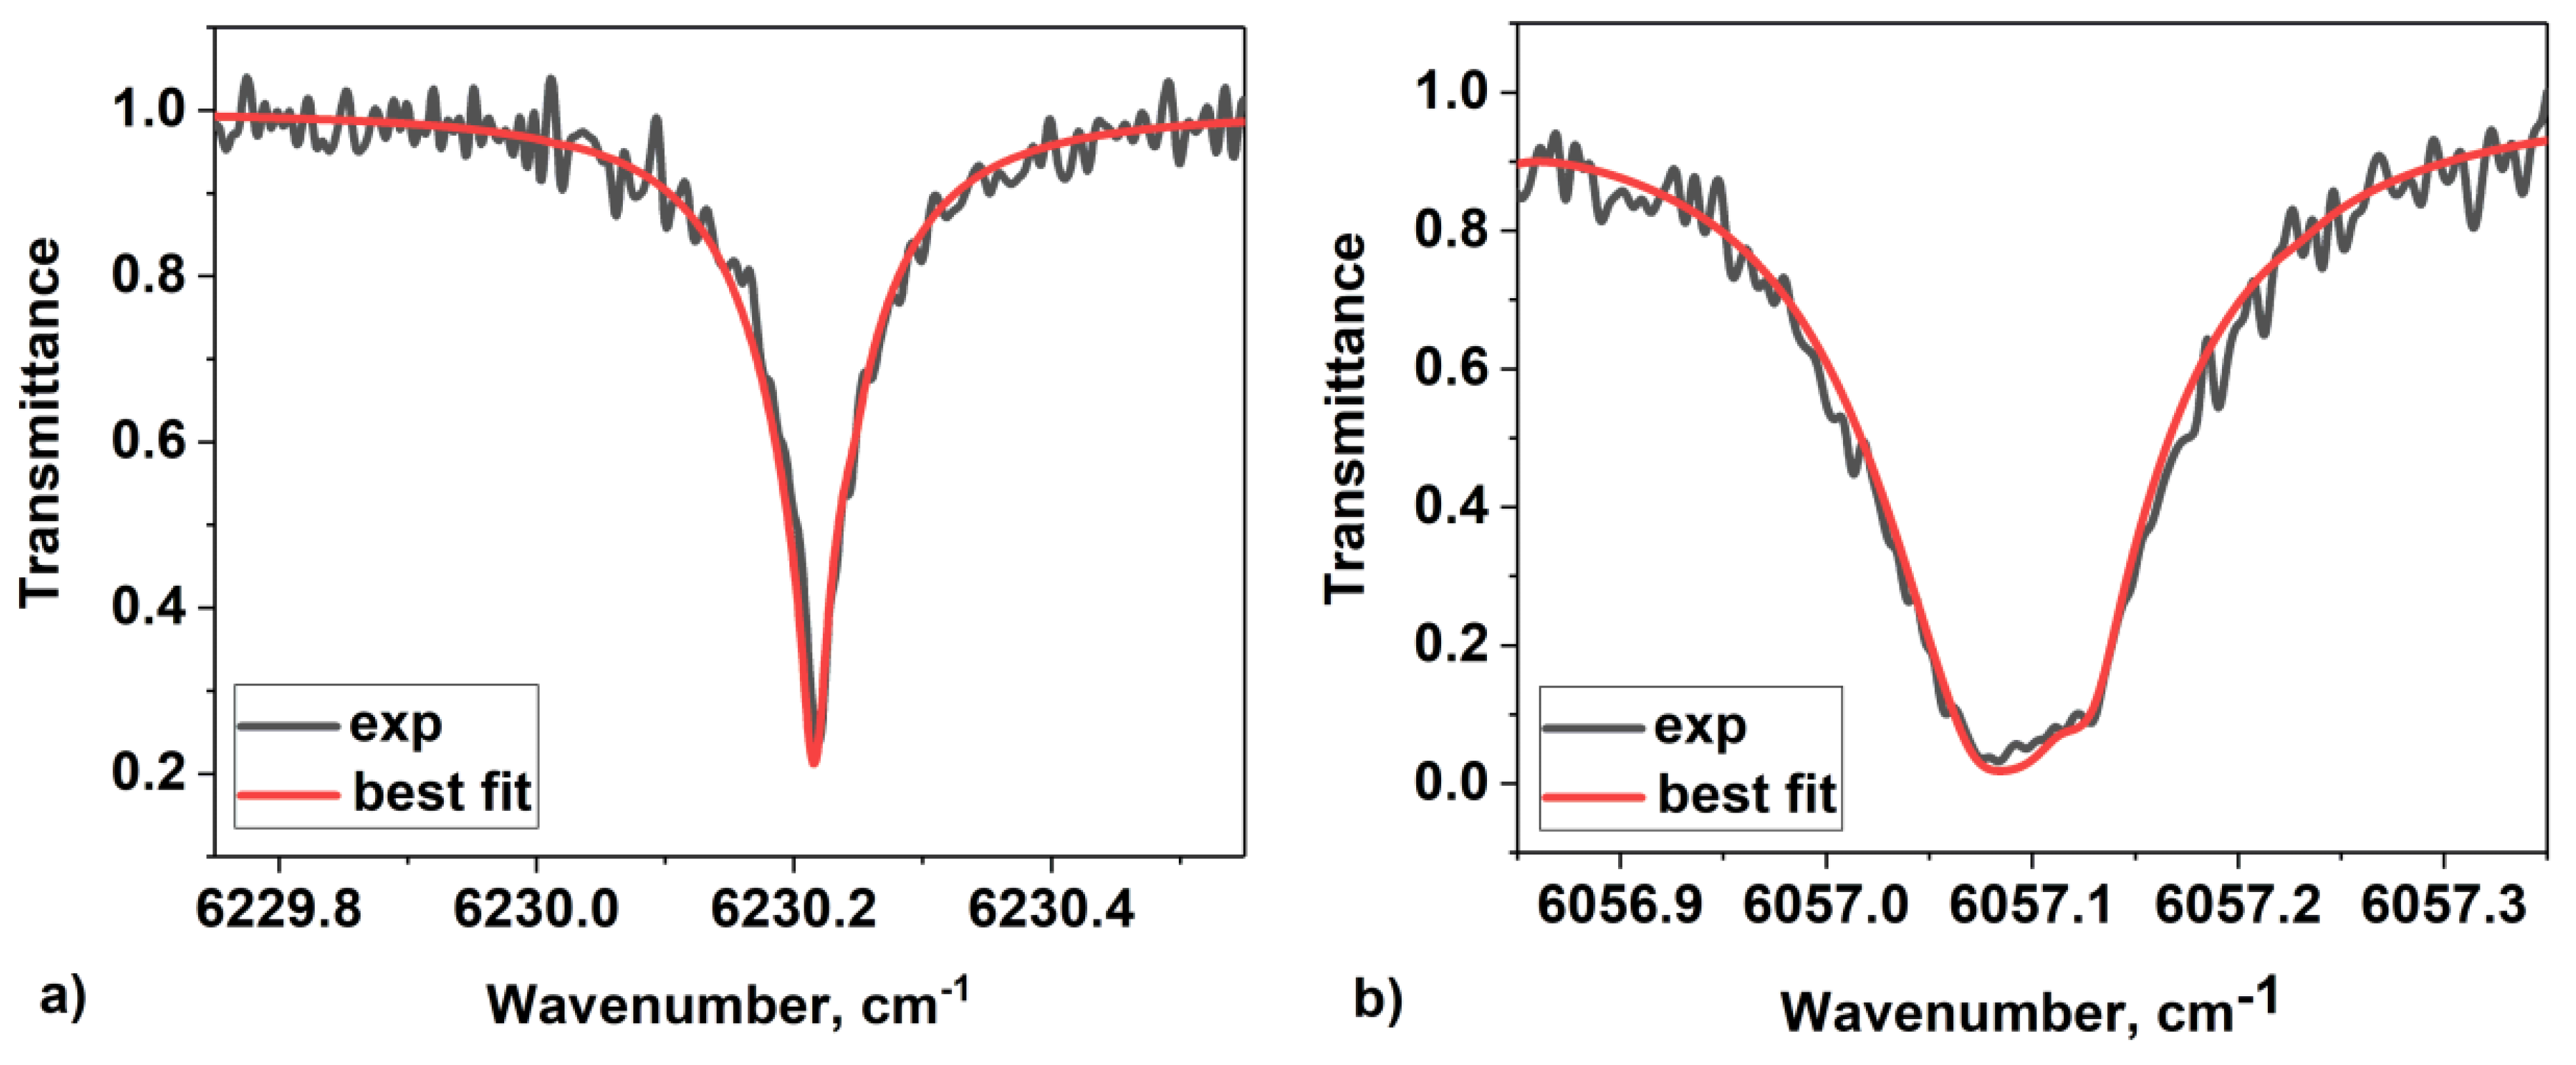
Finally, before introducing the concept of the 2U spaceborne MLHS, it is necessary to estimate the level of SNR, which can be achieved at shorter periods of signal integration.
Figure 8a,b presents atmospheric transmittance spectra measured in the vicinity of wavelengths 1605 and 1651 nm. These spectra (black curves) were recorded in a multichannel mode within one second integration time and have an SNR of about 50. Spectra with such SNR level are characterized by clearly recognizable line shapes, whose analysis enables retrievals listed above.
The ground-based MLHS prototype has demonstrated that NIR spectroscopic measurements of the atmospheric transmission with the ultra-high spectral resolution based on heterodyne detection have a high potential as a spaceborne remote sensing technique. The scientific and applied output of such a lightweight and low-cost mission may cover remote sensing of GHG sources, sinks and transport, stratospheric water cycle, and dynamics of the upper troposphere and stratosphere.
4. Orbit Configuration Details
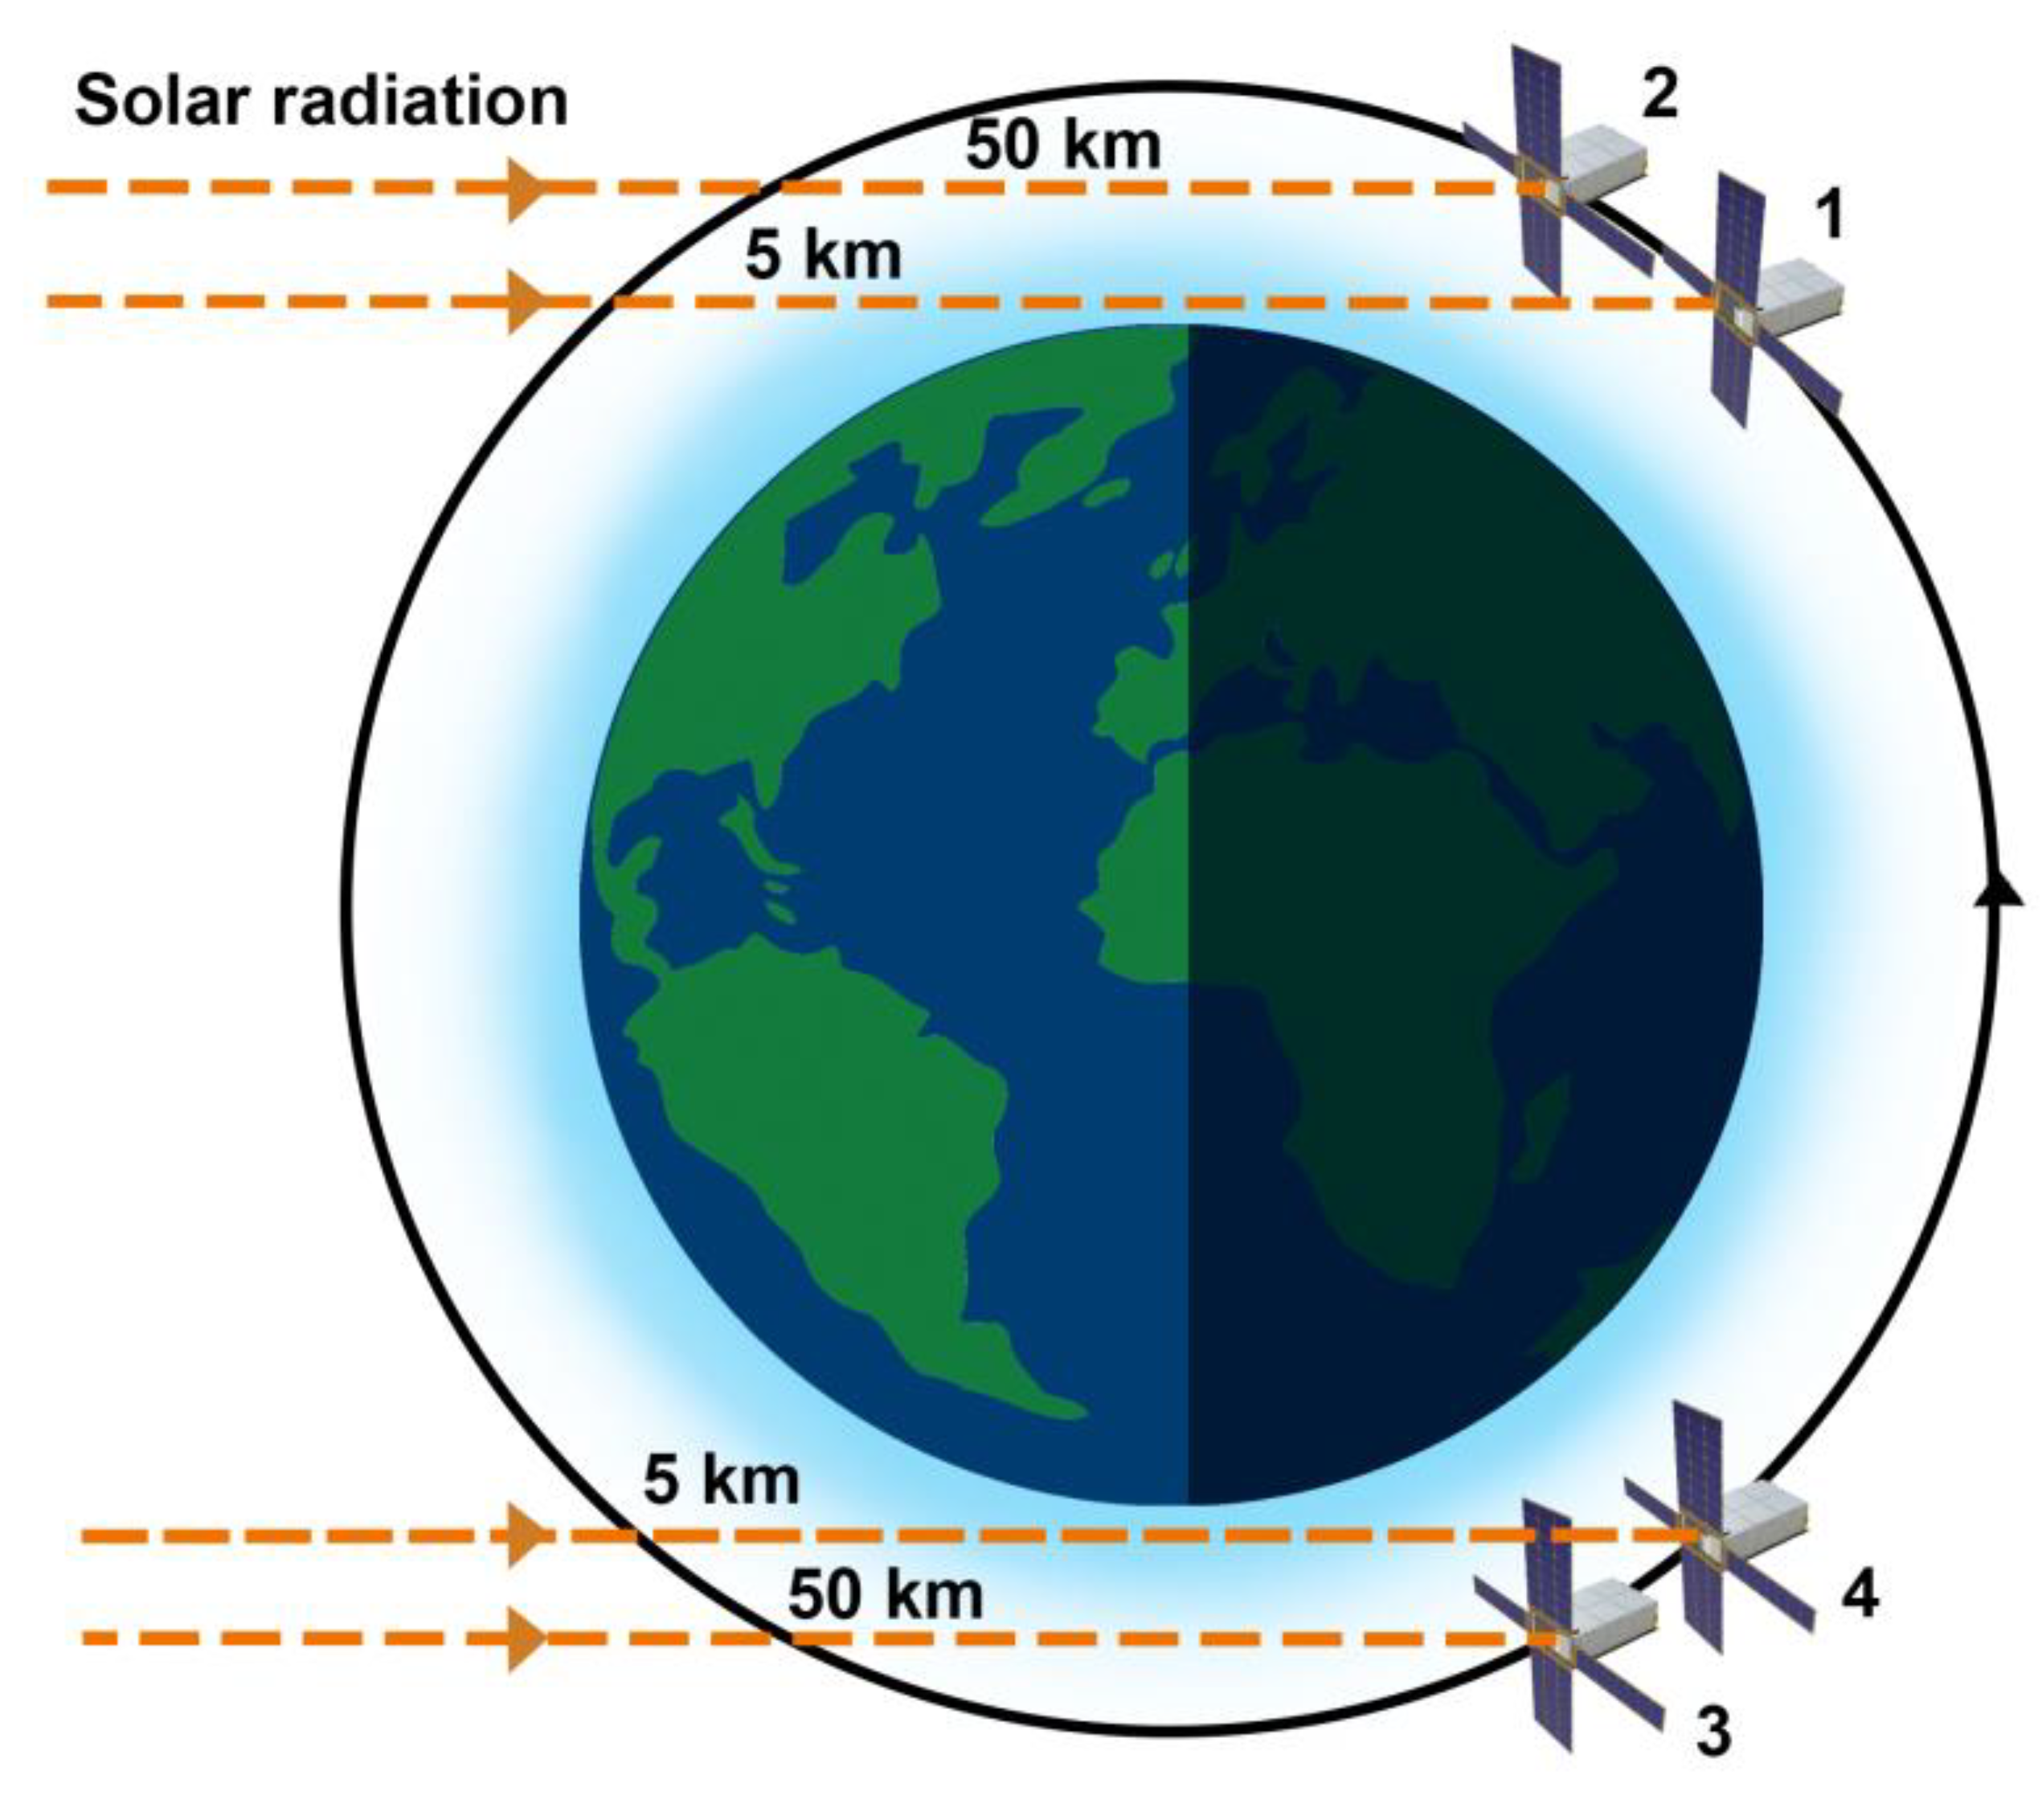
A 2U spaceborne MLHS payload is designed to operate in the solar occultation mode schematically illustrated in
Figure 9. According to the observation geometry, there are two measurement windows per orbit, namely the egress (sunrise) window marked in
Figure 9 by points 1 and 2, and the ingress (sunset) window marked by points 3 and 4. Atmospheric measurements are carried out at the Earth’s surface point corresponding to a terminator (edge of shaded area).
As mentioned in
Section 2, the MLHS is considered to be placed on the International Space Station (ISS) orbit, precise orbital parameters of which within last year have been published in the two-line element set (TLE) format [
52]. We analyzed the observing capabilities of this orbit in the solar occultation mode in terms of MLHS science objectives, using SkyField framework [
53], TLE dataset, Pandas [
54], and NumPy [
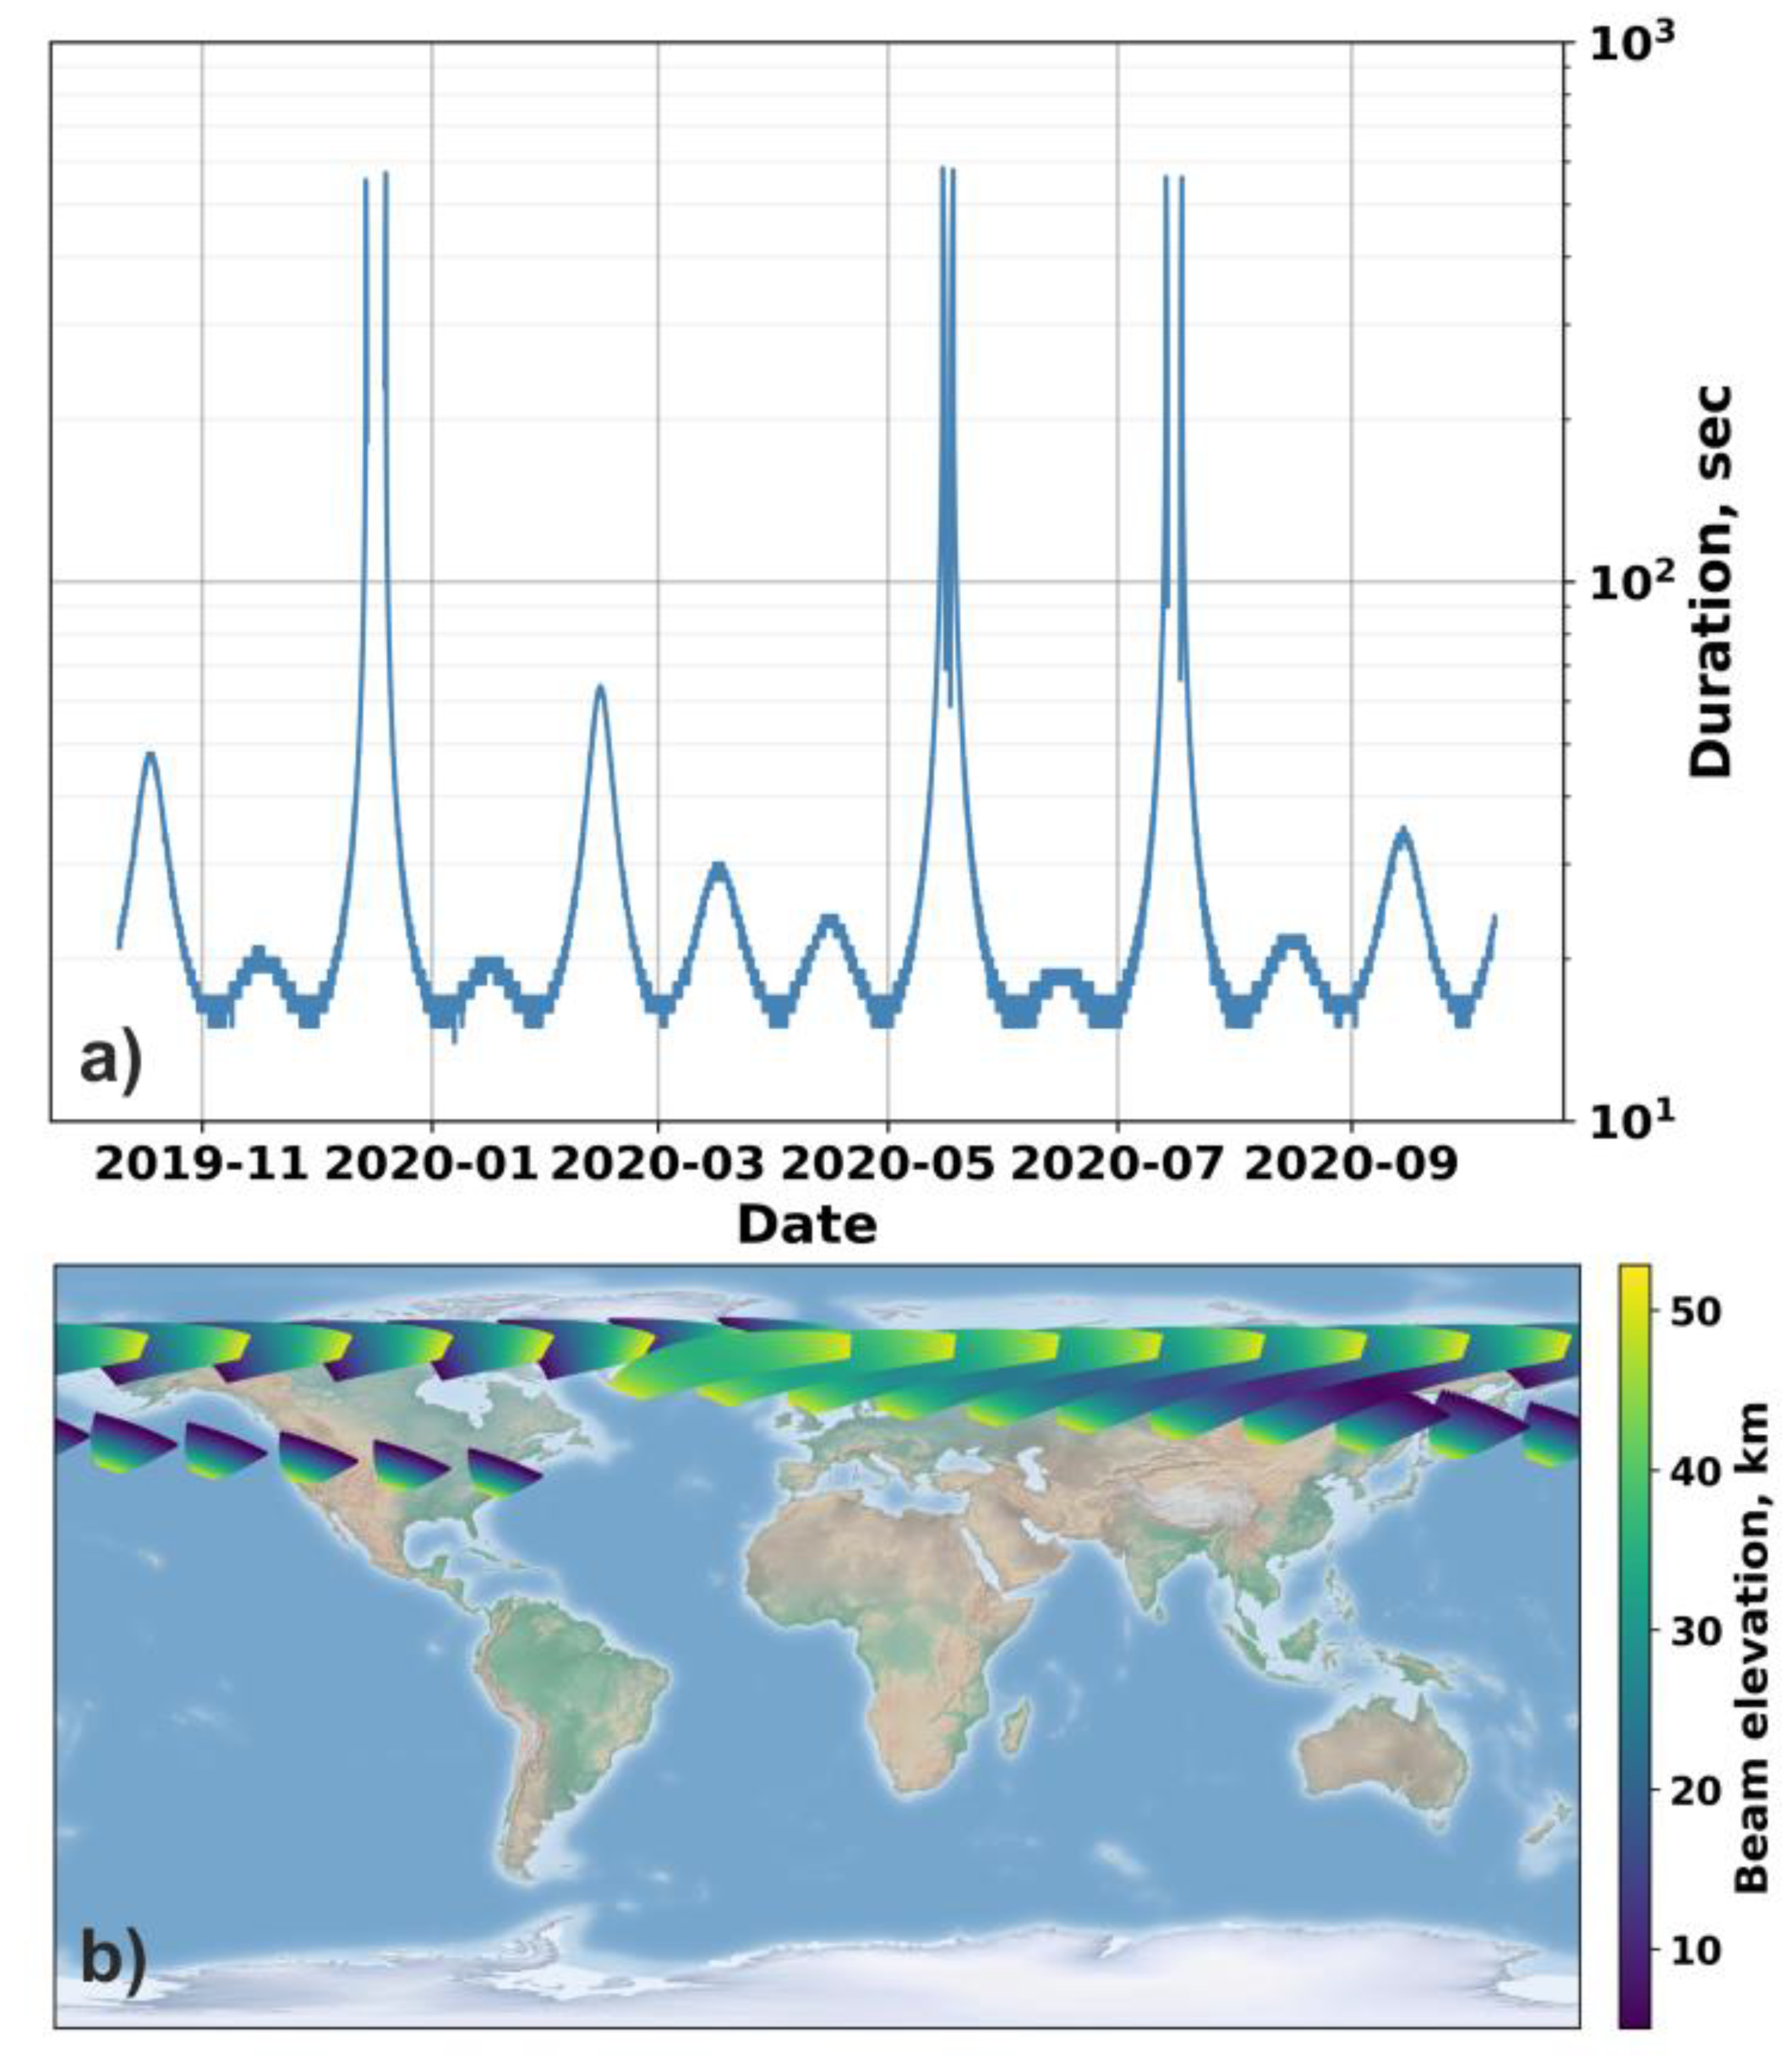
55] Python libraries. The calculations were based on the archive of multiple TLE sets for the mentioned period. Atmospheric refraction was not taken into account. It was evaluated that from 10 October 2019 to 8 October 2020, the spaceborne MLHS could observe the Sun 10,927 times. The duration of Sun observation within the range of tangent heights of 5–50 km in one year period is presented in
Figure 10a, where a single flyby has the following duration statistics: the median duration is 19 s, averaged value is 25.8 s, minimal one is 14 s, and maximal one is 584 s. Such a long duration of Sun observation per one flyby results from a relative position of the terminator and the MLHS orbital plane. In this case, the trajectory of the probe is parallel to the terminator. Such configuration is met several times per year.
Figure 10b shows the Earth’s surface coverage by MLHS measurements within 24 h. This period corresponds to the date 15–16 May 2020 and meets one of the three rare cases with the maximal duration of Sun observation time within the range of 5–50 km. Although the sunlight passes through atmosphere layers with different tangent heights at the solar occultation geometry, for simplicity, the color bar of
Figure 10b indicates the minimal tangent height of the current measurements.
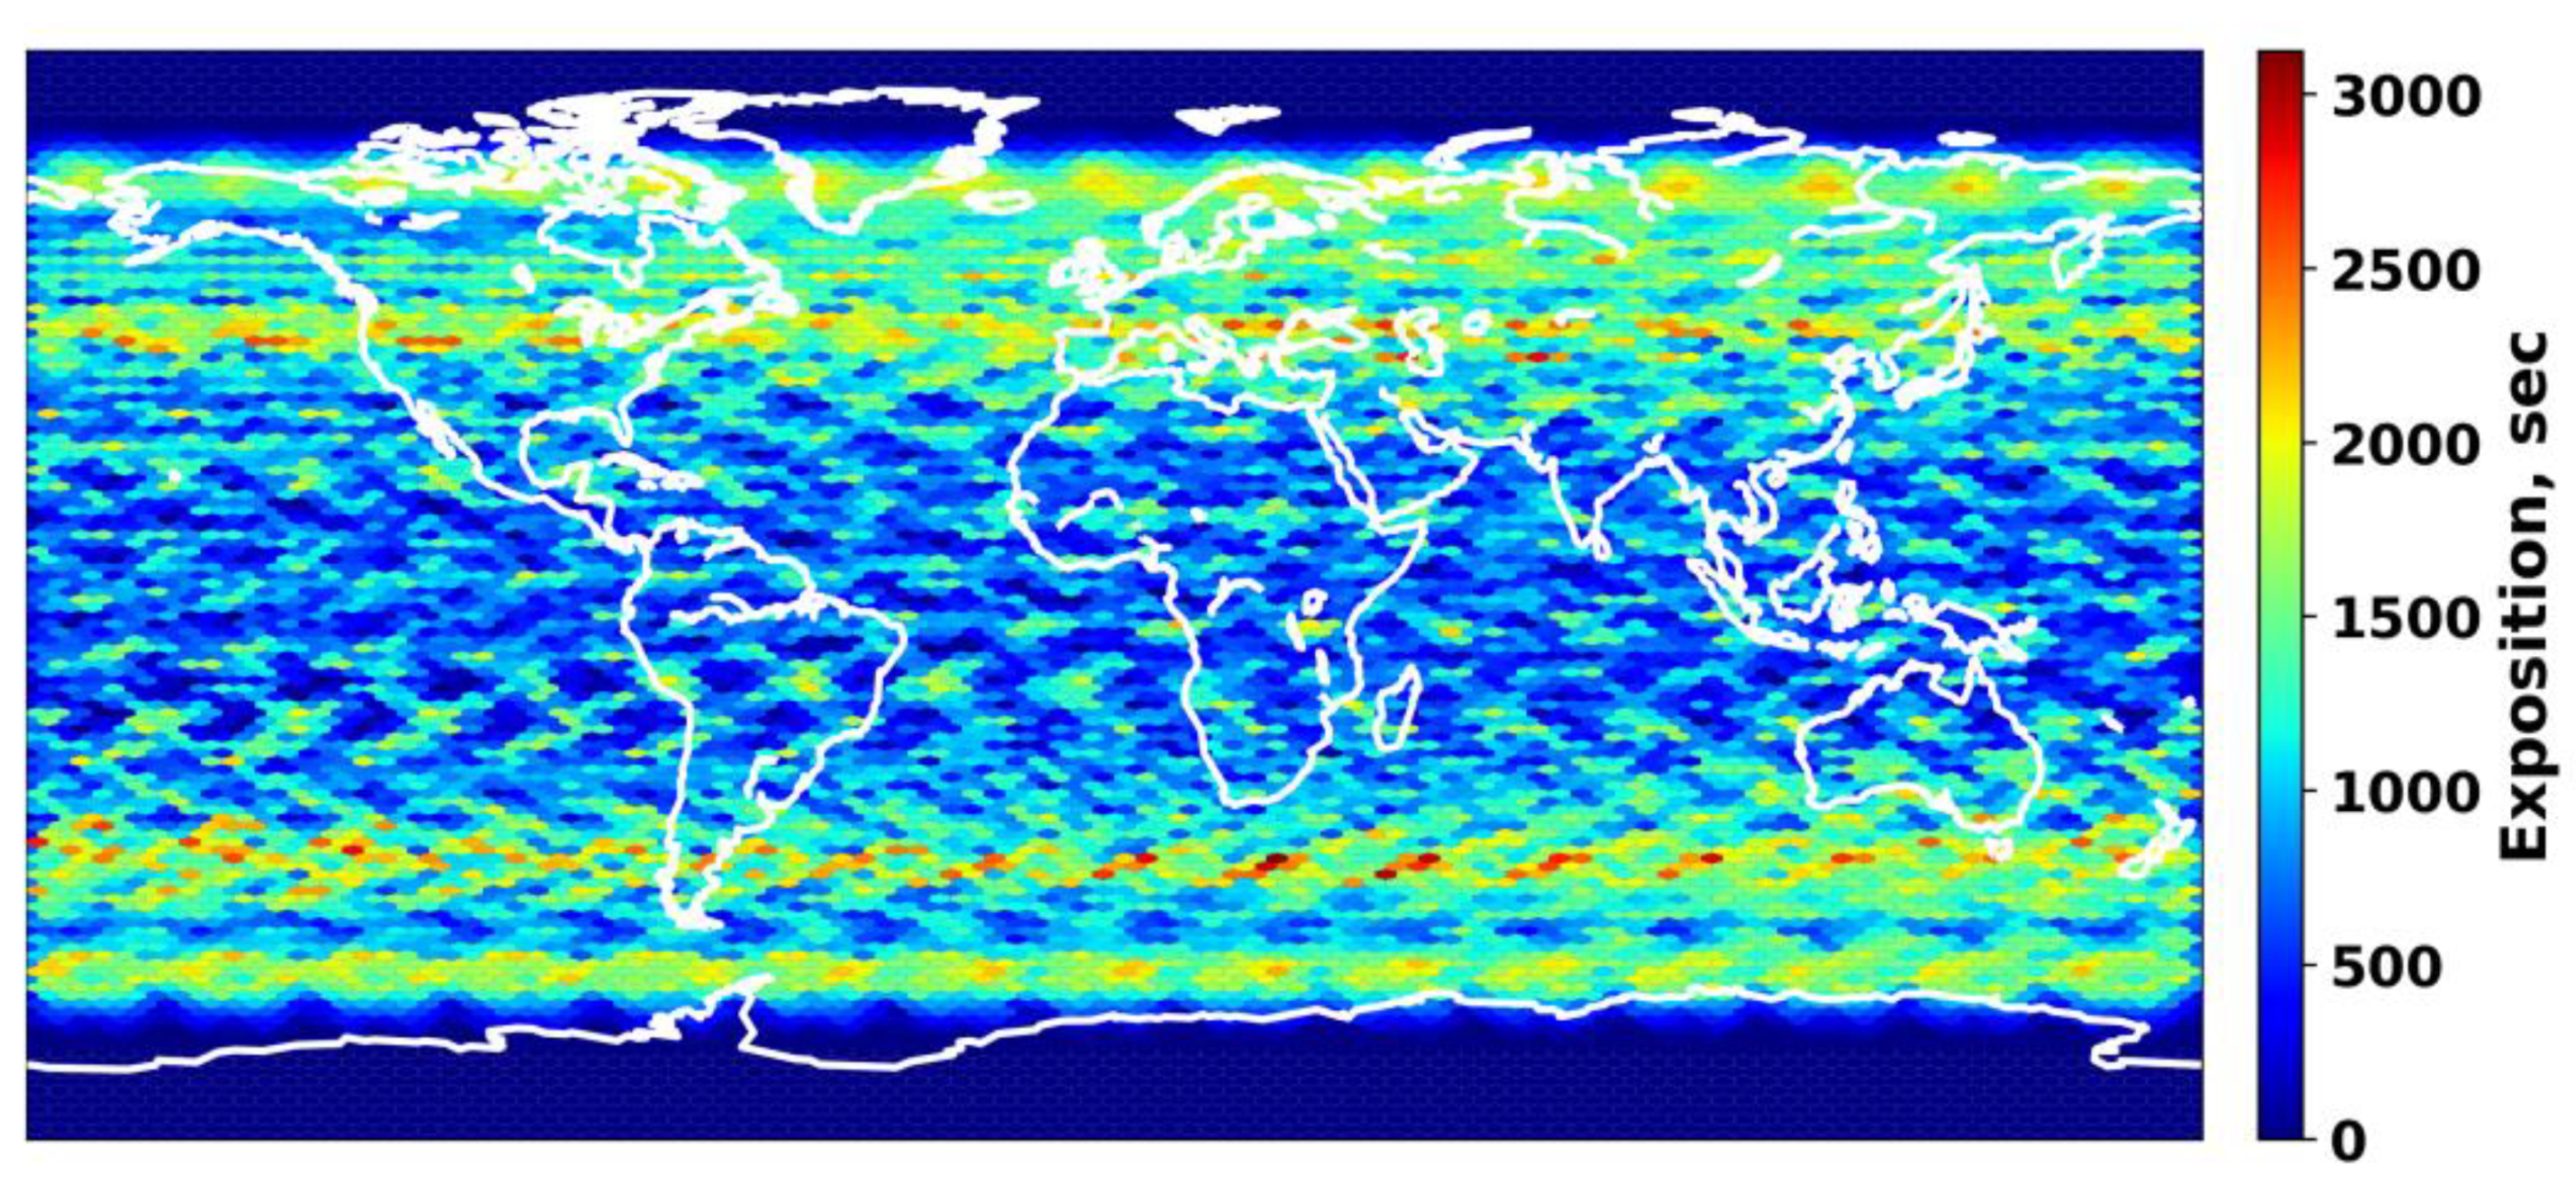
Figure 11 visualizes a map of coverage of the Earth’s surface by MLHS measurements within one year. The color bar corresponds to Sun observations’ exposure time within the tangent height range of 5–50 km. According to the map presented in
Figure 11, the Earth’s surface in the latitude range from 30° to 75° in both hemispheres has denser measurement coverage providing the exposure time range from 2000 to 3000 s. Measurement coverage in the latitude range ± 30° has sparser coverage with the exposure time up to 2000 s. Due to the orbit configuration, polar areas above 75° in both hemispheres remain uncovered. Orbital precession effects in our case are helpful for passive coverage of Earth’s atmosphere, even a month of observation provides valuable data for most of the area of interest.
One may conclude that MLHS operation at the ISS orbit provides suitable conditions for GHG remote sensing, with the sufficient median time of Sun observation for GHG profiling and a wide range of surface coverage, including the subarctic region, one of the most interesting areas on the planet from the GHG monitoring point of view [
56].
5. Scientific Payload and Expected Results
The structure of the spaceborne MLHS is similar to that of its ground-based prototype.
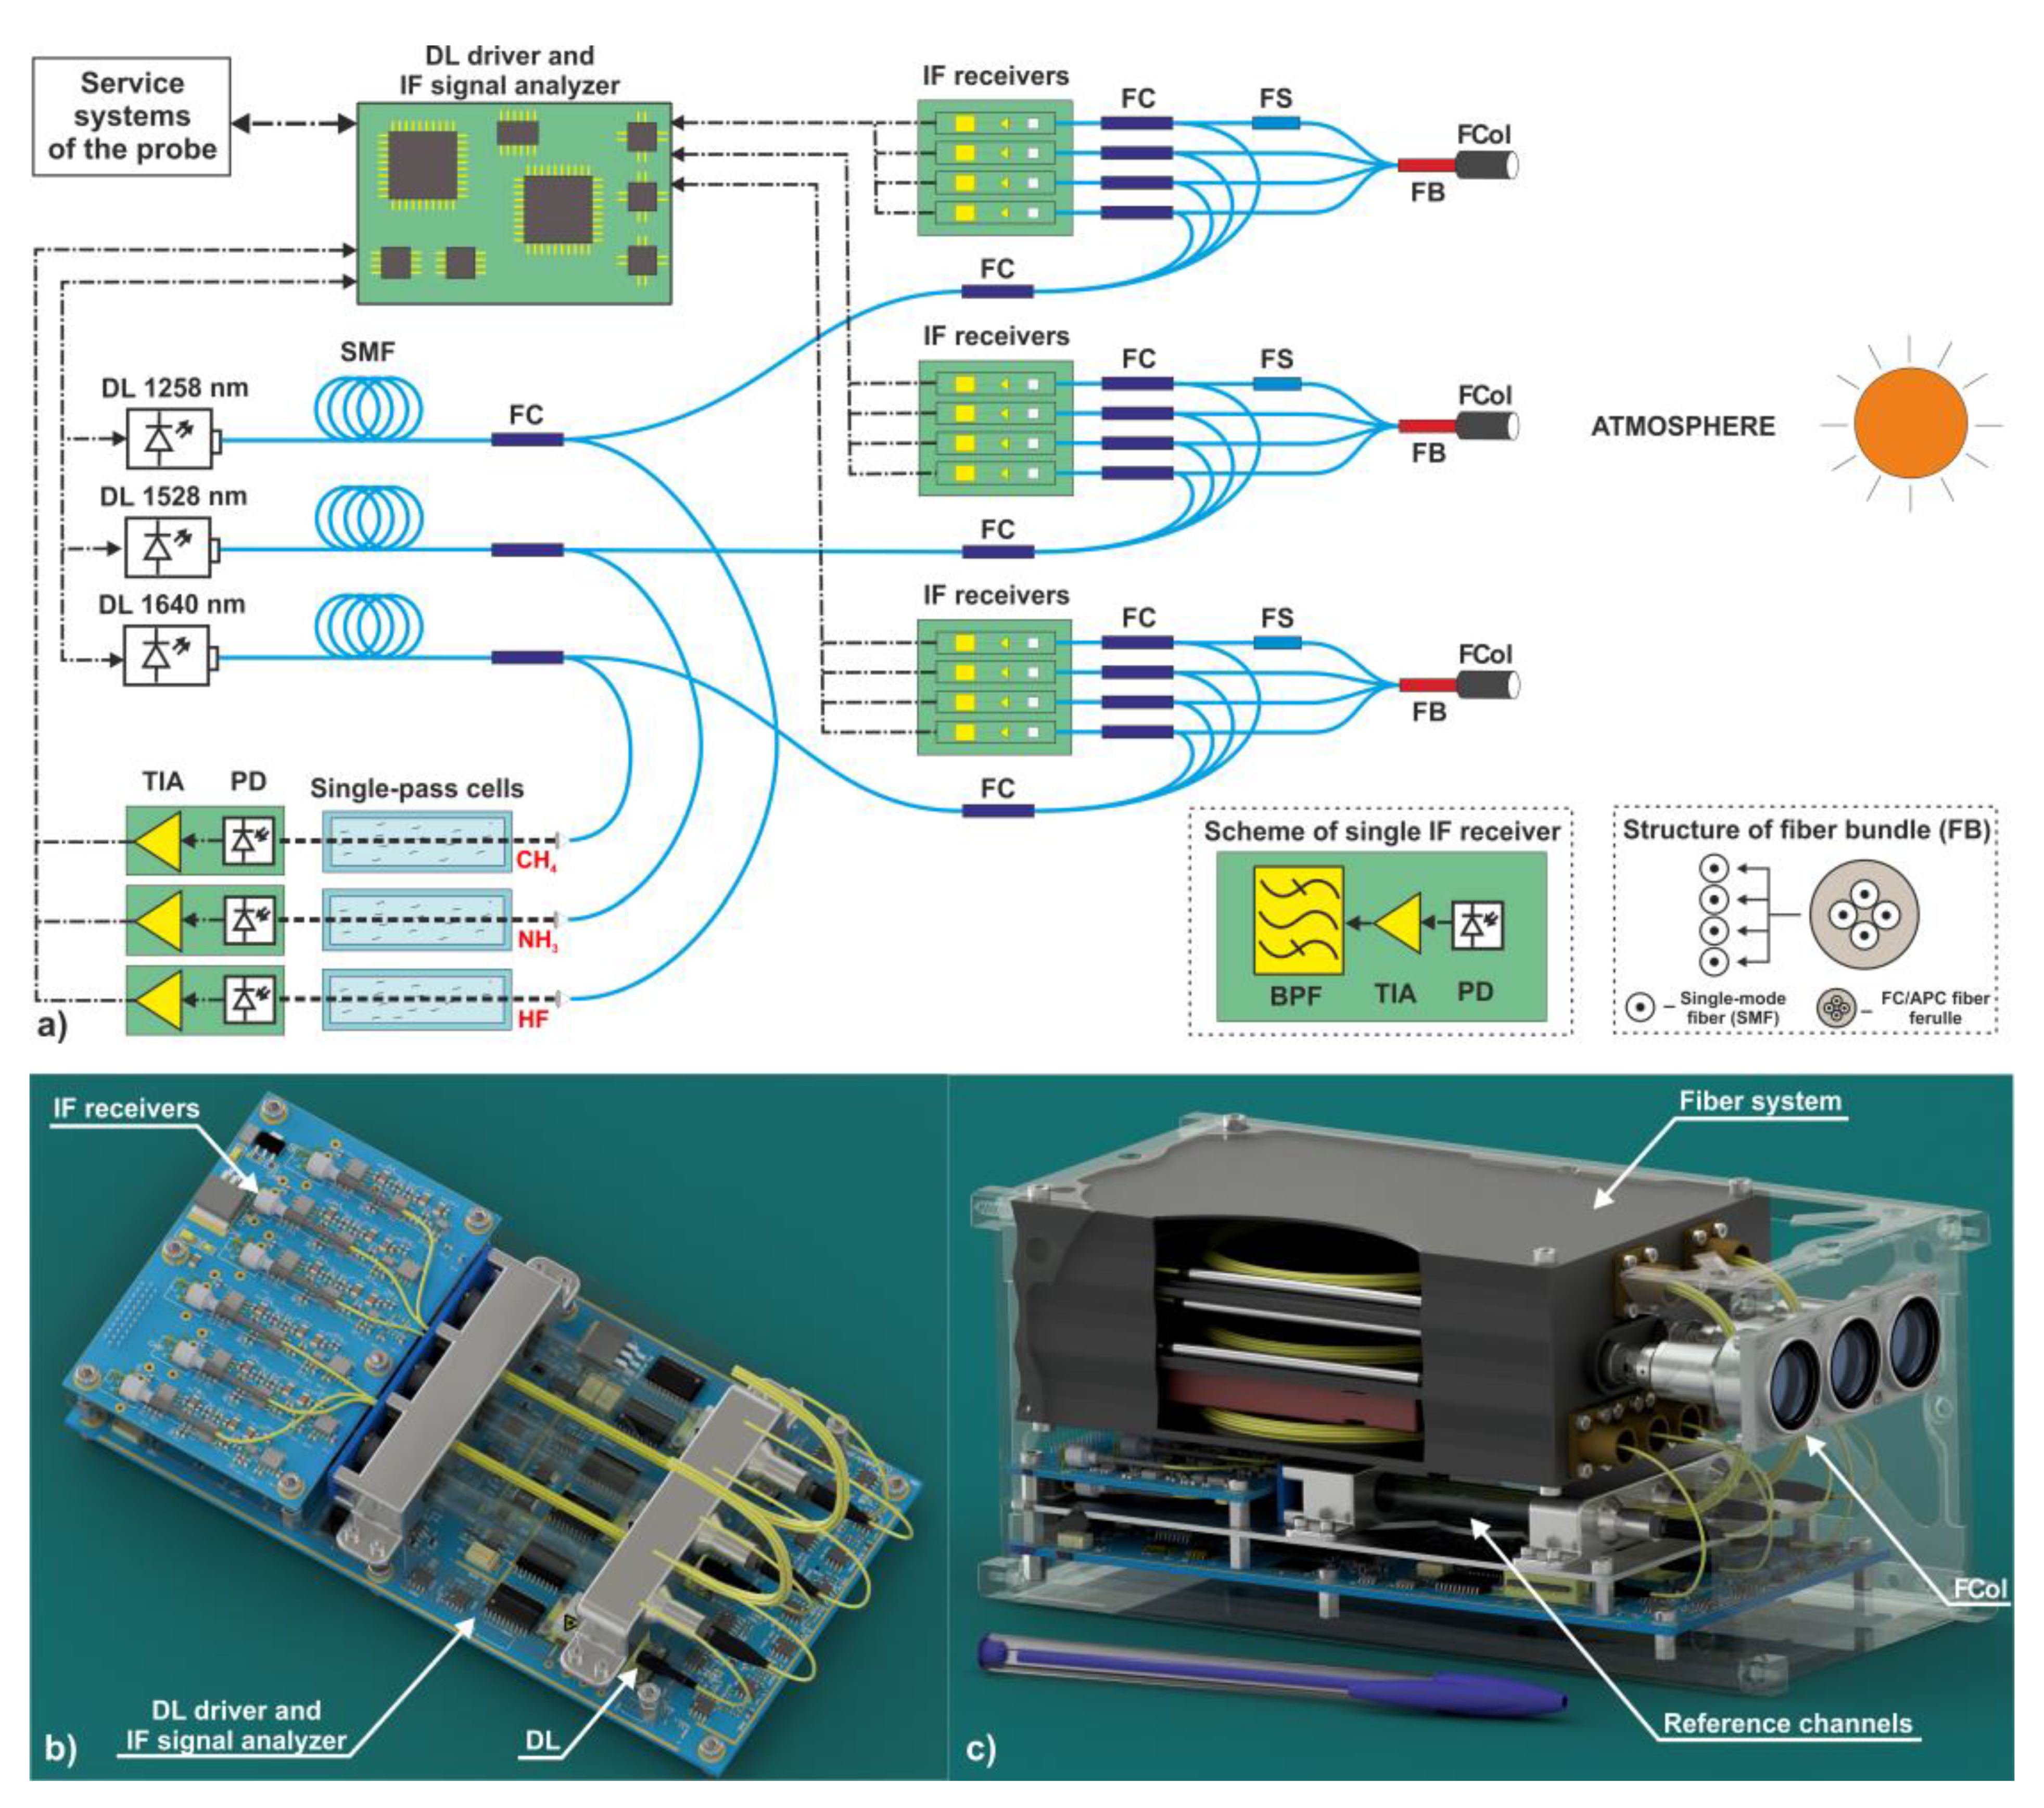
Figure 12a shows the sketch of the MLHS, which has three spectral channels, with each channel, in turn, having a multichannel design (four IF receivers per one spectral channel), so that the instrument is equipped with 12 IF receivers. DFB DLs with the fiber outputs are used as local oscillators (LO). Solar radiation passed through the atmosphere is injected into the single-mode optical fiber system (SMF) via fiber collimator (FCol) and then coupled with the DL radiation on the photodiode (PD) of each IF receiver. For each spectral channel, one FCol is used. Solar radiation for each IF receiver is delivered by fiber bundle (FB); its structure is presented in
Figure 12a as well. Exploiting FB allows decreasing the weight of MLHS and, in contrast with the fiber couplers (FC), FB does not decrease solar radiation power for each IF receiver. A fiber switch (FS) is installed into the SMF system after the fiber collimator of the first IF receiver for each spectral channel. The purpose of a switch is a dark signal level evaluation based on the technique described in [
45]. The IF signal detection and post-processing methods employed in the MLHS are the same as in the ground-based prototype described in
Section 3. Management of three DLs is implemented using the FPGA-based DL driver. However, the implementation details of reference channels in MLHS and its ground-based prototype are different. The prototype’s reference cell is filled with a mixture of the same gases to be measured in the atmosphere. In turn, the spaceborne MLHS employs reference cells filled with different gases having strong absorption lines in the spectral range of interest. Replacement of weakly absorbing GHG in the cell by gases having stronger absorption lines in the same spectral range allows us to use compact single-pass optical cells for DLs frequency stabilization.
Figure 12b,c presents the model of spaceborne MLHS placed into 2U CubeSat form-factor, assembled from typical telecommunication components. For scale purposes, the pen is placed near the model in
Figure 12c.
Looking at the MLHS from an electronics perspective (see
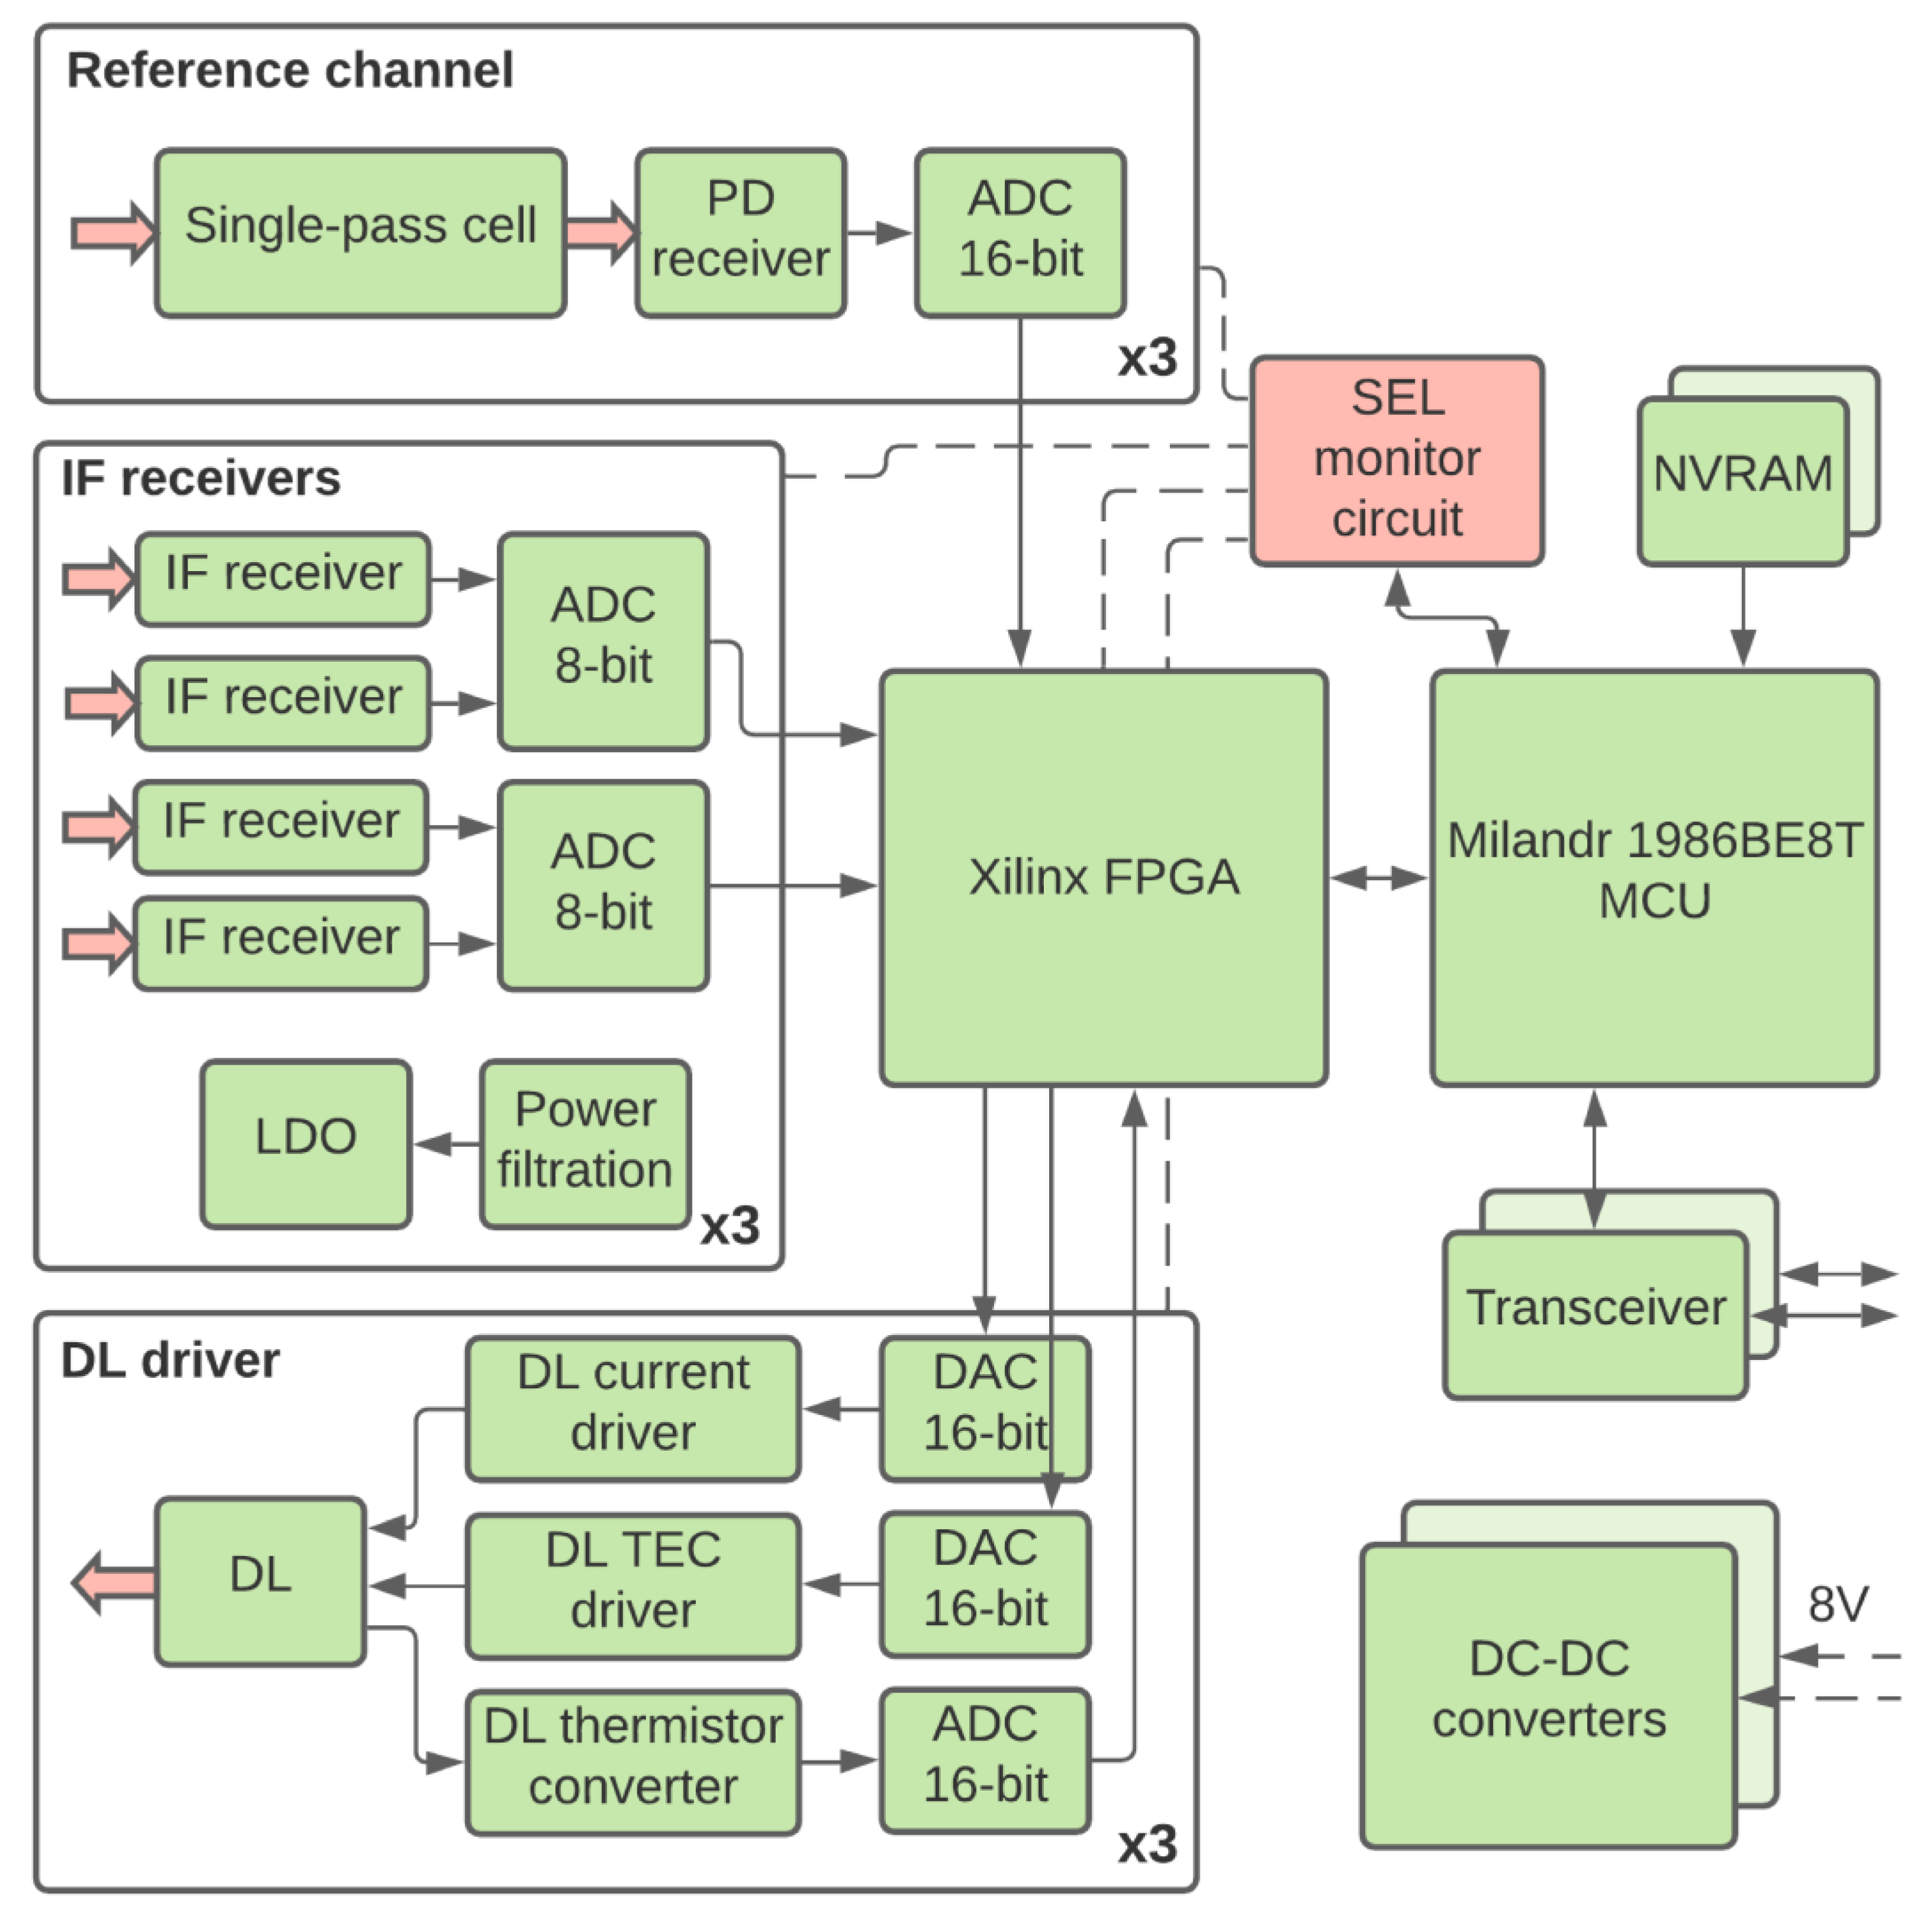
Figure 13), all signal acquisition and processing could be implemented on two printed circuit boards (PCB): the IF receivers board, responsible for IF signal filtration and amplification, and the motherboard for signal processing and diode lasers control. The experiment will be processed by Xilinx Artix 7 FPGA manufactured by Xilinx Inc., San Jose, CA, USA. All the service tasks and failure event monitoring will be handled by the radiation-hardened Milandr 1986BE8T Cortex-M4 microcontroller unit (MCU) manufactured by “PKK Milandr” joint-stock company, Zelenograd, Russia. The current of every electronics unit will be monitored for single-event latch-up (SEL) protection. Besides that, the multichannel configuration already means the duplication for additional durability by itself. A detailed description of the analog part will be provided elsewhere.
Several critical requirements are affecting the selection of spectral ranges for GHG remote sensing. Firstly, it is desirable to cover as many atmospheric gases as possible in the relatively narrow spectral range of 1200–1650 nm. This constraint is dictated by the availability of a compact and affordable telecommunication component base. Secondly, the broadest range in sounded tangent height should be covered, with observed spectral lines strong enough to be measurable and weak enough to be unsaturated. Finally, it is essential to find gases for reference cells characterized by strong absorption lines in the spectral range of interest. This requirement is dictated by the need for a compact suite of reference channels for DL precise frequency stabilization.
The analysis of the constraints stated above has resulted in the selection of three spectral ranges for remote sensing of four atmospheric species (CO2, H2O, CH4, and O2) in the range of tangent heights of 5–50 km:
measurement of O2 in the vicinity of 1258 nm (7950–7953 cm−1);
measurement of H2O and CO2 in the vicinity of 1528 nm (6544–6545.5 cm−1);
measurement of CH4 and CO2 in the vicinity of 1640 nm (6095–6097 cm−1).
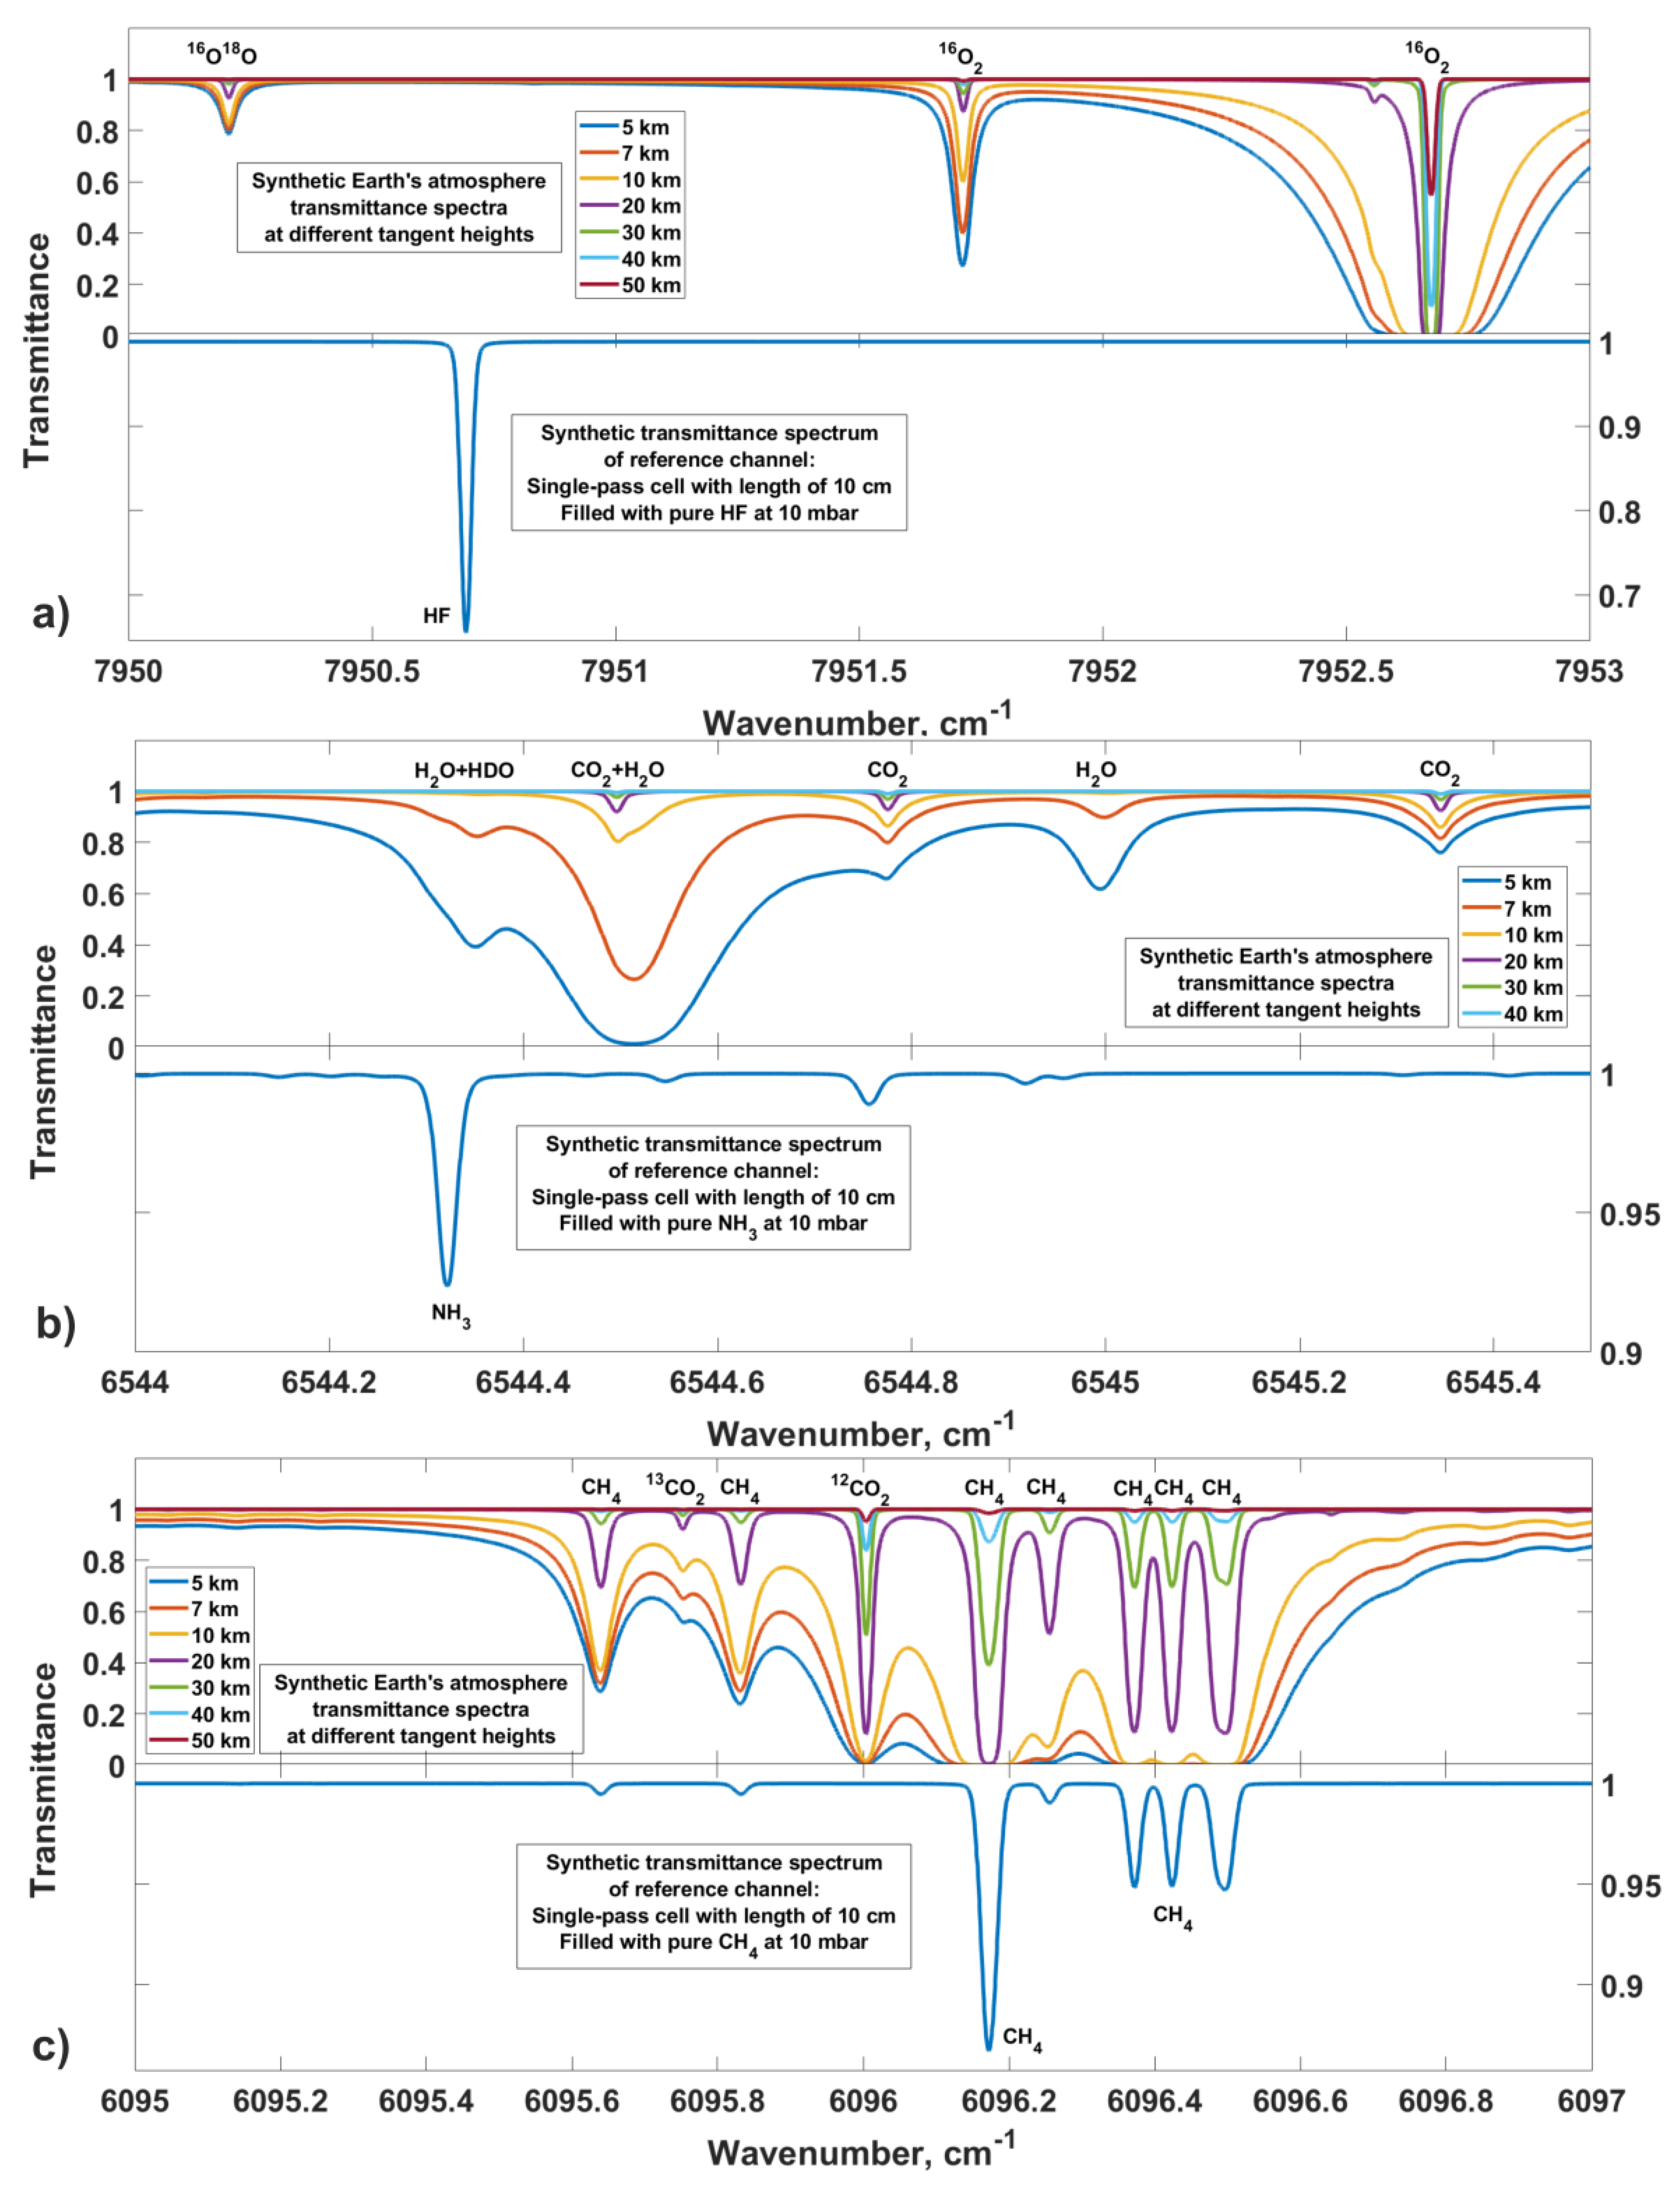
The synthetic spectra of atmospheric transmittance in these ranges are presented in
Figure 14a–c for the wavelength of 1258, 1528, and 1640 nm, respectively (upper subplots); the bottom subplot in each spectral range corresponds to the transmittance of reference channel. Atmospheric synthetic spectra were obtained based on the radiative transfer model with spherical geometry and a single layer width of 1 km. Atmospheric scattering and refraction were neglected. Spectral line parameters were taken from HITRAN-2016 [
46], while vertical profiles of pressure, temperature, water vapor, and GHG concentrations were taken from [
57].
The reference gas for the 1258 nm spectral channel is the HF (hydrogen fluoride), which spectrum is shown in the bottom subplot of
Figure 14a for an effective optical path of 10 cm at a pressure of 10 mbar. For the 1528 nm spectral channel, the reference gas is NH
3, with the transmittance spectrum presented in
Figure 14b for the effective optical path of 10 cm at a pressure of 10 mbar. CH
4 is the reference gas for the latter spectral channel of 1640 nm, with the spectrum illustrated in
Figure 14c for an effective optical path of 10 cm at a pressure of 10 mbar. According to absorption line intensities, atmospheric transmittance spectra of the listed spectral ranges imply different upper tangent height ranges. For example, H
2O and CO
2 lines at 1528 nm are detectable only to 15 and 40 km, respectively. Nevertheless, all three spectral channels are suitable for simultaneous measurements in the joint tangent height range of 5–50 km.
The ultra-high spectral resolution of the MLHS allows to resolve a profile of an isolated rotational-vibrational absorption line and enables Doppler measurements of the wind speed projection on the line of sight. However, unlike a ground-based prototype that performs Doppler wind profiling from the stationary observing position, in the case of spaceborne sounding, Doppler displacement of the line contour will be caused by several factors: spacecraft movement at the velocity of 7700 m/s, Earth rotation, and stratospheric airflow itself. The spacecraft movement provides maximal Doppler shift of the spectral lines by 5 GHz from their initial position. According to lidar Doppler measurements [
58], atmospheric zonal airflows in the range of 5–50 km could reach 80 m/s, providing spectral line shift up to 55 MHz.
Figure 10a shows that the overwhelming number of MLHS orbital observations is 15–20 s long. We estimate the MLHS measurement capabilities based on experiments with the ground-based prototype presented in
Figure 8 with an SNR of 50 for an integration time of 1 s. It means that a significant part of GHG mixing ratio and vertical wind profiles within the range of 5–50 km will involve 15–20 spectra recorded with a vertical spatial step of 2–3 km. Doppler wind measurements’ expected accuracy is 2–3 m/s, limited mainly by the precision of the DL frequency stabilization of 1.5 MHz. The accuracy of GHG mixing ratio retrievals depends on the shape of spectral features. For instance, spectra of O
2 and CO
2 are characterized by isolated spectral lines, as shown in
Figure 14, and the expected accuracy of their retrievals is about 0.5%. In contrast, CH
4 and H
2O absorption spectra include several overlapping lines, which leads to the degradation of retrievals accuracy up to 1% or worse.
According to the model presented in
Figure 12b,c, the payload of spaceborne MLHS can be placed into the 2U CubeSat form-factor. Such a compact payload can be easily integrated into any spaceship standard, including larger CubeSat standards as reported in [
38,
39]. 2U MLHS has a weight not exceeding 3 kg and needs pointing to the Sun disk with an accuracy of 10′. Considering described parameters, the launch of a cost-effective MLHS CubeSat mission to low Earth orbit is feasible.
6. Discussion
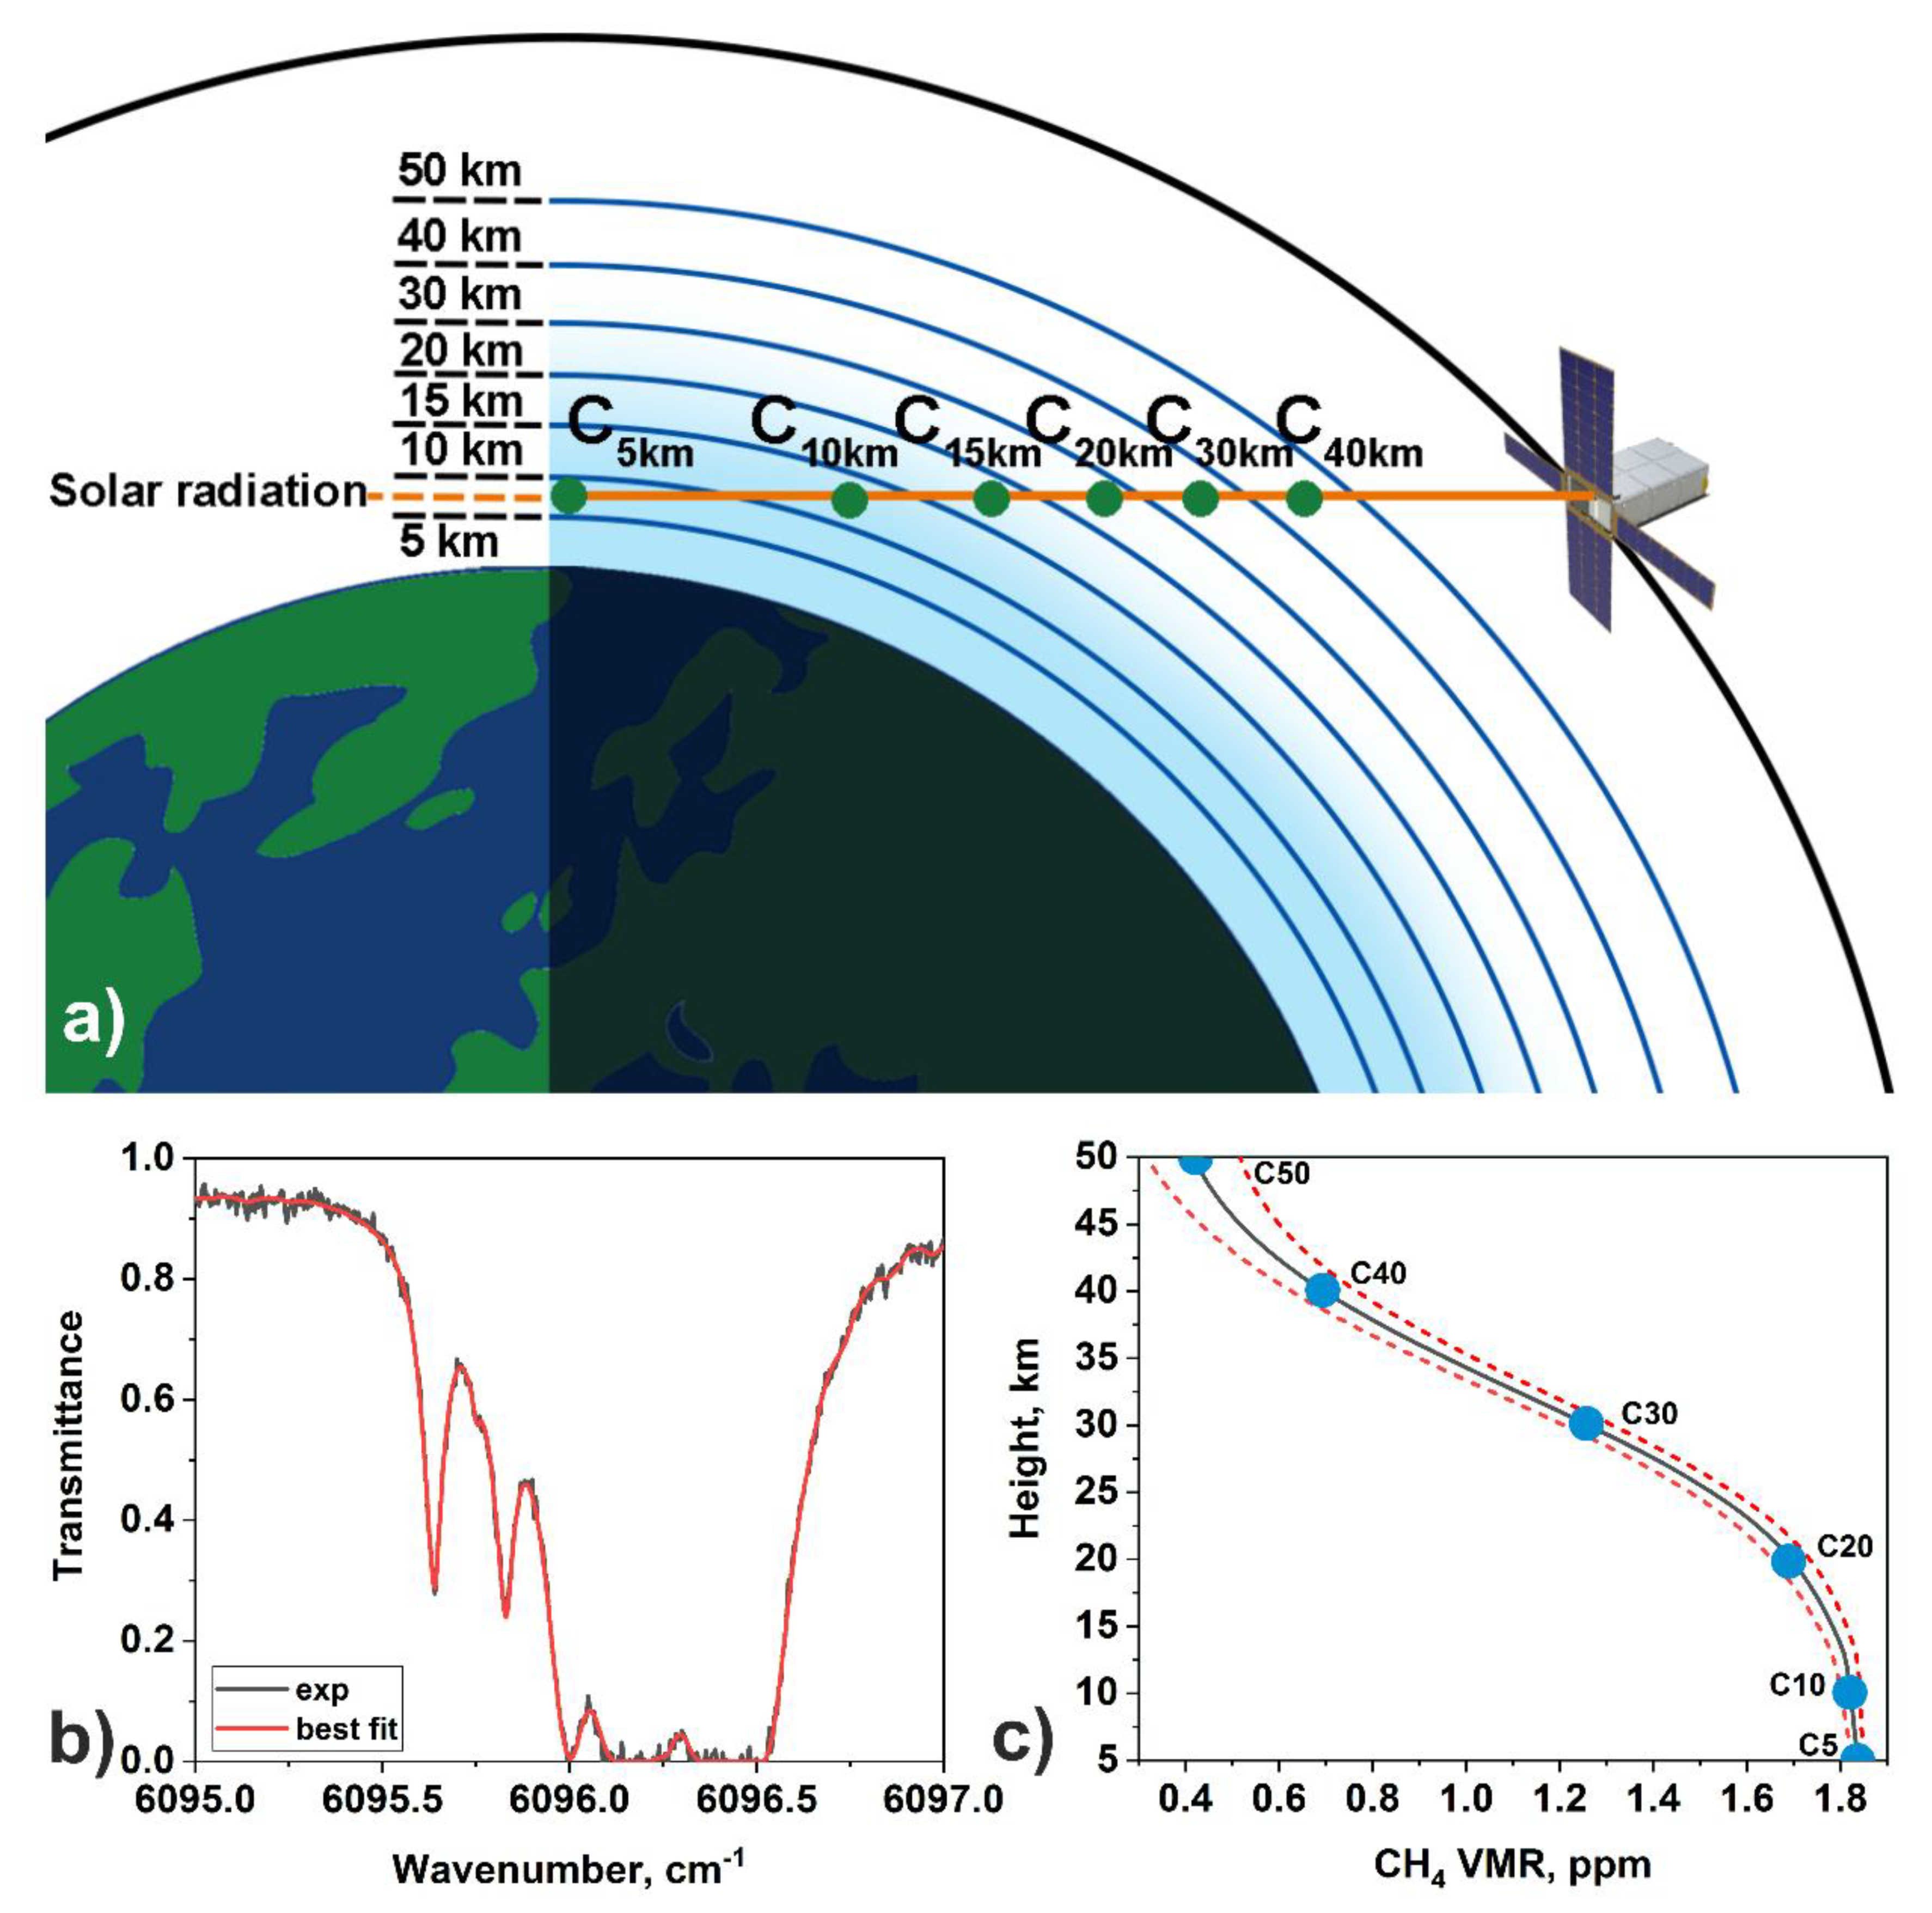
As mentioned above, high-resolution spectra provided by the heterodyne detection technique carry information about possible variations of sounded gas abundance variations along the sounding path. Here we will demonstrate how such information may be utilized in the methane profile retrievals. The general geometry of solar occultation measurement is presented in
Figure 15a. Atmospheric layers with different altitudes contribute to the resulting spectrum.
Figure 15b shows an example of a synthetic atmospheric transmission spectrum in the vicinity of CH
4 multiplet near 1640 nm (6096 cm
−1). This spectrum is characterized by the SNR of 50, which is a typical value for the exposure time of 1 s. Due to fully resolved profiles of spectral lines involved in this spectrum, their different intervals are formed at different altitudes. The detailed description of utilizing this information in vertical profiling, including error estimation and weighting functions, is presented in [
13,
51]. Applying the same technique to the solar occultation spectrum, one can retrieve methane abundances at different altitudes contributing to a single occultation spectrum. The resulting profile retrieved along the sounding path with error estimates is presented in
Figure 15c. Do not confuse this profile with the standard vertical GHG profiles, which could be measured during sunrises/sunsets at solar occultation geometry.
It is known that with the higher layers, the accuracy of their contribution evaluation decreases. In particular, the retrieval accuracy of a mean CH4 mixing ratio in the interval 5–40 km is 0.023 ppm, whereas above 40 km, accuracy is no better than 0.1 ppm. However,
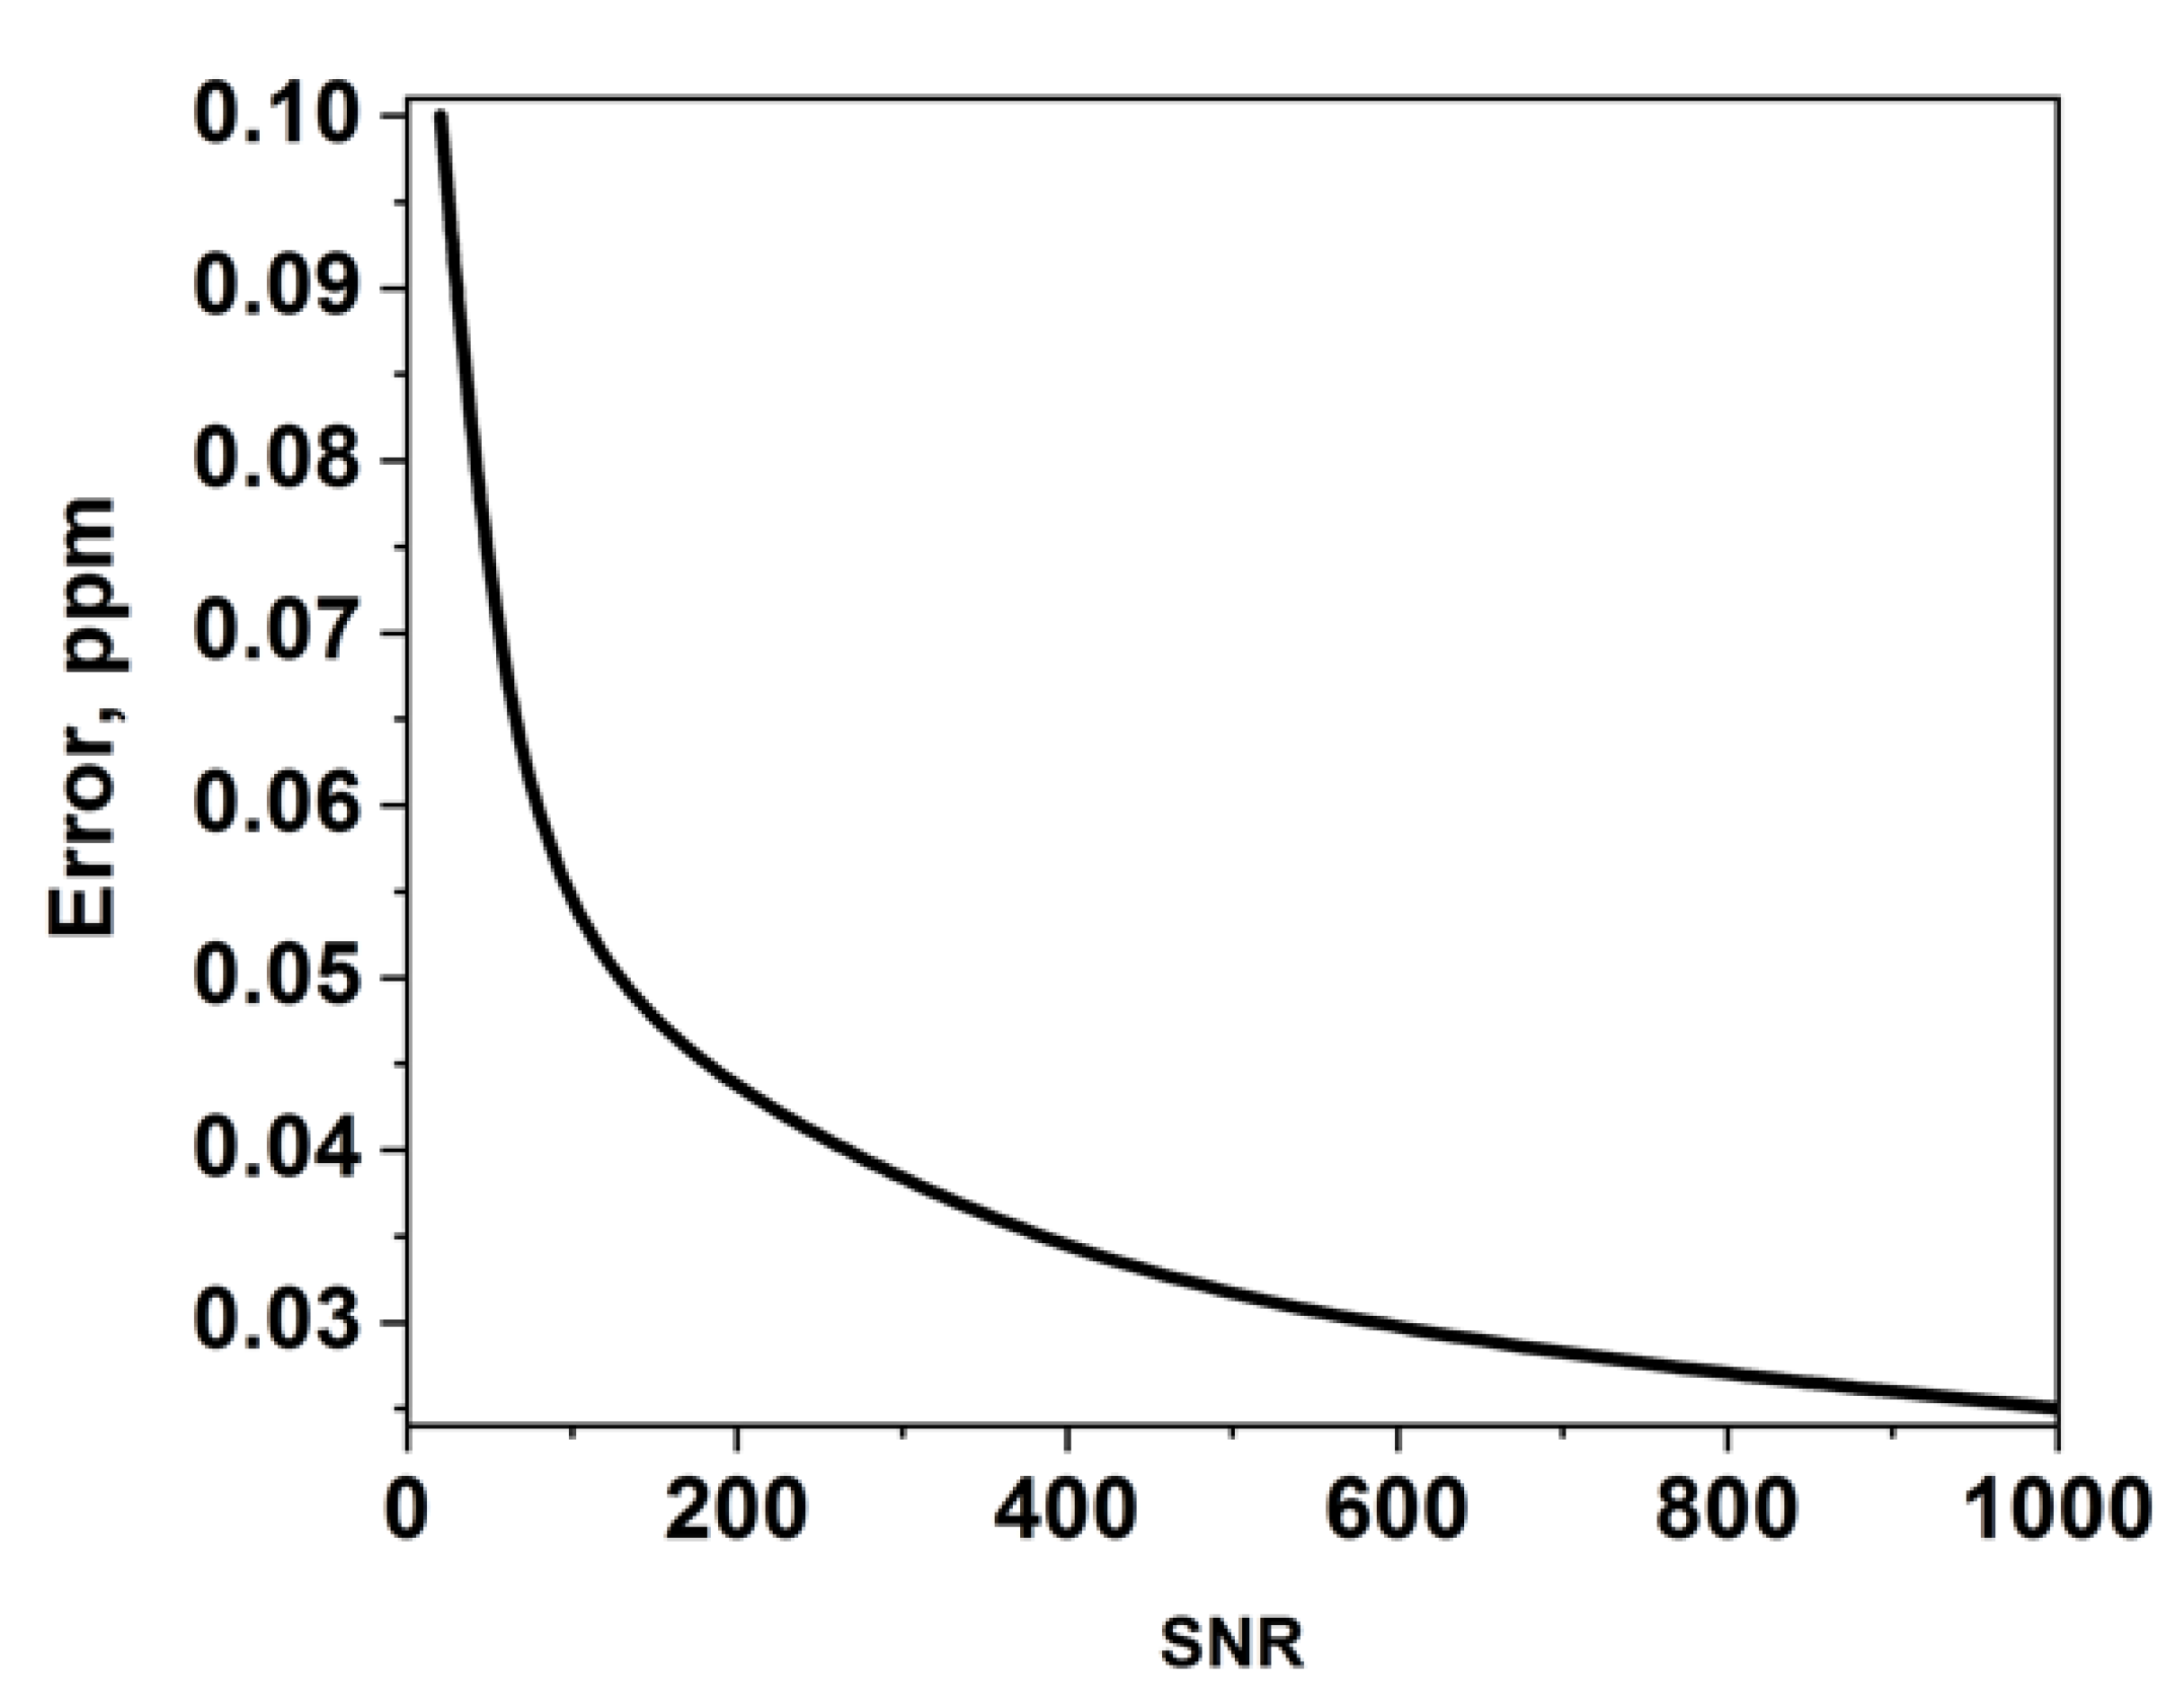
Figure 15c shows that even a single spectrum provides information not only about target species concentration at particular tangent altitudes but also at higher levels. The combination of these retrievals with the sequence of occultation spectra taken at different altitudes provides a tomographic view of a sounded species’ spatial distribution in the vertical and horizontal directions. The accuracy of the retrievals is strongly dependent on the quality of measured spectra, with SNR increase leading to the sharp decrease of the estimated retrieval error. An estimation of such dependence for CH
4 mixing ratio evaluation above 40 km based on spectra taken with the tangent altitude of 5 km is shown in
Figure 16.
Although orbital parameters barely allow one to obtain spectra with SNR better than 50, there are specific conditions when SNR better than 500 is expected, as shown in
Figure 10.
Figure 16 clearly represents that such a high SNR may result in the accurate 3D reconstruction of methane mixing ratio in the troposphere and stratosphere. A similar approach may be readily applied to CO
2 and other atmospheric species. Therefore, a combination of solar occultation technique that provides sensitive vertical profiling, with the high spectral resolution provided by heterodyne IR spectroscopy, opens new capabilities of atmospheric sounding onboard CubeSats. Indeed, the most critical processes driving GHG emissions and losses occur at the Earth’s surface and are unavailable for observations in solar occultation geometry. Nevertheless, such observations may complement current and future space missions targeting GHGs by detailed information about their distribution in the troposphere and stratosphere.
