Article

Physical Retrieval of Rain Rate from Ground-Based Microwave Radiometry

1
Institute of Applied Physics, University of Bern, CH-3012 Bern, Switzerland
2
Oeschger Centre for Climate Change Research, University of Bern, CH-3012 Bern, Switzerland
*
Author to whom correspondence should be addressed.
Remote Sens. 2021, 13(11), 2217; https://doi.org/10.3390/rs13112217
Submission received: 12 May 2021 / Revised: 31 May 2021 / Accepted: 1 June 2021 / Published: 5 June 2021
(This article belongs to the Special Issue Remote Sensing for Precipitation Retrievals)

Abstract

:
Because of its clear physical meaning, physical methods are more often used for space-borne microwave radiometers to retrieve the rain rate, but they are rarely used for ground-based microwave radiometers that are very sensitive to rainfall. In this article, an opacity physical retrieval method is implemented to retrieve the rain rate (denoted as Opa-RR) using ground-based microwave radiometer data (21.4 and 31.5 GHz) of the tropospheric water radiometer (TROWARA) at Bern, Switzerland from 2005 to 2019. The Opa-RR firstly establishes a direct connection between the rain rate and the enhanced atmospheric opacity during rain, then iteratively adjusts the rain effective temperature to determine the rain opacity, based on the radiative transfer equation, and finally estimates the rain rate. These estimations are compared with the available simultaneous rain rate derived from rain gauge data and reanalysis data (ERA5). The results and the intercomparison demonstrate that during moderate rains and at the 31 GHz channel, the Opa-RR method was close to the actual situation and capable of the rain rate estimation. In addition, the Opa-RR method can well derive the changes in cumulative rain over time (day, month, and year), and the monthly rain rate estimation is superior, with the rain gauge validated R2 and the root-mean-square error value of 0.77 and 22.46 mm/month, respectively. Compared with ERA5, Opa-RR at 31GHz achieves a competitive performance.

1. Introduction

The rain rate is a key meteorological parameter used to measure the amount of rainfall over time, and its level is closely tied to human life. Low rain rates are not sufficient to irrigate crops. High rain rates may cause flash floods, soil erosion, and urban waterlogging. Accurate rain rate information is essential for climate change models, water resources management, and assimilation into numerical weather prediction (NWP) models to improve rainfall forecasts [1,2].
To monitor rainfall, the rain gauge was developed to measure rainfall at sparsely distributed points, and it is the most commonly used instrument for comparing and verifying land rain rates derived from space-borne and ground-based microwave radiometers. The weather radar, on the other hand, can provide the three-dimensional (3D) image of rain in addition to the rain rate over a given location, but the accuracy is limited by a strong dependence on the drop-size distribution, ground clutter, instrument calibration, and beam blockage. Even though space-borne microwave radiometers have been successfully applied to rain-rate retrieval on a global scale and proved that microwave radiometry is fairly accurate, at least over the ocean, its disadvantages include low spatial resolution and temporal coverage; large uncertainties are found over land due to its heterogeneity and reduced contrast with regard to the rain signal [3]. The ground-based radiometry is suitable for operation under rainy conditions, and for the purpose of retrieving simultaneously water vapor, liquid water path [4,5], and rain [6]. Its main advantage is the large atmospheric signal by atmospheric emitters, and especially for rain, against a cold and homogeneous sky background [7].
The rain-rate retrievals of microwave radiometers can be divided into (1) statistical algorithms, (2) physical-statistical algorithms, and (3) physical algorithms. Statistical algorithms do not need to resort to complex radiation transmission models, so their calculation speed is high and as a consequence their timeliness. Won et al. [8] used two simple statistical algorithms, linear and logarithmic regression, to estimate the rain rate, and they analyzed the relationship between brightness temperature and rain rate. Using historical radiosonde data for training, Xu et al. [9] investigated the influence of the off-zenith neural network method on the rain rate measurement of microwave radiometers. However, statistical algorithms not only rely excessively on the number and representativeness of measured samples, but also lack a physical explanation for the retrieval process. To overcome these limitations, the physical-statistical algorithm is proposed to estimate the rain rate. For example, Marzano et al. [3] conducted a statistical analysis of the relationship between brightness temperature and rain rate on land, based on the numerical simulation data set of the radiative transfer model, using ordinary multiple regression and a variance-constrained regression algorithm.
The physical algorithm, compared with the above two algorithms, is more reasonable and can get a higher estimated accuracy of atmospheric parameters, because it can analyze from the perspective of atmospheric physical mechanisms and gain an in-depth understanding of the retrieval process. However, few studies used this algorithm for ground-based microwave radiometers. For example, Marzano et al. [7] performed detailed radiometric simulations to derive the rain rate from measurements of ground-based passive microwave systems.
In 2008, Mätzler and Morland [10] suggested a new physical method of the rain rate estimation for a ground-based microwave radiometer and showed that the atmospheric opacity at 31 GHz is closely related to the rain rate. However, this method only tested a few rain events, and whether it can estimate the rain rate in the long-term is not yet clear. The TROpospheric WAter RAdiometer (TROWARA) is a ground-based microwave radiometer that has provided long-term high-quality data of the atmospheric opacity (optical depth) every 6 s in Bern, Switzerland since 2005 [11]. Therefore, the objective of this article is to use the rain zenith opacity derived from TROWARA for the long-term rain rate using the new physical retrieval method and to perform operational processing and archiving of the rain rate estimated by the TROWARA radiometer. For comparison, the correlation between the rain rate from TROWARA and the rain rate measured by the rain gauges was determined for the assessment of the performance of the rain rate retrieval. Later, the rain rates of ECMWF Reanalysis v5 (ERA5) were compared with those of the rain gauges.

2. Data Set

2.1. Ground-Based Microwave Radiometer Data

The ground-based microwave radiometer, TROWARA, started working on the roof of the Physics and Mathematics (ExWi) Building of the University of Bern in 1994. The frequencies of the TROWARA microwave channel are 21.4 GHz (band width = 100 MHz) and 31.5 GHz (band width = 200 MHz), and the thermal infrared radiometer (IR) channel is at λ = 9.6–11.5 μm. The antenna coil of TROWARA at the full width of half-power is 4° and observes the atmosphere in the southeast direction at an elevation angle of 40°. TROWARA was designed for retrieving the integrated water vapor (IWV) and integrated liquid water (ILW) of cloud droplets, and it provides a practically uninterrupted time series with a time resolution of 6 s in almost all-weather during day and night.
The radiative transfer equation in the Rayleigh-Jeans approximation is:
T B , i   = T C   ·   e τ i / μ + T mean , i   ·   ( 1     e τ i / μ )
where i represents the frequency channel (e.g., 21 GHz). T B , i is the radiant brightness temperature observed by the radiometer, and T C = 2.7   K is the cosmic background temperature. τ i is the zenith opacity.   μ is the cosine of the zenith angle θ , i.e., μ = cos θ . T mean , i is the effective mean temperature of the atmosphere [12,13].
The zenith opacity can be solved by Equation (1).
τ i =   μ   ·   l n ( T mean , i     T B , i T mean , i     T C )
In fact, the microwave radiation measured by TROWARA during rain is strongly enhanced by the microwave emission from raindrops (d > 0.2 mm) [11]. Thus, it is raining when ILW exceeds a threshold value of about 0.4 mm. In times of rain, the retrieval of ILW of cloud droplets is not possible. Instead, TROWARA will provide the rain rate [10]. The retrieval of ILW uses a refined physical algorithm based on the zenith opacity for ground-based microwave radiometers [14].
ILW = τ 31     a 31     β   ·   ( τ 21     a 21 ) c 21   ·   ( 1     β   ·   γ )
where a i (i = 21 and 31) is the absorption of the dry atmosphere. β = b 31 / b 21 , and the coefficient b i is the specific absorption by water vapor. γ = c 31 / c 21 , and the coefficient c i is the specific absorption of cloud liquid water in the Rayleigh approximation. It is computed from the dielectric constant of liquid water [15].
The initial construction and retrieval principles of TROWARA were given in Peter and Kämpfer [16]. To estimate the antenna temperature well, a new radiometer model was established, which uses continuous internal calibration and external tipping calibration a few times each year [17]. In November 2002, the instrument was moved to an indoor laboratory to observe the sky, and the antenna received the atmospheric microwave radiation through a transparent window. The indoor operation of TROWARA prevents the antenna from being exposed to rain [18]. In 2004, the new refined physical scripts [14] were used to retrieve IWV and ILW, and TROWARA has continuously performed measurements in Bern since then [11]. Therefore, to maintain the consistency of measurements and not be affected by previous outdoor observations, we presume that the data after 2005 are well-suited for the rain-rate estimation.

2.2. Meteorological Data

A standard weather station is located on the ExWi building together with TROWARA and is known as the ExWi weather station. Another weather station is an automatic Vaisala weather station at the Zimmerwald Observatory near Bern, called Zimmerwald weather station. The weather data are composed of surface air temperature ( T S ,   K ), the surface relative humidity ( RH S ,   % ), the surface atmospheric pressure ( P S ,   hPa ), rain rate, and other parameters measured by the ExWi and Zimmerwald weather stations with a time resolution of 10 min. Registered users can access the data for free from the STudies in Atmospheric Radiative Transfer and WAter Vapor Effects (STARTWAVE) database (http://www.iapmw.unibe.ch/research/projects/STARTWAVE/, accessed on 3 June 2021).
Under non-rainfall conditions, the effective mean temperature T mean , i is estimated from the linear combination:
T mean , i = A 0 , i   +   A 1 , i   ·   T S   +   A 2 , i   ·   RH S   +   A 3 , i   ·   P S
where the coefficients A n , i   ( n = 0 ,   1 ,   2 ,   3 ) were statistically obtained by radiosonde measurements using the Rosenkranz [19] radiative model and making corrections through clear sky observations. The information of T mean , i is mainly derived from T S . The parameters RH S and P S are used to consider the statistical characteristics of atmospheric anomalies, such as detecting the atmosphere above the boundary layer.

2.3. Rain-Rate Measurements

The rain gauge at ExWi weather station is a tipping bucket rain gauge with a resolution of 0.2 mm, and its time resolution is 10 min. The maximum rain rate value that it can observe is 50 mm/10 min. The tipping bucket rain gauge guides the rain in the receiving funnel into two small bucket collectors. When a certain amount of rain (0.2 mm) accumulates in one bucket, the weight of the water tips it and empties it. Then another bucket moves under the funnel to collect the rain. The advantage of the tipping bucket rain gauge is that it can easily identify rainfall intensity (light, moderate, heavy, or violent). Observers can count the number of rain gauge marks within a set time period (10 min) to determine the rain intensity.
However, the accuracy of tipping bucket rain gauges is usually not as good as that of standard rain gauges. For example, it is possible that the bucket will not tip over until the rain stops, and it may only take one or two drops of rain to tip the bucket when the next rain starts. On the other hand, the tipping bucket rain gauge tends to underestimate the rain rate [20,21], because it loses rain every time it tips [22].
The rain gauge at the Zimmerwald weather station has the same resolution as the ExWi rain gauge (0.2 mm). In addition, an optical rain sensor with a resolution of 0.1 mm at the ExWi weather station is another ground-based rain rate observation, and its time resolution is 10 min.

2.4. ERA5 Reanalysis Data

ERA5 reanalysis is an atmospheric reanalysis product recently released by the European Centre for Medium-Range Weather Forecasts (ECMWF) with a time resolution of 1 h and a horizontal resolution of 30 km grid spacing [23]. ERA5 has been providing rain rate data on the global land surface since 1950 and has assimilated rain rate information from ground radar measurements since 2009. ERA5 used approximately 24 million observations every day by the end of 2018. Users can access rain rates for free from the Climate Data Store (CDS) website (https://cds.climate.copernicus.eu, accessed on 3 June 2021).
ERA5 uses the all-sky method instead of the clear sky method to assimilate a large number of satellite channels that are sensitive to humidity. ERA5 not only provides new information in rainy areas, but also solves the problem of abnormal precipitation caused by the radiation assimilation technology on rainy days [24]. ERA5 also contains the bias correction of assimilated data and benefits from model physics and core dynamics developed over the years. In addition, the large-scale precipitation program of ERA5 has been upgraded, including the improvement of the prognostic variables of rainfall and snowfall, and many optimizations in the microphysical parameterization, especially for warm rain processes [25].
However, previous research suggested that ERA5 reanalysis may overestimate the rain rate. For example, Xu et al. [26] indicated that ERA5 typically has an overestimation of the spring rain rate in the Assiniboine River Basin. Nogueira’s [27] process-based analysis shows that ERA5 tends to overestimate precipitation and reveals positive bias (1 mm/day) in most tropical oceans, as well as the Himalayas and Andes. Amjad et al. [28] evaluated the rain rate of ERA5 under the complex terrain and climate change in Turkey and found that ERA5 has a wet bias (0.5 mm/day) and consistently overestimates the rain rate in all relatively wetter and slope levels. Moreover, ERA5 is not so reliable to distinguish between rainy and non-rainy days (at least for Bern). Its original precipitation data show that there is rain for 93% of the days from 2005 to 2019, which is unreasonable and will lead to overestimation. However, our study avoids much of the overestimation of ERA5 because the rain events we use are simultaneously available in all data sets. This ensures that there will not be a situation where ERA5 detects rain on a certain day, while TROWARA and rain gauges cannot detect it.

3. Methods

3.1. Physical Retrieval Method Opa-RR for Rain-Rate Estimation

3.1.1. Effective Zenith Opacity and Specific Rain Absorption

Figure 1 shows the change in the total zenith opacity over time during a 6-day rain event in 2019. The total zenith opacity is the sum of the rain zenith opacity τ R , i and the non-rain zenith opacity τ 0 , i , and their calculations are described in the next subsection. As it can be observed from Figure 1, the total zenith opacity increases significantly when the rain gauge detects rain. Moreover, the more accumulated rain in a short time (moderate and heavy rain), the more the change of the total zenith opacity. Assuming the height of the rain layer is known, this indicates that the zenith opacity is an excellent proxy for rain rate.
The radiative transfer equation of the rainy atmosphere usually includes the treatment of radiation scattered by raindrops. Here we avoid considering the interaction of radiation with raindrops. We still apply Equation (2) for the computation of an effective zenith opacity τ i for ground-based radiometry. Scattering is included in a simplified way. During the rainfall period, the zenith opacity is be expressed as:
τ i = ( a i + b i   ·   IWV + c i   ·   ILW ) + τ R , i τ R , i =   c i   ·   G M , i   ·   IRL
The content in the bracket of Equation (5) is the zenith opacity without rain, where the coefficients a i , b i , and c i are the same as in Equation (3). The contribution of τ R , i is caused by the column of precipitation. G M , i is the Mie gain of raindrops, which can reach 10 at 21 GHz and 7 at 31 GHz [29], IRL is the integrated rain liquid, which is related to the rain rate R i as shown below:
IRL = R i   ·   H R / v
where H R is the height of the rain column, and we assume a homogeneous rain column. H R is calculated by the temperature lapse rate Γ = dT / dH , the surface temperature T S , and the temperature of melting layer T ML = 273.15   K , i.e., H R = ( T S T ML ) / Γ . The temperature lapse rate Γ depends on weather conditions and is generally more than 4 K/km but less than 8 K/km [30]. v is the vertical fall velocity of rain.
Since the dielectric loss of ice is very small, the absorption of dry snow above the rain layer can be ignored. Furthermore, we ignore the influence of wet snow in the melting layer and consider the rain column, only.
For the frequencies used, the absorption coefficient of the rainy atmosphere is clearly larger than the scattering coefficient as shown by simulations using Mie theory for spherical raindrops [29]. This means that only single scattering may have an influence. In our geometry, the forward-scattered radiation is from the cold sky and thus can be ignored. However, the radiation emitted by the earth’s surface can be scattered by raindrops in the backward hemisphere and received by the radiometer. The earth’s surface has high emissivity. Its temperature is close to the rain temperature. This scattering of raindrops is simulated by enhanced emission of the raindrops, using an effective absorption coefficient given by the sum.
c i   ·   G M , i = γ a , R + γ s , R   ·   1     < cos θ > 2
where γ a , R   is the true absorption coefficient, while   γ s , R   ·   1     < cos θ > 2 is the fraction of the scattering coefficient γ s , R   that causes scattering in the backward hemisphere, and < cos θ > is the mean cosine of the scattering angle.
From Equations (5) and (6), the rain opacity can be written as:
τ R , i = g R , i   ·   H R   ·   R i
where g R , i = c i   ·   G M , i / v is the specific and effective rain-absorption coefficient at frequency i. Computations of g R , i with Mie theory for different drop-size distributions and for a parameterized fall velocity [31] showed that the coefficient is almost constant, and nearly independent of rain rate. In addition, the temperature dependence is weak, so we assume constant values at a given frequency. At 21 GHz and at 31 GHz, the value of g R , i is set to 0.0165 h/mm/km and 0.0345 h/mm/km, respectively, which ensures an accuracy of 20% [10].

3.1.2. Rain Zenith Opacity from TROWARA

Radiation changes with rainfall, which leads to the atmospheric effective temperature to rise, while at the same time the low zenith opacity changes to a high zenith opacity. The variability of the atmosphere caused by rain makes it difficult to directly obtain precise formulas for radiative transfer problems of the rain layer. Based on Equation (5), the rain layer includes contributions from the non-rainfall atmosphere and contributions from rainfall. Therefore, an approximate but still accurate method is to assume that the additional contribution of rainfall to the atmosphere is an additional layer on the non-rainfall atmosphere, which can decouple the rainfall effect from the rest of the atmosphere. Figure 2b shows the radiative transfer model of this additional layer, which is the same as that of the non-rainfall period (Figure 2a). First, ILW is compared with the threshold value ILW R and assume that ILW     ILW R means the non-rainfall period, and ILW   >   ILW R means the rainfall period. Next, Figure 2b shows the rain radiant brightness temperature T B , R , i observed by the ground-based radiometer TROWARA is derived from:
(1) The non-rainfall brightness temperature T B , 0 , i . As shown in Figure 2, T B , 0 , i is the background temperature during the rainfall period and is calculated from the radiative transfer equation as:
T B , 0 , i = T C   ·   e τ 0 , i / μ + T mean , i   ( 1     e τ 0 , i / μ )
where τ 0 , i / μ is the non-rainfall slant-path opacity.
(2) The rain effective mean temperature T mean , R , i [31].
T mean , R , i = 0 τ R , i / μ   T ( τ )   ·   e τ   d ( τ ) 1     e τ R , i / μ
where τ is the slant-path opacity.   T ( τ ) can be described by a linear temperature profile T ( τ ) = T S     Γ   ·   h . We assume that the constant extinction coefficient γ e , R , i in the homogeneous vertical rain column ranges from h = 0 to h = H R = τ   ·   μ / γ e , R , i and no extinction above [32]. Insertion in Equation (10) gives:
T mean , R , i ( τ R , i ) = T S     Γ   ·   μ γ e , R , i   [ 1 τ R , i / μ   ·   e τ R , i / μ 1 e τ R , i / μ ]
From the function f ( x ) = 2   [ 1     e x ( 1   +   x ) ] x   ·   ( 1     e x )     e 0.19   x and replacing Γ   ·   H R with T S T ML , we can write:
T mean , R , i ( τ R , i ) = T S     Γ   ·   H R   ·   f ( τ R , i / μ ) 2     T S     1 2   ( T S     T ML )   ·   e (   0.19   τ R , i / μ )
However, during rain, the zenith opacity τ 0 , i of the atmosphere without rain cannot be measured. It has to be estimated by temporal interpolation of measurements obtained during rain-free periods. Furthermore, the determination of the effective mean temperature T mean , i (Equation (4)) is delicate. This will cause the rain zenith opacity τ R , i to be inaccurate. The initial estimated value of the rain zenith opacity is τ R , 0 , i = τ i     τ 0 , i , where the zenith opacity τ i is also not very accurate as well because it is calculated based on T mean , i . Because of complications of the inversion problem, physical algorithms which attempt to directly invert the optimal atmospheric parameters typically rely on the iterative adjustment of the radiative transfer model [33]. Therefore, we iteratively determine the rain zenith opacity τ R , i .
τ R , i ( k + 1 ) =   μ   ·   l n ( T mean , R , i ( τ R , i ( k ) )     T B , R , i T mean , R , i ( τ R , i ( k ) )     T B , 0 , i )
where τ R , i ( k + 1 ) is the (k+1)th iteration value of the rain zenith opacity. τ R , 0 , i is used as the input value of the iteration, i.e., τ R , i ( 0 ) = τ R , 0 , i . According to Equation (13), the initial estimate of the rain zenith opacity is gradually improved in an iterative manner. The basis for the improvement is to correct the rain zenith opacity using the difference between the rain effective mean temperature estimated in the kth iteration and the actual observed brightness temperature. It was found that the results basically converge after two iterations. However, this iteration distributes the error in the form of a natural logarithm, which does not take into account the actual situation and will amplify the error. Moreover, the correction value generated by the iteration is mainly positive, which is likely to cause the overestimation of the light rain.

3.2. Data Processing

Bern (46.95°N, 7.45°E) is the study area of this article. The TROWARA instrument (46.95°N, 7.44°E; Alt. 575 m asl) together with the ExWi weather station is located near the center of Bern. The ExWi optical rain sensor was discontinued in September 2012, so it is only used for short-term rain rate comparisons. The Zimmerwald weather station (46.88°N, 7.47°E; Alt. 907 m asl) is located about 8.4 km southeast of TROWARA, and its position happens to be in the direction that TROWARA is pointing. The curve of the accumulated rain obtained by the Zimmerwald rain gauge is too smooth and difficult to clearly describe the details of the rainfall, so it is only used for long-term rain rate comparisons. In the process of estimating and comparing the rain rate, the unit of all data is unified as mm/h. TROWARA estimated the long-term series of the rain rate from 1 January 2005 to 31 December 2019 for 15 years. The following is the selection process for the precipitation data:
  • Step1: rain-day events detected by TROWARA;
  • Step2: rain-day events detected by the rain gauge (ExWi or Zimmerwald rain gauge);
  • Step3: simultaneous and available rain-day events at Step 1 and Step 2;
  • Step4: the data of TROWARA, the rain gauge, and ERA5 all follow rain-day events of Step 3.
Table 1 shows the number of rain-day events for different daily rainfall intensities [34]. After removing outliers that more than 3 standard deviations (σ), the total number of rain-day events compared with the ExWi rain gauge from 2005 to 2018 is 1748, of which the light rain and moderate rain account for about 94%; the total number of rain-day events compared with the Zimmerwald rain gauge from 2008 to 2019 is 1529, of which the light rain and moderate rain account for about 97%. Because the time periods of the two rain gauges are different, and each rain gauge corresponds to different data missing, the above steps are repeated for the ExWi rain gauge and the Zimmerwald rain gauge, respectively. This means that the day-rain events of each rain gauge are not at exactly the same time.
In this work we assume a constant temperature lapse rate Γ of 6 K/km. This is the typical value for saturated-adiabatic temperature profiles and has proved that the estimated rain rate using this value is in good agreement with the ground rain sensor in many cases. The presence of raindrops is very likely when the ILW value exceeds 0.4 mm [14,35], so this study uses 0.4 mm as the rain threshold value ILW R . It should be noted that ILW R is usually between 0.1 mm and 0.6 mm, but the choice of the value of ILW R is not a big deal for the detection of rainfall intervals. This is because the emission enhanced by the Mie effects leads to a very strong increase in ILW value when the drop size (diameter) increases to more than 0.3 mm [36].
The evaluation statistics are used to assess the robustness of the Opa-RR physical algorithm, including the coefficient of determination (R2), the root-mean-square error (RMSE), the bias, the intercept, and the slope. The daily rain rate is the accumulated precipitation per day in mm / day ; the monthly rain rate is the accumulated precipitation per month in mm / month ; the annual rain rate is the accumulated precipitation per year in mm / year . We archive these estimated rain rate data in the STARTWAVE database.

4. Results

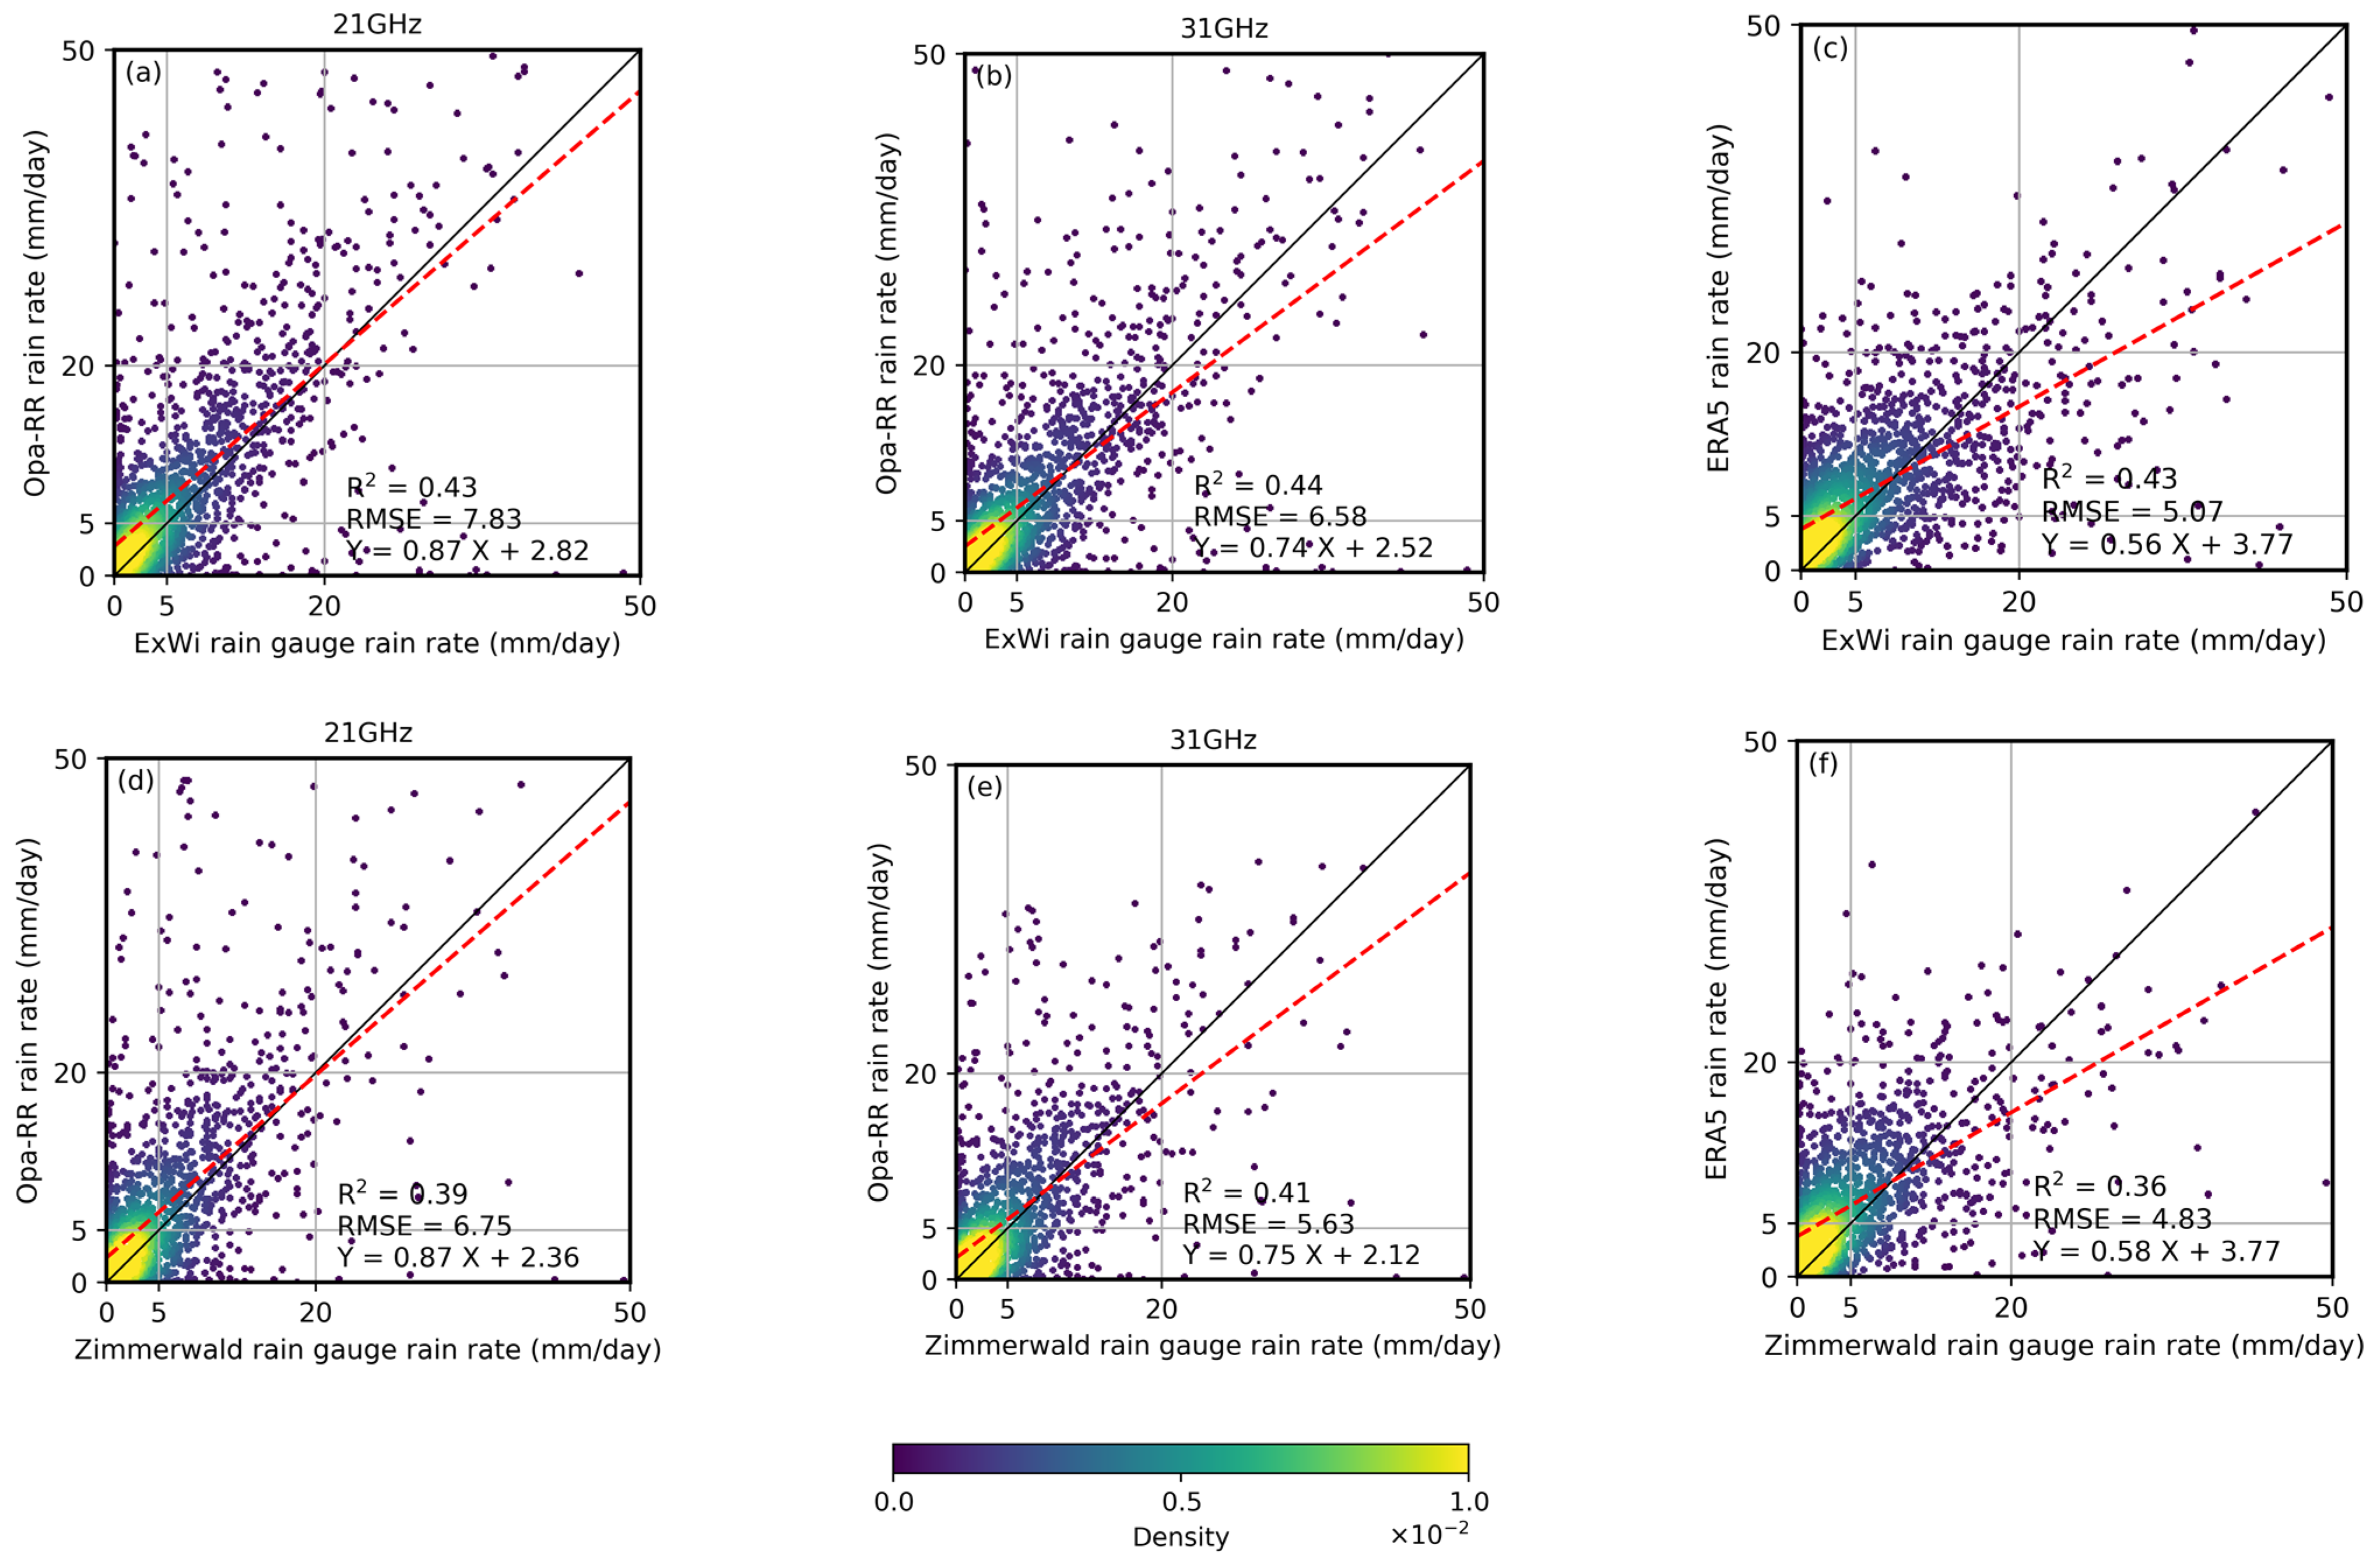
4.1. Daily Rain-Rate Estimation

Figure 3 shows six rain events that each lasted less than one day representing heavy (Figure 3a,d), moderate (Figure 3b,e), and light rain (Figure 3c,f), respectively, and the stratiform rain events (Figure 3g) with the rain rate less than 10 m/h that lasted for 8 days. As it can be observed from Figure 3, in these rain events, the cumulative rain curve of Opa-RR at 21 GHz is higher than that of at 31 GHz. From the beginning and end of the rain period, the changing trends of estimated value curves and observed value curves over time are the same. For example, Figure 3d shows a heavy rain event on 31 May 2007. There was no rain before 3:20 UT, and the value of accumulated rain was 0, then it drizzled for a few minutes when the zenith opacity changed slightly. The zenith opacity reached a very high value at 16:40 UT, and the cumulative rain increased rapidly. After 30 min, the cumulative rain curves showed a certain slope change over time, and the rain decreased slightly. The accumulated rain climbed above 35 mm in a time interval of 7 h. In addition, as shown in Figure 3g, there are mainly light rain events from the third day to the fifth day, and the other times are moderate rain or heavy rain events. The correlation between the estimated moderate and heavy rain and observed values is better than that in light rain. Opa-RR at 21 GHz is more related to the ExWi optical rain sensor, and Opa-RR at 31 GHz is more consistent with the ExWi rain gauge.
Figure 4 shows the verification scatter plots of the daily rain rate estimated by Opa-RR, and the comparison between ERA5 and rain gauges. As can be observed from Figure 4, the Opa-RR estimate of the 31 GHz channel achieves slightly better performance than the 21 GHz channel, compared with the ExWi rain gauge (the Zimmerwald rain gauge), with R 2 and RMSE verifications are 0.44 (0.41) and 6.58 (5.63) mm/day, respectively. R2 and RMSE verifications of the Opa-RR estimation at 21 GHz are 0.43 (0.39) and 7.83 (6.75) mm/day, respectively. This is not surprising because the sensor at 31 GHz is less sensitive to water vapor than at 21 GHz [12].
Another finding worth noting in Figure 4 is that the daily rain rate using Opa-RR is significantly lower than rain gauges when rain rates are between 20 mm/day and 50 mm/day (heavy rain), since the linear regression fit line is located below the x = y line. Table 2 gives the biases of daily rain rates for different daily rainfall intensities, except for the 21 GHz channel, the daily rain rate bias of heavy rains estimated by Opa-RR is all negative. This means that the proposed Opa-RR physical algorithm tends to underestimate during heavy rains, which affects Opa-RR’s performance in estimating the daily rain rate to a certain extent. The main reason for the heavy rain underestimation may be that (1) due to its small scale and spatial complexity, heavy rain has an extreme variability of precipitation in a short period of time, and it is usually difficult to accurately capture. Decreasing the threshold ILW R increases the estimated amount of rain, but it will also extend the rainfall period. Note that it is more effective to adapt the temperature lapse rate. (2) During heavy rains, the brightness temperature tends to be saturated at higher frequencies such as the 31 GHz channel [3,37,38,39], thus underestimating rain. (3) The model requires that the rain fill in the antenna’s field of view is fairly homogeneous, this means the rain zenith opacity will lead to underestimation if there is any inhomogeneity [10].
In moderate rain (5 mm/day to 20 mm/day), Figure 4 shows that the daily rain rate estimated by Opa-RR at 31GHz works well, and the linear regression fit line almost coincides with the x = y line. Their biases are all less than 0.61 mm/day (Table 2). However, during light rains, the daily rain rate using Opa-RR is higher than the rain gauges, since the mean value curve in the range of 0 mm/day to 5 mm/day is located above the x = y line. The bias of light rains is all positive (Table 2). The possible explanations for the light rain overestimation include (1) the tipping bucket rain gauge underestimated light rain due to the limitations of the instrument’s working principle. (2) Virga is precipitation that evaporates or sublimates before it reaches the ground, which is a likely explanation for the discrepancy during light rain. In addition, the total biases between Opa-RR estimation at 31 GHz and rain gauges show a small bias on the daily scale.
It can be seen that the daily rain rate estimated by Opa-RR shows a better correlation with the rain gauges than that of ERA5, especially at 31 GHz. Except for the RMSE, Opa-RR estimations show a significant advantage over ERA5 for all verification factors (R2, the bias, the intercept, and the slope). The slope of the linear fitting line of ERA5 scattered points is only about 0.58 at most. Moreover, the correlation between ERA5 and rain gauges is weaker and unstable, because the comparison results between ERA5 and different rain gauges report a larger drop (from 0.43 to 0.36 for R2) than Opa-RR.

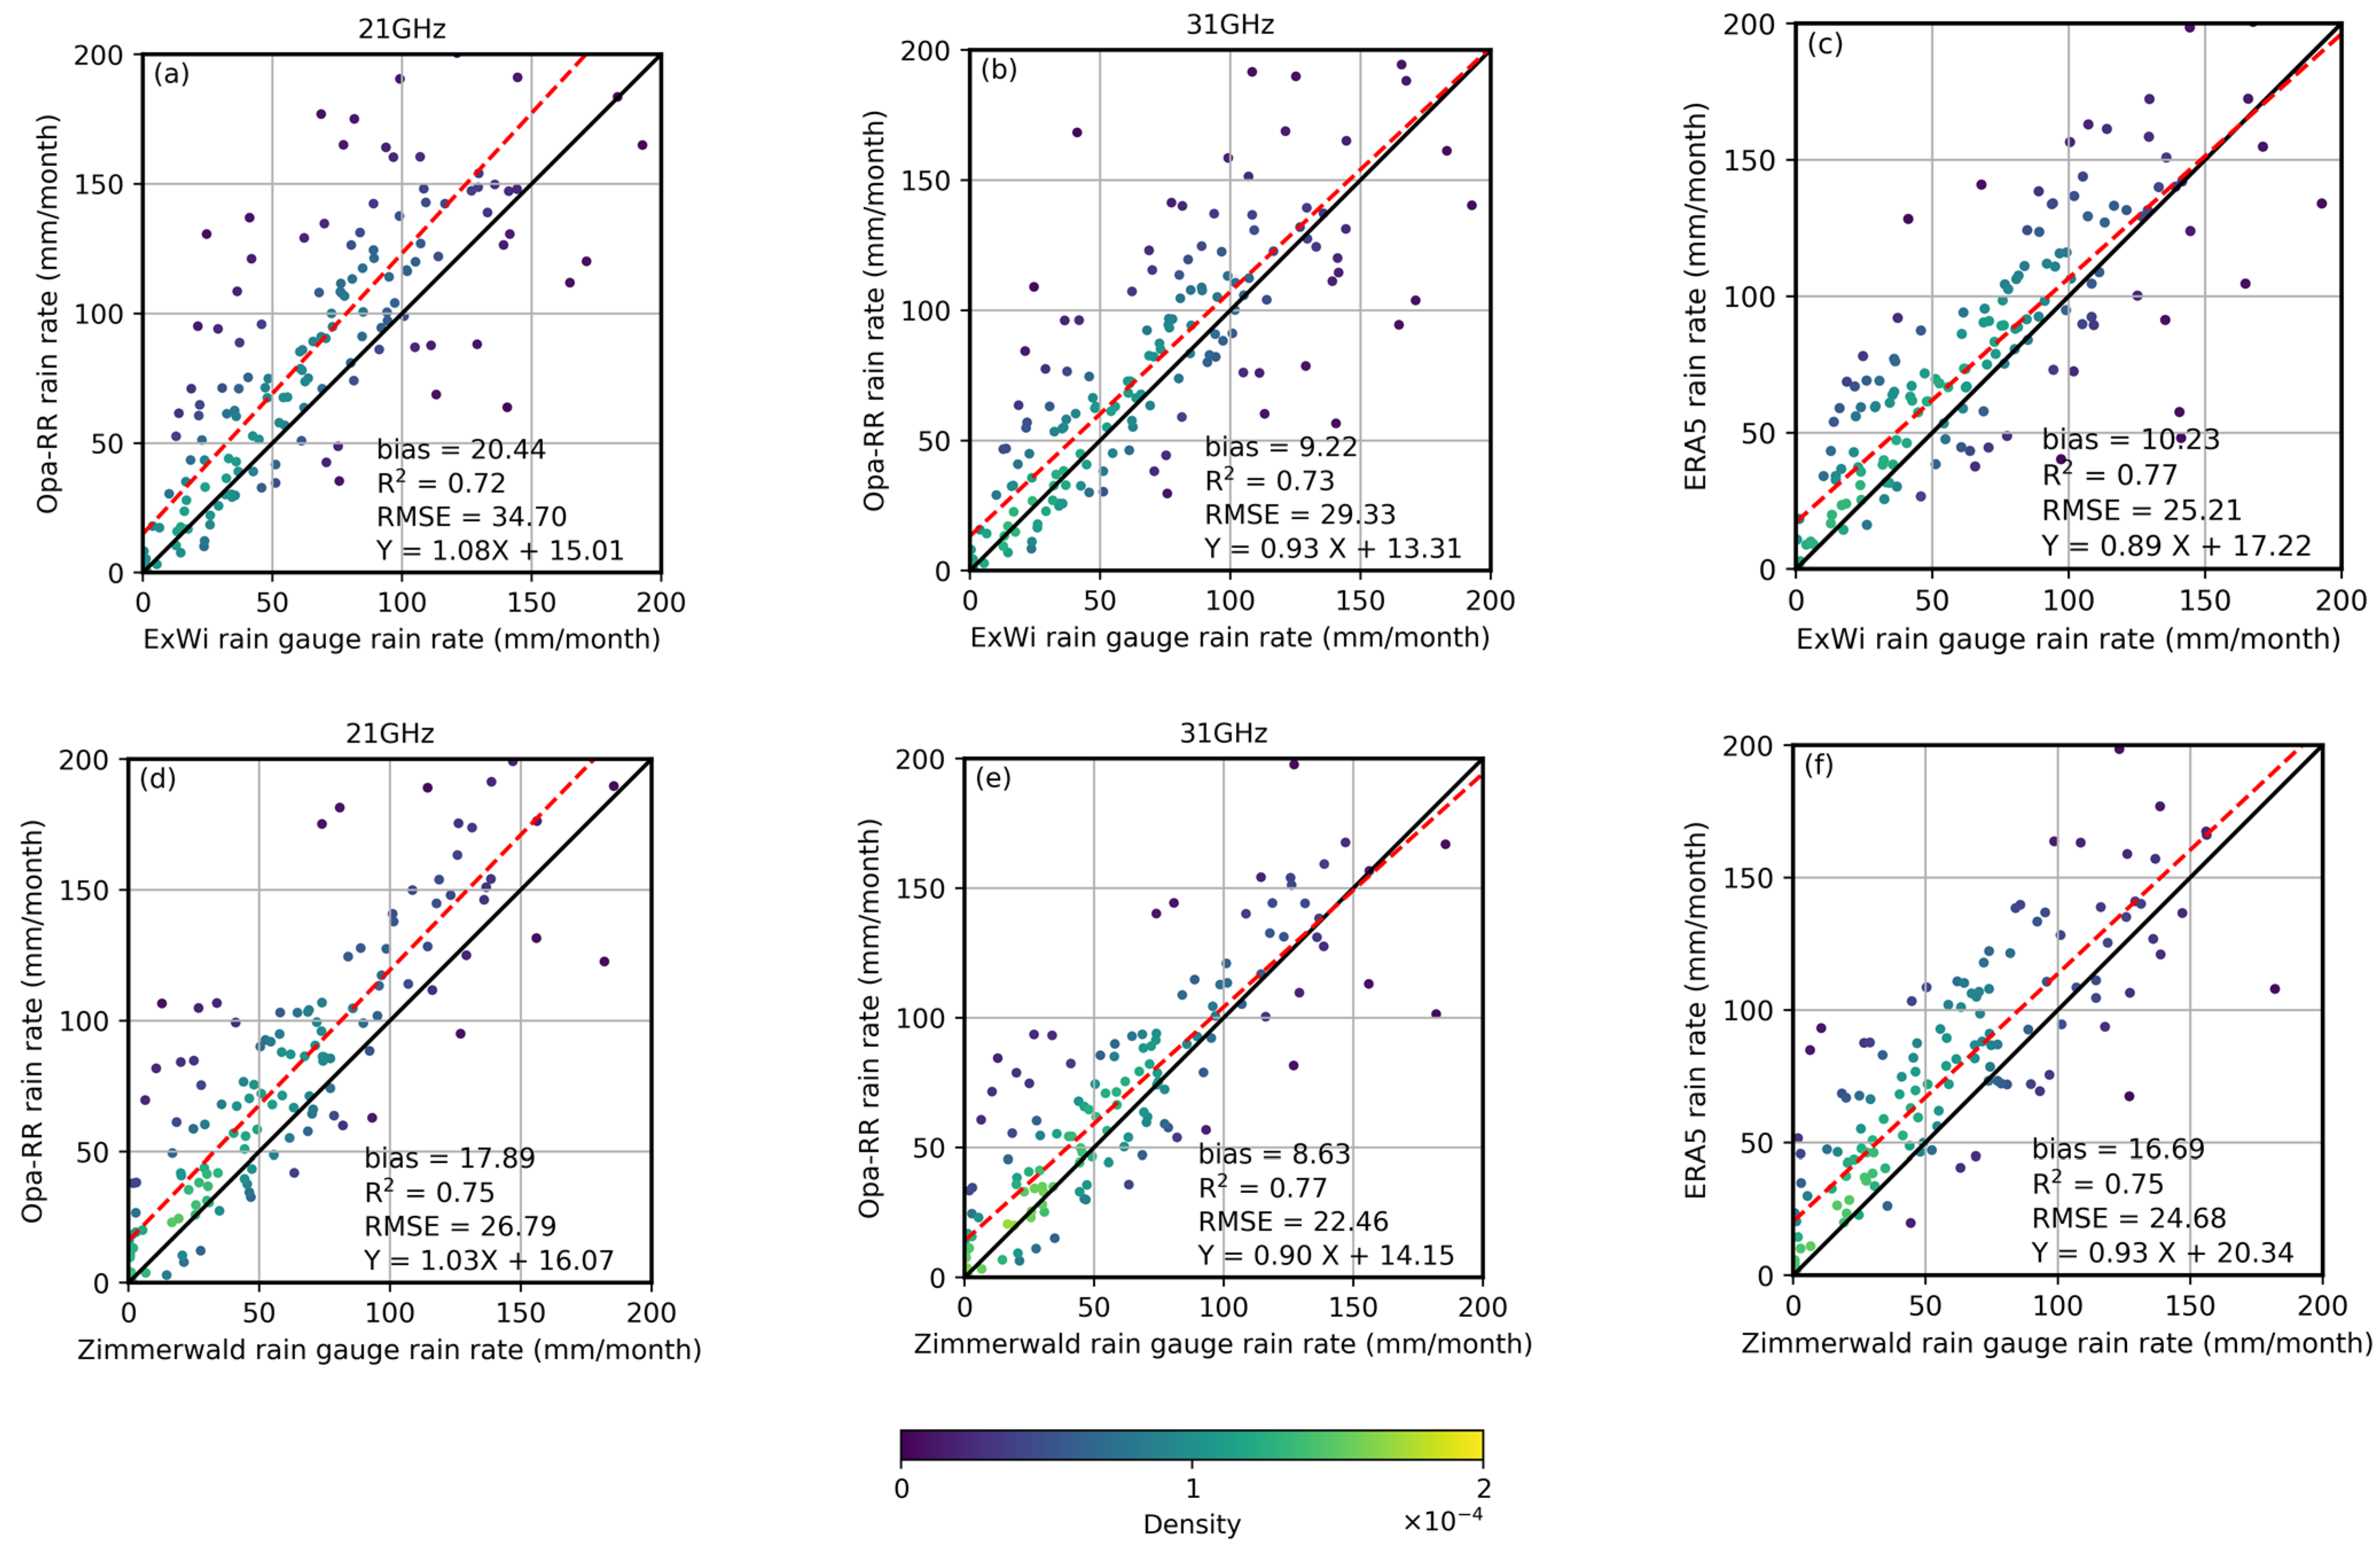
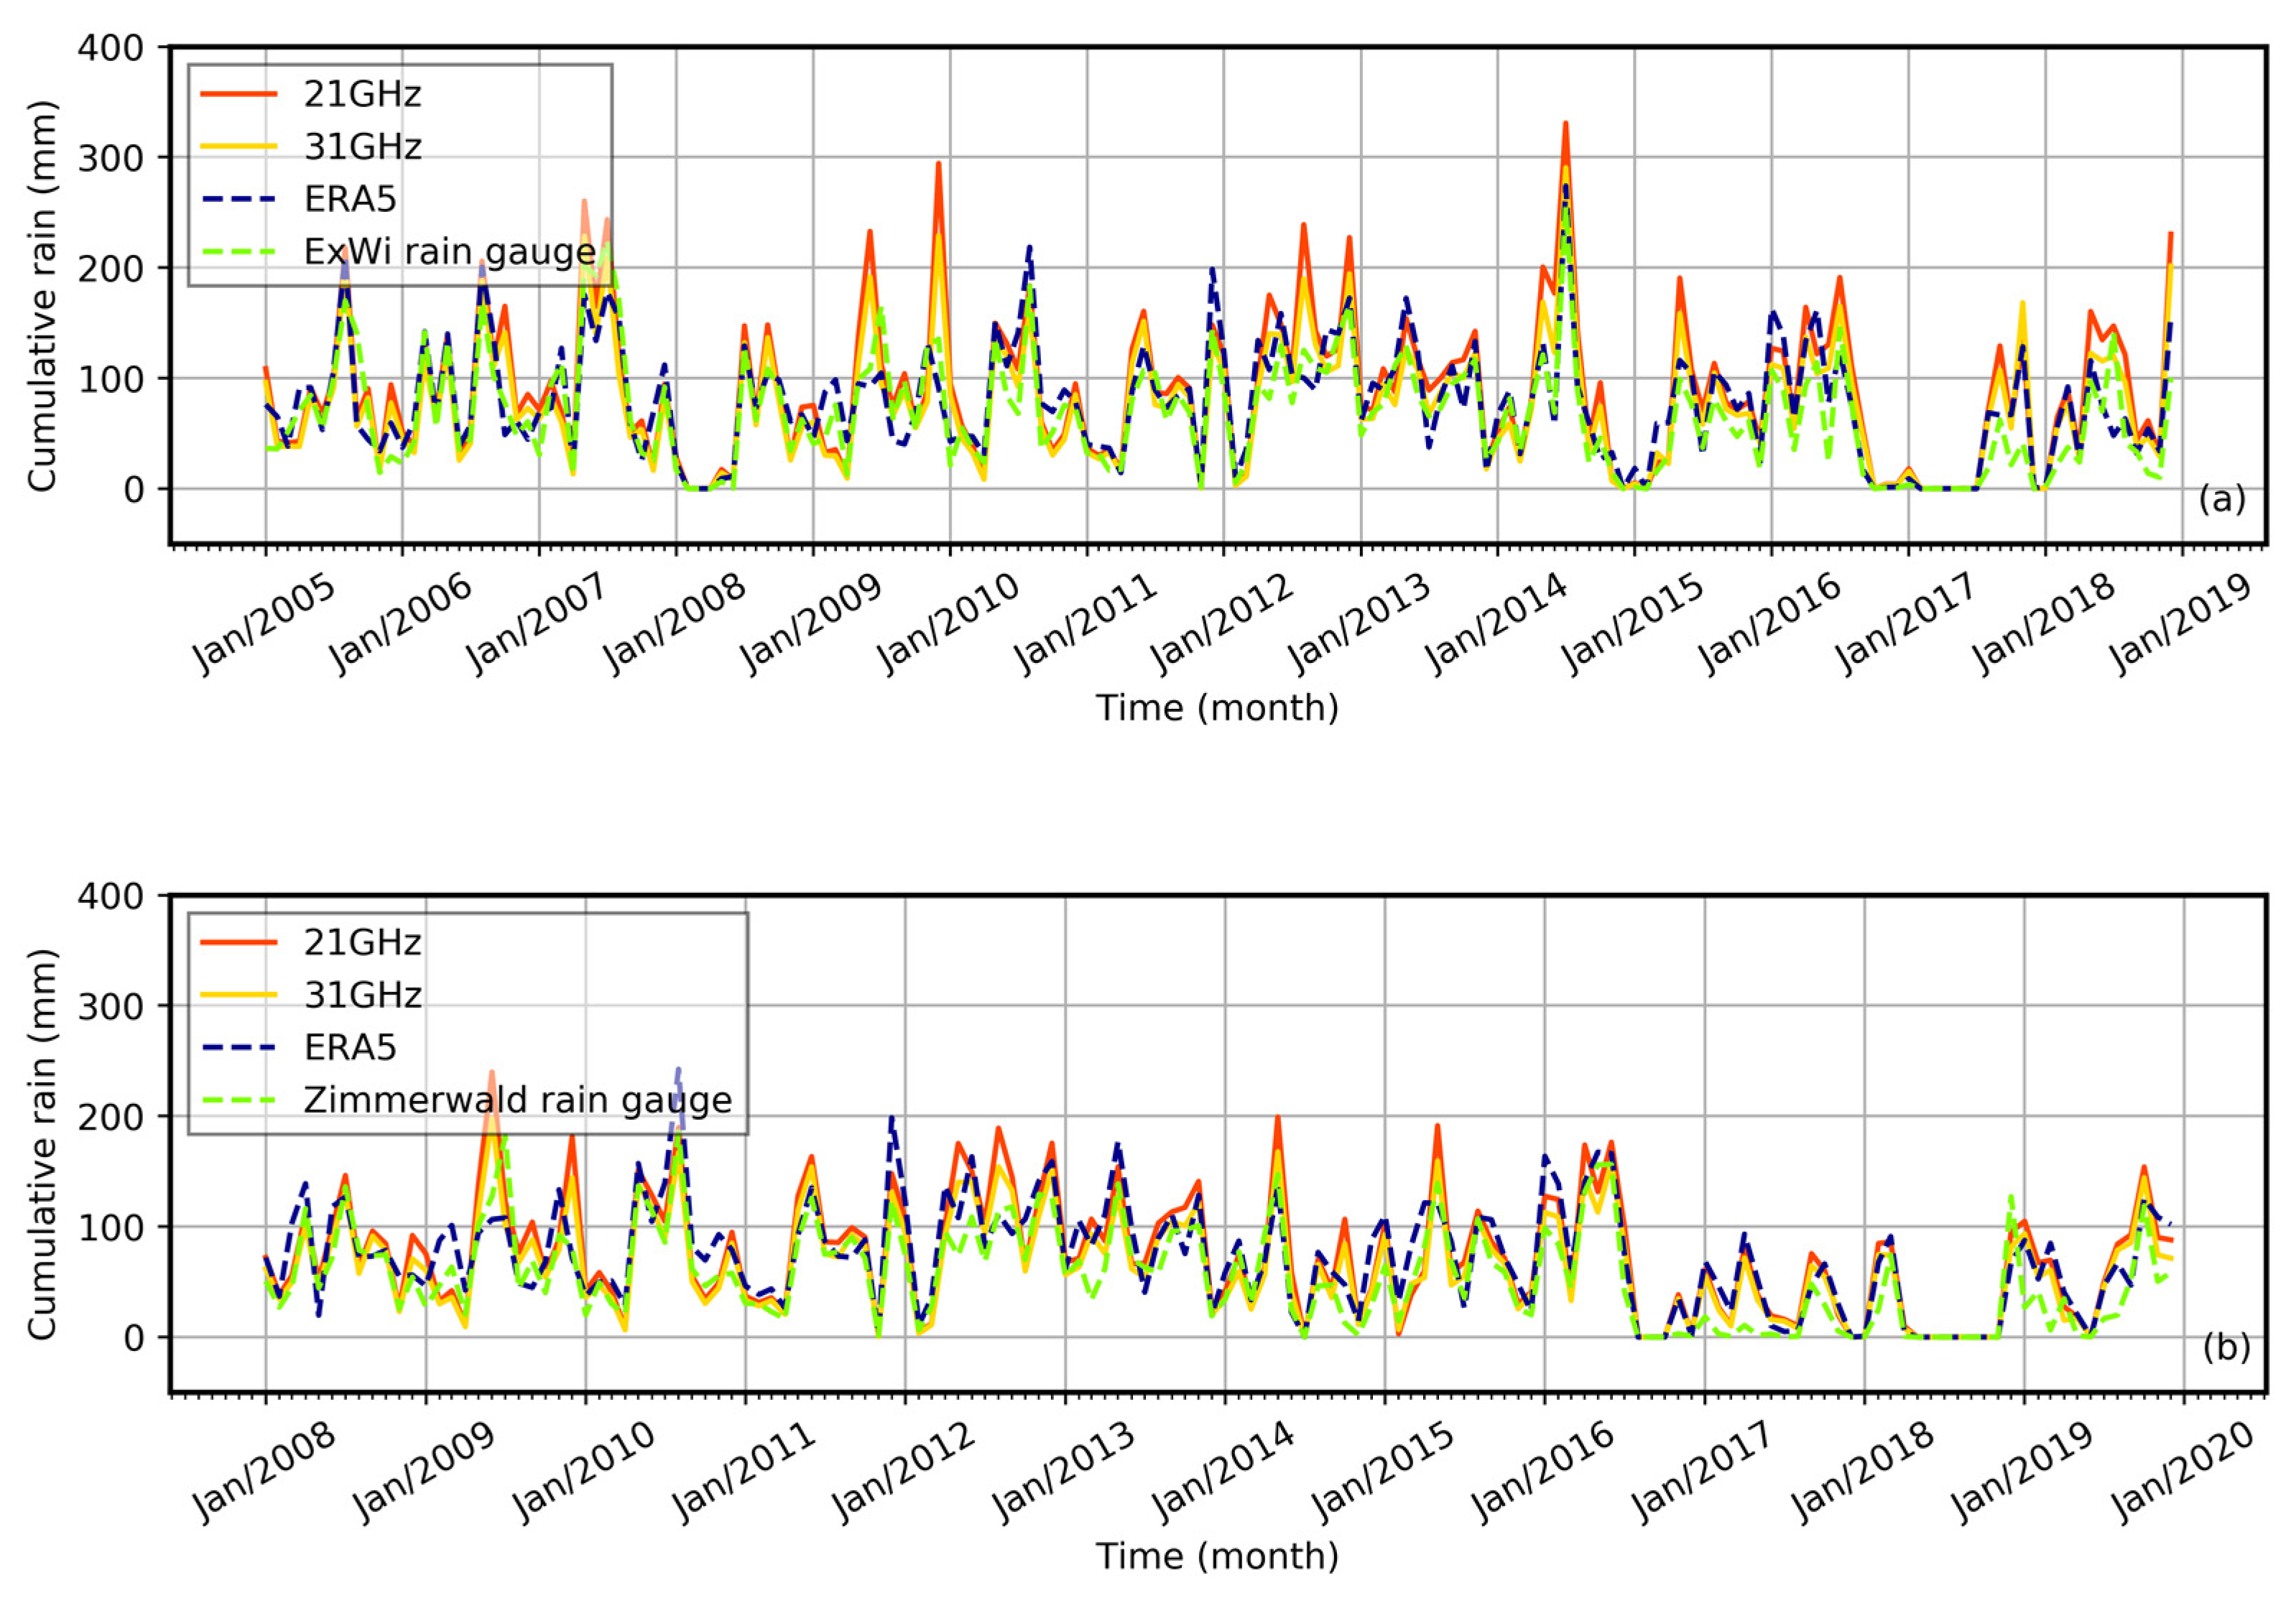
4.2. Monthly Rain-Rate Estimation

Figure 5 shows the verification scatter plots of the monthly rain rate estimated by Opa-RR, and the comparison between ERA5 and rain gauges. As can be observed from Figure 5, the Opa-RR estimate of the 31 GHz channel achieves slightly better performance than the 21 GHz channel, compared with the ExWi rain gauge (the Zimmerwald rain gauge), with R2 and RMSE verifications are 0.73 (0.77) and 29.33 (22.46) mm/month, respectively. R2 and RMSE verifications of the Opa-RR estimation at 21 GHz are 0.72 (0.75) and 34.70 (26.79) mm/month, respectively. The monthly estimate of Opa-RR is slightly overestimated because all the biases are positive. It can be seen that, except for R2 and RMSE compared with ExWi rain gauge, Opa-RR at 31 GHz estimation shows some advantages over ERA5 for all verification factors (R2, RMSE, the bias, the intercept, and the slope) compared with rain gauges.
Figure 6 shows the monthly time series comparison of rain rates estimated by Opa-RR, measured by the rain gauges, and provided by ERA5 reanalysis in Bern. As it can be observed from Figure 6, the Opa-RR estimation is very close to the observations, and we see a similar fluctuation trend, except for the overestimated rain in July 2007, May and November 2009, June 2015. The observation data of the rain gauge indicated that some extreme rainstorms occurred in these months, with the rain rate greater than 50 mm/10 min. In addition, the monthly rain rate estimated by Opa-RR can well detect that Bern has more rainfall in summer and less rainfall in winter [40]. For example, during the winter of 2010/2011 (December through February), the ExWi (Zimmerwald) rain gauge reported 137.20 (118.20) mm of precipitation, as well as Opa-RR at 21 GHz and 31 GHz estimated 161.47 (163.19) and 144.75 (146.35) mm of precipitation, respectively. During the summer of 2011 (June through August), the ExWi (Zimmerwald) rain gauge reported 273.60 (277.80) mm of precipitation, as well as Opa-RR at 21 GHz and 31 GHz estimated 333.56 (334.97) and 300.25 (301.70) mm of precipitation, respectively. Furthermore, there is a large amount of missing data. For example, the cumulative rain reaches around 300 mm in July 2014 in Figure 6a, while in Figure 6b this value is 0 mm. It is also obvious that the missing data exist in 2008 and 2017 in Figure 6a and from 2016 to 2019 in Figure 6b. However, although Figure 6a,b use rain gauges at different locations and not exactly the same rain events, their monthly rain rate trends for many years are almost the same, such as from 2009 to 2013. The behavior of ERA5 and Opa-RR is almost similar, slightly overestimating the cumulative rain for most months. However, the difference is that ERA5 is underestimated in some months with more precipitation, such as from May to July 2007 in Figure 6a and July 2009 in both Figure 6a,b.

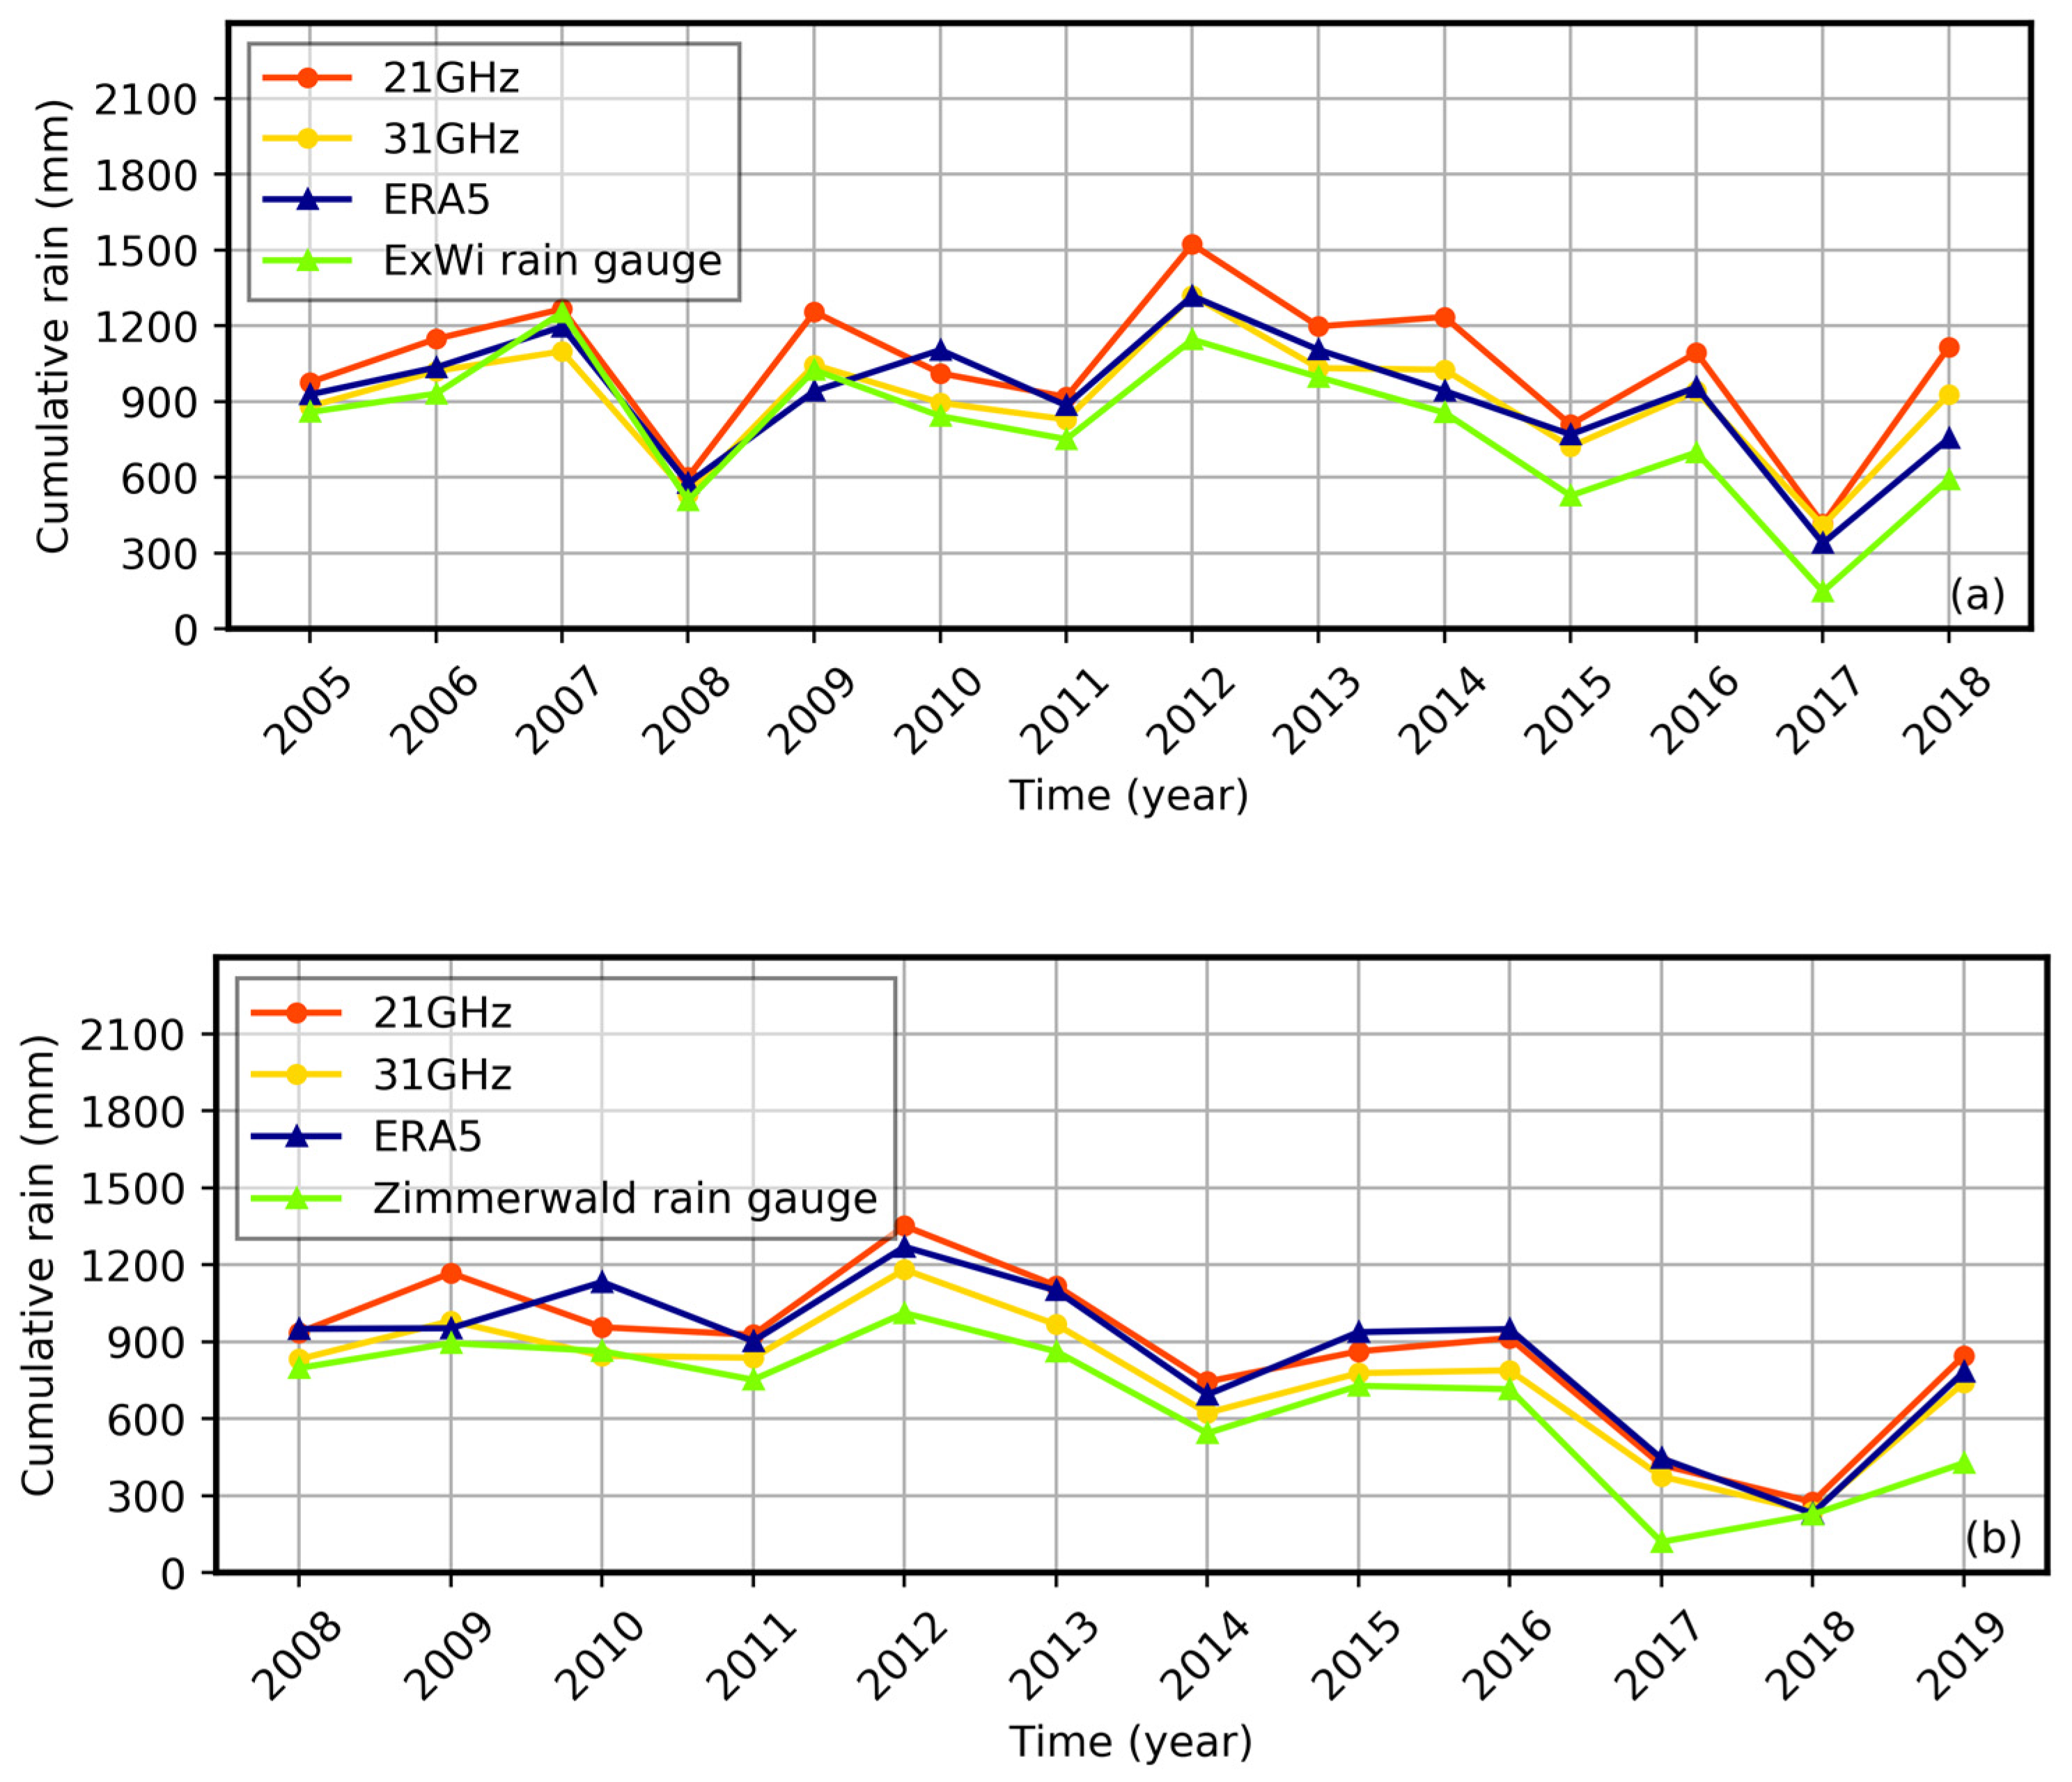
4.3. Annual Rain-Rate Estimation

Figure 7 shows the annual time series comparison of rain rates estimated by Opa-RR, measured by the rain gauges, and provided by ERA5 reanalysis in Bern. As it can be observed from Figure 7, the curve of annual rain rate estimated by Opa-RR and the situ observations show a similar temporal variation and trend. For example, in Figure 7a, these four curves all show the lowest annual rainfall in 2008 and 2017, and in 2012 they are relatively high. Furthermore, the Opa-RR estimation has a good correlation with the rain gauges. From 2005 to 2014 in Figure 7a and from 2008 to 2016 in Figure 7b, the curve of Opa-RR at 31 GHz almost coincides with the rain gauge, but at 21 GHz has an overestimation. From 2015 to 2018 in Figure 7a and in 2017 and 2019 in Figure 7b, compared with the rain gauge, the performance of Opa-RR in estimating annual rain rates is not outstanding. This may be because the tipping bucket rain gauge underestimated annual rain rates or had instrumental errors. The behavior of Opa-RR and ERA5 is almost similar with slight overestimation in comparison with in situ observations, while Opa-RR at 31GHz achieves a better agreement than ERA5 in 2009 and 2010.

5. Conclusions

Benefitting from a new physical retrieval method, based on the ground-based microwave radiometer, this article used the rain zenith opacity derived from TROWARA to estimate the rain rate in Bern over a long-time interval from 2005 to 2019. The assumption of homogeneous radiation beam filling established the relationship between rainfall rate and zenith opacity. To calculate the rain zenith opacity, this retrieval method constructed an additional layer through the non-rainy radiative transfer model to describe the contribution of rain to radiation. The rain-rate estimation was tested by the time series of accumulated rain (day, month, year), and the performance of this method in different rain intensities (light, medium, and heavy) was evaluated. Compared with the measurements from the ExWi rain gauge and Zimmerwald rain gauge, there is fairly good agreement between estimations and observations. Compared with ERA5, it is found that the rain rate estimated by Opa-RR at 31GHz obtains slightly better results, especially the daily rain rates (Figure 4 and Table 2).
Using zenith opacity to directly estimate the rain rate performs well in detecting daily moderate rain. However, heavy rain is underestimated, which might be due to its spatial complexity, the brightness temperature saturation at high frequencies, and the difficulty of the antenna beam to be absolutely homogeneous. Light rain is overestimated, probably because the temperature lapse rate will be affected by the weather, and the iteration for the zenith opacity is the positive correction. Moreover, ground-based radiation measurements at 21.4 and 31.5 GHz were used for experimental testing of retrieval algorithms and proved that the microwave frequency of 31 GHz has superior rain rate retrieval capabilities due to its lower sensitivity to water vapor. At the monthly timescale, Opa-RR 31 GHz precipitation estimates are very close to the Zimmerwald rain gauge, a high R2 value reaches 0.77 and a low RMSE value is 22.46 mm/month. The figures for the daily rain rate are slightly lower, but they are stable no matter which of these two rain gauges are compared, the R2 value is 0.39 to 0.44, and the RMSE value is 5.63 to 7.83 mm/day.
Ground-based microwave estimation of rain rate with high temporal resolution and high sensitivity to ground rainfall has the potential to provide important support for fine rainfall forecasting and disaster risk reduction. The high temporal resolution of ground-based microwave radiometry is expected to reveal short-term processes of convective rainfall events and atmospheric phenomena, such as virga, which are not accessible by rain gauges. Furthermore, ground-based microwave radiometry is a new, independent data source for rain rate measurement. This article is important not only for understanding the physical mechanism of rain rate inversion and analyzing the variation of rainfall accumulation over time, but also for enriching the research of ground-based microwave radiometry for atmospheric environment remote sensing and promoting the further development of the rain-rate estimation research.

Author Contributions

Conceptualization, W.W. and K.H.; methodology, W.W., K.H. and C.M.; software, W.W., K.H. and C.M.; validation, W.W.; formal analysis, W.W.; investigation, W.W.; resources, K.H.; data curation, W.W.; writing—original draft preparation, W.W.; writing—review and editing, W.W., K.H. and C.M.; supervision, K.H.; project administration, K.H.; funding acquisition, K.H. All authors have read and agreed to the published version of the manuscript.

Funding

The APC was funded by GCOS (Global Climate Observing System) Switzerland.

Data Availability Statement

High-resolution IWV and ILW data of TROWARA are available upon request. Data of the ExWi and Zimmerwald weather stations are provided by the STARTWAVE database at http://www.iapmw.unibe.ch/research/projects/STARTWAVE/database/ (accessed on 3 June 2021). ERA5 data can be downloaded from https://doi.org/10.24381/cds.bd0915c6 (accessed on 3 June 2021).

Acknowledgments

We thank all the engineers and scientists at the University of Bern IAP for the design, construction, and operation of the TROWARA. The study is funded by a Fellowship Grant from the China Scholarship Council (CSC). The study contributes to a rain-rate monitoring project in the framework of GCOS Switzerland.

Conflicts of Interest

The authors declare no conflict of interest.

References

  1. Orlandi, A.; Ortolani, A.; Meneguzzo, F.; Levizzani, V.; Torricella, F.; Turk, F.J. Rainfall assimilation in RAMS by means of the Kuo parameterisation inversion: Method and preliminary results. J. Hydrol. 2004, 288, 20–35. [Google Scholar] [CrossRef]
  2. Wang, J.; Xu, Y.; Yang, L.; Wang, Q.; Yuan, J.; Wang, Y. Data assimilation of high-resolution satellite rainfall product improves rainfall simulation associated with landfalling tropical cyclones in the Yangtze river Delta. Remote Sens. 2020, 12, 276. [Google Scholar] [CrossRef] [Green Version]
  3. Marzano, F.S.; Fionda, E.; Ciotti, P.; Martellucci, A. Ground-based multifrequency microwave radiometry for rainfall remote sensing. IEEE Trans. Geosci. Remote Sens. 2002, 40, 742–759. [Google Scholar] [CrossRef]
  4. Cadeddu, M.P.; Ghate, V.P.; Mech, M. Ground-based observations of cloud and drizzle liquid water path in stratocumulus clouds. Atmos. Meas. Tech. 2020, 13, 1485–1499. [Google Scholar] [CrossRef] [Green Version]
  5. Cadeddu, M.P.; Marchand, R.; Orlandi, E.; Turner, D.D.; Mech, M. Microwave passive ground-based retrievals of cloud and rain liquid water path in drizzling clouds: Challenges and possibilities. IEEE Trans. Geosci. Remote Sens. 2017, 55, 6468–6481. [Google Scholar] [CrossRef]
  6. Battaglia, A.; Saavedra, P.; Rose, T.; Simmer, C. Characterization of precipitating clouds by ground-based measurements with the triple-frequency polarized microwave radiometer ADMIRARI. J. Appl. Meteorol. Climatol. 2010, 49, 394–414. [Google Scholar] [CrossRef] [Green Version]
  7. Marzano, F.S.; Cimini, D.; Ware, R. Monitoring of rainfall by ground-based passive microwave systems: Models, measurements and applications. Adv. Geosci. 2005, 2, 259–265. [Google Scholar] [CrossRef] [Green Version]
  8. Won, H.Y.; Kim, Y.-H.; Lee, H.-S. An application of brightness temperature received from a ground-based microwave radiometer to estimation of precipitation occurrences and rainfall Intensity. Asia-Pac. J. Atmos. Sci. 2009, 45, 55–69. [Google Scholar]
  9. Xu, G.; Ware, R.; Zhang, W.; Feng, G.; Liao, K.; Liu, Y. Effect of off-zenith observations on reducing the impact of precipitation on ground-based microwave radiometer measurement accuracy. Atmos. Res. 2014, 140–141, 85–94. [Google Scholar] [CrossRef]
  10. Mätzler, C.; Morland, J. Advances in Surface-Based Radiometry of Atmospheric Water; IAP Research Report 2008-02-MW; Institut für Angewandte Physik, Universität Bern: Bern, Switzerland, 2014. [Google Scholar]
  11. Hocke, K.; Navas-Guzmán, F.; Moreira, L.; Bernet, L.; Mätzler, C. Diurnal cycle in atmospheric water over switzerland. Remote Sens. 2017, 9, 909. [Google Scholar] [CrossRef] [Green Version]
  12. Hocke, K.; Bernet, L.A.L.; Hagen, J.; Murk, A.; Renker, M.; Mätzler, C. Diurnal cycle of short-term fluctuations of integrated water vapour above Switzerland. Atmos. Chem. Phys. 2019, 19, 12083–12090. [Google Scholar] [CrossRef] [Green Version]
  13. Ingold, T.; Peter, R.; Kämpfer, N. Weighted mean tropospheric temperature and transmittance determination at millimeter-wave frequencies for ground-based applications. Radio Sci. 1998, 33, 905–918. [Google Scholar] [CrossRef]
  14. Mätzler, C.; Morland, J. Refined physical retrieval of integrated water vapor and cloud liquid for microwave radiometer data. IEEE Trans. Geosci. Remote Sens. 2009, 47, 1585–1594. [Google Scholar] [CrossRef]
  15. Ellison, W. Dielectric properties of natural media. In Thermal Microwave Radiation: Applications for Remote Sensing; Mätzler, C., Ed.; IET Electromagnetic Waves Series: London, UK, 2006; Volume 52, pp. 431–454. [Google Scholar]
  16. Peter, R.; Kämpfer, N. Radiometric determination of water vapor and liquid water and its validation with other techniques. J. Geophys. Res. Atmos. 1992, 97, 18173–18183. [Google Scholar] [CrossRef]
  17. Morland, J. TROWARA–Tropospheric Water Vapour Radiometer: Radiometer Review and New Calibration Model; IAP Research Report 2002-15; Institut für Angewandte Physik, Universität Bern: Bern, Switzerland, 2002. [Google Scholar]
  18. Marzano, F.S.; Cimini, D.; Ciotti, P.; Ware, R. Modeling and measurement of rainfall by ground-based multispectral microwave radiometry. IEEE Trans. Geosci. Remote Sens. 2005, 43, 1000–1011. [Google Scholar] [CrossRef]
  19. Rosenkranz, P.W. Water vapor microwave continuum absorption: A comparison of measurements and models. Radio Sci. 1998, 33, 919–928. [Google Scholar] [CrossRef]
  20. Hwang, S.H.; Kim, K.B.; Han, D. Comparison of methods to estimate areal means of short duration rainfalls in small catchments, using rain gauge and radar data. J. Hydrol. 2020, 588, 125084. [Google Scholar] [CrossRef]
  21. Yilmaz, K.K.; Hogue, T.S.; Hsu, K.-L.; Sorooshian, S.; Gupta, H.V.; Wagener, T. Intercomparison of rain gauge, radar, and satellite-based precipitation estimates with emphasis on hydrologic forecasting. J. Hydrometeorol. 2005, 6, 497–517. [Google Scholar] [CrossRef]
  22. Donald Ahrens, C.; Henson, R. Meteorology Today: An Introduction to Weather, Climate and the Environment, 9th ed.; Cengage Learning: Belmont, CA, USA, 2009; pp. 164–181. [Google Scholar]
  23. Zscheischler, J.; Naveau, P.; Martius, O.; Engelke, S.; Raible, C.C. Evaluating the dependence structure of compound precipitation and wind speed extremes. Earth Syst. Dynam. 2021, 12, 1–16. [Google Scholar] [CrossRef]
  24. Hersbach, H.; De Rosnay, P.; Bell, B.; Schepers, D.; Simmons, A.; Soci, C.; Abdalla, S.; Balmaseda, A.; Balsamo, G.; Bechtold, P.; et al. Operational Global Reanalysis: Progress, Future Directions and Synergies with NWP, ERA Report Series 27; European Centre for Medium RangeWeather Forecasts: Reading, UK, 2018. [Google Scholar] [CrossRef]
  25. Hersbach, H.; Bell, B.; Berrisford, P.; Horányi, A.; Sabater, J.M.; Nicolas, J.; Radu, R.; Schepers, D.; Simmons, A.; Soci, C. Global reanalysis: Goodbye ERA-Interim, hello ERA5. ECMWF Newsl. 2019, 159, 17–24. [Google Scholar] [CrossRef]
  26. Xu, X.; Frey, S.K.; Boluwade, A.; Erler, A.R.; Khader, O.; Lapen, D.R.; Sudicky, E. Evaluation of variability among different precipitation products in the Northern Great Plains. J. Hydrol. Reg. Stud. 2019, 24, 100608. [Google Scholar] [CrossRef]
  27. Nogueira, M. Inter-comparison of ERA-5, ERA-interim and GPCP rainfall over the last 40 years: Process-based analysis of systematic and random differences. J. Hydrol. 2020, 583, 124632. [Google Scholar] [CrossRef]
  28. Amjad, M.; Yilmaz, M.T.; Yucel, I.; Yilmaz, K.K. Performance evaluation of satellite- and model-based precipitation products over varying climate and complex topography. J. Hydrol. 2020, 584, 124707. [Google Scholar] [CrossRef]
  29. Mätzler, C.; Martin, L. Effects of Rain on Propagation, Absorption and Scattering of Microwave Radiation Based on the Dielectric Model of Liebe; IAP Research Report 2002-10-MW; Institut für Angewandte Physik, Universität Bern: Bern, Switzerland, 2002. [Google Scholar]
  30. Leuenberger, A. Precipitation Measurements with Microwave Sensors. Master’s Thesis, Philosophisch-Naturwissenschaftliche Fakultät, Universität Bern, Bern, Switzerland, 2009. [Google Scholar]
  31. Mätzler, C.; Melsheimer, C. Radiative transfer and microwave radiometry. In Thermal Microwave Radiation: Applications for Remote Sensing; Mätzler, C., Ed.; IET Electromagnetic Waves Series: London, UK, 2006; Volume 52, pp. 1–23. [Google Scholar]
  32. Mätzler, C. Ground-based observations of atmospheric radiation at 5, 10, 21, 35, and 94 GHz. Radio Sci. 1992, 27, 403–415. [Google Scholar] [CrossRef]
  33. Petty, G.W. Physical retrievals of over-ocean rain rate from multichannel microwave imagery. Part I: Theoretical characteristics of normalized polarization and scattering indices. Meteorl. Atmos. Phys. 1994, 54, 79–99. [Google Scholar] [CrossRef]
  34. Latupapua, H.; Latupapua, A.I.; Wahab, A.; Alaydrus, M. Wireless sensor network design for earthquake’s and landslide’s early warnings. Indones. J. Electr. Eng. Comput. Sci. 2018, 11, 437–445. [Google Scholar] [CrossRef]
  35. Mätzler, C. Drop-Size Distributions and Mie Computations for Rain; IAP Research Report 2002-16-MW; Institut für Angewandte Physik, Universität Bern: Bern, Switzerland, 2002. [Google Scholar]
  36. Cossu, F.; Hocke, K.; Martynov, A.; Martius, O.; Mätzler, C. Atmospheric water parameters measured by a ground-based microwave radiometer and compared with the WRF model. Atmos. Sci. Lett. 2015, 16, 465–472. [Google Scholar] [CrossRef] [Green Version]
  37. Marzano, F.S.; Fionda, E.; Ciotti, P. Neural-network approach to ground-based passive microwave estimation of precipitation intensity and extinction. J. Hydrol. 2006, 328, 121–131. [Google Scholar] [CrossRef]
  38. Battaglia, A.; Saavedra, P.; Simmer, C.; Rose, T. Rain observations by a multifrequency dual-polarized radiometer. IEEE Geosci. Remote. Sens. Lett. 2009, 6, 354–358. [Google Scholar] [CrossRef]
  39. Zhang, W.; Xu, G.; Xi, B.; Ren, J.; Wan, X.; Zhou, L.; Cui, C.; Wu, D. Comparative study of cloud liquid water and rain liquid water obtained from microwave radiometer and micro rain radar observations over central China during the monsoon. J. Geophys. Res. Atmos. 2020, 125, e2020JD032456. [Google Scholar] [CrossRef]
  40. Climate Normals Bern/Zollikofen (Reference Period. 1981−2010); Zurich-Airport; Swiss Federal Office of Metreology and Climatology, MeteoSwiss: Zurich, Switzerland, 2014.
Figure 1. An example of the total zenith opacity (red), the non-rain zenith opacity (blue), and the ExWi rain gauge cumulative rain (green) versus time from 20 December 2019 to 25 December 2019. (a)The total zenith opacity measured by TROWARA at 21 GHz. (b) The total zenith opacity measured by TROWARA at 31 GHz.
Remotesensing 13 02217 g001
Figure 2. Radiative transfer process of the ground-based microwave radiometer. (a) The radiative transfer process during the non-rainfall period. (b) The radiative transfer process of the assumed additional layer during the rainfall period.
Remotesensing 13 02217 g002
Figure 3. Examples of cumulative rain versus time for Opa-RR at 21 GHz (solid red), at 31 GHz (dashed blue), the ExWi rain gauge (solid green), the ExWi optical rain sensor (dashed green). The black and grey lines are the total zenith opacity and the non-rain zenith opacity, respectively. (a) heavy rain on 05 May 2007; (b) moderate rain on 15 April 2006; (c) light rain on 7 January 2007; (d) heavy rain on 31 May 2007; (e) moderate rain on 4 December 2006; (f) light rain on 15 February 2007; (g) 8-day stratiform rain from 24 February 2007 to 3 March 2007.
Remotesensing 13 02217 g003aRemotesensing 13 02217 g003b
Figure 4. Scatter plots of daily rain rates estimated by Opa-RR and provided by ERA5 versus measured by the ExWi rain gauge over the period 2005 to 2018 (ac) and the Zimmerwald rain gauge over the period 2008 to 2019 (df) in Bern. The solid black line shows the x = y line, and the red dashed line shows the linear regression fit line. The color shows the density of the data distribution calculated by Gaussian kernels.
Remotesensing 13 02217 g004
Figure 5. Same as in Figure 4, but with regard to the monthly rain rate in Bern.
Remotesensing 13 02217 g005
Figure 6. Monthly time series of the rain rate for Opa-RR at 21 GHz (solid red), at 31 GHz (solid yellow), rain gauges (dashed green), and ERA5 (dashed blue) in Bern. It is assigned as 0 for months without rain or when data are missing. (a) comparison with the ExWi rain gauge; (b) comparison with the Zimmerwald rain gauge.
Remotesensing 13 02217 g006
Figure 7. Same as in Figure 6, but with regard to the annual time series of the rain rate in Bern.
Remotesensing 13 02217 g007
Table 1. The classification of daily rainfall intensity and the corresponding number of rain-day events.
Rainfall IntensityRain Accumulation in a Day (mm)Number of Rain-Day Events
ExWiZimmerwald
Light rain R   <   5 1030963
Moderate rain 5     R   <   20 610515
Heavy rain 20     R   <   50 10551
Violent rain R     50 30
Table 2. Bias statistics of the daily rain rate for different daily rainfall intensity, Opa-RR21 and Opa-RR31 represent the daily rain rate estimated by Opa-RR at 21 GHz and 31 GHz of TROWARA, respectively.
Daily Rain RateBias (mm/Day)
Light RainModerate RainHeavy RainTotal
Opa-RR21 vs. ExWi rain gauge2.122.300.311.96
Opa-RR31 vs. ExWi rain gauge1.690.61−4.190.89
ERA5 vs. ExWi rain gauge2.640.04−8.780.98
Opa-RR21 vs. Zimmerwald rain gauge1.741.99−2.461.69
Opa-RR31 vs. Zimmerwald rain gauge1.350.48−6.070.81
ERA5 vs. Zimmerwald rain gauge2.720.56−9.821.57
Publisher’s Note: MDPI stays neutral with regard to jurisdictional claims in published maps and institutional affiliations.

