Article

Linear-Based Incremental Co-Registration of MLS and Photogrammetric Point Clouds

1
Faculty of Geosciences and Environmental Engineering, Southwest Jiaotong University, Chengdu 611756, China
2
Sichuan Highway Planning, Survey, Design and Research Institute Ltd., Chengdu 610000, China
*
Author to whom correspondence should be addressed.
Remote Sens. 2021, 13(11), 2195; https://doi.org/10.3390/rs13112195
Submission received: 18 April 2021 / Revised: 27 May 2021 / Accepted: 1 June 2021 / Published: 4 June 2021

Abstract

:
Today, mobile laser scanning and oblique photogrammetry are two standard urban remote sensing acquisition methods, and the cross-source point-cloud data obtained using these methods have significant differences and complementarity. Accurate co-registration can make up for the limitations of a single data source, but many existing registration methods face critical challenges. Therefore, in this paper, we propose a systematic incremental registration method that can successfully register MLS and photogrammetric point clouds in the presence of a large number of missing data, large variations in point density, and scale differences. The robustness of this method is due to its elimination of noise in the extracted linear features and its 2D incremental registration strategy. There are three main contributions of our work: (1) the development of an end-to-end automatic cross-source point-cloud registration method; (2) a way to effectively extract the linear feature and restore the scale; and (3) an incremental registration strategy that simplifies the complex registration process. The experimental results show that this method can successfully achieve cross-source data registration, while other methods have difficulty obtaining satisfactory registration results efficiently. Moreover, this method can be extended to more point-cloud sources.

Graphical Abstract

1. Introduction

Mobile laser scanning (MLS) and oblique photogrammetry are two standard urban remote sensing acquisition methods used today. Active laser scanning usually has high accuracy and can efficiently obtain dense 3D point clouds on both sides of urban roads [1], which has important applications in three-dimensional (3D) model reconstruction, urban growth, and other fields. With the development of dense matching algorithms, oblique photogrammetry as a passive remote sensing method can provide a large number of photogrammetric point clouds with rich textures and perfect scene coverage [2]; these features give the method great application potential [3].
However, the increasing complexity of urban space introduces challenges in data collection [4]. Data from a single source can be limited by, e.g., a single description scale and a large number of missing data [5], making it difficult to accurately express the complete and rich detailed features of the target [6]. As shown in Figure 1, the MLS is limited to a single perspective and a lack of texture, and photogrammetric point clouds are often inaccurate and smoothed when describing sharp structures [7], there are significant differences and complementarities between the two in terms of perspective coverage, observation scale, spatial density, texture attributes, etc. The precise co-registration of the cross-source point clouds can provide a basis for obtaining a complete description of the scene, engaging in 3D model reconstruction, changing monitoring, and other important tasks [8].
Due to their different acquisition principles, cross-source point clouds feature significant differences in coverage, spatial resolution, and expression scale, and the challenges of their timing are complex. In general, detecting geometric characteristics, identifying correspondences [9], and restoring the scale are the three important tasks when registering cross-source point clouds in arbitrary initial positions and orientations. However, the following obstacles make the task difficult: (1) Due to differences in the descriptions of the same structures caused by voids and noise, the form and accuracy of the local neighborhood features extracted from the cross-source point clouds are inconsistent [10]. (2) Due to the differences in coverage caused by perspective, the number of strictly corresponding features is difficult to guarantee [11]. (3) Massive point-cloud data have significant redundancy and a high computing cost, which requires efficient processing.
To overcome the above obstacles, this paper proposes an incremental registration method for cross-source point clouds. The main contributions of this paper are as follows:
  • An end-to-end automatic cross-source point-cloud registration method;
  • A method to extract the same linear features from cross-source point clouds to reduce noise and simplify the scene, thereby guaranteeing the similarity measures of features;
  • An incremental registration strategy that can simplify the complex registration process and restore both the scale and 3D alignment.
The rest of this paper is organized as follows: Section 2 briefly reviews the related works, Section 3 describes the proposed method in detail, Section 4 reports the experiments and analyzes the results, and the conclusions and outlook are presented in Section 5.

2. Literature Review

The accurate registration of point clouds from different sources is a prerequisite for collaborative computing, integrated modeling, and other applications [12]. In data collection and preprocessing, different auxiliary data can be used to convert a point cloud to the world coordinate system. For instance, MLS can use the GPS/IMU inertial navigation module to calculate the trajectory of geographic coordinates [13]. However, the error sources of the secondary data collection are different, so further registration remains necessary [14].
For a long period of time, point-cloud registration focused on solving the rigid-body transformation problems for a pair of point clouds or multiple groups of point clouds. The most common solution is the Iterative Closest Point (ICP) algorithm [15,16]. Since point clouds usually do not strictly correspond with each other, and repeated point-by-point traversal consumes large amounts of computing resources, many scholars have improved the ICP algorithm. These improvements include point-to-line PC-ICP [17], NICP with normal vector constraints, Voxel-GICP based on voxel segmentation [18], etc. However, these algorithms have high requirements for the data overlap and usually require accurate initial alignment; otherwise, they will easily converge to the wrong local extrema and fail to obtain the correct conversion parameters. Thus, coarse-to-fine matching strategies are gradually becoming mainstream [19].
The core of the registration is the recognition and correspondence of features, which can be divided into feature primitives such as a point, line, and plane. Point primitives have the best generalization and flexibility. However, the accuracy of feature points extracted from an original point cloud is limited by the fact that the discrete original point cloud cannot describe all features of the target; the descriptions of small structures are especially limited [20]. Extracting spatial points from topological structures offers greater stability [11]. For example, Stamos and Leordeanu [21] first identified the intersection points of adjacent planes and then estimated the transformation of adjacent point clouds based on at least two corresponding intersection points. Under the guidance of a priori semantic structural information, the edges of buildings and structures represent effective and available features for, e.g., further fitting of the building outline [22] and the intersection points of vertical lines [23]. However, such methods require the most accurate and detailed raw point-cloud data that can be obtained. Moreover, transcendental semantics are more complex in large scenes, which limits the use of such data in urban environments with complex ground features and structural types across a large range.
The line and plane, as more advanced geometric elements, usually require more complex extraction methods and have more accurate information expression abilities to cope with more challenging data processing requirements. For example, hull edges were previously extracted from noisy data obtained from floating platforms [24]; curves were extracted from an historical site’s scanning point clouds with a fine structure and registered [25]; central axes were extracted from incomplete data (and a correlation was realized) [26]; and the plane, sphere, and cylinder were extracted from a scene to identify the corresponding relations [27]. A complex but reasonable extraction process can significantly improve the accuracy of cloud descriptions and applications, especially for complex or noisy data [28]. However, existing methods for feature extraction also aim at specific applications or specific data, as it is impossible to extract exactly the same features from different data sources, and it is common for features to be similar but not identical.
Therefore, to improve the applicability of the algorithm, the existing registration methods all seek to process the point-cloud registration of all scenes. Unfortunately, there is still no method that can effectively handle the point-cloud registration of all scenes [8]. Although researchers have sought to improve the generalization ability in algorithm design, novel photogrammetric point clouds have physical conditions different from those of laser point clouds, and there are even more significant differences between the data that need to be registered [29]. This limits the efficiency and accuracy of existing algorithms in application. To address the complex challenges of cross-source point-cloud registration, we propose an incremental registration strategy that considers the geometry of the main body.

3. Methodology

3.1. Problem Formulation and Overview of Methods

Assume that the MLS point cloud is represented as S = { s i } and the photogrammetric point cloud as V = { v i } , where S is the target that usually has a definite scale and higher accuracy. The two sets of point clouds usually have different coordinate systems but partially overlapping regions, Ω . Two or more pairs of corresponding points can be identified and determined, and the rotational matrix R and translational matrix T can be calculated. Then, the rigid body transformation of S is carried out in a three-dimensional space to realize the alignment of S and V . The whole process of change can be seen as the solution to six degrees-of-freedom (DOF) parameters, with rotation and translation in the directions of the three coordinate axes, respectively. This process can be expressed using Equation (1):
s i = R v i + T .
In the registration task of the cross-source point clouds, since the photogrammetric point cloud is scale free, the constraint of scale factor λ should be added. Notably, the scale variation of the point cloud should be consistent in the three axes. As a result, the registration process is no longer a rigid body transformation with six degrees of freedom but a similar transformation process with seven degrees of freedom featuring a triaxle uniform scale factor, which can be expressed as
s i = λ ( R v i + T ) .
It would be a complicated task to directly solve the seven registration factors simultaneously. Since our registration task is mainly aimed at urban areas, the photogrammetric point cloud can restore the vertical orientation using the facades of the buildings in the scene, while the horizontal compensation function of the laser scanner and the integrated navigation system can also ensure the correct vertical orientation. In this way, the rotation task of the point cloud around the three coordinate axes is reduced to the rotation angle ϑ around a single coordinate axis ( 0 , 0 , 1 ) T , and the rotation matrix R can be simplified to R * = ( 0 , 0 , ϑ ) T . Many building planes in MLS are incomplete and often feature noise in the photogrammetric point cloud, which makes it difficult to accurately measure the similarity of the extracted 3D plane. When the scene is projected onto the plane, the property of clustering can be used to remove noise and improve the integrity of features, extract accurate and complete 2D linear features of the building, and divide the 3D registration task into 2D registration on the horizontal plane, with height deviation in the direction of the Z axis. The translation matrix can be decomposed into T * = ( Δ x , Δ y , 0 ) T on a 2D plane with height offset Δ H . In this way, the registration task of cross-source point clouds can be changed into the following formula:
s i = λ ( R * v i + T * ) .

3.2. Extract a Simplified Point Cloud by Eliminating Noise from the Cross-Source Point Cloud

The first task is to extract the same building edges from different sources of point clouds. These edges mainly refer to the outlines of buildings in urban areas and also include artificial or natural breaklines. Due to the voids and noise in point clouds, point clouds from different sources feature different representations of the small structures in buildings, such as corners or columns, but the building outlines remain similar. This similarity will affect the extraction of line features with the same name. When a line segment lacking an outline appears in the point cloud, that segment will disappear in the other point cloud at the same time, while the line segment of the outline is less likely to disappear [30]. This is the main basis for the registration of point clouds with significant differences between different sources. Based on the projection point density and the aggregation of the normal vector, the point cloud used to express the building outline can be separated from the original point cloud.
Preliminary screening of the source point cloud based on the projection point density can effectively eliminate errors and simplify the scene. For a given point-cloud data set P, we randomly select multiple seed points and calculate the mean value of the distance between the seed points and their adjacent points as the point density ρ, which represents the average point spacing of the current point clustering. Subsequently, the point cloud is projected onto the horizontal plane, and grid segmentation is performed. The step size of grid segmentation l and the threshold value of grid screening δ n are determined according to ρ. For each grid, if the number of points exceeds the threshold δ n , the points are retained in the point set P 0 . Experiments show that for MLS point clouds and oblique photogrammetric point clouds, l = 30 ρ and δ n = 10 ρ can meet most requirements. A more detailed step size s and a higher δ n can provide more accurate facade segmentation results. The points in P 0 that are retained by preliminary screening not only contain a large number of building facades but also feature the elements of ground objects, such as streetlights and vegetation. Point clouds can also form clusters with aggregation. The clusters that belong to the building outline of the scene, such as the facades of buildings, tend to have high consistency in their normal vectors. The linear features of building outlines can be extracted effectively based on the significance detection of the normal vector.
For each point contained in P 0 , the starting point of the normal vector is shifted to the origin of the coordinates. The unit sphere formed at this time is called the Gaussian Reference Sphere, through which we can intuitively observe a significant aggregation effect [31]. Each center of focus represents the presence of the main plane direction in the scene. The closer a point is to the center, the more likely it is to be located on the main plane. The discrete points without an aggregation effect can be eliminated via outlier detection [32]. Notably, the point-normal vectors in the same plane can be oriented 180 degrees relative to each other, so the normal direction needs to be corrected first. The K-means clustering method [33] was adopted to obtain the center in the present study. The normal vector of each point was compared with the clustering centers, and the points with angles less than 15 degrees were stored in the simplified point set P c .
P c . represents the main facade distribution of the scene, a set of points selected from the original point cloud that are most likely to be located on the outline of the building. The results of the point cloud extraction reduce the noise and ignore many small structures, which effectively inhibits the influence of noise and simplifies the scene. This process is shown in Figure 2. The simplified point clouds extracted from the original point cloud are distributed in two main plane directions. These directions can accurately describe the main results of the scene and serve as the basis for subsequent steps.

3.3. D Registration and Scale Recovery Based on Line-Group Matching

The simplified point cloud effectively reduces the noise and redundancy of the scene. However, due to the influence of data voids, noise, and other conditions, it is not only time-consuming but also not sufficiently robust to identify the corresponding point, line, and plane features. The scale of the photogrammetric point cloud also needs to be considered. Therefore, the method in this paper adopts 2D line segment registration to restore the scale consistency of the cross-source point clouds and align the 2D line segments first. In this part of the operation, the simplified points are projected onto the horizontal plane, and a two-dimensional projection map is generated according to the grid segmentation. For each grid, if there are points inside the grid, those points are filled with color, and the point labels within the grid are recorded. We used the Line Segment Detector (LSD) algorithm [34] to extract the line features of the two-dimensional projection images, and employed the optimized line-segment group method to match the two-dimensional line features [35].
The method of line-segment group matching was selected because this method enables extraction of the linear feature similarities and local differences between line segment clustering and can overcome the differences in line features extracted from cross-source point clouds. The core of this method involves defining the relative property differences between groups [36] and constructing feature descriptors with multiple feature description components.
For a given segment i ( p 1 p 2 in Figure 3), the property-difference value s is the sum of the edge gradient of each pixel of the line segment, and the gradient g of a line segment is the average edge gradient of each pixel. The calculations in this step require detecting the image gradient, which is obtained from the LSD line-detection step. Then, for a line segment i with salience value s , one of the segment’s endpoints is arbitrarily taken as the search center, and k adjacent line segments are searched. The line segments with significance greater than the threshold ε are screened and clustered into groups, where ε = r × s , and r is a ratio. For the other end point of line segment i , another clustering result will be obtained. Therefore, in the process of line segment clustering, each line segment i corresponds to two clustering centers and two groups of clustering results. Considering the identification requirements for the building outline in cross-source point-cloud matching, we can adjust the threshold r to explicitly describe the relative property differences between line segments. An increase in threshold k will increase the significance of the current line segment and introduce more local structure information on the line-segment distribution features. However, this information will increase the difficulty in matching and the amount of calculations needed for similarity measurements. The parameter of { r = 0.5 , k = 5 } is a balanced choice. Our experiments show that this parameter can be adapted to most situations [35].
Figure 3 shows the line-segment clustering process. In the upper part of the figure, two two-dimensional line-feature images obtained from two different sources are shown. These images clearly share similar linear features. Some broken lines that do not represent the major body are ignored, which increases the expressive weight of the line group in the building outline, as shown in the lower-left part of Figure 3. Here, i is the current line segment with two endpoints p 1 and p 2 , and a , b , , f represents the other line segments around i . For line segment i with endpoint p 1 and k = 3 , the line-segment group is { i , b , d , f } , and { a , c , e } is excluded due to a lack of salience. Similar parallel line segments, such as stairs, are common in cities, and are also a cause of the noise problem in data. As shown in the lower-right portion of Figure 3, we only selected the most significant segment from among a group of adjacent parallel line segments for clustering.
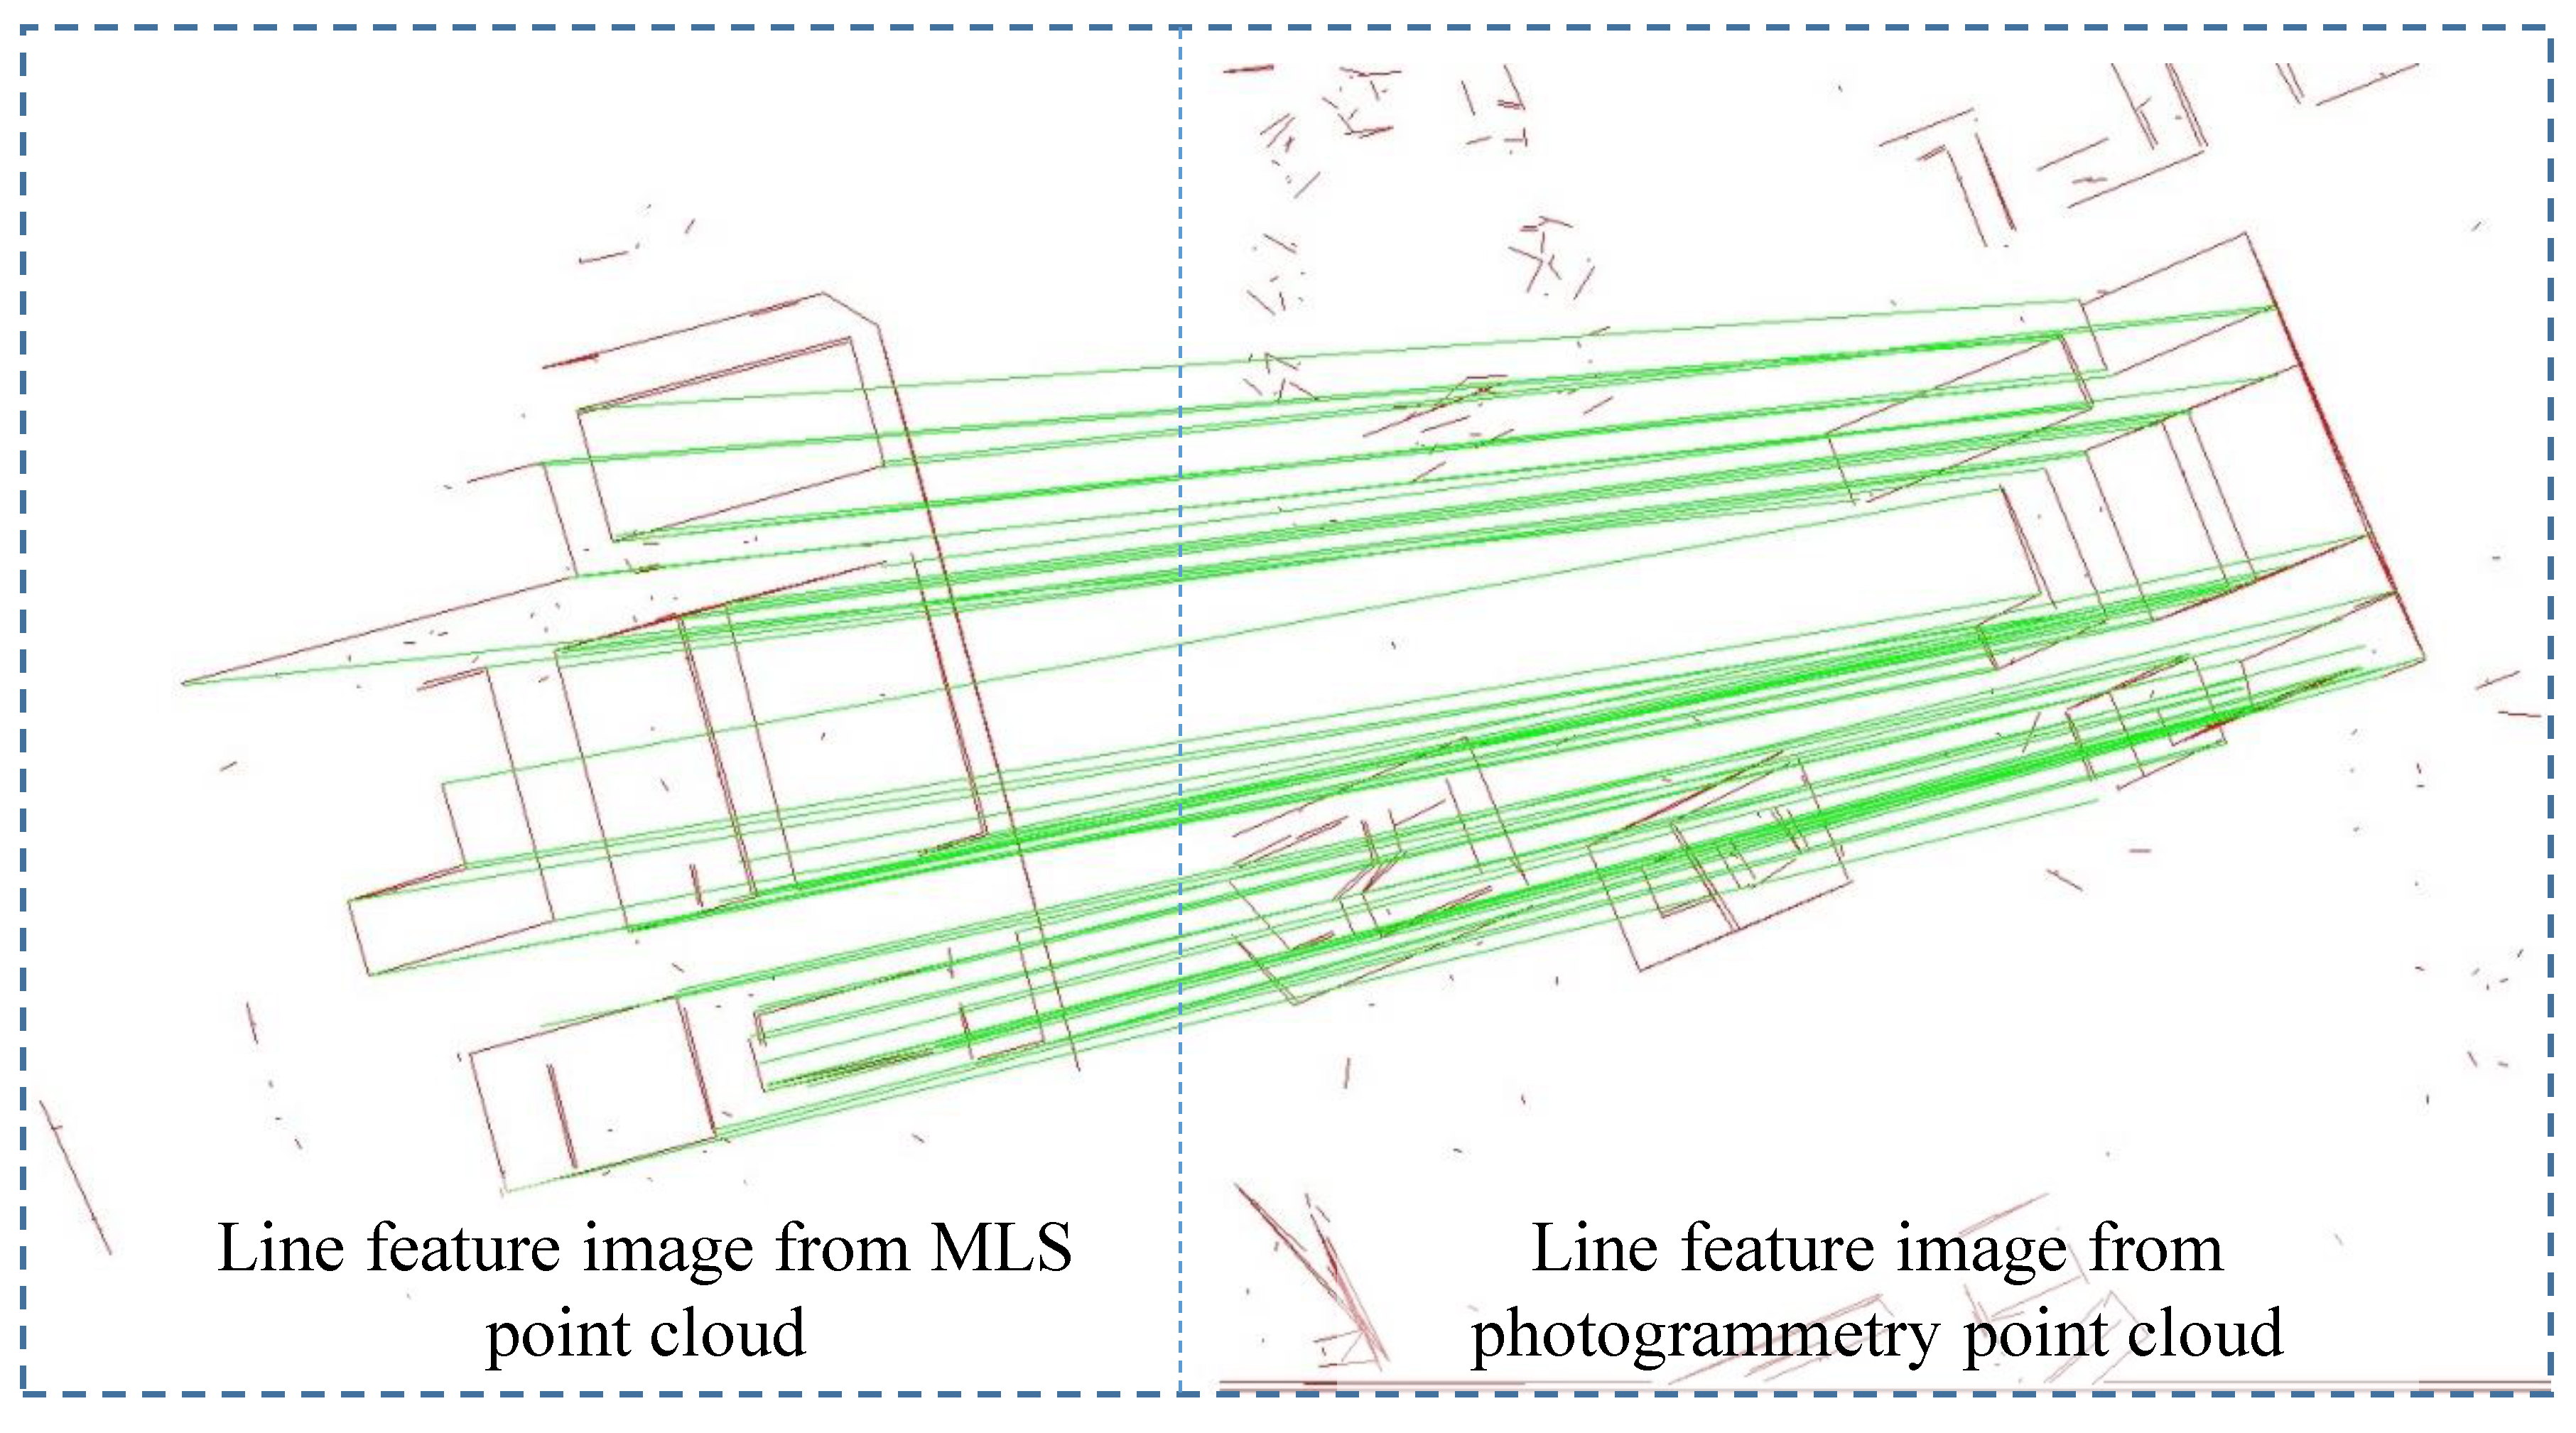
The scale restoration of the photogrammetric point clouds is an important issue worthy of attention. To measure the similarity between a pair of corresponding line segments p 1 p 2 and q 1 q 2 , thirteen component feature descriptors were constructed according to Wang’s method [35], including five scaling factors; this step is key to overcoming the scaling differences. Subsequently, the line segments in the line group were sorted according to Ferrari [36], and each corresponding line segment in the line group of p 1 p 2 and q 1 q 2 was measured. The sum of the similarity degrees was used to measure the similarity in the line-segment group. This method can determine the optimal line segment mapping and maximize the similarity measurement between two line-segment groups. Matching results often contain individual errors. Such errors are unavoidable and can be eliminated using RANSAC. Figure 4 shows the results of a set of similarity measures.
According to the mapping relationship between points and two-dimensional projected images, we can easily detect the two-dimensional correspondence relationship between points and calculate the two-dimensional affine transformation factor. Scale consistency recovery and two-dimensional alignment can be used to achieve cross-source point clouds. Since the two-dimensional grid and internal points do not have a one-to-one correspondence, the point closest to the center of the grid is generally chosen as the corresponding point. Meanwhile, the step size of the grid can be smaller to improve the accuracy.

3.4. Incremental Height Offset and Overall Optimization

After 2D transformation, the scale of the multi-source point cloud is restored, and the cross-source point cloud is accurately registered in the horizontal direction. However, differences remain in the elevation direction of the Z axis. Figure 5d shows the location of the section taken from the MLS point cloud (in blue). Figure 5e shows the position of the section taken from the photogrammetric point cloud (in green). The superposition of the two sections is shown in Figure 5f. It can be seen that even though the blue point cloud is incomplete, and the green point cloud is noisy, the elevation offset of the two remains clear.
In the preliminary screening of the main facade points, the point cloud is projected on the horizontal plane and divided into high-density grid areas and low-density grid areas based on the projection-point density. The high-density area is used as the primary result of the elevation points, while the low-density area is usually distributed horizontally and contains a large number of ground points, which will serve as the basis for our elevation offset estimation [36]. The two point clouds to be registered, which are represented as S = { s i } and V = { v i } , were projected and segmented two-dimensionally according to the same grid, and the average normal vector direction ( n s ¯ , n v ¯ ) and average elevation ( h s , h v ) for each grid were calculated. If the angle between the normal vectors Δ n s v = ( n s ¯ · n v ¯ ) is greater than 8°, the area where the grid is located is considered to be affected by strong noise and will no longer participate in the height deviation estimation. For the rest of the grid, the height difference Δ h s v is calculated and counted, and the peak value of the histogram is taken as the elevation offset.

4. Experiments

4.1. Data Sets and Evaluation Metric Descriptions

We collected two challenging data sets to evaluate the performance of the proposed algorithm. The first data set was collected from Southwest Jiaotong University (SWJTU), whose campus has a total area of 1800 m × 1600 m. The second data set was collected from Shenzhen Qianhai Exhibition Center (QEC), whose campus has a total area of 380 m × 380 m. It should be noted that the data collected in this paper were intended for other project purposes and were not subject to any special conditions at the data-collection stage.
The SWJTU Photogrammetric point cloud (SP) was obtained using an RIY DG-3 camera mounted on a “DJI M600Pro” UAV platform. This sensor can collect color image data from one vertical viewing angle and four oblique viewing angles simultaneously. The focal length of the camera’s face is 28 mm, and the focal length of the camera’s side is 40 mm. SP contains a total of 28,886 images and was first used for real 3D modeling. The SWJTU mobile laser scanning point cloud (SMLS) was collected using an ILSP-300 mobile laser scanner. The data were first used in the Double First-Class Subject Construction Project of Southwest Jiaotong University. To verify the scalability of our method, we acquired SWJTU airborne laser scanning point cloud (SALS) data from a municipal project in Chengdu, with a density of four points per square meter. We selected the method of Yang [22] to identify the top contours of the buildings and generate two-dimensional projection images to pair the ALS data using our method.
The QEC Photogrammetric point cloud (QP) containing 405 images was also obtained using the RIY DG-3 camera. The QEC airborne laser scanning point cloud (QALS) data from the Qianhai 3D Reconstruction Project were collected using a small UAV platform with a laser scanner, which can reach an average density of 30 points per square meter. The details of the data set are shown in Table 1.
The two selected data sets solve different challenges. Firstly, the complex structure of the buildings in the SWJTU data set produces considerable noise in the photogrammetric point cloud. At the same time, there are many trees and bushes in the scene, leading to a large number of voids in the MLS point cloud. These challenges can be used to fully evaluate the performance of the algorithm. Buildings in the QEC data set feature small eaves and a large number of transmission materials, introducing more noise into the point-cloud data. In the next section, we further evaluate the robustness of our algorithm. In the experiment section, we quantitatively compare and analyze the scale recovery, the accuracy of feature matching, and the accuracy of registration. Several characteristic scenarios are presented, and the rotation error e r and shift error e t are considered as evaluation criteria [29,37].

4.2. Experiment Results

4.2.1. Qualitative Evaluations

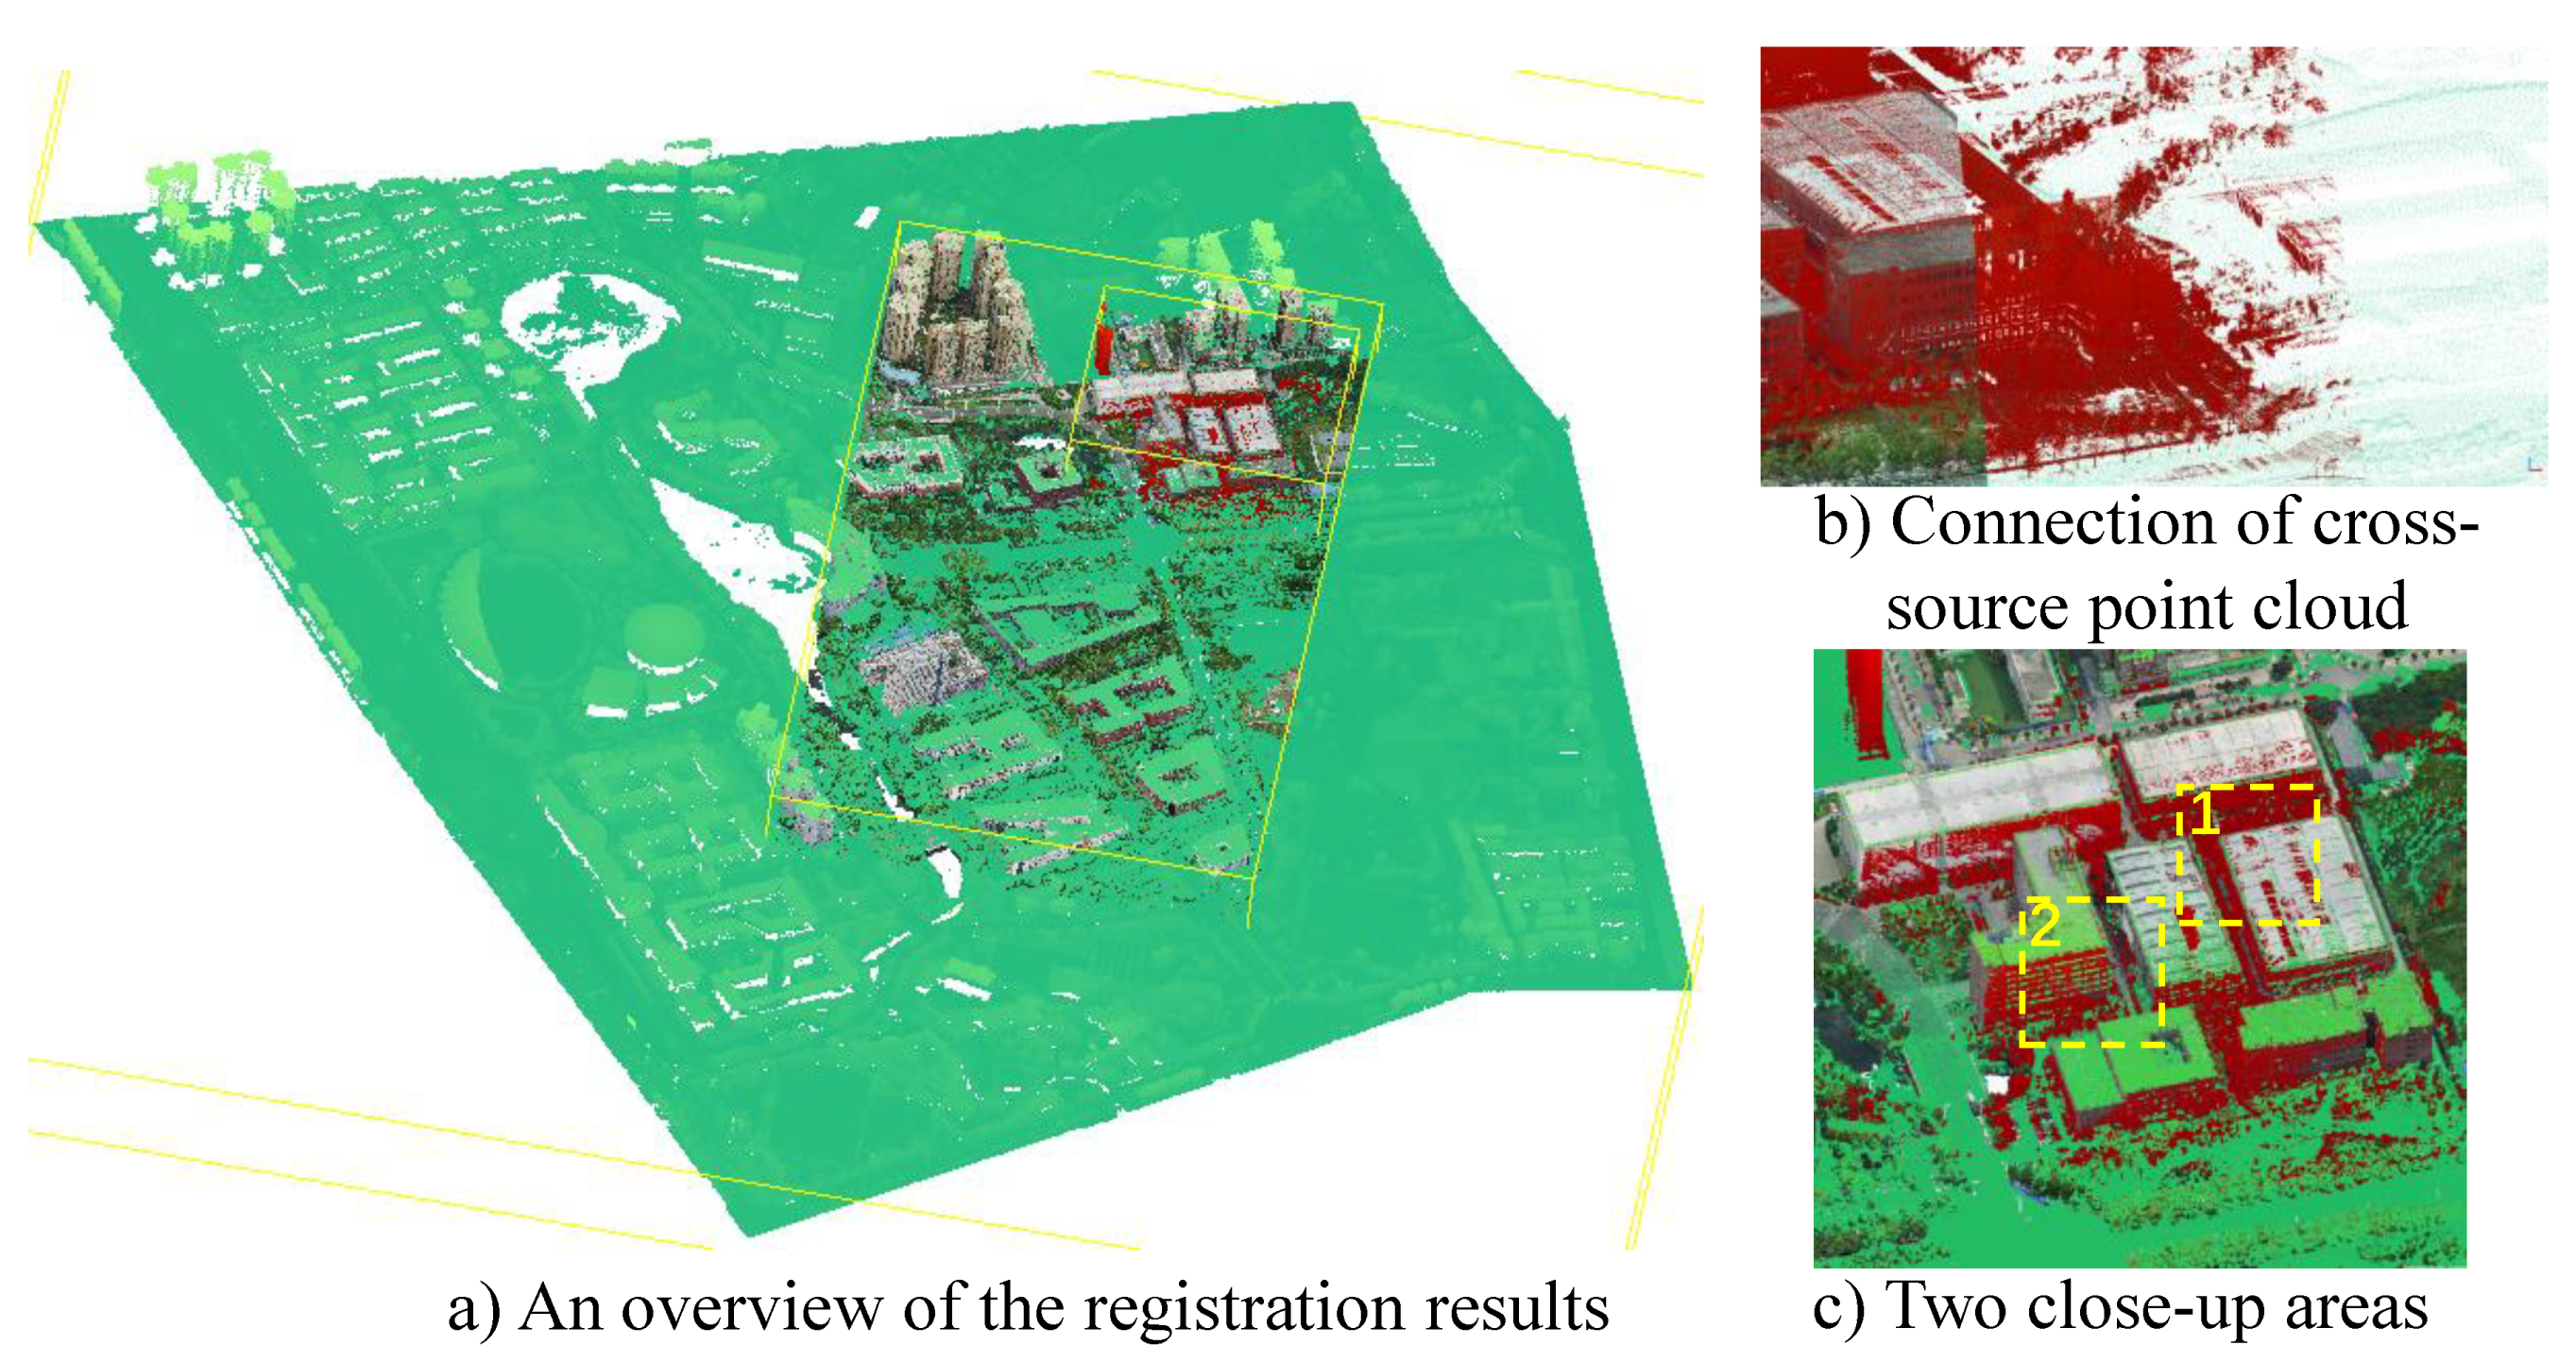
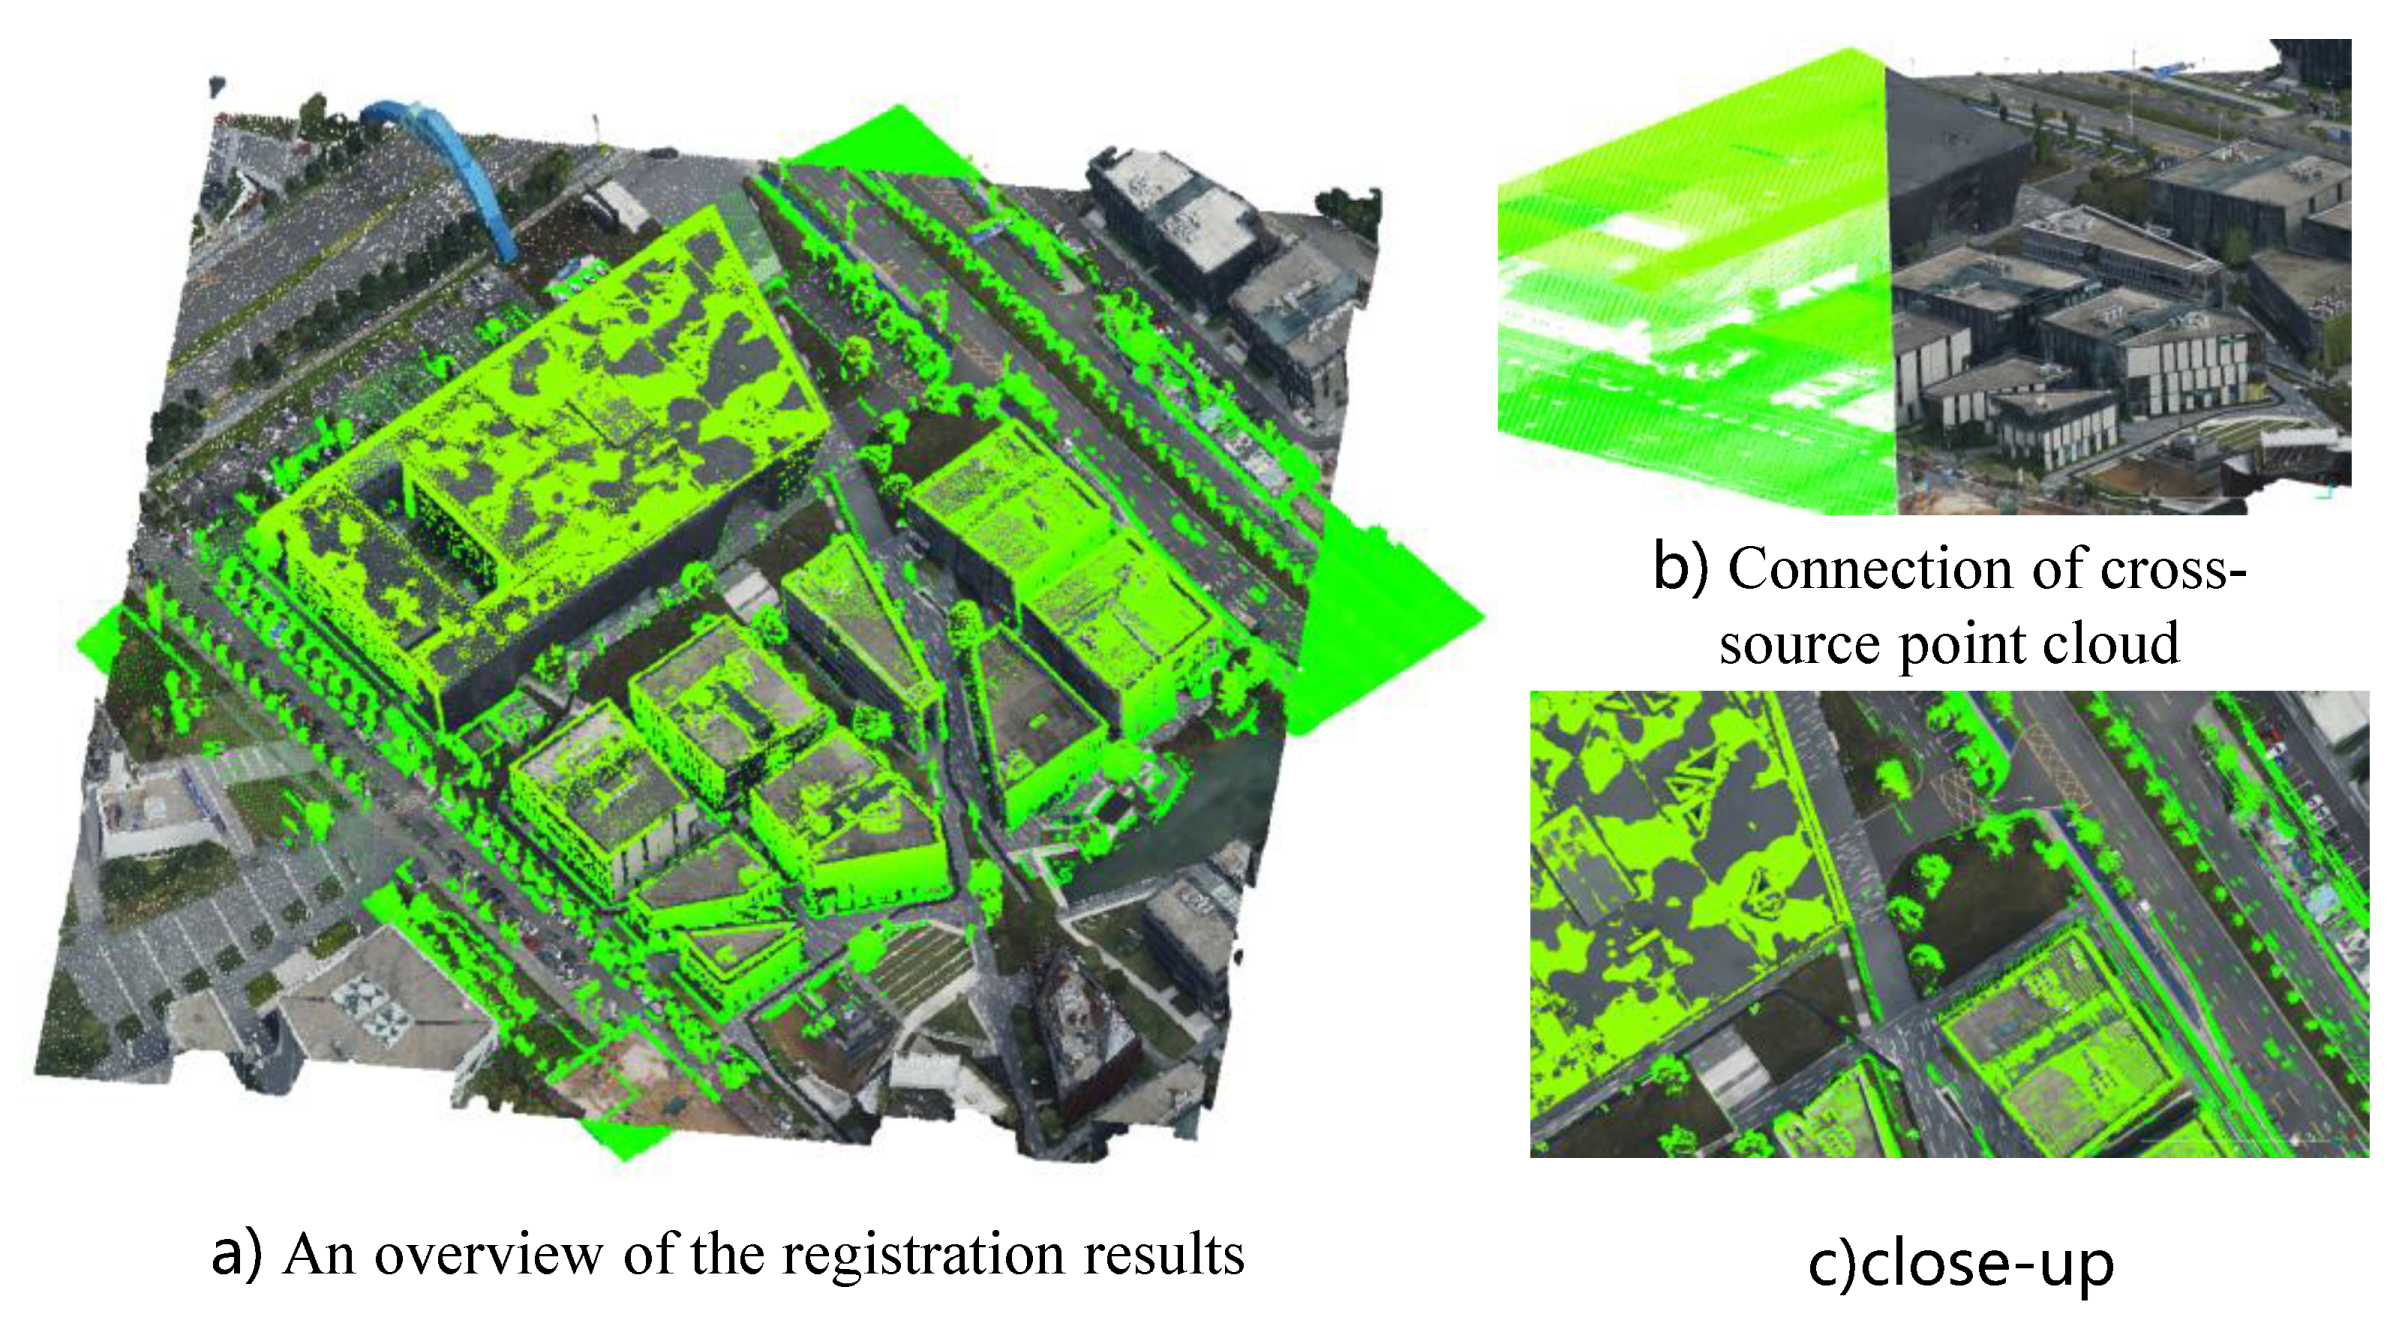
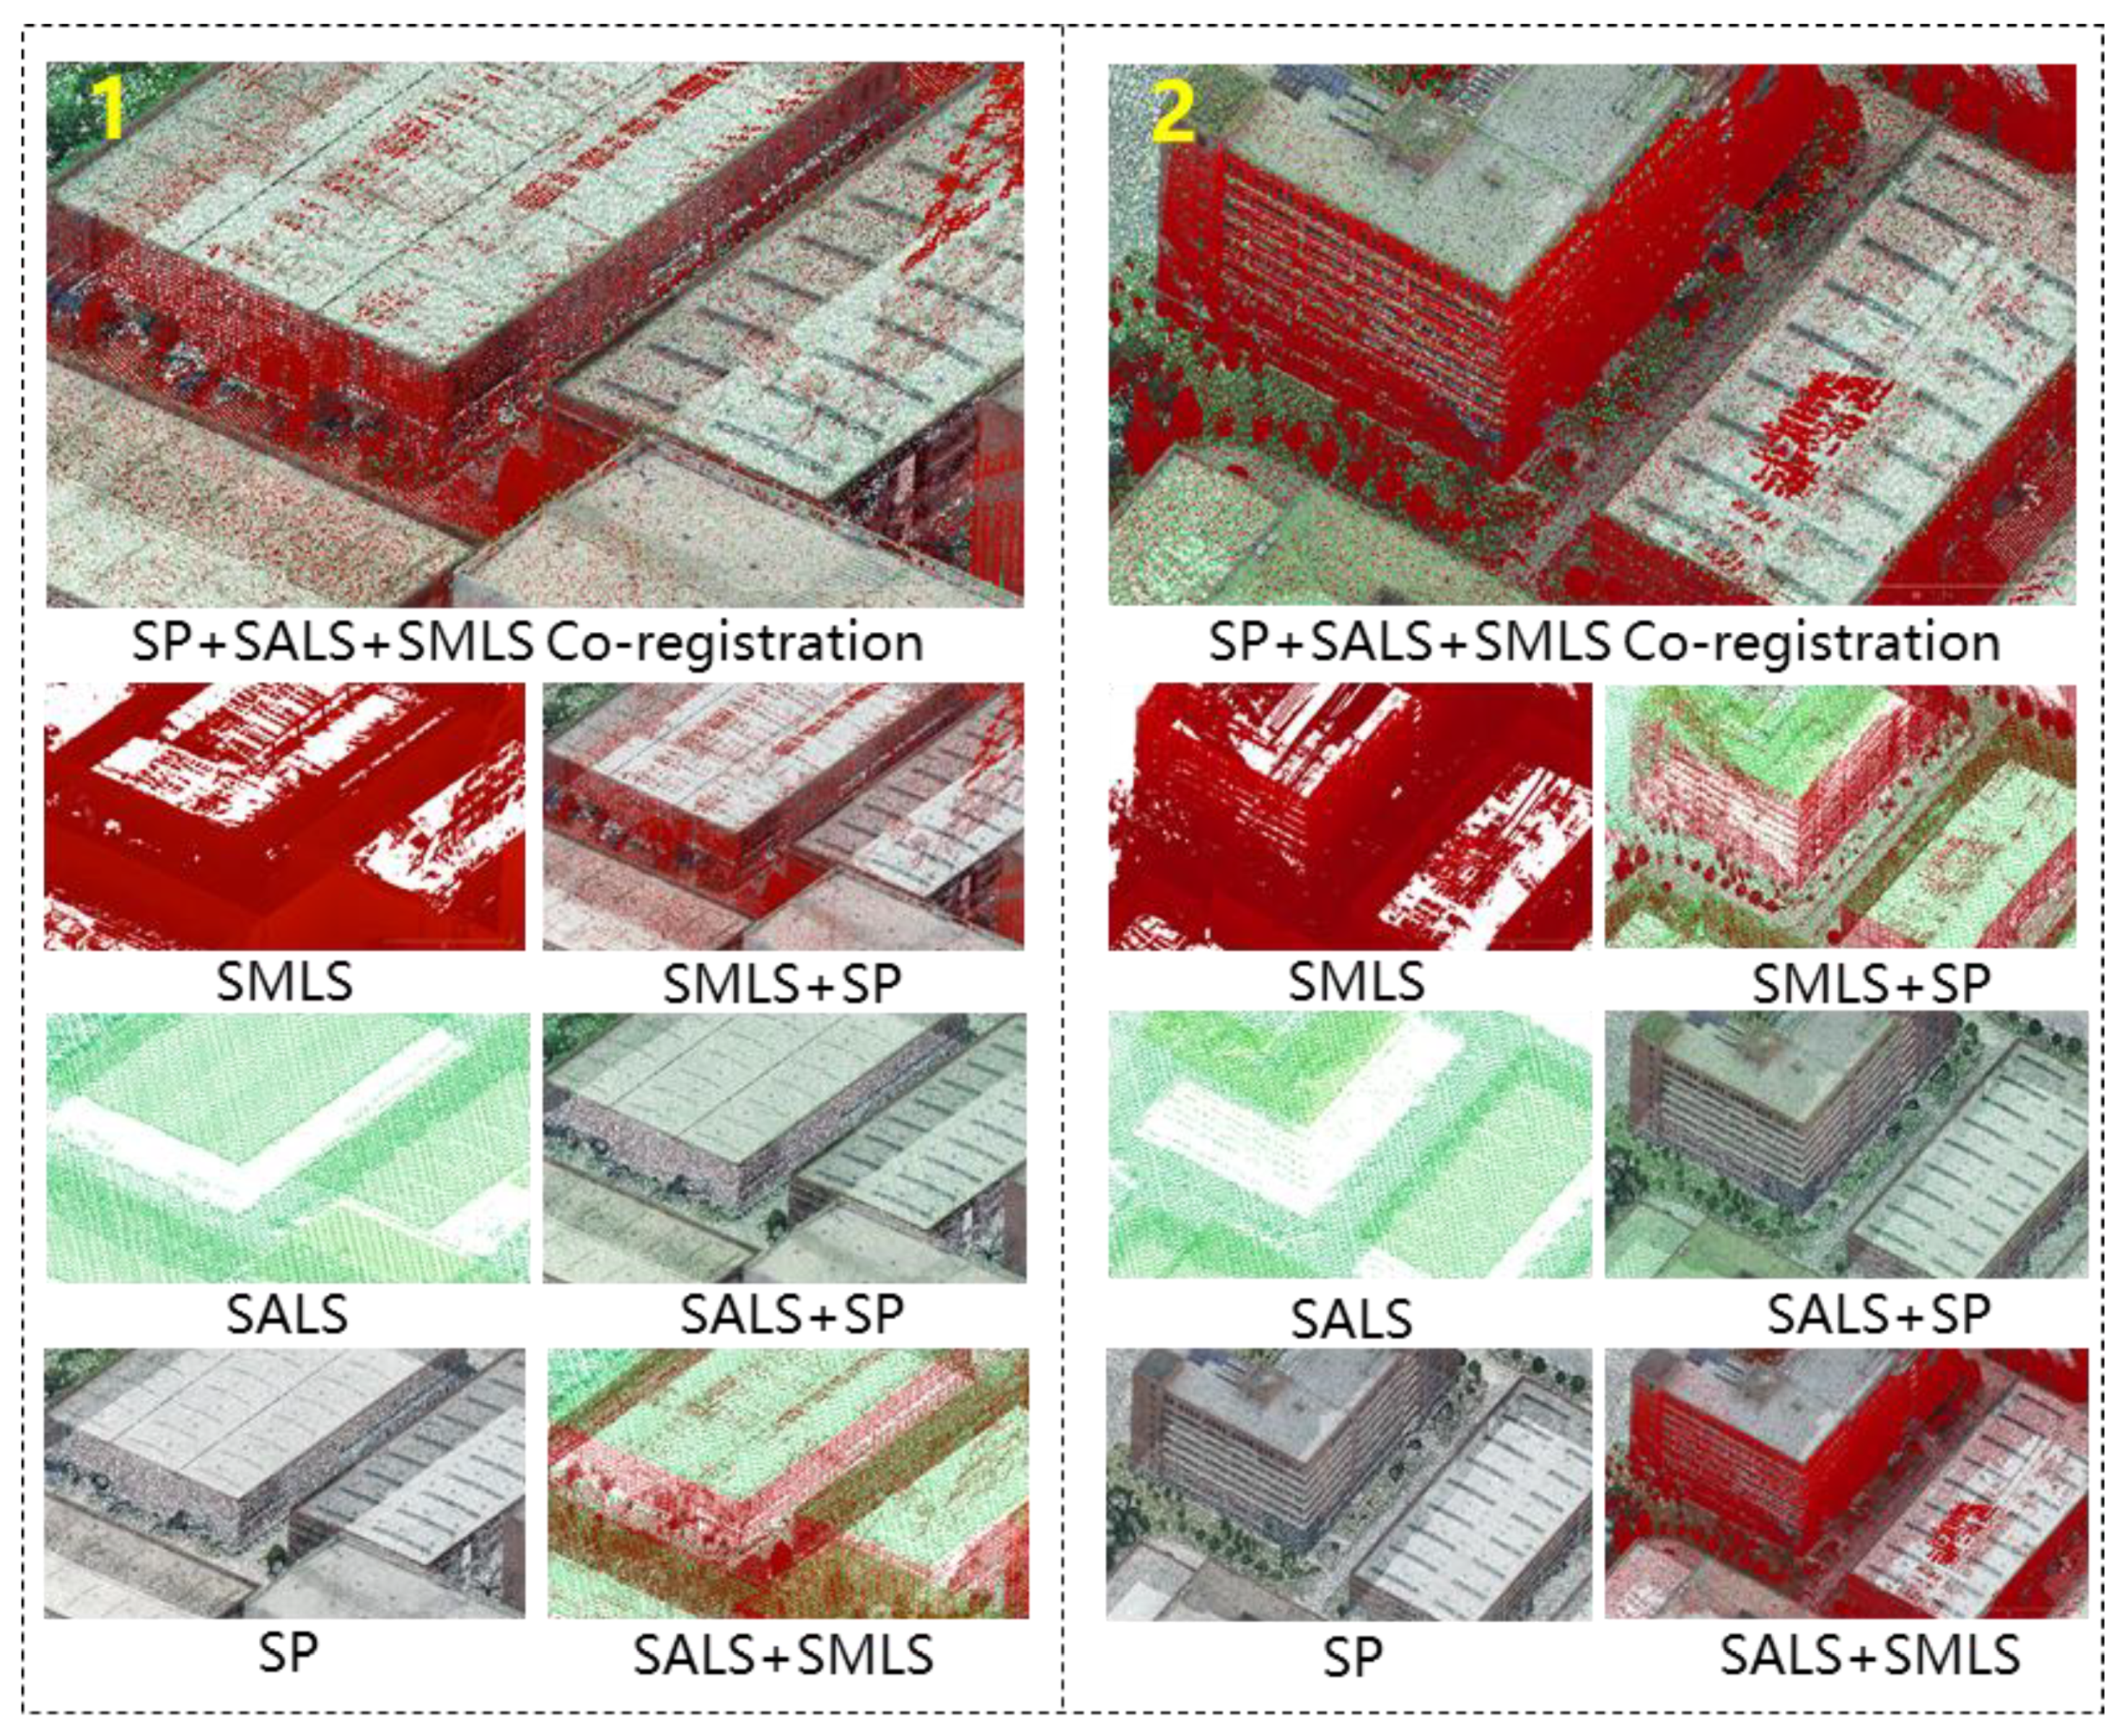
In this section, we present the registration results to show that the proposed method can overcome the various differences present in cross-source point clouds and achieve accurate co-registration. To illustrate the qualitative evaluation of our method, we provide the registration results (both whole and in part) in Figure 6, Figure 7 and Figure 8. In these figures, the SALS data set is colored green, which darkens from a high to low elevation. The SMLS data is instead colored red, while SP uses the true texture color.
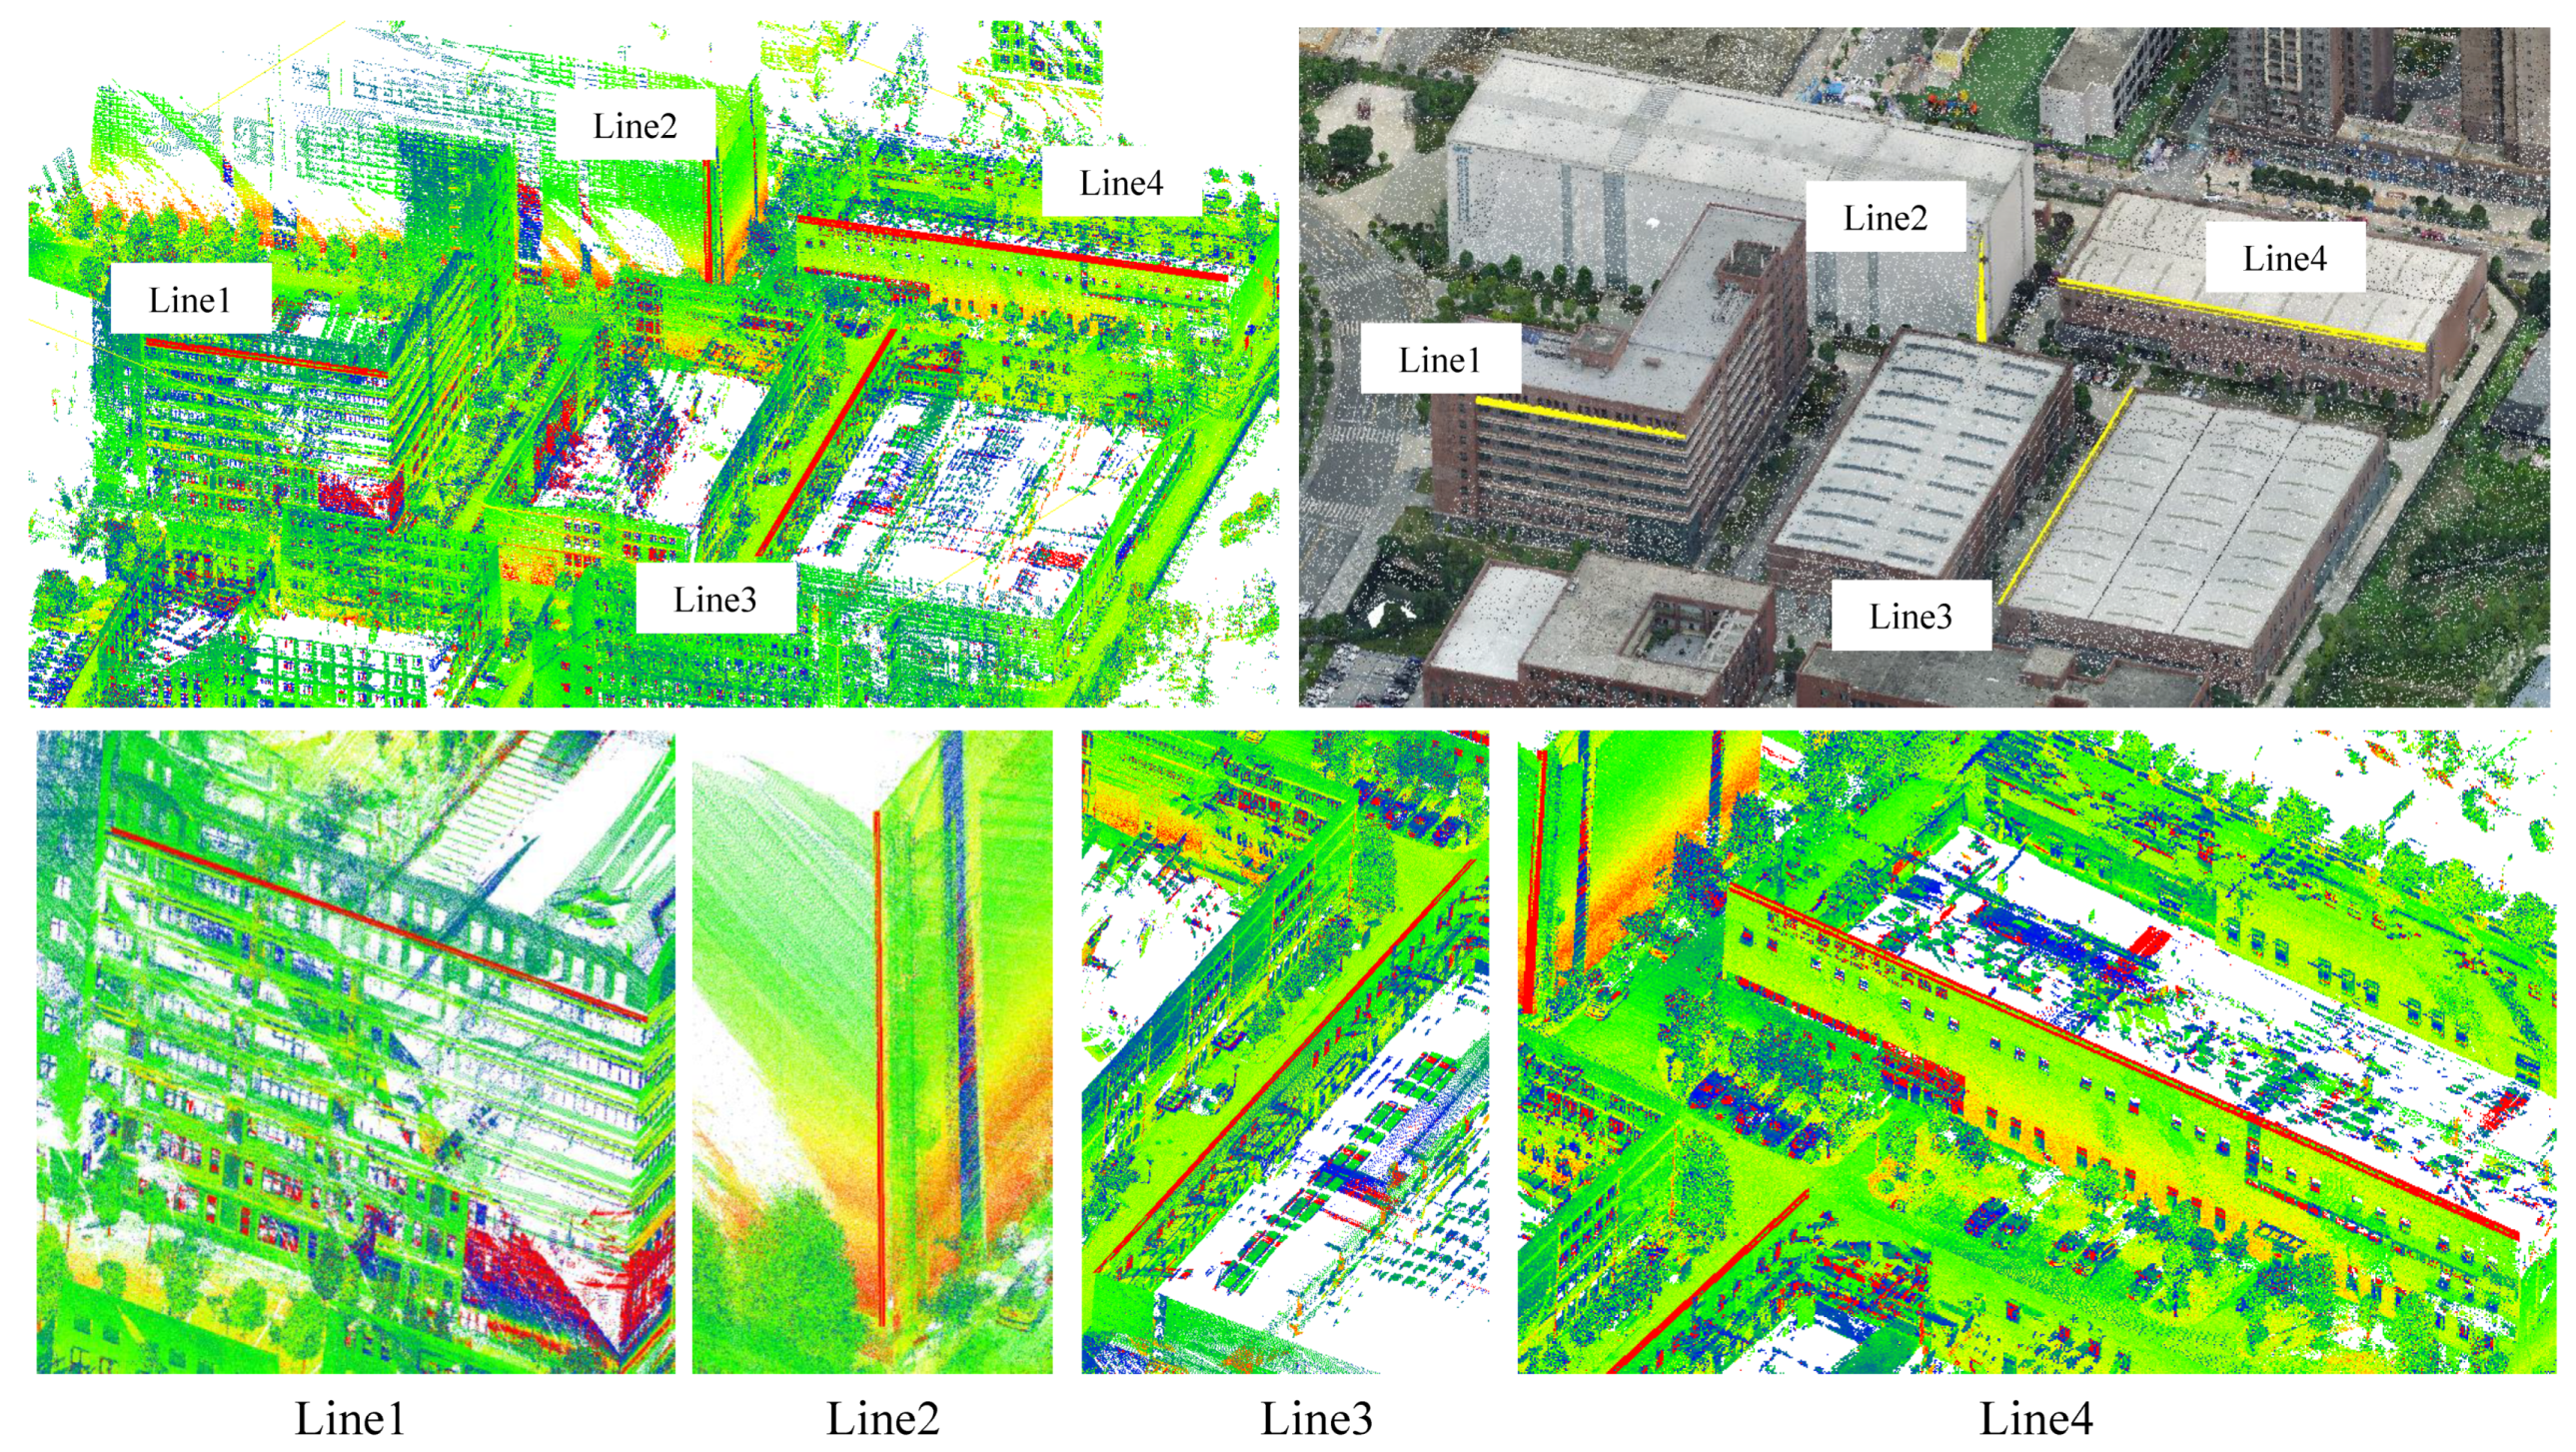
Figure 6a shows the registration results from the overall top perspective. Here, the bounding boxes for three kinds of data are shown. Ranging from large to small, these boxes represent SALS (colored green by elevation), SP (real color), and SMLS (colored red by elevation). It can be seen that the coverage range is significantly different between each data set. Figure 6b illustrates the seams of the cross-source point cloud, which shows that the building outline is aligned. Figure 6c indicates the positions of two close-up areas through yellow boxes. The corresponding two details are magnified and shown in Figure 8. Figure 7 shows the registration results for the QEC data set.
Figure 8 shows the separate data for three sources alongside the results for the pair registration and co-registration of three kinds of data from the same perspective. As shown by the results, although the SWJTU data set contains point clouds captured from the aerial and ground perspectives, and the resolution and noise levels of the point clouds are significantly different, we can still obtain good registration results. First, the scale recovery results are excellent, thereby overcoming the bottleneck of traditional point-cloud registration with rigid body transformation as the paradigm, and do not require manual operation to be achieved. In addition, the figure clearly shows that the major edges of the building correspond exactly. To clarify the results, we illustrate the output data as pairs of alignment in the detailed display. The three data sets from different sources are then aligned together.

4.2.2. Further Detailed Assessment

To further evaluate the effectiveness of the cross-source point-cloud registration method proposed in this paper, we selected a characteristic section in the SWJTU data set that contains four challenging data types. As shown in Figure 9, we cut the point cloud slice with a thickness of 1 m in the scene and observed it from a side view. Figure 9a shows the spatial position of the point cloud slice’s profile. We can easily determine the exact location of this point cloud slice using the real texture of SP. The well-aligned structure can be seen in the section shown in Figure 9b, which again uses red for SMLS and green for SALS. At this point, to achieve a clearer contrast, we colored the SP blue. At the same time, four special positions are marked with gray circles. Further details are shown in panels c, d, e, and f of Figure 9.
Figure 9c shows the vegetation element. In the cloud of blue photogrammetry points, this element appears as a ball protruding from the ground. The red SMLS points depict the main branches of the vegetation, while the green SALS point cloud has only a few scattered points, making it difficult to describe the structure of the vegetation. The geometric similarities of the three-point clouds are difficult to determine, even via manual interactions. Under the proposed method, we believe that cross-source point clouds can achieve co-registration with this vegetation but cannot be measured using a certain value.
Figure 9d illustrates the facade and roof of the building. The laser-scanning point clouds obtained from the air and ground are distributed on the top and the facade, respectively, with few overlapping areas. In addition, the windows cause laser beams to be emitted, leaving unused MLS points within the interior of the building. At this stage, the photogrammetric point cloud is more like a bridge connecting the laser points from different platforms, and the three register well together.
Figure 9e illustrates the area near the ground at the bottom of the building. It can be seen that the photogrammetric point cloud features obvious noise and two obvious abnormal bulges on the ground, which may have been caused by the low vegetation on the ground. Although it may seem that the cross-source point clouds are not consistent, they remain aligned. Clearly, the traditional registration method has difficulty converging to the current position and is more likely to deviate to a position that seems correct but is ultimately incorrect.
Figure 9f illustrates the entrance of the building. Thus, this image includes common ground features such as eaves, steps, and vegetation. The overhead perspective of the image makes it difficult to collect data under the eaves, which leads to the photogrammetric point cloud in this area appearing distorted and clearly incorrect. Meanwhile, the steps present obvious structural changes, and the passivation phenomenon of the photogrammetric point cloud for the sharp feature description is obvious here. The same phenomenon can be observed in the structures of the windows.
To sum up, the four types of cases illustrated in Figure 9 represent key areas where it is difficult to obtain accurate results using traditional registration methods. However, our method achieved observably accurate co-registration.

4.3. Quantitative Evaluations

Quantitative evaluations involve three important aspects, including the restoration of scale, the accuracy of feature matching, and the accuracy of co-registration.
First is the restoration of scale. For this aspect, we selected four distinct and complete building boundaries and recorded the lengths of the building edges before and after scale restoration using manual intervention. The recovery error Δ l s c and recovery rate ρ s c were set to measure the scale restoration results using the following formula:
{ Δ l s c = Δ [ e d g e ( SP * ) e d g e ( SP ) ] ρ s c = | Δ l s c | / e d g e ( SP * )
where e d g e ( * ) represents the building edge length in the specified data set, and | * | refers to the absolute value. The recovery error Δ l s c represents the difference in the Euclidean distance of the corresponding building edges between different data sets, while the recovery rate ρ s c represents the deviation of scale recovery. Figure 10 shows the specific positions of the four building edges, and the statistics for scale recovery are presented in Table 2. Notably, since the edge-length measurement is based on manual intervention, the selection error will also accumulate in the recovery error and recovery rate, which is inevitable. Surprisingly, the scale restoration results still generally reached more than 98.5%.
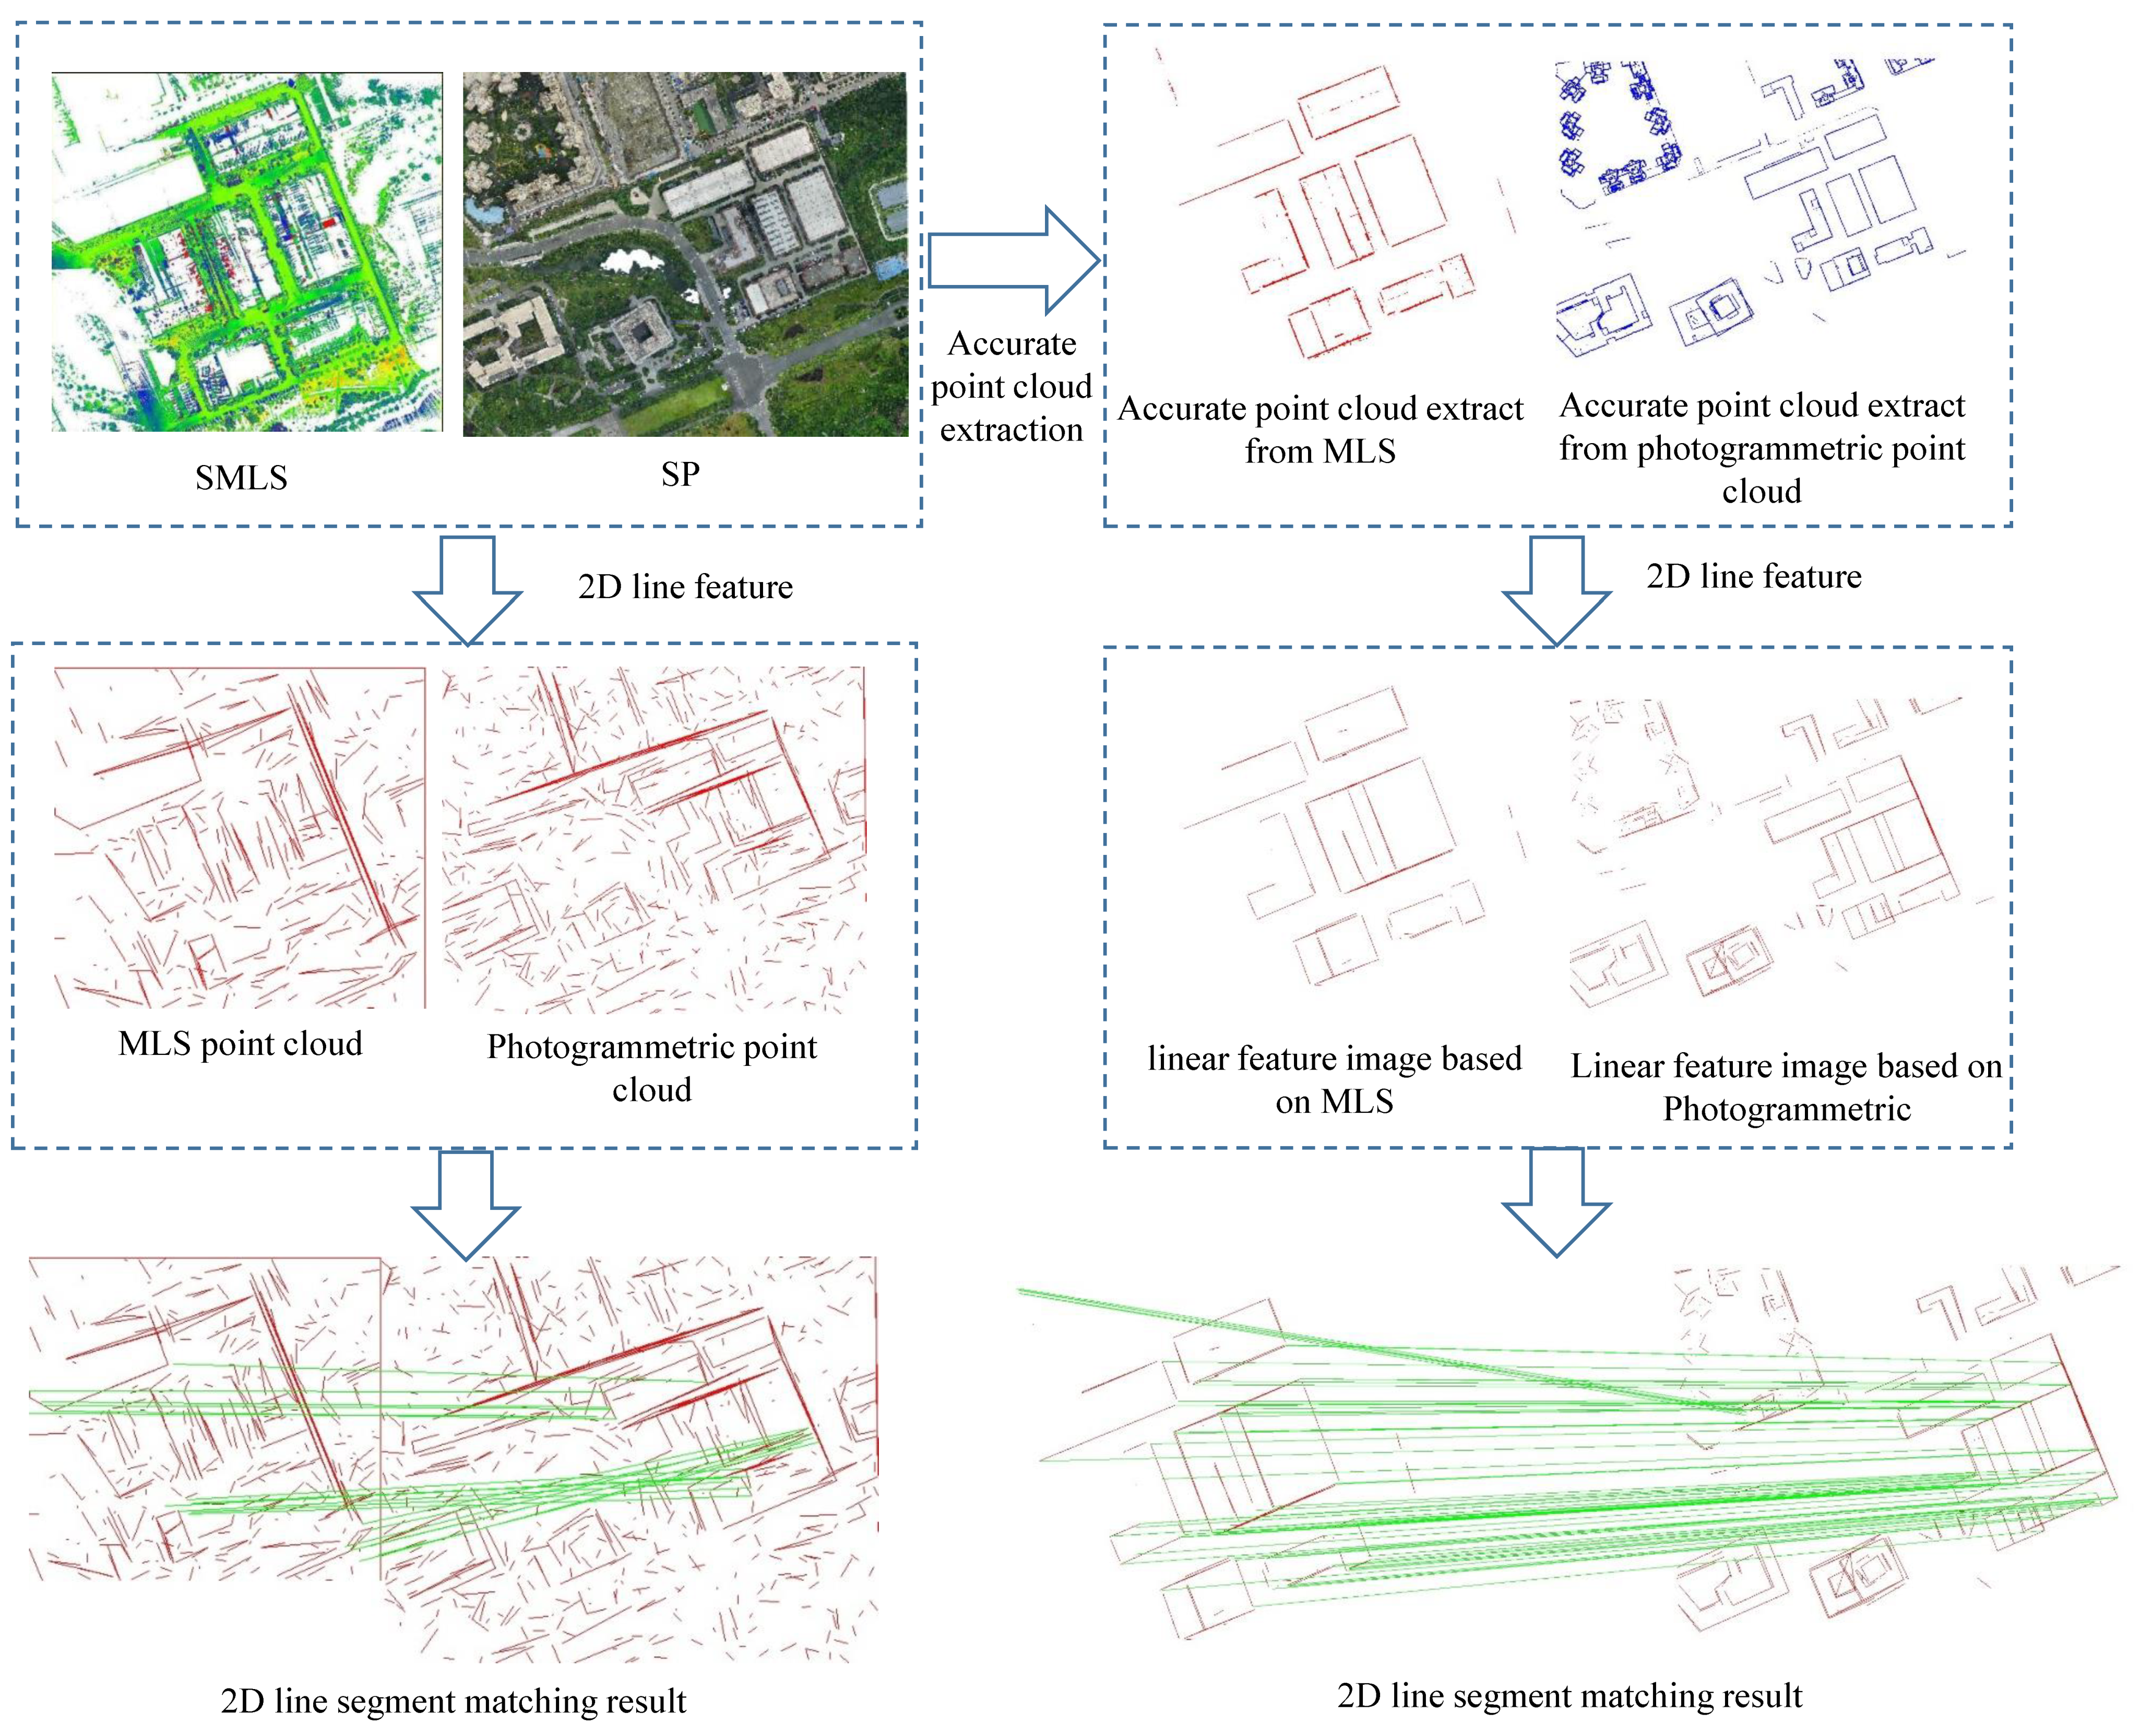
To facilitate the accuracy of the feature matching, the proposed method increases the role of the linear features present on the building outline to overcome the differences across the source point clouds. The effectiveness of this method was verified by the following quantitative experiment. In Figure 11, the left side shows the matching results of the directly extracted line features from the cross-source point cloud, while the right side uses the linear features extracted by our method for matching. It can be seen that the line features directly extracted from the original point cloud are irregular. Although a matching relationship was obtained during the similarity measurements, this relationship was clearly incorrect. Ultimately, reasonable and accurate matching results could not be obtained. On the other hand, by extracting the linear features of the building outline, the redundant information in the scene was effectively reduced, and the accuracy and effectiveness of the similarity measurements were significantly improved. The experimental statistics are shown in Table 3.
To quantitatively evaluate the accuracy of the cross-source point-cloud co-registration, we take the rotation error e r and the shift error e t as the evaluation criteria. For a selection of the point clouds to be registered, the target point cloud S = { s i } and the source point cloud V = { v i } , the scale factor λ, the rotation matrix R , and the translation matrix T are calculated through the registration process:
{ e r = a r c c o s t r ( R ¯ R ) 1 2 e t = T ¯ T
where R ¯ and T ¯ represent the true value of registration. Here, the true value was obtained through three independent manual interactive registration results to obtain the average value, thereby reducing the manual errors. The registration tasks were then divided into three groups: SP + SMLS, SP + SALS, and SMLS + SALS. We intended to compare the results of the proposed method with those of existing open-source mainstream algorithms, but due to the large differences in the coverage of the three source point clouds, it was difficult to obtain effective results by directly using the GICP algorithm or other open-source algorithms. Notably, even if we provided accurate initial registration through manual intervention, the results of the fine registration would still obtain the incorrect local optima. Table 4 shows the accuracy of the registration results obtained using the method proposed in this paper. Then, we manually cut the data range to make it more manageable in size and obtained good registration results under the GICP method. To better measure the effect of registration, the average distance of the nearest point between the two groups of point clouds and their MSE/RMSE errors were counted after registration. The results are shown in Table 5.

4.4. Discussion and Limitations

The characteristics of the proposed method and its possible limitations are discussed below.
(1)
Effective linear feature extraction and descriptions greatly reduce the influence of redundant information and errors in the registration process and overcome the important challenge of cross-source point-cloud registration, which involves a similar overall structure but significantly different details. In this method, similar linear features that lie on the building outline are highlighted to effectively improve the validity and robustness of the candidate features.
(2)
An automatic point-cloud scale-restoration method was developed. By using robust line feature extraction and similarity measurements of 2D line-segment groups, accurate corresponding feature mapping and 2D affine transformation were realized between the cross-source point clouds.
(3)
A cross-source point cloud automatic registration framework with strong applicability was designed and implemented. By extracting the principal structures and reducing the degrees of freedom, the complex registration process among the differentiated multi-source point clouds was decomposed into several independent and interrelated steps.
(4)
As a limitation, some mismatched feature pairs remained in the 2D line-segment group’s similarity measurement. Although no decisive interference was observed in our data set, there is no guarantee that the applicability of our algorithm will not be limited with a further increase in data diversity and differentiation.

5. Conclusions

In this paper, an effective co-registration method for cross-source point clouds was proposed, and a simplified point-cloud extraction method was introduced. This method can effectively simplify the scene and overcome noise, as well as extract similar linear features from building outlines taken from different sources. Subsequently, 2D line-segment-group matching and affine transformation were performed to restore the scale of the point cloud and align it on the horizontal plane. The incremental registration process effectively realized cross-source point-cloud co-registration.
Comprehensive experiments were carried out to evaluate the capabilities of the proposed method. The test results demonstrated that this method is suitable for cross-source point-cloud registration with significant differences. In the key areas where traditional registration methods have difficulty obtaining accurate results, the proposed method achieved good results. Nevertheless, the limitations of the proposed method require further investigation. Therefore, our future research focus will be to apply this approach to more complex cases.

Author Contributions

S.L. (Shiming Li) and X.G. conceived and designed this study; S.L. (Shiming Li), Z.W., and S.L. (Shengfu Li) operated the instruments and collected the data; S.L. (Shiming Li) implemented the methodology; X.G. and B.X. helped in software development; S.L. (Shiming Li) wrote the original draft; X.G. supervised this study; and all authors wrote the manuscript. All authors have read and agreed to the published version of the manuscript.

Funding

This research received funding from Key Science and Technology Project of Ministry of Transport of China (2020-MS5-147), the National Natural Science Foundation of China (No. 42071437, 41631174) and the Sichuan Science and Technology Program (No. 2020YFG0083).

Institutional Review Board Statement

Not applicable.

Informed Consent Statement

Not applicable.

Data Availability Statement

The data presented in this study are available on request from the corresponding author. The data are not publicly available due to privacy.

Conflicts of Interest

The authors declare no conflict of interest.

References

  1. Li, W.; Wang, C.; Zai, D.; Huang, P.; Li, J. A Volumetric Fusing Method for TLS and SFM Point Clouds. IEEE J. Sel. Top. Appl. Earth Obs. Remote Sens. 2018, 11, 3349–3357. [Google Scholar] [CrossRef]
  2. Torresan, C.; Berton, A.; Carotenuto, F.; Gennaro, S.; Gioli, B.; Matese, A.; Miglietta, F.; Vagnoli, C.; Zaldei, A.; Wallace, L. Forestry applications of UAVs in Europe: A review. Int. J. Remote Sens. 2017, 38, 2427–2447. [Google Scholar] [CrossRef]
  3. Wu, B.; Xie, L.; Hu, H.; Zhu, Q.; Yau, E. Integration of aerial oblique imagery and terrestrial imagery for optimized 3D modeling in urban areas. ISPRS J. Photogramm. Remote Sens. 2018, 139, 119–132. [Google Scholar] [CrossRef]
  4. Xiong, B.; Jancosek, M.; Elberink, S.O.; Vosselman, G. Flexible building primitives for 3D building modeling. ISPRS J. Photogramm. Remote Sens. 2015, 101, 275–290. [Google Scholar] [CrossRef]
  5. Berger, M.; Tagliasacchi, A.; Seversky, L.M.; Alliez, P.; Guennebaud, G.; Levine, J.A.; Sharf, A.; Silva, C.T. A Survey of Surface Reconstruction from Point Clouds. Comput. Graph. Forum 2016, 36, 301–329. [Google Scholar] [CrossRef] [Green Version]
  6. Zhang, J.; Lin, X. Advances in fusion of optical imagery and LiDAR point cloud applied to photogrammetry and remote sensing. Int. J. Image Data Fusion 2016, 8, 1–31. [Google Scholar] [CrossRef]
  7. Xie, L.; Zhu, Q.; Hu, H.; Wu, B.; Li, Y.; Zhang, Y.; Zhong, R. Hierarchical Regularization of Building Boundaries in Noisy Aerial Laser Scanning and Photogrammetric Point Clouds. Remote Sens. 2018, 10, 1996. [Google Scholar] [CrossRef] [Green Version]
  8. Ge, X. Automatic markerless registration of point clouds with semantic-keypoint-based 4-points congruent sets. ISPRS J. Photogramm. 2017, 130, 344–357. [Google Scholar] [CrossRef] [Green Version]
  9. Habib, A.; De Tchev, I.; Bang, K. A Comparative Analysis of Two Approaches for Multiple-Surface Registration of Irregular Point Clouds. In Proceedings of the 2010 Canadian Geomatics Conference and Symposium of Commission I, ISPRS Convergence in Geomatics—Shaping Canada’s Competitive Landscape, Calgary, AB, Canada, 15–18 June 2010. [Google Scholar]
  10. Zai, D.; Li, J.; Guo, Y.; Cheng, M.; Huang, P.; Cao, X.; Wang, C. Pairwise Registration of TLS Point Clouds using Covariance Descriptors and a Non-cooperative Game. ISPRS J. Photogramm. 2017, 134, 15–29. [Google Scholar] [CrossRef]
  11. Toschi, I.; Remondino, F.; Rothe, R.; Klimek, K. Combining Airborne Oblique Camera and Lidar Sensors: Investigation and New Perspectives. Int. Arch. Photogramm. Remote Sens. Spat. Inf. Sci. 2018, XLII-1, 437–444. [Google Scholar] [CrossRef] [Green Version]
  12. Huising, E.J.; Pereira, L.M.G. Errors and accuracy estimates of laser data acquired by various laser scanning systems for topographic applications. ISPRS J. Photogramm. Remote Sens. 1998, 53, 245–261. [Google Scholar] [CrossRef]
  13. Yan, L.; Tan, J.; Liu, H. Automatic Registration of TLS-TLS and TLS-MLS Point Clouds Using a Genetic Algorithm. Sensors 2017, 17, 1979. [Google Scholar] [CrossRef] [Green Version]
  14. Besl, P.J.; Mckay, N.D. A Method for Registration of 3-D Shapes. Proc. Spie Int. Soc. Opt. Eng. 1992, 14, 239–256. [Google Scholar] [CrossRef]
  15. Chen, Y.; Medioni, G. Object modelling by registration of multiple range images. Image Vis. Comput. 1992, 10, 145–155. [Google Scholar] [CrossRef]
  16. Censi, A. An ICP variant using a point-to-line metric. In Proceedings of the IEEE International Conference on Robotics and Automation, Pasadena, CA, USA, 19–23 May 2008. [Google Scholar]
  17. Koide, K.; Yokozuka, M.; Oishi, S.; Banno, A. Voxelized GICP for Fast and Accurate 3D Point Cloud Registration. In Proceedings of the 2021 IEEE International Conference on Robotics and Automation, Xi’an, China, 30 May–5 June 5 2021. [Google Scholar]
  18. Cheng, L.; Chen, S.; Liu, X.; Xu, H.; Wu, Y.; Li, M.; Chen, Y. Registration of Laser Scanning Point Clouds: A Review. Sensors 2018, 18, 1641. [Google Scholar] [CrossRef] [PubMed] [Green Version]
  19. Xie, L.; Hu, H.; Zhu, Q.; Wu, B.; Zhang, Y. Hierarchical Regularization of Polygons for Photogrammetric Point Clouds of Oblique Images. Int. Arch. Photogramm. Remote Sens. Spat. Inf. Sci. 2017, XLII-1/W1, 35–40. [Google Scholar] [CrossRef] [Green Version]
  20. Stamos, I.; Leordeanu, M. Automated Feature-Based Range Registration of Urban Scenes of Large Scale. In Proceedings of the IEEE Internal Conference of Computer Vision & Pattern Recognition, Madison, WI, USA, 18–20 June 2003. [Google Scholar]
  21. Yang, B.; Zang, Y.; Dong, Z.; Huang, R. An automated method to register airborne and terrestrial laser scanning point clouds. ISPRS J. Photogramm. Remote Sens. 2015, 109, 62–76. [Google Scholar] [CrossRef]
  22. Yang, B.; Dong, Z.; Zhao, G.; Dai, W. Hierarchical extraction of urban objects from mobile laser scanning data. ISPRS J. Photogramm. Remote Sens. 2015, 99, 45–57. [Google Scholar] [CrossRef]
  23. Wang, F.; Hu, H.; Ge, X.; Xu, B.; Zhong, R.; Ding, Y.; Xie, X. Multientity Registration of Point Clouds for Dynamic Objects on Complex Floating Platform Using Object Silhouettes. IEEE Trans. Geosci. Remote Sens. 2020, 59, 769–783. [Google Scholar] [CrossRef]
  24. Yang, B.; Zang, Y. Automated registration of dense terrestrial laser-scanning point clouds using curves. ISPRS J. Photogramm. 2014, 95, 109–121. [Google Scholar] [CrossRef]
  25. Cheng, L.; Wu, Y.; Chen, S.; Zong, W.; Yuan, Y.; Sun, Y.; Zhuang, Q.; Li, M. A Symmetry-Based Method for LiDAR Point Registration. IEEE J. Sel. Top. Appl. Earth Obs. Remote Sens. 2018, 11, 285–299. [Google Scholar] [CrossRef]
  26. Rabbani, T.; Dijkman, S.; Heuvel, F.; Vosselman, G. An integrated approach for modelling and global registration of point clouds —ScienceDirect. ISPRS J. Photogramm. 2007, 61, 355–370. [Google Scholar] [CrossRef]
  27. Zang, Y.; Yang, B.; Li, J.; Guan, H. An Accurate TLS and UAV Image Point Clouds Registration Method for Deformation Detection of Chaotic Hillside Areas. Remote Sens. 2019, 11, 647. [Google Scholar] [CrossRef] [Green Version]
  28. Cai, Z.; Chin, T.J.; Bustos, A.P.; Schindler, K. Practical optimal registration of terrestrial LiDAR scan pairs. ISPRS J. Photogramm. 2019, 147, 118–131. [Google Scholar] [CrossRef] [Green Version]
  29. Fan, B.; Wu, F.; Hu, Z. Line Matching Leveraged by Point Correspondences. In Proceedings of the 2010 IEEE Computer Society Conference on Computer Vision and Pattern Recognition, San Francisco, CA, USA, 13–18 June 2010. [Google Scholar]
  30. Vosselman, G.; Coenen, M.; Rottensteiner, F. Contextual segment-based classification of airborne laser scanner data. ISPRS J. Photogramm. 2017, 128, 354–371. [Google Scholar] [CrossRef]
  31. Nurunnabi, A.A.M.; Nasser, M.; Imon, A.H.M.R. Identification and classification of multiple outliers, high leverage points and influential observations in linear regression. J. Appl. Stats 2016, 43, 509–525. [Google Scholar] [CrossRef]
  32. Huang, Z. Extensions to the k-Means Algorithm for Clustering Large Data Sets with Categorical Values. Data Min. Knowl. Disc. 1998, 2, 283–304. [Google Scholar] [CrossRef]
  33. Gioi, R.G.V.; Jakubowicz, J.; Morel, J.M.; Randall, G. LSD: A Fast Line Segment Detector with a False Detection Control. IEEE Trans. Pattern Anal. Mach. Intell. 2010, 32, 722–732. [Google Scholar] [CrossRef]
  34. Lu, W.; Neumann, U.; You, S. Wide-Baseline Image Matching using Line Signatures. In Proceedings of the 2009 IEEE 12th International Conference on Computer Vision, Kyoto, Japan, 29 September–2 October 2009. [Google Scholar]
  35. Ferrari, V.; Fevrier, L.; Jurie, F.; Schmid, C. Groups of Adjacent Contour Segments for Object Detection. IEEE Trans. Pattern Anal. Mach. Intell. 2007, 30, 36–51. [Google Scholar] [CrossRef] [Green Version]
  36. Ge, X.; Hu, H. Object-based incremental registration of terrestrial point clouds in an urban environment. ISPRS J. Photogramm. 2020, 161, 218–232. [Google Scholar] [CrossRef]
  37. Dong, Z.; Yang, B.; Liang, F.; Huang, R.; Scherer, S. Hierarchical registration of unordered TLS point clouds based on binary shape context descriptor. ISPRS J. Photogramm. 2018, 144, 61–79. [Google Scholar] [CrossRef]
Figure 1. Cross-source point clouds have obvious differences in descriptions of the same building.
Remotesensing 13 02195 g001
Figure 2. The simplified point extracted from the MLS point cloud.
Remotesensing 13 02195 g002
Figure 3. Salience value calculations of the line-feature images.
Remotesensing 13 02195 g003
Figure 4. Line segment matching result for a 2D line-feature image from a cross-source point cloud.
Remotesensing 13 02195 g004
Figure 5. 2D alignment and height offset.
Remotesensing 13 02195 g005
Figure 6. Overview of the SWJTU data set cross-source point-cloud registration.
Remotesensing 13 02195 g006
Figure 7. Overview of the QEC data set cross-source point-cloud registration.
Remotesensing 13 02195 g007
Figure 8. Detailed display of the two magnified regions.
Remotesensing 13 02195 g008
Figure 9. Section display of the registration results.
Remotesensing 13 02195 g009
Figure 10. The four building edges used to compare scale restoration.
Remotesensing 13 02195 g010
Figure 11. The extraction of linear features improved the accuracy of feature matching.
Remotesensing 13 02195 g011
Table 1. Detailed description of the data set.
Data SetAbbreviationRange (m)PointsAverage Point Distance (m)
SWJTUSP1200 × 600659,318,7340.01
SALS1800 × 160012,710,4090.4
SMLS300 × 30022,456,0660.05
QECQP380 × 380140,513,2270.01
QALS300 × 3006,757,2910.08
Table 2. Comparison of building edge length before and after scale restoration.
Line1Line2Line3Line4
SMLS57.536638.4725105.655102.468
SP44.731830.324581.54878.8507
SP *57.593239.0434104.9948101.522
Δ l s c −0.0566−0.57090.66020.946
ρ s c 99.9%98.5%99.4%99.0%
Table 3. Statistics of the line-feature-matching results.
Data SetCandidate Line SegmentThe Number of MatchesCorrect MatchIncorrect Match
Original SMLS37312210
Original SP628
Simplify SMLS12135323
Simplify SP381
Table 4. The statistics of the rotational error and translation error of the co-registration results.
SMLS + SPSALS + SPSMLS + SALSQP + QALS
e r ( m ) 0.0150.320.240.29
e t ( d e g ) 0.030.090.120.08
Table 5. Statistics of the co-registration results after manual cutting.
Average Nearest Point DistanceMSERMSE
SP-SMLSGICP1.339546.38392.52664
Purposed method1.472636.318272.51362
QP-QALSCoarse registration3.256312.827871.68163
GICP0.948861.712691.3087
Purposed method0.3025160.6139330.783539
Publisher’s Note: MDPI stays neutral with regard to jurisdictional claims in published maps and institutional affiliations.