Article

Evaluating the Performance of Hyperspectral Leaf Reflectance to Detect Water Stress and Estimation of Photosynthetic Capacities

1
College of Horticulture & Forestry Sciences, Huazhong Agricultural University, Wuhan 430070, China
2
Hubei Engineering Technology Research Center for Forestry Information, Wuhan 430070, China
3
Key Laboratory of Horticultural Plant Biology (Ministry of Education), College of Horticulture and Forestry Science, Huazhong Agricultural University, Wuhan 430070, China
*
Author to whom correspondence should be addressed.
Remote Sens. 2021, 13(11), 2160; https://doi.org/10.3390/rs13112160
Submission received: 13 April 2021 / Revised: 17 May 2021 / Accepted: 26 May 2021 / Published: 31 May 2021
(This article belongs to the Section Forest Remote Sensing)

Abstract

:
Advanced techniques capable of early, rapid, and nondestructive detection of the impacts of drought on fruit tree and the measurement of the underlying photosynthetic traits on a large scale are necessary to meet the challenges of precision farming and full prediction of yield increases. We tested the application of hyperspectral reflectance as a high-throughput phenotyping approach for early identification of water stress and rapid assessment of leaf photosynthetic traits in citrus trees by conducting a greenhouse experiment. To this end, photosynthetic CO2 assimilation rate (Pn), stomatal conductance (Cond) and transpiration rate (Trmmol) were measured with gas-exchange approaches alongside measurements of leaf hyperspectral reflectance from citrus grown across a gradient of soil drought levels six times, during 20 days of stress induction and 13 days of rewatering. Water stress caused Pn, Cond, and Trmmol rapid and continuous decline throughout the entire drought period. The upper layer was more sensitive to drought than middle and lower layers. Water stress could also bring continuous and dynamic changes of the mean spectral reflectance and absorptance over time. After trees were rewatered, these differences were not obvious. The original reflectance spectra of the four water stresses were surprisingly of low diversity and could not track drought responses, whereas specific hyperspectral spectral vegetation indices (SVIs) and absorption features or wavelength position variables presented great potential. The following machine-learning algorithms: random forest (RF), support vector machine (SVM), gradient boost (GDboost), and adaptive boosting (Adaboost) were used to develop a measure of photosynthesis from leaf reflectance spectra. The performance of four machine-learning algorithms were assessed, and RF algorithm yielded the highest predictive power for predicting photosynthetic parameters (R2 was 0.92, 0.89, and 0.88 for Pn, Cond, and Trmmol, respectively). Our results indicated that leaf hyperspectral reflectance is a reliable and stable method for monitoring water stress and yield increase, with great potential to be applied in large-scale orchards.

1. Introduction

Agriculture worldwide accounts for up to 70% of the total consumption of water. Water demand for agricultural use in irrigation remains the largest source of consumption, and it will increase by 60% in 2025 [1]. Global warming is projected to increase evaporation and to reduce soil moisture [2], which will lead to increasing drought and food shortages. Consequently, climate change may exacerbate droughts, which may then set in more quickly, be more intense, and last longer [2,3]. Fruit trees, such as citrus, which are sensitive to droughts, are already showing decreased yields and poor tolerance to pests and stresses [4]. Photosynthesis is an important physiological activity in the growth process of green plants and, generally, limited by soil drought [5]. Photosynthetic efficiency is not just connected with potential yield increases, but it also influences efficiency of the use of resources such as water [6]. Drought often leads to low net photosynthetic rates [7]. Improvements in plant photosynthetic efficiency are expected to play a major role in the efforts to increase agriculture productivity [8,9,10]. An important reason for the insufficient exploration of the potential for changes to water use and photosynthesis for fruit yield forecast and quality improvements is the lack of appropriate high-throughput screening methods.
Further information on fruit trees’ responses to water stress at the large scale throughout the growth period can improve the efficiency of water use. Severe drought has been associated with regional-scale tree mortality and premature senility worldwide which leads to reductions in yields [11]. Moderate drought stress is a common method to induce flower buds in tropical and subtropical fruit trees. A moderate water shortage treatment can make trees enter reproductive growth as soon as possible and promote flowering for improving fruit quality and regulating the maturity period. In addition, plants can be irreversibly affected before visible symptoms of water stress appear [12]. Therefore, a pre-symptomatic or pre-visual detection of plant physiological changes is urgent for avoiding severe damages [13,14].
Physiologically, morphologically, and biochemically rapid changes were observable early in the drought treatment or slow change of those parameters after some time when green plants were under drought stress [15,16,17]. Measuring photosynthesis data is a challenge affected by heterogenetic environmental parameters such as soil moisture content [18]. Advancements in phenotyping techniques capable of rapidly assessing the effects of drought on plant photosynthetic responses are necessary to understanding plant traits under predicted future environmental conditions [19]. The functional responses that are associated with increased yield, such as improving photosynthetic productivity under stressful conditions, require new techniques to quantify this parameter, yet traditional methods rely on leaf sampling and analysis under laboratory conditions or using in-field gas-exchange systems [10,20]. This method can provide very precise photosynthetic information but is costly, time-consuming, and hard to accomplish, especially in citrus-growing mountainous areas.
Water deficit monitoring and yield estimations for citrus trees in large areas are critical. Laboratory methods for water stress and gas-exchange measurements are still cumbersome experimental techniques and are not suitable for large-scale monitoring in a period of short time [21,22]. Novel techniques are thus required to efficiently select for water stress and photosynthetic capacity [6]. Remote sensing communities have long used spectrum or spectral vegetation indices to estimate plant biochemical and morphological properties, which also presents huge potential in assessing photosynthetic capacity of plants quickly and non-destructively at different scales (ground, airborne, and satellite) [23,24,25]. Hyperspectral spectra, ranging from the visible over the near infrared to the intermediate infrared, can provide spectral features regarding differences in leaf metabolism, structure, and physiological and chemical traits in associated plant conditions [10,26,27,28,29]. It is popular to use hyperspectral reflectance to assess crop physiological and biochemical parameters. Nutritional status [30,31], chlorophyll or carotenoid contents [32,33,34], water content [35,36], heavy metal content [37], and species composition [38] in crops have been estimated using leaf reflectance spectrum. Application of hyperspectral spectra to assess plant function or physiology is complex, as the mechanisms linking spectra reflectance and emission to plant functional traits are not always clear or known [14]. Spectroscopy techniques coupled with deep-learning algorithms have also been used for leaf morphological and biochemical traits with the highest photosynthetic potential [10,39]. The photosynthetic capacity of crop plants has been evaluated based on leaf reflectance successfully using specific wavelengths or indices related to the photosynthesis status of the plants over a wide range of species [6,18,21,22,40,41,42,43,44]. Although further research on citrus is necessary, the macro- and micro-nutrient contents of citrus have successfully been predicted with leaf reflectance data [10]. Very few studies have focused on using leaf reflectance spectra to monitor the response of citrus leaves to water stress and estimate the photosynthetic capacity.
Citrus is the most widely cultivated fruit crop worldwide and also abundant within China. In the past 20 years, the citrus industry has developed rapidly around the world. The most outstanding research on citrus is related to molecular breeding, stress response, and post-harvest treatment. In this study, citrus leaves—more specifically, from lemon (Citrus limon) trees—were selected to comprise the experimental dataset. Measurements of leaf reflectance and photosynthesis were taken from a greenhouse experiment that included a factorial water stress applied to citrus trees. Using these data, we addressed the following questions: (1) How does water stress affect citrus physiology, leaf photosynthetic CO2 assimilation rate (leaf Pn), stomatal conductance (Cond), and transpiration rate (Trmmol)? (2) What is the variation in the leaf reflectance of citrus in different drought treatments? How do hyperspectral leaf reflectance records detect water stress? What is the key spectral information of selected citrus leaves responding to water stress? (3) Concerning the performance of machine learning algorithms, how does the machine-language algorithm perform in predicting the photosynthetic capacity of citrus leaves? The answers to these questions help to facilitate the spectral response of citrus to drought and photosynthesis prediction models. The selection of key spectral information is conducive to quantitative watering and fertilization on a larger scale for realizing high-efficiency utilization of water and fertilizer, so as to increase yield and quality.

2. Materials and Methods

2.1. Experimental Design

The study was conducted using lemon (Citrus limon) as the selected plant material at the greenhouse facility of Huazhong Agriculture university located in Wuhan, Hubei Province, China (113°41′–115°05′E, 29°58′–31°22′N). Wuhan is one of the largest cities on the upper and middle reaches of the Yangtze River in central China. The annual average temperature, mean annual relative humidity, precipitation, and annual average frost-free period are 16.9 °C, 77%, 1259 mm, and 240 days, respectively. A random block design was used in this study. Four-year-old lemon trees (Femminello) propagated by bud grafting to trifoliate orange rootstocks were used. These trees ranged in height from 2 to 2.5 m growing in 60 cm plastic pots containing potting mix of commercial medium and perlite (3:1). Trees in the greenhouse were exposed to natural variations in photoperiod throughout the experiment during the summer (from August to September) 2020. The soil moisture was controlled to approximately 35% (normal water supply), approximately 25% (mild stress), approximately 15% (moderate stress), and approximately 10% (severe stress) [45]. Each moisture level included 8 lemon trees. Trees apart from normal water supply were drought-stressed for 21 days in 6 August, 12 August, 18 August, 26 August, and then watered three times in 26 August, 4 September, and 9 September. After being rewatered, the soil moistures of the mild tress, moderate stress, and severe stress were consistent with the normal water supply. Three trees were randomly selected from each drought treatment, and two randomly selected leaves from the upper, middle, and lower layers of each selected trees were used for measuring photosynthetic and spectral-related parameters on 6 August (day 1), 12 August (day 7), 18 August (day 13), 26 August (day 20), 4 September (day 28), and 9 September (day 33). A representative branch was chosen first. The top 3–4 leaves were the upper layer, the middle position of the branch was the middle layer, and the bottom position of the branch was the lower layer (Figure 1).

2.2. Hyperspectral Measurement Processing

Under the natural light of a sunny day in the greenhouse, the spectral radiance of the lemon leaves was measured with a full-range hyperspectral PSR-3500 spectroradiometers by applying an artificial light. The FieldSpec collects data in the 350–2500 nm spectral range, with a resampled spectral resolution of 1 nm before 1006 nm and 3.5 nm after 1006 nm. Leaf radiance data were collected on the surface of the leaf at 2 positions per leaf using the leaf clip from mature leaves. Ten measurements were conducted in each leaf position to produce one mean spectral reflectance. Before each spectral measurement, a white surface plate was registered to calibrate the equipment and convert the digital number to a physical signal [10]. Leaf reflectance was computed as the ratio of leaf radiances relative to the radiance from the white reference panel [46].

2.3. Photosynthetic Measurement

Immediately after the spectral radiance scan, the selected leaf was placed into the leaf room of the LICOR 6400XT gas analyzer (LICOR Biosciences, Lincoln, NE, United States) with an attached red-blue light leaf chamber according to a reported method [47]. Measurements were initiated at a saturating light (1000 mmol m−2 s−1), a block temperature of 25 °C, and a flow rate of 500 mmol mmols−1. Leaf photosynthetic CO2 assimilation rate (Pn, μmol CO2 m−2s−1), leaf stomatal conductance (Cond, mol HO2 m−2s−1), and leaf transpiration rate (Trmmol, mmol HO2 m−2s−1) for each leaf were captured after an adjustment period of approximately 30 min.

2.4. Extraction of Vegetation Indices

A database of 20 narrow-band spectral vegetation indices (SVIs) (Table 1), which have shown potential for assessing attributes of vegetation parameters related to plant physiology, morphology, and biochemistry, were preselected for analysis. They simplified the interpretation of complex vegetation reflection characteristics based on the indirect relationship between plant physiological and structural parameters [14]. All of the data processing and calculations of the SVIs were performed in the Python 3.7 software package.
We also conducted 45 spectral absorption features and wavelength position variables acquired from leaf spectral reflectance (Table S1) to analyze the different stress level on lemon leaves. The red edge optical parameters from a plant spectrum between 670 and 780 nm are commonly used in analysis plant. In this paper, we used red edge position (REP) parameter, which is a wavelength position variable indicating biophysical and biochemical parameters of vegetation. The inverted-Gaussian (IG) model was used to extract the red edge optical parameters. The spectral shape of the red edge reflectance can be modeled as shown in Equation (1):
R ( λ ) = R s ( R s R 0 ) exp ( ( λ 0 λ ) 2 2 σ 2 )
where R(λ) is the leaf spectral reflectance at λ wavelength; R s   is the maximum spectral reflectance; R 0 and λ 0 are the minimum spectral reflectance and corresponding wavelength, respectively; λ is the wavelength; and σ2 is the Gaussian function variance parameter. The REP is calculated using Equation (2):
λ p = λ 0 + σ
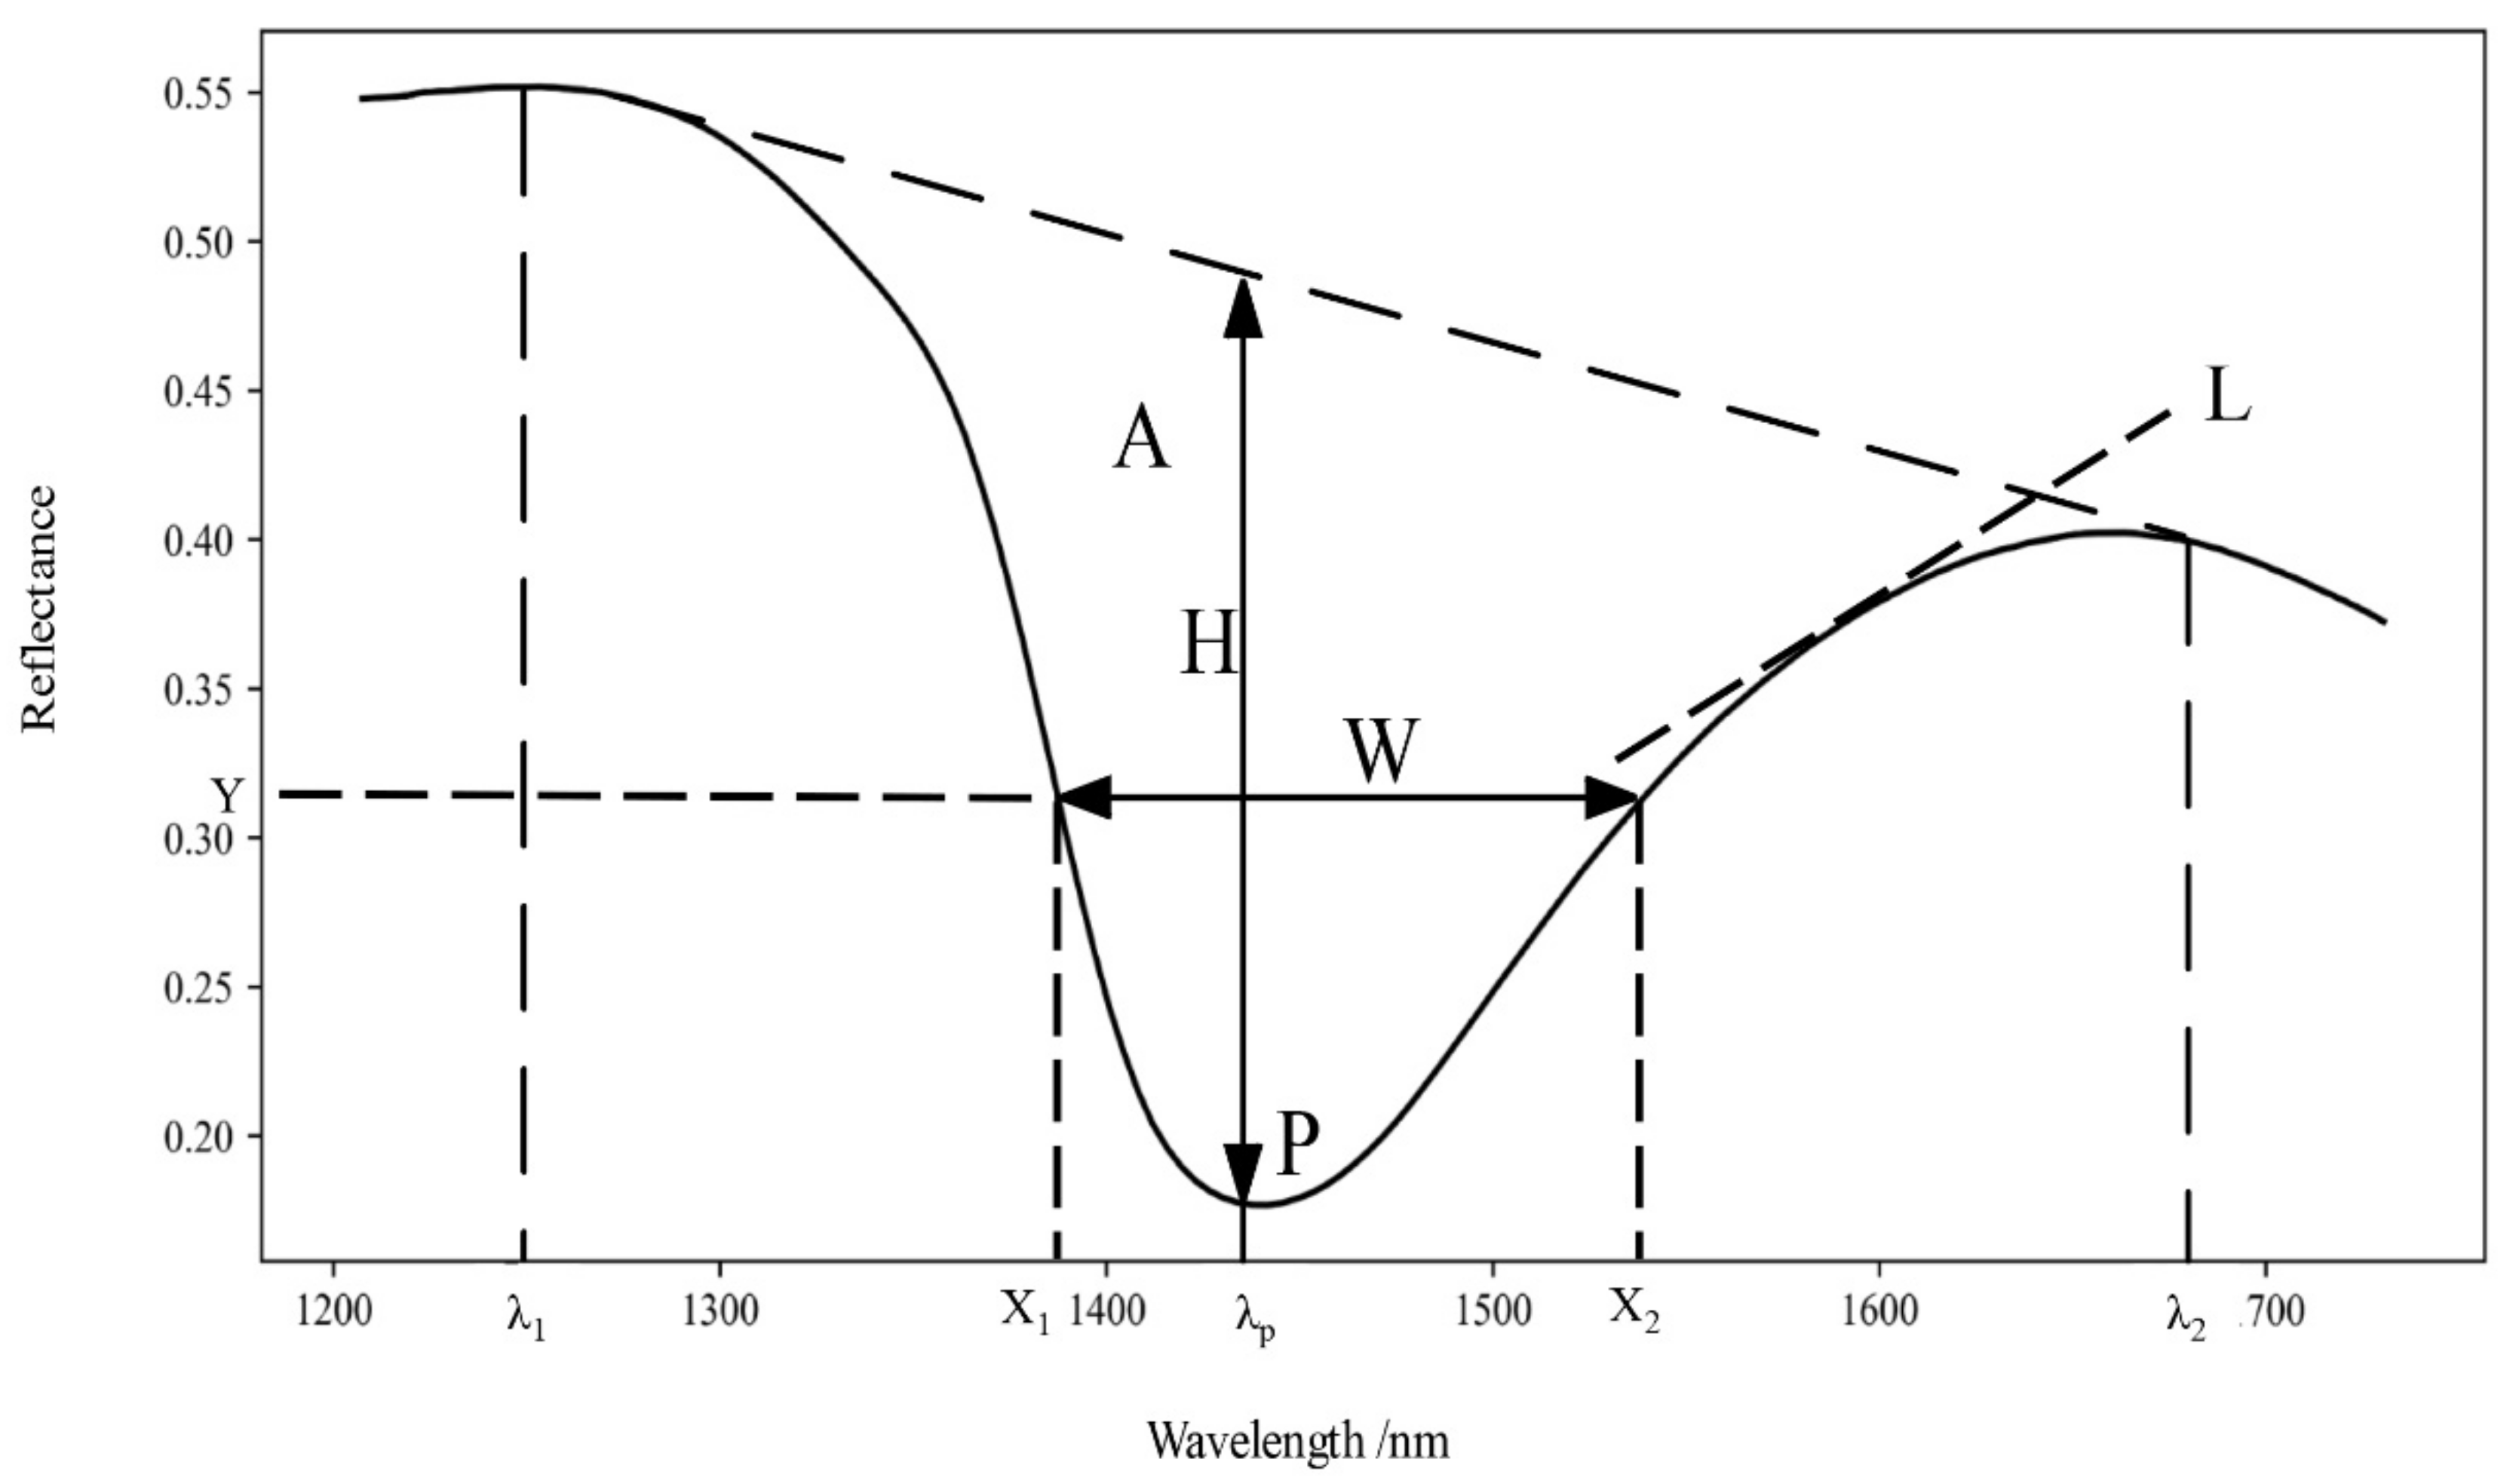
We also acquired the absorption features in 1230–1650 nm and 1800–2200 nm, as these two spectral ranges highly correspond to the water stress. The absorption features in a reflectance spectrum include wavelength position (nm), depth, width, area, asymmetry, and spectrum absorption index with a continuum removal procedure [62]. Figure 2 showed a part of typical spectrum (1200–1300 nm) of lemon leaf to illustrate the feature parameters. The absorption position (P) marks the wavelength at the deepest absorption. The width (W) defines the full-width at half maximum. X1 and X2 are the wavelengths of the left and right shoulder at the position of the full-width at half maximum. Δλ, which represents the value of W, is calculated by X2–X1. Y is the corresponding reflectance of X1 and X2. The absorption depth (DEP) is the depth of the feature minimum relative to the hull. The hull means no absorption feature appearance. The absorption area (Area) is the area of the absorption district. The asymmetry of an absorption feature is derived as the ratio of the left area (label A in Figure 2) of the absorption center to the right area of the absorption center. L is the tangent line, and the slope of L can be calculated. The spectrum absorption index (SAI) defines the absorption intensity, which was calculated as Equation (3):
S A I = d ρ λ 1 + 1 d ρ λ 2 ρ λ p
where λ 1 and λ 2 are shoulder wavelength, and ρ λ 1 and ρ λ 2 are the reflectance at corresponding wavelengths, respectively. The absorption position (P) marks the wavelength at the deepest absorption in the region of visible wavelength. λP is the corresponding wavelength (Figure 2). d   is the normalized weight, calculated as Equation (4):
d = λ p λ 1 λ 2 λ 1

2.5. ANOVA Analysis and Principal Component Analysis (PCA)

Prior to ANOVA analysis, all the data were tested for normality using the D’Agostino-Pearson omnibus test. A one-way ANOVA was performed to assess the effect of drought treatment to photosynthetic capacity and spectral parameters. Multiple mean comparisons (LSD test) among treatments were performed as a post hoc test after one-way ANOVA to investigate the differences between treatments. Differences in means were regarded as significant if the p- value was less than 0.05. In order to understand the difference of lemon leaf reflectance spectra of four drought treatments, PCA was conducted in Python 3.7 with the scikit-learn package [63]. Ten-fold cross-validation was used in this study.

2.6. Machine-Learning Algorithms

The random forest (RF), support vector machines (SVM), gradient boost (GDboost), and adaptive boosting (AdaBoost) methods were applied to estimate the Pn, Cond, and Trmmol value. The greenhouse measured data were randomly divided into training (70%) and testing (30%) data. The prediction metrics to evaluate the abovementioned algorithms were the coefficient of determination (R2), root-mean-squared error (RMSE), and mean absolute error (MAE), which were calculated from Equations (5)–(7). To determine the relationship between the predicted and measured values, the overall model is evaluated in the graph including linear regression and a 1:1 dash-line. All the algorithms were implemented in the scikit-learn package in Python 3.7 [63].
R 2 = 1 n i = 1 y i y i ^ 2 / n i = 1 y i y m 2
R M S E = n i = 1   y i y i ^ 2 / n  
M A E = 1 n i = 1 n y i y i ^
where y i ^ are the predicted values of Pn, Cond and Trmmol; yi are the measured values of Pn, Cond, and Trmmol in the greenhouse; and ym was the mean values of measured Pn, Cond, and Trmmol. N was the sample number of validations.
Ntree (i.e., to the number of variables) and Mtry (i.e., to the number of variables to randomly sample as candidates at each split) are two key parameters influencing the robustness of the RF algorithms [64]. These two parameters were often set as default values [65,66].
SVM uses a nonlinear kernel function to project input data onto a high dimensional feature space, where complex non-linear patterns can be simply represented [67]. The key to SVM is the kernel function. Low-dimensional space vector sets are usually difficult to divide. The best choice is to map them to high-dimensional spaces. The classification function of the high-dimensional space can be obtained by selecting the appropriate kernel function [68]. Gaussian radial basis kernel function of the form was applied in this study [69].
The boosting method establishes several basic estimators (a decision tree was used in this paper), each of which can learn to correct the prediction error of a prior model in the model sequence, such as the GDboost and Adaboost methods. The GDboost algorithm tries to match the residual error of the new predictor with the previous one, while the Adaboost algorithm corrects the unfitness of the training instance through the previous training. The main difference between GDboost and Adaboost was how they dealt with the underfitted values. The number of trees (ntree) and learning rate (learning rate) were tuned in AdaBoost and GDBoost models [70]. The ntree was tested from 50 to 500 stepped by 50, and the learning rate was tested from 0.5 to 1.0 stepped by 0.1. According to the value of R2, we found that in the Adaboost and GDboost models, the highest R2 was acquired when the ntree parameter was set to 150 and the learning rate was set to 0.9.

3. Results

3.1. Photosynthetic Response to Water Stress

The sensitivity of Pn, Cond, and Trmmol to water stress of the upper layer, middle layer, and lower layer were compared in drought treatment period (i.e., days 1, 7, 13, and 20) and rewatering period (i.e., days 28 and 33) (Figure 3, Tables S2 and S3). Comparing among soil water status from 35% (normal water supply) to 10% (severe drought) showed decreases in average Pn, Cond, and Trmmol in upper, middle, and lower layers during the drought treatment period. After rewatering at day 33, Pn, Cond, and Trmmol values for different water stresses were not significantly different. Pn, Cond, and Trmmol of normal water supply for the upper layer was significantly higher than other water stresses in the entire drought treatment time, whereas these values of severe drought were significantly lower than other water stresses. Photosynthetic changes for drought in the middle and lower layer were less sensitive than the upper layer. Pn, Cond, and Trmmol of moderate or severe drought were significantly lower than normal water supply, whereas these photosynthetic parameters were nearly non-significantly different for the mild drought compared to the normal water supply.

3.2. Variation in Leaf Reflectance Spectra for Different Water Stress and Tracking of Leaf Hyperspectral Reflectance to Water Stress

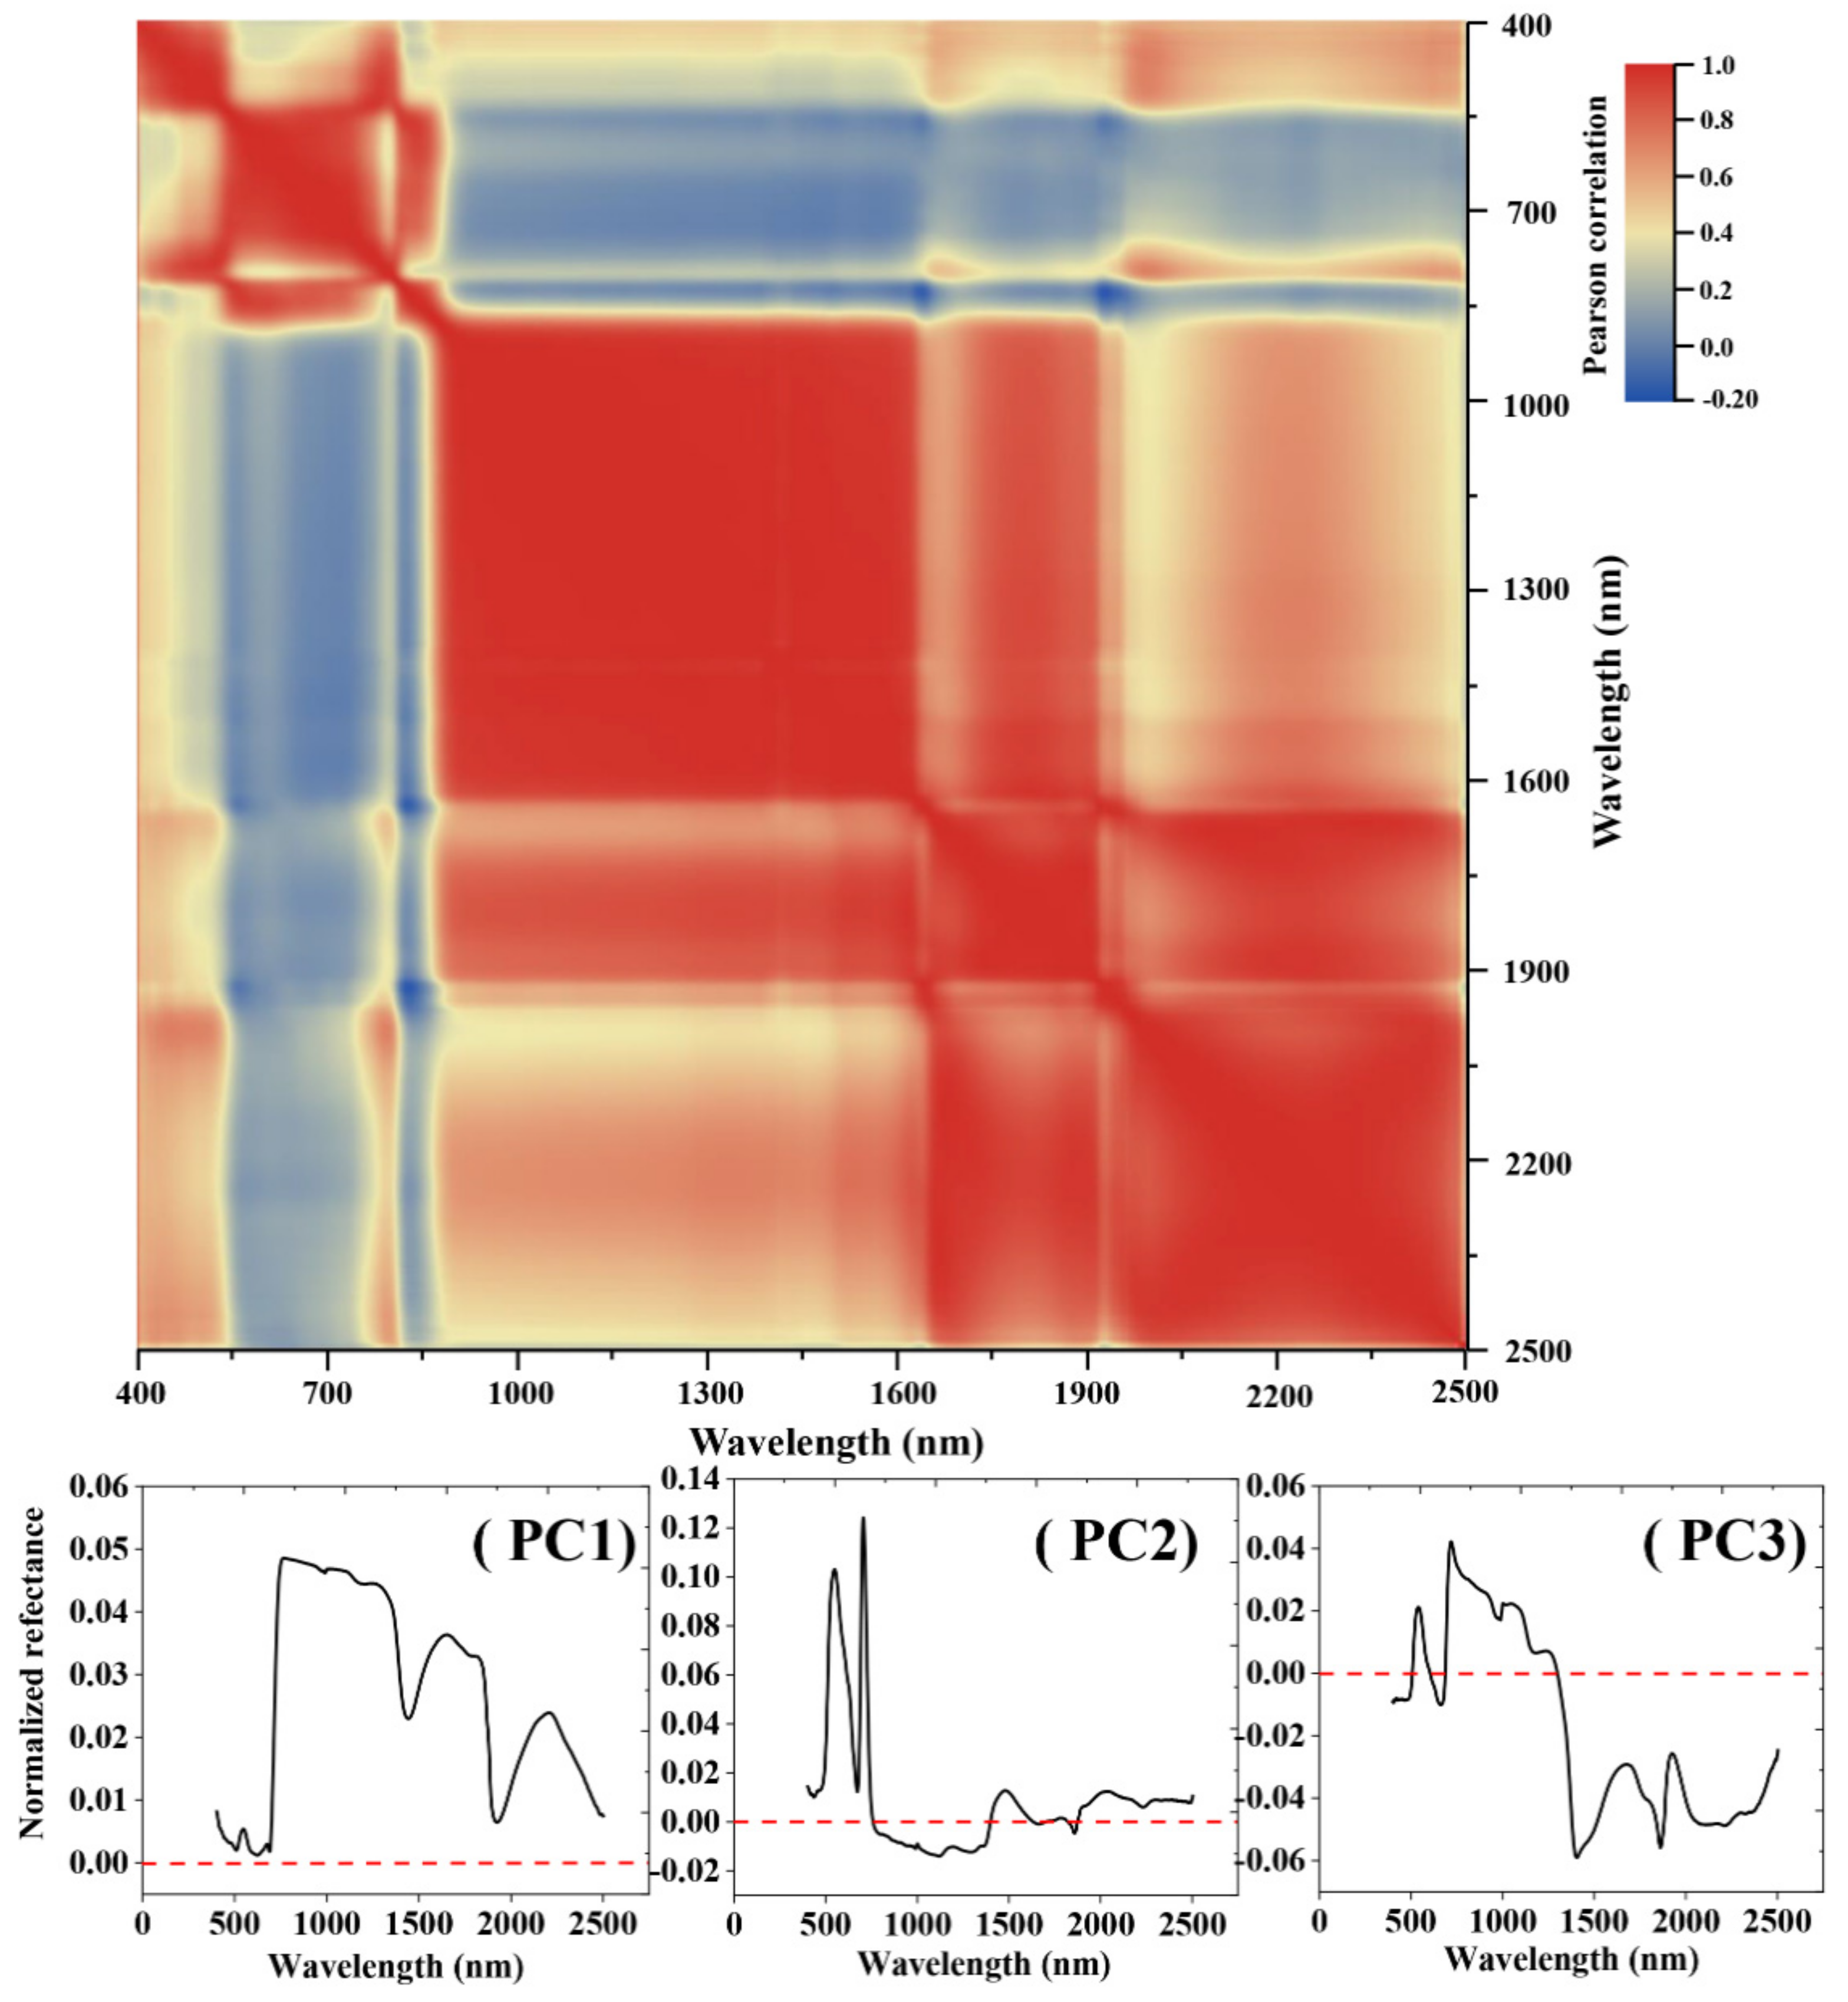
The spectra of four drought treatment were of low diversity, with a 97.55% variance contained in the first three principal components. The reason for this becomes apparent in the correlation matrix of the spectra (Figure 4). Five main independent wavelength ranges were identified, within which the measurements are closely related. Two correlated ranges are found in the visible spectrum (from approximately 400 to 480 nm and from 500 to 660 nm) and three in the infrared region (from approximately 720 to 1400 nm, from 1450 to 1800 nm, and from 1900 to 2500 nm). Three of them could be reflected in the three main components (Figure 4).
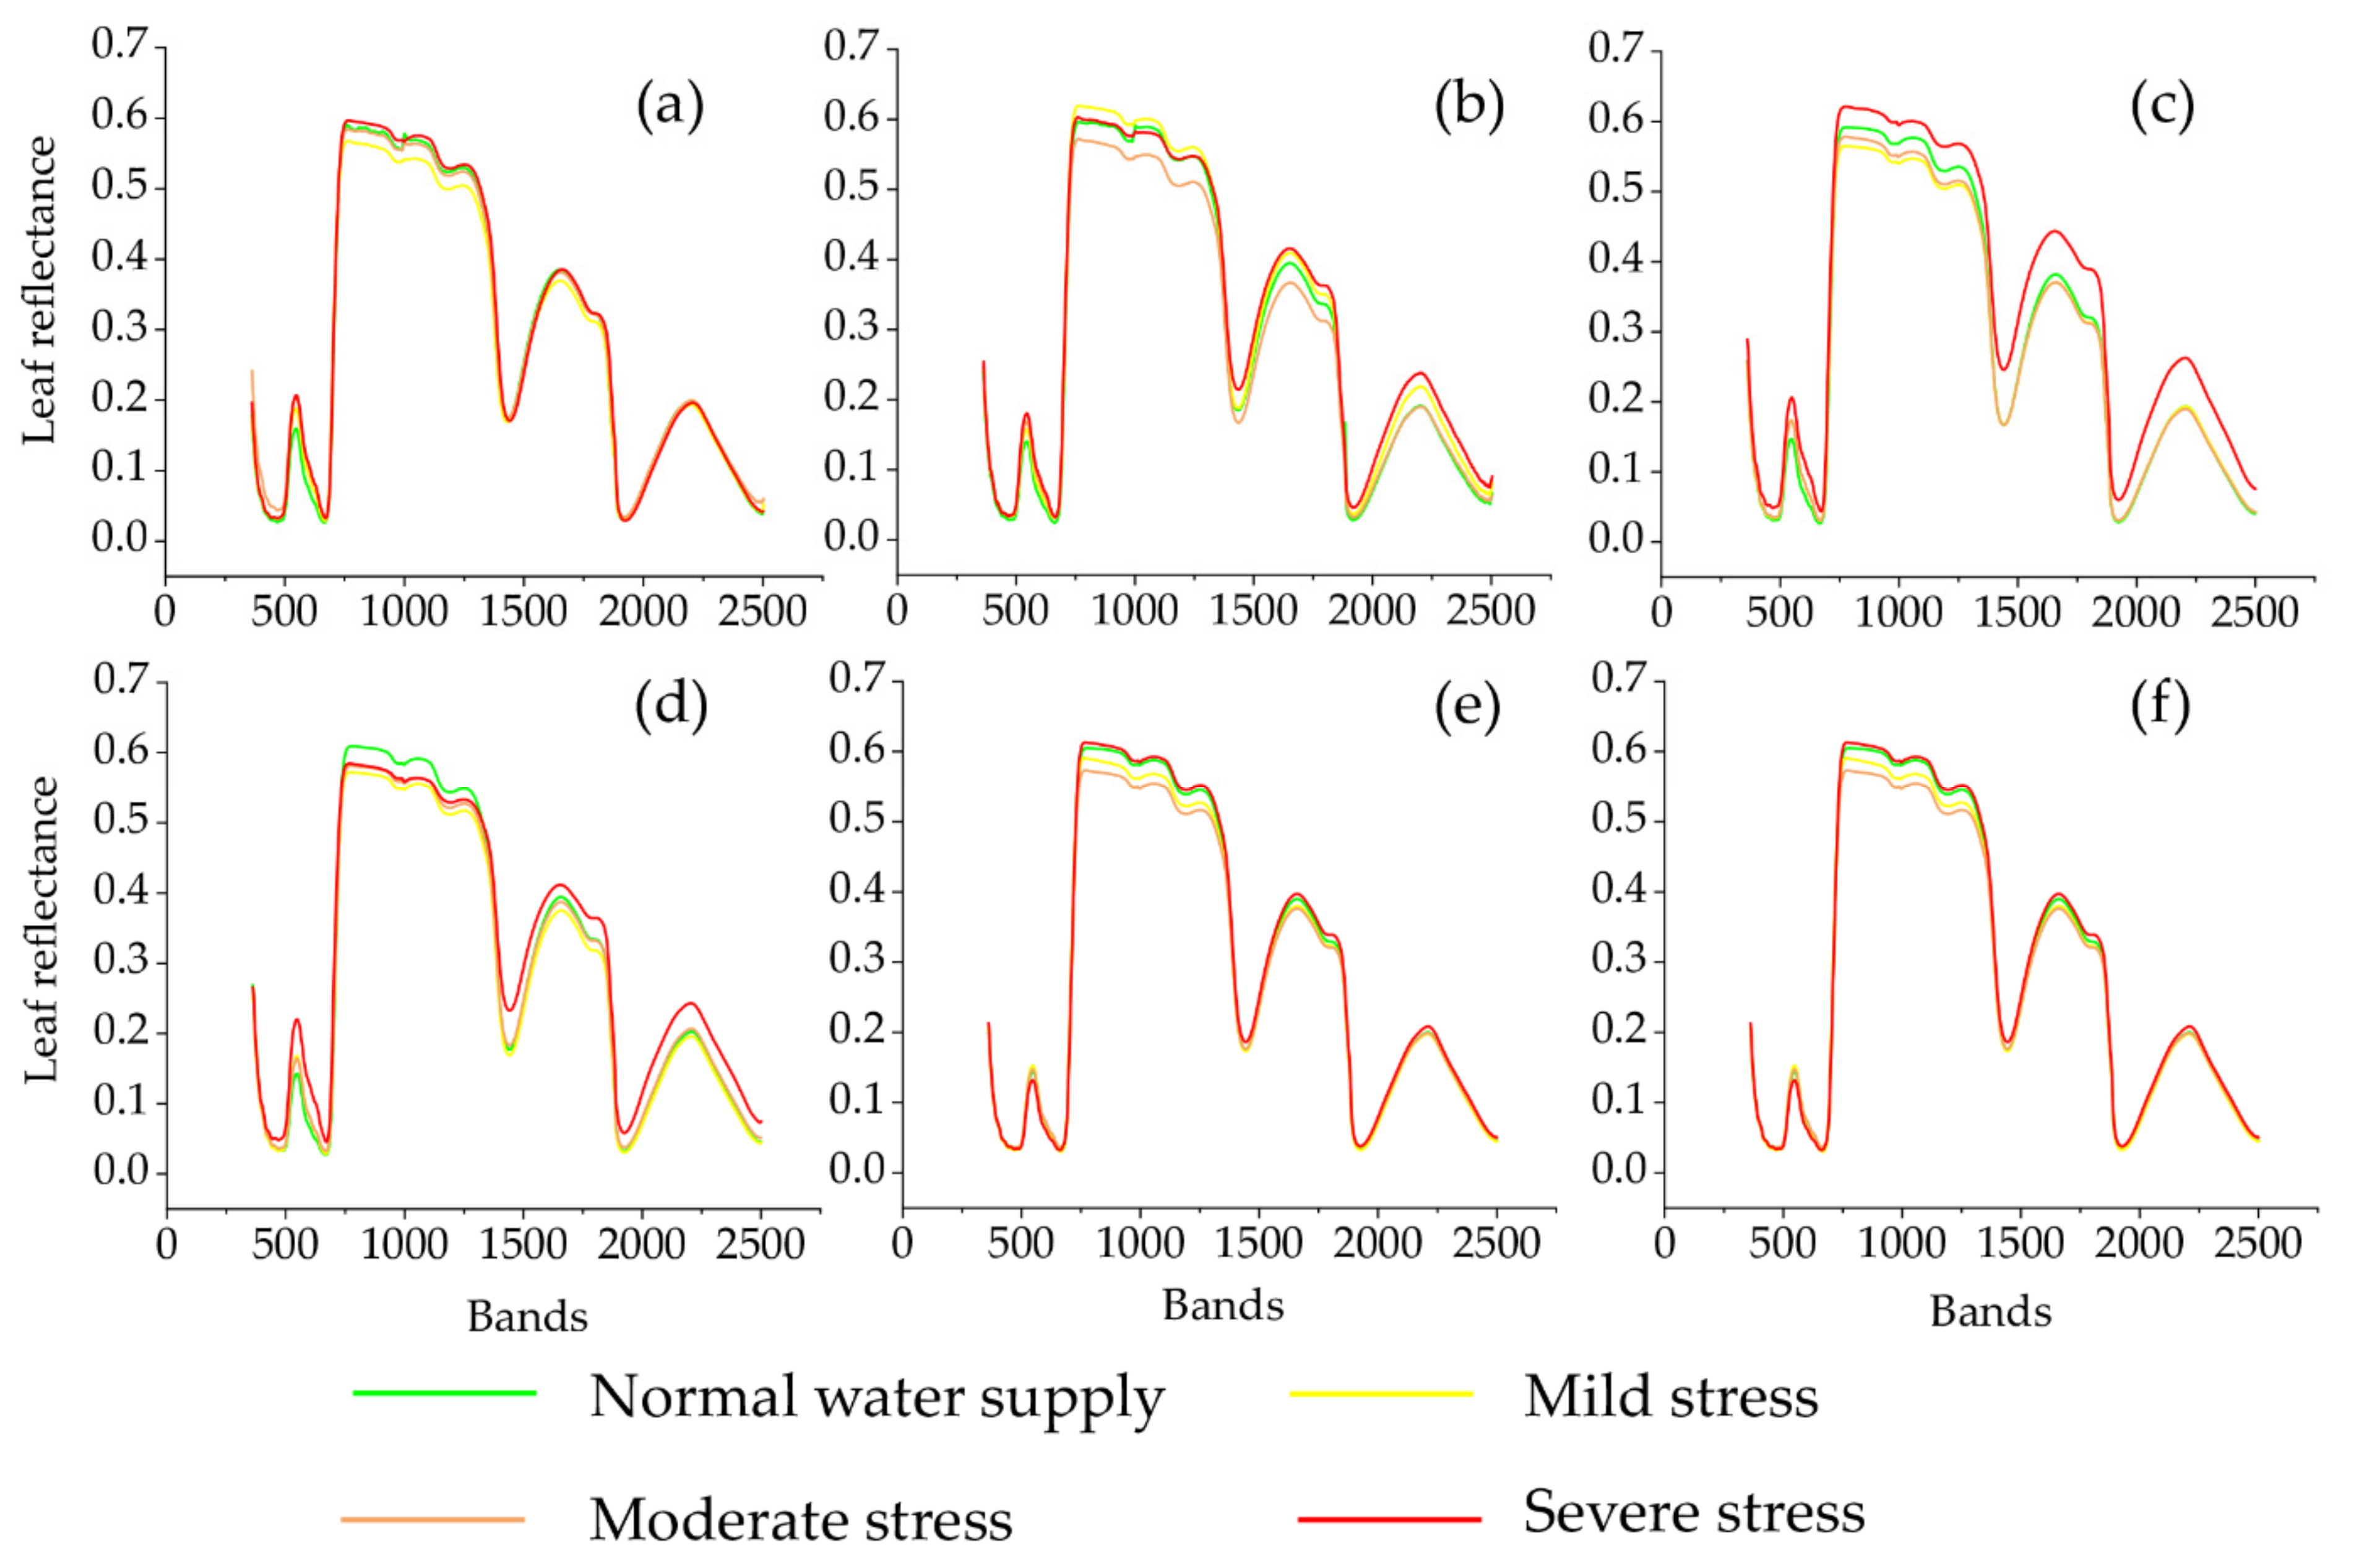
Water stress caused continuous and dynamic changes of the mean spectral reflectance and absorptance over time. After trees were rewatered, these differences were not obvious (Figure 5). From days 1 to 20, higher reflectance was observed in 700–1100 nm with the increase in drought treatment. At days 13 and 20, severe stress-treated leaves had lower absorbance values at 450 nm, and 640–680 nm was found, compared to other treatments. At about 1420–2500 nm, the reflectance of severe stress was the highest, and its curve was above those of other treatments obviously from days 7 to 20.
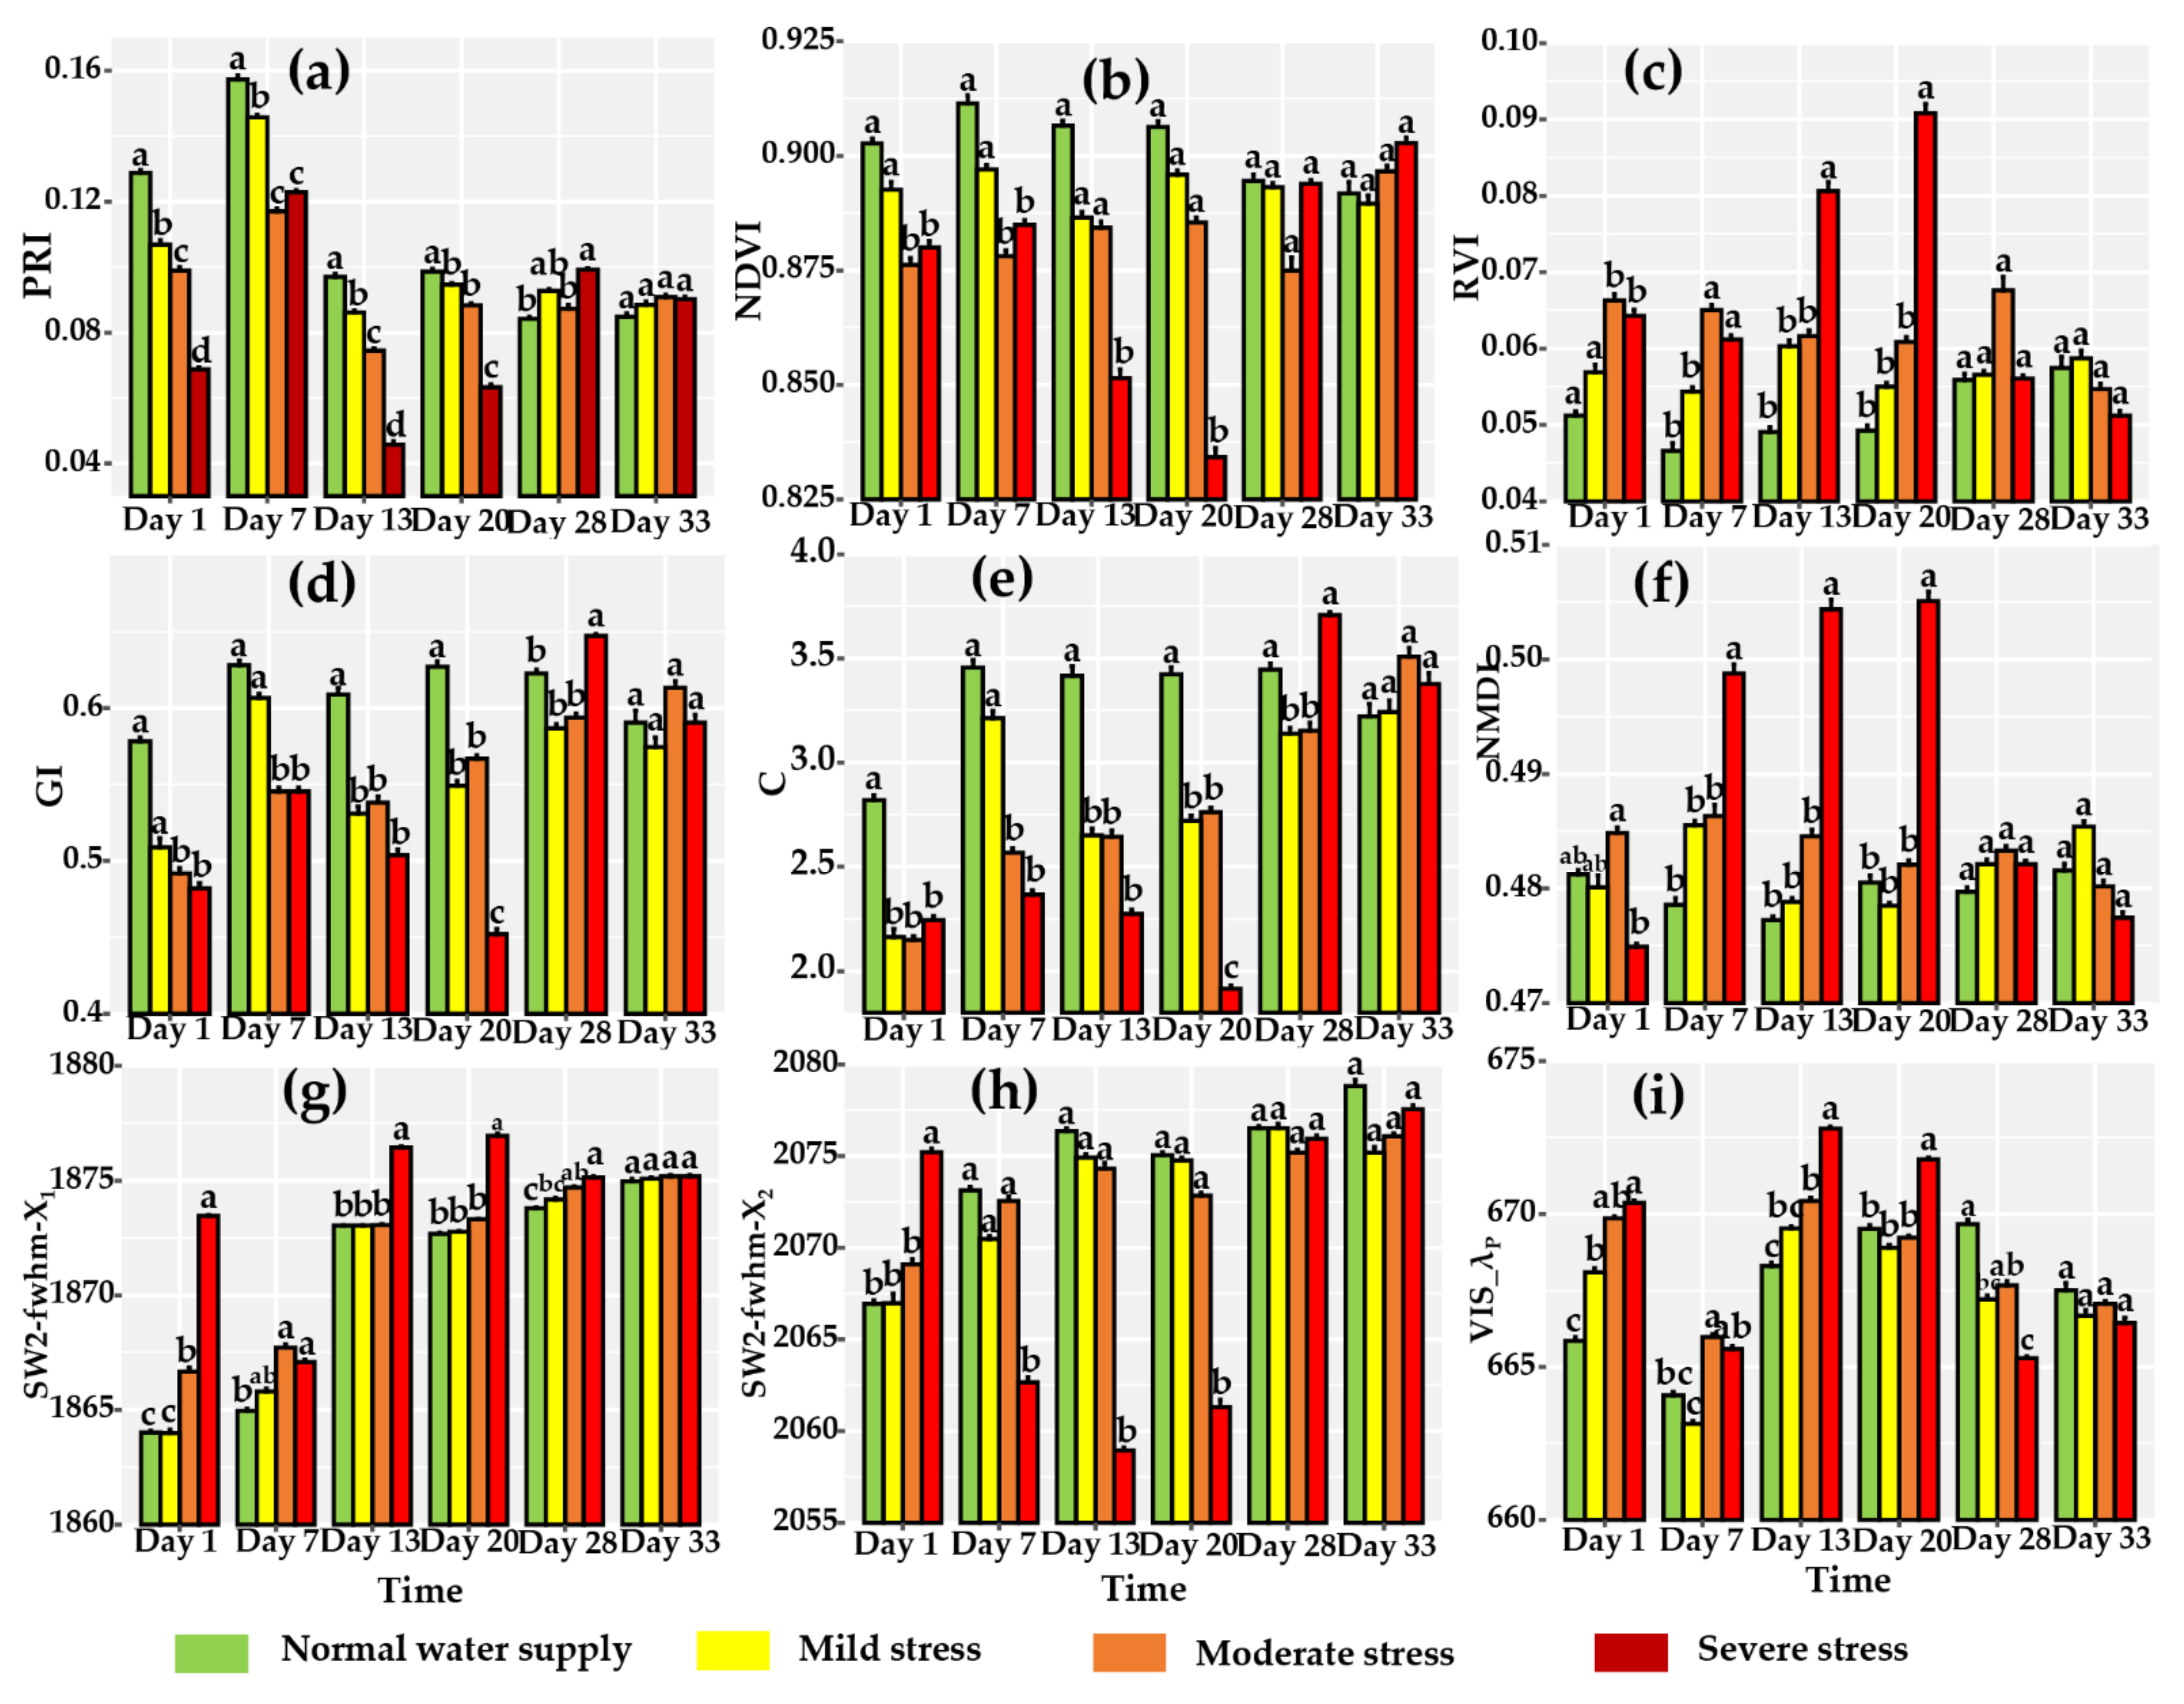
Eighteen hyperspectral parameters selected from 65 parameters presented significant difference among different water stresses. PRI, NDVI, RVI, GI, C, NMDI, VIS- λ p , SW1-fwhmX1, and SW1-fwhmX2 showed differences just after drought treatment. Especially, PRI was more sensitive to water stress than other hyperspectral parameters, and the values of different drought treatments had significant differences in the whole drought period. The PRI value of normal water supply was significantly higher than mild, moderate, and severe treatments (Figure 6a, Table S4). The NDVI and GI of the normal water supply and mild treatment were significantly higher than moderate and severe treatments at days 1 and 7 (Figure 6b,d, Table S4). RVI showed the opposite trend (Figure 6c). At days 13 and 20, NDVI and RVI for the severe treatment were significantly higher or lower than other treatments (Figure 6b,c, Table S4). The GI and C of the normal water supply were significantly higher than the other three drought treatments, and significant differences were not observed among the three drought treatments at day 13. At day 20, GI and C decreased with water stress obviously; however, there was not difference between the mild drought and moderate drought (Figure 6d,e). NMDI, VIS- λ p , SW1-fwhmX1, and SW1-fwhmX2 were effectively used to distinguish the severe drought treatment based on spectra from days 1 to 20 (Figure 6f–i, Table S4).
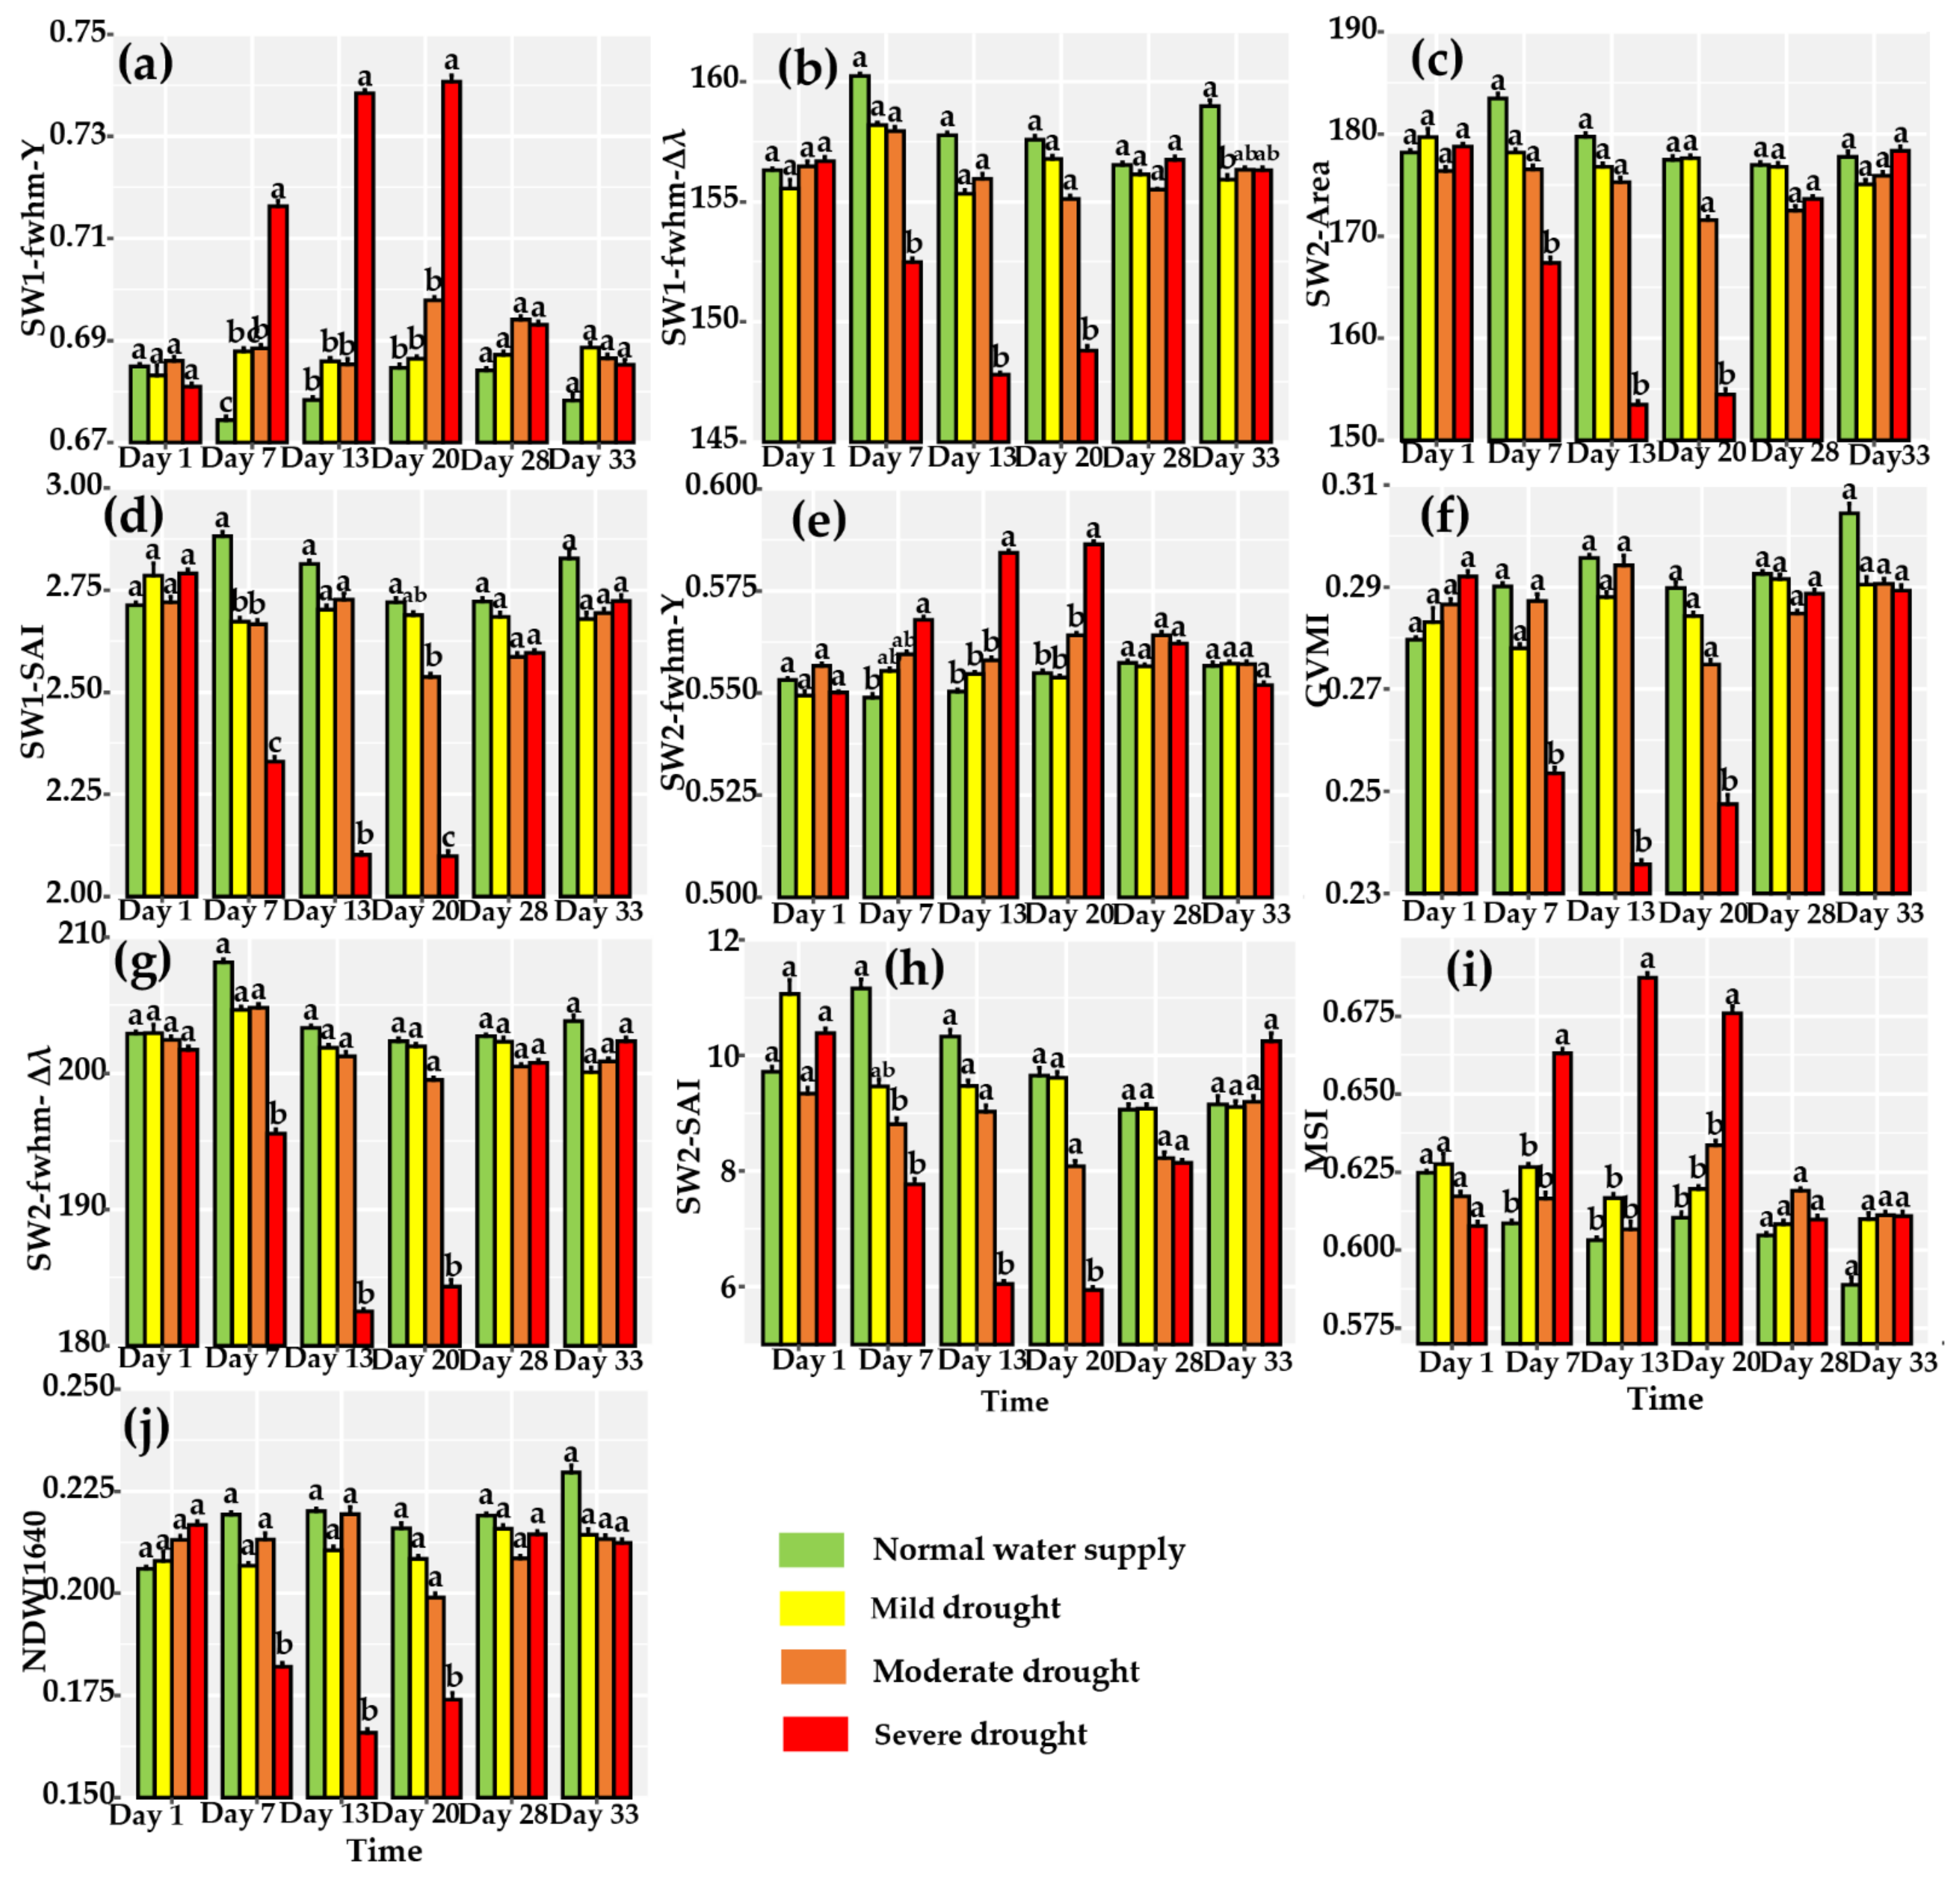
SW1-fwhm-Y, SW1-fwhm-Δλ, SW1-SAI, SW2-fwhm-Y, SW2-fwhm-Δλ, SW2-SAI, SW2-Area, MSI, NDWI1640, and GVMI were sensitive to severe drought treatment at days 7, 13, and 20. At these values of normal water supply, mild and moderate treatments were not significantly different (Figure 7, Table S5). The SW1-fwhmY, SW2-fwhm-Y, and MSI values of severe drought were significantly higher than the other three treatments, while SW1-fwhm-Δλ, SW1-SAI, SW2-fwhm-Δλ, NDWI1640, SW2-Area, SW2-SAI, and GVMI presented opposite trends (Figure 7, Table S5).
GI, CI730, CI709, CIG, NDRE, Rg, CARI, MCTI, PRI, VIS-λ2, VIS- λ p , VIS-Area, VIS-symmetry, VIS-slope, VIS-fwhm X1, VIS-fwhm-Δλ, SW1-λ1, SW2-λ1, SW2-slope, SW2-fwhm-X1, C, λ, λp, σ, and REP of the responses to drought lagged, and spectral variations in the different treatments could still be presented in the initial stage of rewatering (i.e., day 28), but great uncertainty occurred (Table 2 and Table S6).

3.3. Machine-Learning Algorithms to Predict Pn, Cond, and Trmmol

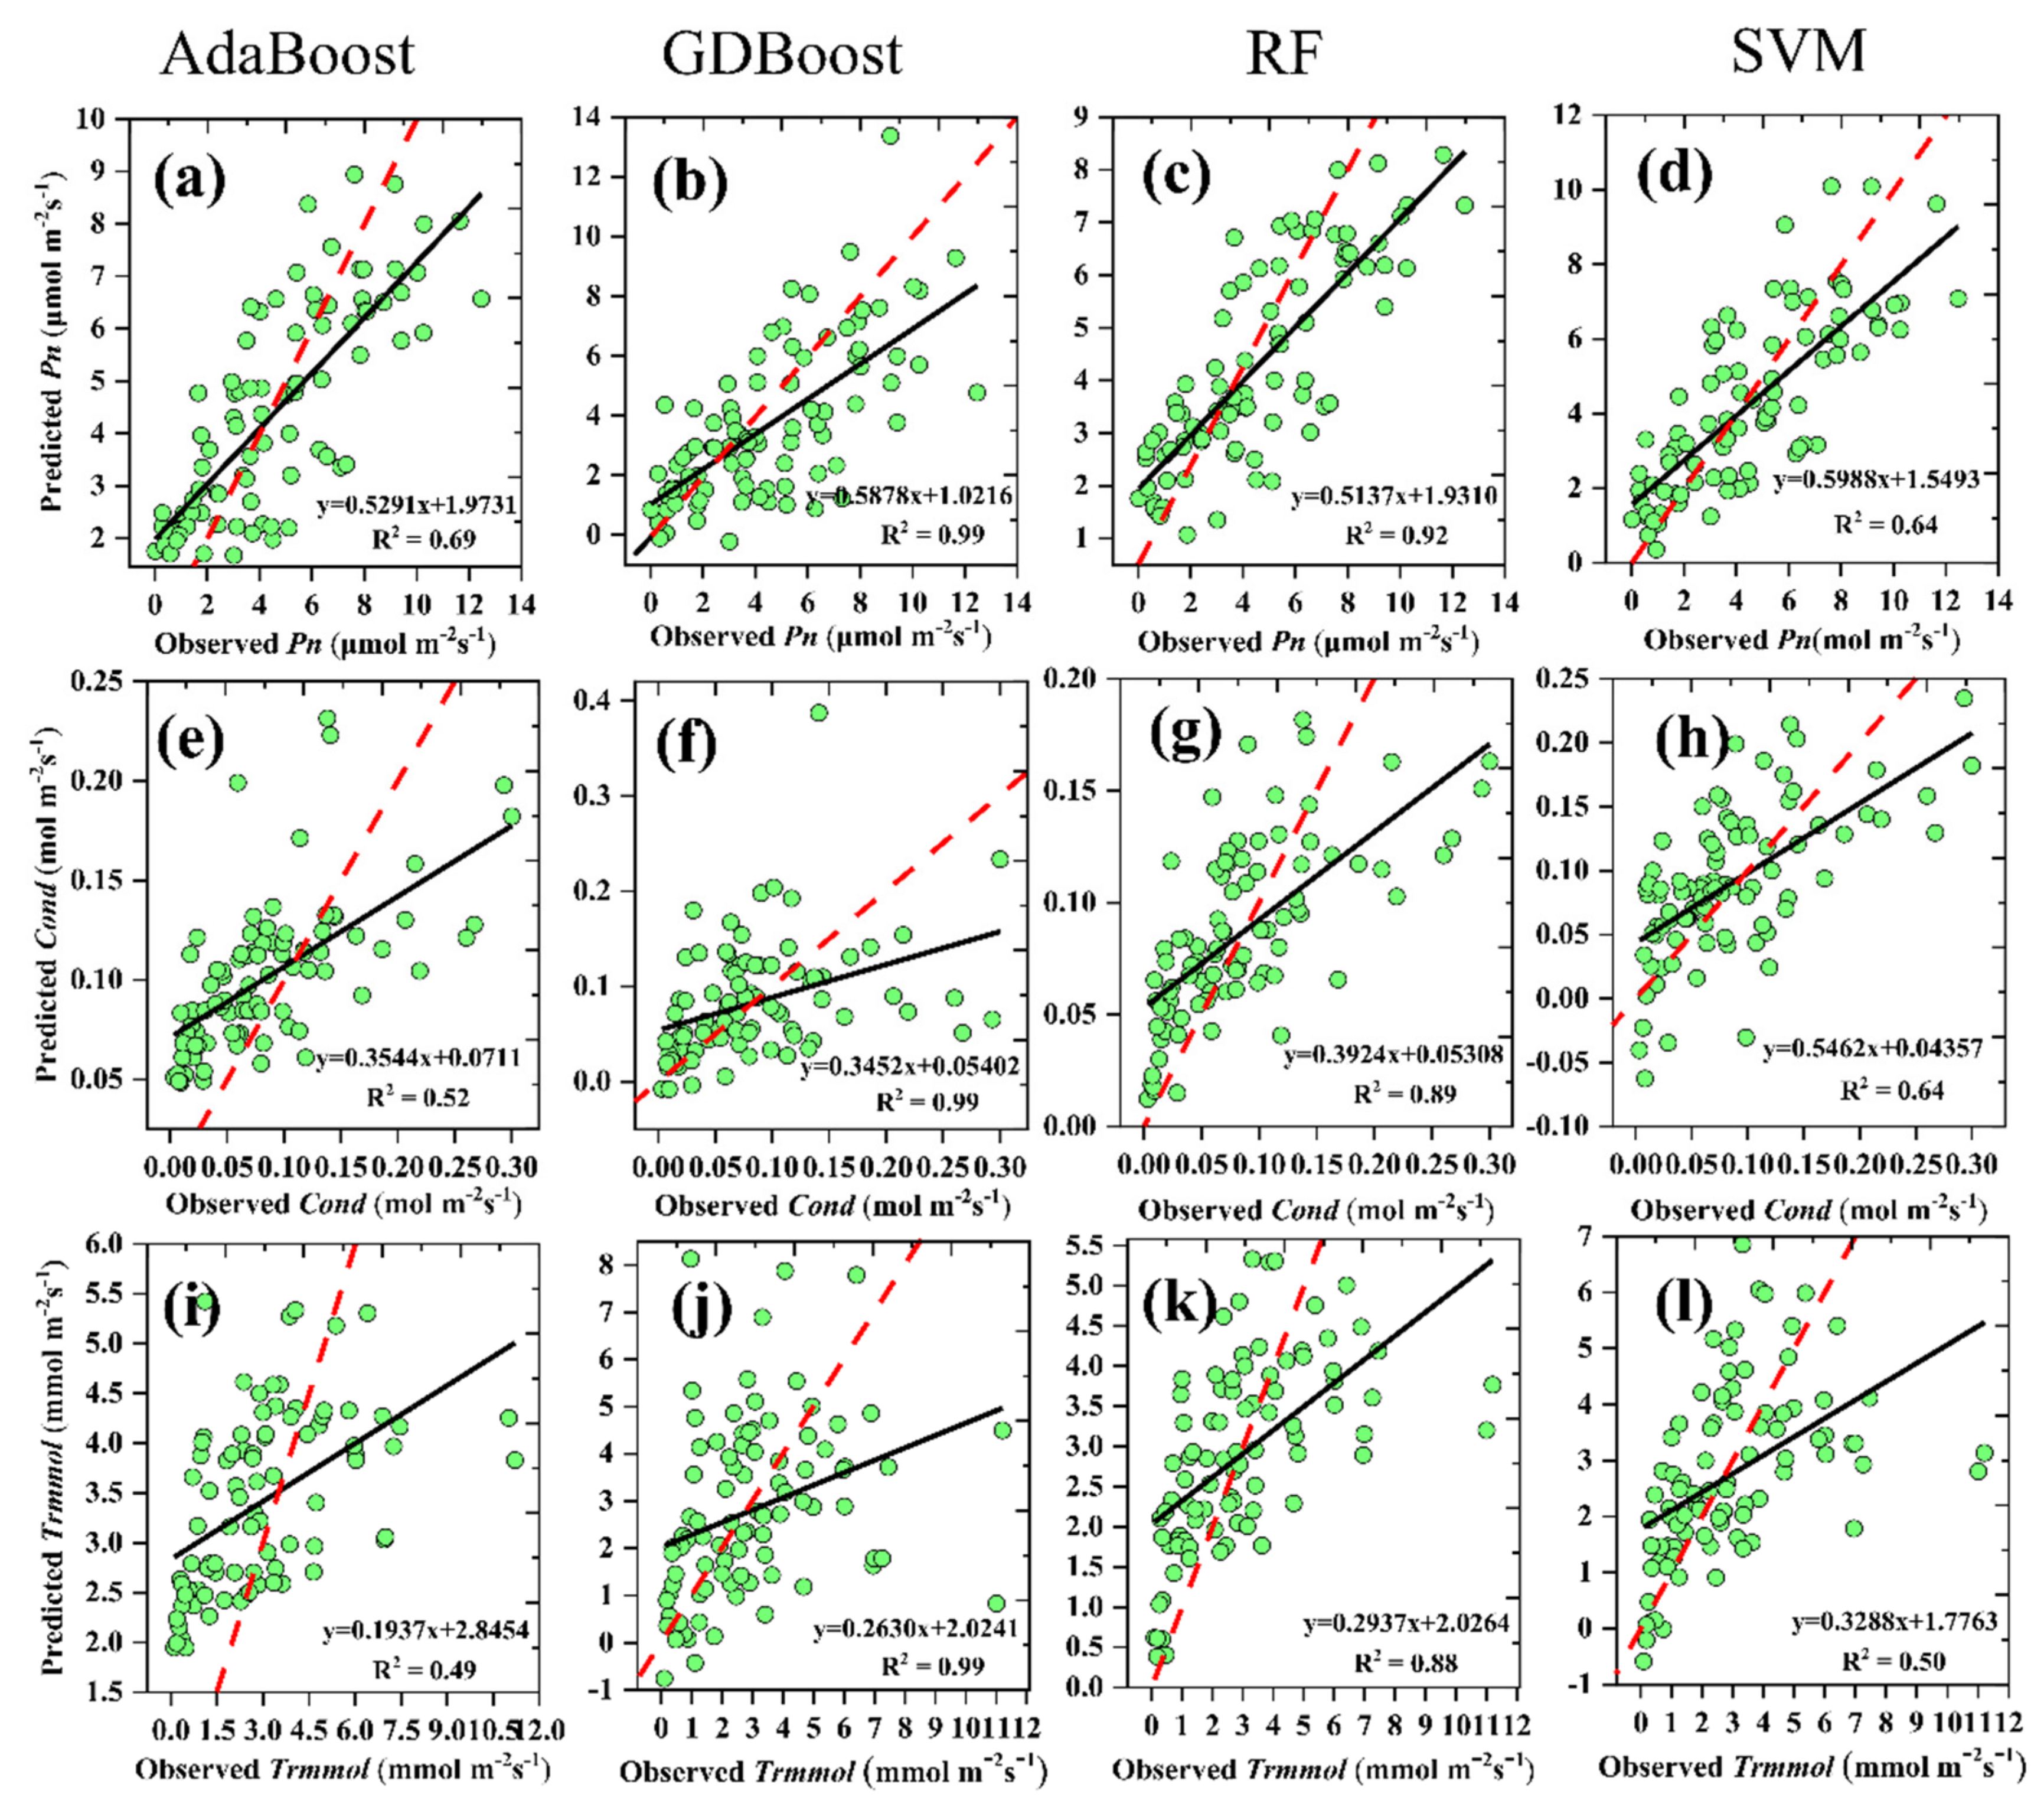
The photosynthetic parameters returned heterogeneous and non-parametric results for the analyzed leaves (Table 3). The analysis showed that Pn, Cond, and Trmmol had high variability and uniform distribution. This heterogeneous dataset is very useful for building prediction models using machine learning algorithms. Four machine-learning algorithms were applied to estimate the Pn, Cond, and Trmmol values of lemon leaves. A comparison of the four machine learning algorithms showed that RF demonstrated the best regression performance in terms of Pn, Cond, and Trmmol values. The R2 value ranged from 0.88 to 0.92, and the RMSEs were 1.86, 0.049, and 1.88 for Pn, Cond, and Trmmol, respectively. The AdaBoost achieved the second highest accuracy except for the Trmmol. In the AdaBoost regression models, R2 ranged from 0.49 to 0.69, and the RMSE were 1.84, 0.056, and 2.078 for Pn, Cond, and Trmmol. The SVM obtained a moderate performance and presented R2 values from 0.28 to 0.64 (Table 4).
To ascertain the relationship between observed and predicted Pn, Cond, and Trmmol, their regression values were plotted (Figure 8). For Pn, AdaBoost, GDboost, RF, and SVM presented similar trends to a 1:1 relationship (Figure 8a–d). For Cond and Trmmol, AdaBoost and GDboost did not show a similarity to a 1:1 relationship (dashed-line—Figure 8e,f,i,j). Predictions of RF and SVM were comparatively well related to the observed Pn, Cond, and Trmmol values (Figure 8c,d,g,h,k,l).

4. Discussion

Drought resistance is a combination of physiological and biochemical adaptations [71,72] that can be reflected in the plants’ spectral signature (Figure 5, Figure 6 and Figure 7) [73]. To understand the general properties and diversity of leaf reflectance spectra in different drought treatments, we estimated their distribution. The percentage of 97.55 of raw spectra for the three water stresses was contained in the first three principal components, which revealed a low and unexpected diversity of spectral properties. Five highly correlated band regions (from approximately 400 to 480 nm, from 500 to 660 nm, from approximately 720 to 1400 nm, from 1450 to 1800 nm, and from 1900 to 2500 nm) were identified. This feature of the spectra poses a challenge for the development of robust predictive models. Machine-learning algorithms may be urgent to predict photosynthetic characterization because of their advantages in solving multi-collinearity [74].
Hyperspectral technology can accurately obtain the fine spectral information of plants needed for accurately monitoring the growth, physiological, and biochemical characteristics of plants. Although using remote sensing to assess responses to drought is a very active topic of research, most studies to date have focused on estimating the biochemical and structural parameters related to water stress [14,16,75,76,77]. In this study, physiological and spectral responses to soil drought were assessed. For citrus, a significant decline in leaf Pn, Cond, and Trmmol was observed after trees suffered water stress (Figure 3, Tables S1 and S2). An effective and alternative method was provided to identify drought stress and its severity early in citrus trees. PRI, NDVI, RVI, GI, C, NMDI, VIS- λ p , SW1-fwhm-X1, and SW1-fwhm-X2 were effective in tracking continuous drought responses in citrus at the beginning of drought treatment when leaves did not show any morphological changes. Once drought stress occurs, leaves quickly close the stomata to reduce water loss, stomatal conductance, and transpiration [78].
Drought stress affects morphological characteristics such as leaf relative water content, leaf area, and leaf relative conductivity [79]. NDVI, RVI, GI, NMDI, SW1-fwhmX1, and SW1-fwhmX2 have indirect relationships to plant physiological and structural parameters such as water content and greenness [80]. Especially, PRI was a key remote sensing index, which was surprisingly more sensitive to an early plant water-stress stadium than traditional SVIs from beginning to end and can serve as a pre-visual and continuous water-stress indicator [81,82]. This result was contributed to by the fact that PRI was closely linked to photosynthetic process due to the faster changes in xanthophyll pigments comparing other SVIs under stress conditions [14]. Leaf stomatal closing responding to water stress was earlier than the change in leaf morphology and pigment. Water stress caused continuous and dynamic changes of spectral curves over time. After trees were rewatered, these differences were not obvious (Figure 5). PRI nearly presented the same response as photosynthetic parameters with water stress (Figure 3, Tables S1 and S2, and Figure 6a). In addition to photosynthesis and moisture reduction, the total soluble sugar, soluble protein, and starch content increased, whereas chlorophyll a and b content decreased significantly with the extension of the drought period [79]. SW1-fwhm-Y, SW1-fwhm-Δλ, SW1-SAI, SW2-fwhm-Y, SW2-fwhm-Δλ, SW2-SAI, SW2-Area, MSI, NDWI1640, and GVMI of severe drought were also significantly different than other water stress from the 7th day of drought treatment to the end (Figure 7). SW1 and SW2 was around approximately 1230–1650 nm and 1800–2200 nm, which were highly sensitive to leaf water content. Zovko et al [73] also showed that SWIR was effective in determining drought stress and its severity in grapevines. Drought led to the change of leaf water, cellulose, starch, and lignin content [17], which was linked to SW1 and SW2 [83]. Water deficits affect citrus physiology, and citrus exposed to drought stress had a higher amount of soluble sugar and a lower amount of starch. The accumulation of soluble sugar and proline indicates the possible role of these osmolytes in drought tolerance [17,84]. MSI, NDWI1640, and GVMI were measured approximately around 800 and 1600 bands, which were just related to starch and sugar. GI, CI730, CI709, CIG, NDRE, Rg, CARI, MCTI, PRI, VIS-λ2, VIS-abs, VIS-Area, VIS-symmetry, VIS-slope, VIS-fwhm X1, VIS-fwhm-Δλ, SW1-λ1, SW2-λ1, SW2-slope, SW2-fwhm-X1, C, λ, λ0, σ, and REP of the different treatments could still be presented in the initial stage of rewatering. They were related to content of xanthophyll, chlorophyll, carotenoid, sugar, and starch [80,83]. There was a process of plant recovery, and these indicators may reflect differences in the process of recovery from the drought conditions. It was proved that hyperspectral SVIs, spectral absorption, and wavelength position variables were effective in drought stress identification. Interestingly, most of the hyperspectral parameters could only distinguish severe drought from all water stresses, which was beneficial for monitoring the damage of severe drought to trees in citrus production.
To obtain a quantitative assessment of water stress and yield prediction, we systematically developed Pn, Cond, and Trmmol prediction models with high precision and evaluated the performance of a variety of models. This shed a new light on photosynthetic parameters estimation. In citrus, past studies on predicting the physiological traits of citrus mainly focused on nutrient or micronutrient content such as N, P, K, Mg, S, Cu, Fe, Mn, and Zn [10,85]. In this study, RF was the best predictor, followed by AdaBoost and SVM (Table 4). RF models had the highest R2 (0.92), and lower RMSE (1.86) and MAE (1.51). Random forest has been reported to bring high accuracy to the physiological traits in crops and forests [10,65]. RF has the advantage of modeling data in a non-linear and a non-parametric manner and solving the problem of multiple collinearities. Although SVM has the advantage of handling high-dimensionality data and does well with a limited training dataset [86], it performed poorly in comparison with RF in this study. GDboost exhibited severe overfitting and returned unreliable predictions, although the literature reported the GDBoost model performed better than RF when estimating forest coverage [87]. It may be concluded that GDBoost presented major flaws in modeling highly correlated hyperspectral data.
Thirty-two citrus trees were applied, and leaves at the upper layer, middle layer, and lower layer of 12 selected trees each time were measured for their photosynthetic capacity and spectral leaf spectral reflectance six times. Although the presented samples were used for evaluating the water stress and photosynthetic capacity of citrus leaves, it can be replicated with a larger sample size, and even better performances may be achieved. Furthermore, this study was obtained with a greenhouse experiment combined with proximal remote sensing and indicated that hyperspectral remote sensing provided critical narrow-band spectrum information and presented huge potential in evaluating growth status horticultural crop. More research in the future may be applied in hyperspectral data obtained with sensors embedded in remote sensing satellite or UAV-based systems and provided support for large area monitoring horticultural crop growth including water stress and photosynthetic capacity.

5. Conclusions

Non-destructive and rapid methods for accurate pre-visual water-stress detection and photosynthetic parameter estimation are necessary to yield both an increase and quality improvement in citrus. Photosynthetic parameters presented a significant decrease under water stress, and this trend was more obvious in the upper layer. The original reflectance spectra of the three drought treatments presented a low and unexpected diversity. PRI is more sensitive to an early plant water-stress stadium than traditional SVIs, interestingly, which can serve as a pre-visual, persistent, and stable water-stress indicator. Spectral absorption features in SW1 and SW2 regions, MSI, NDWI1640, and GVMI were useful for distinguishing severe drought treatment effectively. The photosynthetic rate could be estimated with the highest precision by applying hyperspectral leaf reflectance and RF models compared to SVM, AdaBoost, and GDBoost. To our knowledge, this is one of the first applications of hyperspectral parameters for proximal remote sensing as indicators for water stress and input for the retrieval of photosynthetic traits in citrus and provides a basis for extending the analysis to other observing platforms, such as unmanned aerial vehicle and satellite data for water condition monitoring and yield increasing quickly and precisely in large-scale orchards.

Supplementary Materials

The following are available online at https://www.mdpi.com/article/10.3390/rs13112160/s1, Table S1: 45 spectral absorption features and wavelength position variables acquired from leaf spectral reflectance. Table S2: One-way ANOVA test results of stomatal conductance (Cond, mol m−2s−1) of upper layer, middle layer, and lower layer in different water stress. The data was presented in the form of mean ± standard error, significant differences were indicated by different letters in the same column. Table S3: One-way ANOVA test results of leaf transpiration rate (Trmmol, mmol m−2s−1) of upper layer, middle layer, and lower layer in different water stress. The data was presented in the form of mean ± standard error, significant differences were indicated by different letters in the same column. Table S4: ANOVA results for the spectral parameters corresponding to Figure 6. SS: Sum of squares, DF: Degree of freedom; MS: Mean square. Table S5: ANOVA results for the spectral parameters corresponding to Figure 7. SS: Sum of squares, DF: Degree of freedom; MS: Mean square. Table S6: ANOVA results for the spectral parameters corresponding to Table 2. SS: Sum of squares, DF: Degree of freedom; MS: Mean square.

Author Contributions

J.-J.Z., proposed the idea, designed the experiment, organized the writing, and revised the paper. Y.-Y.D., supervised the work and analyzed the experimental data. Y.-H.Z., Z.-M.H., X.-Y.L. and Y.-F.J., measured all photosynthetic and spectral data. C.-G.H., provided citrus trees as experimental materials and helped to design experiments. All authors have read and agreed to the published version of the manuscript.

Funding

This research was funded by the national key research and development plan (Grant number, 2019YFD1000104) and project 2662020YLPY020 supported by the fundamental research funds for the central university. This study was also supported by national natural fund project (Grant number, 31901963).

Conflicts of Interest

The authors declare no conflict of interest.

References

  1. Boretti, A.; Rosa, L. Reassessing the projections of the World Water Development Report. npj Clean Water 2019, 2, 15. [Google Scholar] [CrossRef]
  2. Samaniego, L.; Thober, S.; Kumar, R.; Wanders, N.; Rakovec, O.; Pan, M.; Zink, M.; Sheffield, J.; Wood, E.F.; Marx, A. Anthropogenic warming exacerbates European soil moisture droughts. Nat. Clim. Chang. 2018, 8, 421–426. [Google Scholar] [CrossRef]
  3. Trenberth, K.E.; Dai, A.; van der Schrier, G.; Jones, P.D.; Barichivich, J.; Briffa, K.R.; Sheffield, J. Global warming and changes in drought. Nat. Clim. Chang. 2014, 4, 17–22. [Google Scholar] [CrossRef]
  4. Morgan, K.T.; Barkataky, S.; Kadyampakeni, D.; Ebel, R.; Roka, F. Effects of Short-term Drought Stress and Mechanical Harvesting on Sweet Orange Tree Health, Water Uptake, and Yield. Hortscience 2014, 49, 835–842. [Google Scholar] [CrossRef] [Green Version]
  5. Zhu, X.-G.; Long, S.P.; Ort, D.R. What is the maximum efficiency with which photosynthesis can convert solar energy into biomass? Curr. Opin. Biotechnol. 2008, 19, 153–159. [Google Scholar] [CrossRef]
  6. Heckmann, D.; Schlueter, U.; Weber, A.P.M. Machine Learning Techniques for Predicting Crop Photosynthetic Capacity from Leaf Reflectance Spectra. Mol. Plant 2017, 10, 878–890. [Google Scholar] [CrossRef] [Green Version]
  7. Xiao, M.; Li, Y.; Lu, B. Response of Net Photosynthetic Rate to Environmental Factors under Water Level Regulation in Paddy Field. Pol. J. Environ. Stud. 2019, 28, 1433–1442. [Google Scholar] [CrossRef]
  8. Ort, D.R.; Merchant, S.S.; Alric, J.; Barkan, A.; Blankenship, R.E.; Bock, R.; Croce, R.; Hanson, M.R.; Hibberd, J.M.; Long, S.P.; et al. Redesigning photosynthesis to sustainably meet global food and bioenergy demand. Proc. Natl. Acad. Sci. USA 2015, 112, 8529–8536. [Google Scholar] [CrossRef] [Green Version]
  9. Long, S.P.; Marshall-Colon, A.; Zhu, X.-G. Meeting the Global Food Demand of the Future by Engineering Crop Photosynthesis and Yield Potential. Cell 2015, 161, 56–66. [Google Scholar] [CrossRef] [Green Version]
  10. Osco, L.P.; Marques Ramos, A.P.; Faita Pinheiro, M.M.; Saito Moriya, E.A.; Imai, N.N.; Estrabis, N.; Ianczyk, F.; de Araujo, F.F.; Liesenberg, V.; de Castro Jorge, L.A.; et al. A Machine Learning Framework to Predict Nutrient Content in Valencia-Orange Leaf Hyperspectral Measurements. Remote Sens. 2020, 12, 906. [Google Scholar] [CrossRef] [Green Version]
  11. McDowell, N.; Pockman, W.T.; Allen, C.D.; Breshears, D.D.; Cobb, N.; Kolb, T.; Plaut, J.; Sperry, J.; West, A.; Williams, D.G.; et al. Mechanisms of plant survival and mortality during drought: Why do some plants survive while others succumb to drought? New Phytol. 2008, 178, 719–739. [Google Scholar] [CrossRef]
  12. Yordanov, I.; Velikova, V.; Tsonev, T. Plant responses to drought and stress tolerance. Bulg. J. Plant Physiol. 2003, 187–206. [Google Scholar]
  13. Chaerle, L.; Van Der Straeten, D. Imaging techniques and the early detection of plant stress. Trends Plant Sci. 2000, 5, 495–501. [Google Scholar] [CrossRef]
  14. Gerhards, M.; Schlerf, M.; Mallick, K.; Udelhoven, T. Challenges and Future Perspectives of Multi-/Hyperspectral Thermal Infrared Remote Sensing for Crop Water-Stress Detection: A Review. Remote Sens. 2019, 11, 1240. [Google Scholar] [CrossRef] [Green Version]
  15. Acevedo, E.; Hsiao, T.C.; Henderson, D.W. Immediate and subsequent growth responses of maize leaves to changes in water status. Plant Physiol. 1971, 48, 631–636. [Google Scholar] [CrossRef] [Green Version]
  16. Sobejano-Paz, V.; Mikkelsen, T.N.; Baum, A.; Mo, X.; Liu, S.; Koppl, C.J.; Johnson, M.S.; Gulyas, L.; Garcia, M. Hyperspectral and Thermal Sensing of Stomatal Conductance, Transpiration, and Photosynthesis for Soybean and Maize under Drought. Remote Sens. 2020, 12, 3182. [Google Scholar] [CrossRef]
  17. Zaher-Ara, T.; Boroomand, N.; Sadat-Hosseini, M. Physiological and morphological response to drought stress in seedlings of ten citrus. Trees-Struct. Funct. 2016, 30, 985–993. [Google Scholar] [CrossRef]
  18. Zhang, X.-Y.; Huang, Z.; Su, X.; Siu, A.; Song, Y.; Zhang, D.; Fang, Q. Machine learning models for net photosynthetic rate prediction using poplar leaf phenotype data. PLoS ONE 2020, 15. [Google Scholar] [CrossRef] [Green Version]
  19. Cotrozzi, L.; Peron, R.; Tuinstra, M.R.; Mickelbart, M.V.; Couture, J.J. Spectral Phenotyping of Physiological and Anatomical Leaf Traits Related with Maize Water Status. Plant Physiol. 2020, 184, 1363–1377. [Google Scholar] [CrossRef]
  20. Long, S.P.; Bernacchi, C.J. Gas exchange measurements, what can they tell us about the underlying limitations to photosynthesis? Procedures and sources of error. J. Exp. Bot. 2003, 54, 2393–2401. [Google Scholar] [CrossRef] [Green Version]
  21. Fu, P.; Meacham-Hensold, K.; Guan, K.; Bernacchi, C.J. Hyperspectral Leaf Reflectance as Proxy for Photosynthetic Capacities: An Ensemble Approach Based on Multiple Machine Learning Algorithms. Front. Plant Sci. 2019, 10, 730. [Google Scholar] [CrossRef]
  22. Fu, P.; Meacham-Hensold, K.; Guan, K.; Wu, J.; Bernacchi, C. Estimating photosynthetic traits from reflectance spectra: A synthesis of spectral indices, numerical inversion, and partial least square regression. Plant Cell Environ. 2020, 43, 1241–1258. [Google Scholar] [CrossRef]
  23. Yendrek, C.R.; Tomaz, T.; Montes, C.M.; Cao, Y.; Morse, A.M.; Brown, P.J.; McIntyre, L.M.; Leakey, A.D.B.; Ainsworth, E.A. High-Throughput Phenotyping of Maize Leaf Physiological and Biochemical Traits Using Hyperspectral Reflectance. Plant Physiol. 2017, 173, 614–626. [Google Scholar] [CrossRef] [PubMed]
  24. Asner, G.P. Biophysical and biochemical sources of variability in canopy reflectance. Remote Sens. Environ. 1998, 64, 234–253. [Google Scholar] [CrossRef]
  25. Gamon, J.A.; Somers, B.; Malenovsky, Z.; Middleton, E.M.; Rascher, U.; Schaepman, M.E. Assessing Vegetation Function with Imaging Spectroscopy. Surv. Geophys. 2019, 40, 489–513. [Google Scholar] [CrossRef] [Green Version]
  26. Streher, A.S.; da Silva Torres, R.; Cerdeira Morellato, L.P.; Freire Silva, T.S. Accuracy and limitations for spectroscopic prediction of leaf traits in seasonally dry tropical environments. Remote Sens. Environ. 2020, 244, 111828. [Google Scholar] [CrossRef]
  27. Cotrozzi, L.; Couture, J.J.; Cavender-Bares, J.; Kingdon, C.C.; Fallon, B.; Pilz, G.; Pellegrini, E.; Nali, C.; Townsend, P.A. Using foliar spectral properties to assess the effects of drought on plant water potential. Tree Physiol. 2017, 37, 1582–1591. [Google Scholar] [CrossRef]
  28. Santoso, H.; Tani, H.; Wang, X.; Segah, H. Predicting oil palm leaf nutrient contents in kalimantan, indonesia by measuring reflectance with a spectroradiometer. Int. J. Remote Sens. 2019, 40, 7581–7602. [Google Scholar] [CrossRef]
  29. Pinter, P.J.; Hatfield, J.L.; Schepers, J.S.; Barnes, E.M.; Moran, M.S.; Daughtry, C.S.T.; Upchurch, D.R. Remote sensing for crop management. Photogramm. Eng. Remote Sens. 2003, 69, 647–664. [Google Scholar] [CrossRef] [Green Version]
  30. Chen, J.; Li, F.; Wang, R.; Fan, Y.; Raza, M.A.; Liu, Q.; Wang, Z.; Cheng, Y.; Wu, X.; Yang, F.; et al. Estimation of nitrogen and carbon content from soybean leaf reflectance spectra using wavelet analysis under shade stress. Comput. Electron. Agric. 2019, 156, 482–489. [Google Scholar] [CrossRef]
  31. Bruning, B.; Liu, H.; Brien, C.; Berger, B.; Lewis, M.; Garnett, T. The Development of Hyperspectral Distribution Maps to Predict the Content and Distribution of Nitrogen and Water in Wheat (Triticum aestivum). Front. Plant Sci. 2019, 10, 1380. [Google Scholar] [CrossRef] [PubMed]
  32. Sonobe, R.; Hirono, Y.; Oi, A. Quantifying chlorophyll-aandbcontent in tea leaves using hyperspectral reflectance and deep learning. Remote Sens. Lett. 2020, 11, 933–942. [Google Scholar] [CrossRef]
  33. Sonobe, R.; Yamashita, H.; Mihara, H.; Morita, A.; Ikka, T. Estimation of Leaf Chlorophyll a, b and Carotenoid Contents and Their Ratios Using Hyperspectral Reflectance. Remote Sens. 2020, 12, 3265. [Google Scholar] [CrossRef]
  34. Yamashita, H.; Sonobe, R.; Hirono, Y.; Morita, A.; Ikka, T. Dissection of hyperspectral reflectance to estimate nitrogen and chlorophyll contents in tea leaves based on machine learning algorithms. Sci. Rep. 2020, 10, 17360. [Google Scholar] [CrossRef]
  35. Chen, X.-Q.; Yang, Q.; Han, J.-Y.; Lin, L.; Shi, L.-S. Estimation of Winter Wheat Leaf Water Content Based on Leaf and Canopy Hyperspectral Data. Spectrosc. Spectr. Anal. 2020, 40, 891–897. [Google Scholar] [CrossRef]
  36. Kong, W.; Huang, W.; Zhou, X.; Mortimer, H.; Ma, L.; Tang, L.; Li, C. Estimating leaf water content at the leaf scale in soybean inoculated with arbuscular mycorrhizal fungi from in situ spectral measurements. Int. J. Agric. Biol. Eng. 2019, 12, 149–155. [Google Scholar] [CrossRef]
  37. Zhou, X.; Jun, S.; Yan, T.; Bing, L.; Hang, Y.; Quansheng, C. Hyperspectral technique combined with deep learning algorithm for detection of compound heavy metals in lettuce. Food Chem. 2020, 321, 126503. [Google Scholar] [CrossRef]
  38. Manevski, K.; Manakos, I.; Petropoulos, G.P.; Kalaitzidis, C. Discrimination of common Mediterranean plant species using field spectroradiometry. Int. J. Appl. Earth Obs. Geoinf. 2011, 13, 922–933. [Google Scholar] [CrossRef]
  39. Serbin, S.P.; Singh, A.; McNeil, B.E.; Kingdon, C.C.; Townsend, P.A. Spectroscopic determination of leaf morphological and biochemical traits for northern temperate and boreal tree species. Ecol. Appl. 2014, 24, 1651–1669. [Google Scholar] [CrossRef] [Green Version]
  40. Silva-Perez, V.; Molero, G.; Serbin, S.P.; Condon, A.G.; Reynolds, M.P.; Furbank, R.T.; Evans, J.R. Hyperspectral reflectance as a tool to measure biochemical and physiological traits in wheat. J. Exp. Bot. 2018, 69, 483–496. [Google Scholar] [CrossRef] [Green Version]
  41. Watt, M.S.; Buddenbaum, H.; Leonardo, E.M.C.; Estarija, H.J.; Bown, H.E.; Gomez-Gallego, M.; Hartley, R.J.L.; Pearse, G.D.; Massam, P.; Wright, L.; et al. Monitoring biochemical limitations to photosynthesis in N and P-limited radiata pine using plant functional traits quantified from hyperspectral imagery. Remote Sens. Environ. 2020, 248, 112003. [Google Scholar] [CrossRef]
  42. Driever, S.M.; Lawson, T.; Andralojc, P.J.; Raines, C.A.; Parry, M.A.J. Natural variation in photosynthetic capacity, growth, and yield in 64 field-grown wheat genotypes. J. Exp. Bot. 2014, 65, 4959–4973. [Google Scholar] [CrossRef] [Green Version]
  43. Meacham-Hensold, K.; Montes, C.M.; Wu, J.; Guan, K.; Fu, P.; Ainsworth, E.A.; Pederson, T.; Moore, C.E.; Brown, K.L.; Raines, C.; et al. High-throughput field phenotyping using hyperspectral reflectance and partial least squares regression (PLSR) reveals genetic modifications to photosynthetic capacity. Remote Sens. Environ. 2019, 231, 111176. [Google Scholar] [CrossRef]
  44. Garriga, M.; Romero-Bravo, S.; Estrada, F.; Escobar, A.; Matus, I.A.; del Pozo, A.; Astudillo, C.A.; Lobos, G.A. Assessing Wheat Traits by Spectral Reflectance: Do We Really Need to Focus on Predicted Trait-Values or Directly Identify the Elite Genotypes Group? Front. Plant Sci. 2017, 8, 280. [Google Scholar] [CrossRef] [Green Version]
  45. Shen, J.; Xiao, Q.; Qiu, H.; Chen, C.; Chen, H. Integrative effect of drought and low temperature on litchi (Litchi chinensis Sonn.) floral initiation revealed by dynamic genome-wide transcriptome analysis. Sci. Rep. 2016, 6, 32005. [Google Scholar] [CrossRef]
  46. Shah, S.H.; Angel, Y.; Houborg, R.; Ali, S.; McCabe, M.F. A Random Forest Machine Learning Approach for the Retrieval of Leaf Chlorophyll Content in Wheat. Remote Sens. 2019, 11, 920. [Google Scholar] [CrossRef] [Green Version]
  47. He, J.; Qin, J.; Long, L.; Ma, Y.; Li, H.; Li, K.; Jiang, X.; Liu, T.; Polle, A.; Liang, Z.; et al. Net cadmium flux and accumulation reveal tissue-specific oxidative stress and detoxification in Populus x canescens. Physiol. Plant. 2011, 143, 50–63. [Google Scholar] [CrossRef]
  48. Rousel, J.; Haas, R.; Schell, J.; Deering, D. Monitoring vegetation systems in the great plains with ERTS. In Proceedings of the Third Earth Resources Technology Satellite Symposium, Washington, DC, USA, 10–14 December 1973; pp. 309–317. [Google Scholar]
  49. Jordan, C.F.J.E. Derivation of leaf-area index from quality of light on the forest floor. Ecology 1969, 50, 663–666. [Google Scholar] [CrossRef]
  50. Huete, A.; Justice, C.; Liu, H. Development of vegetation and soil indices for MODIS-EOS. Remote Sens. Environ. 1994, 49, 224–234. [Google Scholar] [CrossRef]
  51. Zarco-Tejada, P.J.; Berjón, A.; López-Lozano, R.; Miller, J.R.; Martín, P.; Cachorro, V.; González, M.; De Frutos, A. Assessing vineyard condition with hyperspectral indices: Leaf and canopy reflectance simulation in a row-structured discontinuous canopy. Remote Sens. Environ. 2005, 99, 271–287. [Google Scholar] [CrossRef]
  52. Mehdaoui, R.; Anane, M. Exploitation of the red-edge bands of Sentinel 2 to improve the estimation of durum wheat yield in Grombalia region (Northeastern Tunisia). Int. J. Remote Sens. 2020, 41, 8984–9006. [Google Scholar] [CrossRef]
  53. Gitelson, A.A.; Keydan, G.P.; Merzlyak, M.N. Three-band model for noninvasive estimation of chlorophyll, carotenoids, and anthocyanin contents in higher plant leaves. Geophys. Res. Lett. 2006, 33, L11402. [Google Scholar] [CrossRef] [Green Version]
  54. Fitzgerald, G.; Rodriguez, D.; O’Leary, G. Measuring and predicting canopy nitrogen nutrition in wheat using a spectral index-The canopy chlorophyll content index (CCCI). Field Crop. Res. 2010, 116, 318–324. [Google Scholar] [CrossRef]
  55. Kim, M.S.; Daughtry, C.; Chappelle, E.; McMurtrey, J.; Walthall, C. The Use of High Spectral Resolution Bands for Estimating Absorbed Photosynthetically Active Radiation (APAR). In Proceedings of the 6th International Symposium on Physical Measurement and Signatures in Remote Sensing, Val-D’Isere, France, 17–21 January 1994; pp. 299–306. [Google Scholar]
  56. Dash, J.; Curran, P. The MERIS Terrestrial Chlorophyll Index. Int. J. Remote Sens. 2004, 25, 5003–5013. [Google Scholar] [CrossRef]
  57. Gamon, J.; Penuelas, J.; Field, C. A narrow-waveband spectral index that tracks diurnal changes in photosynthetic efficiency. Remote Sens. Environ. 1992, 41, 35–44. [Google Scholar] [CrossRef]
  58. Hunt, E.R.; Rock, B.N. Detection of changes in leaf water-content using near-infrared and middle-infrared reflectances. Remote Sens. Environ. 1989, 30, 43–54. [Google Scholar] [CrossRef]
  59. Penuelas, J.; Pinol, J.; Ogaya, R.; Filella, I. Estimation of plant water concentration by the reflectance water index WI (R900/R970). Int. J. Remote Sens. 1997, 18, 2869–2875. [Google Scholar] [CrossRef]
  60. Ceccato, P.; Gobron, N.; Flasse, S.; Pinty, B.; Tarantola, S. Designing a spectral index to estimate vegetation water content from remote sensing data: Part 1: Theoretical approach. Remote Sens. Environ. 2002, 82, 188–197. [Google Scholar] [CrossRef]
  61. Gao, B.C. NDWI—A normalized difference water index for remote sensing of vegetation liquid water from space. Remote Sens. Environ. 1996, 58, 257–266. [Google Scholar] [CrossRef]
  62. Pu, R.; Ge, S.; Kelly, N.M.; Gong, P. Spectral absorption features as indicators of water status in coast live oak (Quercus agrifolia) leaves. Int. J. Remote Sens. 2003, 24, 1799–1810. [Google Scholar] [CrossRef]
  63. Pedregosa, F.; Varoquaux, G.; Gramfort, A.; Michel, V.; Thirion, B.; Grisel, O.; Blondel, M.; Prettenhofer, P.; Weiss, R.; Dubourg, V.; et al. Scikit-learn: Machine Learning in Python. J. Mach. Learn. Res. 2011, 12, 2825–2830. [Google Scholar]
  64. Zhang, C.; Denka, S.; Cooper, H.; Mishra, D.R. Quantification of sawgrass marsh aboveground biomass in the coastal Everglades using object-based ensemble analysis and Landsat data. Remote Sens. Environ. 2018, 204, 366–379. [Google Scholar] [CrossRef]
  65. Zhao, Q.; Yu, S.; Zhao, F.; Tian, L.; Zhao, Z. Comparison of machine learning algorithms for forest parameter estimations and application for forest quality assessments. For. Ecol. Manag. 2019, 434, 224–234. [Google Scholar] [CrossRef]
  66. Wang, H.; Lu, K.; Pu, R. Mapping Robinia pseudoacacia forest health in the Yellow River delta by using high-resolution IKONOS imagery and object-based image analysis. J. Appl. Remote Sens. 2016, 10, 045022. [Google Scholar] [CrossRef]
  67. Mountrakis, G.; Im, J.; Ogole, C. Support vector machines in remote sensing: A review. Isprs J. Photogramm. Remote Sens. 2011, 66, 247–259. [Google Scholar] [CrossRef]
  68. Were, K.; Bui, D.T.; Dick, O.B.; Singh, B.R. A comparative assessment of support vector regression, artificial neural networks, and random forests for predicting and mapping soil organic carbon stocks across an Afromontane landscape. Ecol. Indic. 2015, 52, 394–403. [Google Scholar] [CrossRef]
  69. Rodriguez-Galiano, V.; Sanchez-Castillo, M.; Chica-Olmo, M.; Chica-Rivas, M. Machine learning predictive models for mineral prospectivity: An evaluation of neural networks, random forest, regression trees and support vector machines. Ore Geol. Rev. 2015, 71, 804–818. [Google Scholar] [CrossRef]
  70. Freund, Y.; Schapire, R.E. A decision-theoretic generalization of on-line learning and an application to boosting. J. Comput. Syst. Sci. 1997, 55, 119–139. [Google Scholar] [CrossRef] [Green Version]
  71. Ashraf, M. Inducing drought tolerance in plants: Recent advances. Biotechnol. Adv. 2010, 28, 169–183. [Google Scholar] [CrossRef]
  72. Boochs, F.; Kupfer, G.; Dockter, K.; Kuhbauch, W. Shape of the red edge as vitality indicator for plants. Int. J. Remote Sens. 1990, 11, 1741–1753. [Google Scholar] [CrossRef]
  73. Zovko, M.; Zibrat, U.; Knapic, M.; Kovacic, M.B.; Romic, D. Hyperspectral remote sensing of grapevine drought stress. Precis. Agric. 2019, 20, 335–347. [Google Scholar] [CrossRef]
  74. Liu, K.; Wang, J.; Zeng, W.; Song, J. Comparison and Evaluation of Three Methods for Estimating Forest above Ground Biomass Using TM and GLAS Data. Remote Sens. 2017, 9, 341. [Google Scholar] [CrossRef] [Green Version]
  75. Haboudane, D.; Miller, J.R.; Tremblay, N.; Zarco-Tejada, P.J.; Dextraze, L. Integrated narrow-band vegetation indices for prediction of crop chlorophyll content for application to precision agriculture. Remote Sens. Environ. 2002, 81, 416–426. [Google Scholar] [CrossRef]
  76. Ballester, C.; Zarco-Tejada, P.J.; Nicolas, E.; Alarcon, J.J.; Fereres, E.; Intrigliolo, D.S.; Gonzalez-Dugo, V. Evaluating the performance of xanthophyll, chlorophyll and structure-sensitive spectral indices to detect water stress in five fruit tree species. Precis. Agric. 2018, 19, 178–193. [Google Scholar] [CrossRef]
  77. Gerhards, M.; Schlerf, M.; Rascher, U.; Udelhoven, T.; Juszczak, R.; Alberti, G.; Miglietta, F.; Inoue, Y. Analysis of Airborne Optical and Thermal Imagery for Detection of Water Stress Symptoms. Remote Sens. 2018, 10, 1139. [Google Scholar] [CrossRef] [Green Version]
  78. Sun, X.P.; Yan, H.L.; Kang, X.Y.; Ma, F.W. Growth, gas exchange, and water-use efficiency response of two young apple cultivars to drought stress in two scion-one rootstock grafting system. Photosynthetica 2013, 51, 404–410. [Google Scholar] [CrossRef]
  79. Dong, T.; Xi, L.; Xiong, B.; Qiu, X.; Huang, S.; Xu, W.; Wang, J.; Wang, B.; Yao, Y.; Duan, C.; et al. Drought resistance in Harumi tangor seedlings grafted onto different rootstocks. Funct. Plant Biol. 2021, 48, 529–541. [Google Scholar] [CrossRef]
  80. Govender, M.; Dye, P.J.; Weiersbye, I.M.; Witkowski, E.T.F.; Ahmed, F. Review of commonly used remote sensing and ground-based technologies to measure plant water stress. Water SA 2009, 35, 741–752. [Google Scholar] [CrossRef] [Green Version]
  81. Panigada, C.; Rossini, M.; Meroni, M.; Cilia, C.; Busettoa, L.; Amaducci, S.; Boschetti, M.; Cogliati, S.; Picchi, V.; Pinto, F.; et al. Fluorescence, PRI and canopy temperature for water stress detection in cereal crops. Int. J. Appl. Earth Obs. Geoinf. 2014, 30, 167–178. [Google Scholar] [CrossRef]
  82. Suarez, L.; Zarco-Tejada, P.J.; Berni, J.A.J.; Gonzalez-Dugo, V.; Fereres, E. Modelling PRI for water stress detection using radiative transfer models. Remote Sens. Environ. 2009, 113, 730–744. [Google Scholar] [CrossRef] [Green Version]
  83. Zhao, Y. Principles and Methods of Remote Sensing Application Analysis; Science Press: Beijing, China, 2003; p. 367. [Google Scholar]
  84. Arbona, V.; Iglesias, D.J.; Jacas, J.; Primo-Millo, E.; Talon, M.; Gomez-Cadenas, A. Hydrogel substrate amendment alleviates drought effects on young citrus plants. Plant Soil 2005, 270, 73–82. [Google Scholar] [CrossRef]
  85. Osco, L.P.; Marques Ramos, A.P.; Pereira, D.R.; Saito Moriya, E.A.; Imai, N.N.; Matsubara, E.T.; Estrabis, N.; de Souza, M.; Marcato Junior, J.; Goncalves, W.N.; et al. Predicting Canopy Nitrogen Content in Citrus-Trees Using Random Forest Algorithm Associated to Spectral Vegetation Indices from UAV-Imagery. Remote Sens. 2019, 11, 2925. [Google Scholar] [CrossRef] [Green Version]
  86. Ma, L.; Liu, Y.; Zhang, X.; Ye, Y.; Yin, G.; Johnson, B.A. Deep learning in remote sensing applications: A meta-analysis and review. Isprs J. Photogramm. Remote Sens. 2019, 152, 166–177. [Google Scholar] [CrossRef]
  87. Zhou, J.; Dian, Y.; Wang, X.; Yao, C.; Jian, Y.; Li, Y.; Han, Z. Comparison of GF2 and SPOT6 Imagery on Canopy Cover Estimating in Northern Subtropics Forest in China. Forests 2020, 11, 407. [Google Scholar] [CrossRef] [Green Version]
Figure 1. (a) the position of upper layer, middle layer and lower layer; (b) in the process of drought treatment, citrus trees of severe stress had obvious physiological changes and even bloomed early; and (c) experimental design.
Remotesensing 13 02160 g001
Figure 2. A part of lemon leaf reflectance (1200–1700 nm) and definitions of absorption features (where H means absorption depth, W represents the full-width half maximum, the absorption position (P) marks the wavelength at the deepest absorption in the region of visible wavelength, λP is the corresponding wavelength, A is the area left area of the absorption center, L is tangent line, X1 and X2 are the wavelengths of left and right shoulder at the position of the full-width half maximum, and Y is the corresponding reflectance of X1 and X2).
Remotesensing 13 02160 g002
Figure 3. One-way ANOVA test results of photosynthetic CO2 assimilation rate (Pn, mol m−2 s−1) for the upper layer, middle layer, and lower layer of different water stresses in the drought treatment period (i.e., Days 1, 7, 13, and 20) and rewatering period (i.e., Days 28 and 33). The data are presented in the form of mean ± standard error, and significant differences are indicated by different letters in the same subfigure.
Remotesensing 13 02160 g003
Figure 4. Heat maps of the reflectance spectra of lemon leaves over four drought treatments. Each point shows the Pearson correlation of reflectance at both wavelengths. The panel below shows the three components that account for the largest proportion of variance.
Remotesensing 13 02160 g004
Figure 5. Comparison between the mean spectral reflectance and absorptance at 300–2500 nm for each of the four treatment groups. (af) represent days 1, 7, 13, 20, 28, and 33.
Remotesensing 13 02160 g005
Figure 6. Performance of spectral parameters for revealing the difference of four drought treatments. (ai) represent PRI, NDVI, RVI, GI, C, NMDI, SW2-fwhm-X1, SW2-fwhm-X2, and VIS-λP, respectively. Significant differences are indicated by different letters on the histogram at the same time.
Remotesensing 13 02160 g006
Figure 7. Performance of the spectral parameters for revealing the difference of the four drought treatments. (aj) represent SW1-fwhm-Y1, SW1-fwhm-Δλ, SW2-Area, SW1-SAI, SW2-fwhm-Y, GVMI, SW2-fwhm-Δλ, SW2-SAI, MSI, and NDWI1640, respectively. Significant differences are indicated by different letters on the histogram at the same time.
Remotesensing 13 02160 g007
Figure 8. Measured vs. predicted values after applying AdaBoost, GDBoost, random forest (RF), and support vector machine (SVM) model to predict leaf photosynthetic CO2 assimilation rate (Pn in µmol m−2 s−1), leaf stomatal conductance (Cond in mol m−2 s−1), and leaf transpiration rate (Trmmol in µmol m−2 s−1). The red line is the 1:1 line, and the black line is fitting line between observed and predicted values. (al) represents Pn–AdaBoost, Pn–GDBoost, Pn–RF, Pn–SVM, Cond– AdaBoost, Cond–GDBoost, Cond–RF, Cond–SVM, Trmmol–AdaBoost, Trmmol–GDBoost, Trmmol–RF, and Trmmol–SVM.
Remotesensing 13 02160 g008
Table 1. The 20 selected spectral vegetation indices examined in this research, together with their band-specific formulations, and associated principal reference.
NO.Spectral Vegetation IndicesDescriptionReference
1Normalized difference vegetation index,
NDVI = (R800R670)/(R800 + R670)
Structure: greenness, vegetation cover, biomass, LAI and fraction of photosynthetic active radiation[48]
2Ratio vegetation index, RVI = R800/R670[49]
3Enhanced Vegetation Index,
EVI = 2.5 × (R800R680)/(R800 + 6 × R680 − 7.5 × R450 + 1)
[50]
4Greenness Index, GI = R554/R667Pigments: Chlorophyll, carotenoids, and anthocyanin.[51]
5Red Edge model, CI730 = R800/R730 − 1.0[52]
6Red Edge model, CI709 = R800/R709 − 1.0
7Chrollophy Index at Green band, ch1green = R800/R550 − 1.0[53]
8Normalized Difference Red Edge, NDRE = (R790R720)/(R790 + R720)[54]
9Red and Green Vegetation Index, RGVI = R550/R670[49]
10CARI_a = (R700R550)/150
CARI _b = R550CARIa × 500
[55]
C A R = C A R I a × R 670 + R 670 + C A R I   _ b / C A R I _ a 2 + 1.0
Chlorophyll Absorption Ratio Index, CARI = CAR × R700/R670
11MERIS Terrestrial Chlorophyll Index, MTCI = (R754R709)/(R709R681)[56]
12Photochemical Reflectance Index, PRI = (R570R531)/(R570 + R531)Photosynthetic activity[57]
13Photochemical Reflectance Index Improved,
PRI2 = (R528R567)/(R528 + R567)
14Moisture Stress Index, MSI = R1600/R820Water content[58]
15Water Index, WI = R900/R970[59]
16Normalized Multi-band Drought Index,
NMDI = (R860R1640 + R2130)/(R860 + R1640R2130)
[54]
17Global Vegetation Moisture Index,
GVMI = (R820 + 0.1 − R1600 − 0.02)/(R820 + 0.1 + R1600 + 0.02)
[60]
18Normalized Difference Water Index,
NDWI1200 = (R886R1200)/(R886R1200)
[61]
19Normalized Difference Water Index,
NDWI1240 = (R886R1240)/(R886R1240)
[61]
20Normalized Difference Water Index,
NDWI1640 = (R886R1640)/(R886R1640)
[61]
Table 2. Performance of the spectral parameters of the normal water supply, mild stress, moderate stress, and severe stress in the initial stage of rewatering (i.e., day 28). The data are presented in the form of the mean ± standard error, and significant differences are indicated by different letters in the same row.
ParameterNormal Water SupplyMild StressModerate StressSevere Stress
GI0.6228 ± 0.0027 b0.5870 ± 0.0027 b0.5937 ± 0.0028 b0.6473 ± 0.0013 a
CI7300.2040 ± 0.0020 a0.1617 ± 0.0021 c0.1742 ± 0.0016 bc0.2024 ± 0.0011 ab
CI7091.1799 ± 0.012 ab0.9835 ± 0.011 c1.0303 ± 0.0010 bc1.2230 ± 0.0067 a
CIG3.3888 ± 0.038 ab2.9082 ± 0.031 b3.0010 ± 0.036 b3.6980 ± 0.022 a
NDRE0.09232 ± 0.00082 a0.07453 ± 0.00091 c0.07998 ± 0.00065 bc0.09182 ± 0.00047 ab
rg0.1418 ± 0.00011 ab0.1539 ± 0.00086 a0.1478 ± 0.00012 ab0.1329 ± 0.00082 b
CARI1.1168 ± 0.024 ab1.2758 ± 0.018 a1.0828 ± 0.017 ab0.9431 ± 0.0072 b
MCTI1.3550 ± 0.015 ab1.1412 ± 0.013 c1.2204 ± 0.012 bc1.4350 ± 0.0075 a
PRI0.08426 ± 0.00059 b0.09272 ± 0.00063 ab0.08426 ± 0.00059 b0.09925 ± 0.00035 a
VIS-λ2745.7833 ± 0.073 a743.9444 ± 0.1051 c744.3944 ± 0.076 bc745.4222 ± 0.043 ab
VIS-λP669.6667 ± 0.15 a667.2111 ± 0.13 bc667.6667 ± 0.14 ab665.2833 ± 0.065 c
VIS-Area118.6700 ± 0.24 ab116.47 ± 0.24 ab115.10900.4322 ± 0.43 b120.87 ± 0.16 a
VIS-symmetry0.6914 ± 0.0012 a0.6800 ± 0.00096 a0.6795 ± 0.0010 a0.6613 ± 0.00043 b
VIS-slope0.002289 ± 0.000012 ab0.002182 ± 0.000013 b0.002120 ± 0.0000081 b0.002386 ± 0.0000048 a
VIS-fwhm-X1573.3167 ± 0.10 ab572.0278 ± 0.11 a572.1167 ± 0.13 a569.6222 ± 0.039 b
VIS-fwhm-Y138.0944 ± 0.22 ab135.5389 ± 0.24 b136.1056 ± 0.22 b140.5556 ± 0.077 a
SW1-λ11281.6778 ± 0.10 b1282.5222 ± 0.14 b1282.5222 ± 0.10 b1284.8444 ± 0.088 a
SW2-λ11818.1444 ± 0.085 b1818.3333 ± 0.089 b1819.8444 ± 0.079 a1820.4111 ± 0.076 a
SW2-cslope−0.0003405 ± 1.58 × 10⁻⁶ b−0.0003277 ± 1.6 × 10⁻⁶ ab−0.0003189 ± 7.9 × 10⁻⁸ a−0.0003425 ± 8.2 × 10⁻⁷ b
SW2-fwhm-X11838.8 ± 0.045 c1874.1833 ± 0.070 bc1874.1 ± 0.042 ab1875.1444 ± 0.044 a
C3.4474 ± 0.030 ab3.1406 ± 0.028 b3.1544 ± 0.039 b3.7082 ± 0.015 a
λg543.4862 ± 0.022 a543.0308 ± 0.016 b543.1019 ±0.028 b542.8853 ± 0.0059 b
λ0676.0881 ± 0.051 ab675.2125 ± 0.052 c6754985 ± 0.045 bc676.3048 ± 0.025 c
σ29.6841 ± 0.053 a28.7165 ± 0.063 b29.1676 ± 0.041 ab29.8467 ± 0.024 a
Table 3. Descriptive data from the photosynthetic parameters’ analysis of the lemon leaves.
SummaryPn (μmol CO2 m−2s−1)Cond (mol HO2 m−2s−1)Trmmol (mmol HO2 m−2s−1)
Mean4.530.0893.00
SD2.850.0692.21
Median4.150.0732.58
Maximum12.510.3611.61
Minimum0.0220.00140.037
Coefficient Variation63.0277.7973.70
Table 4. The machine-learning algorithms’ accuracy performance for the reflectance data.
AdaBoostGDBoostRFSVM
PnR20.690.990.920.64
RMSE1.842.551.861.91
MAE1.531.951.511.53
CondR20.520.990.890.28
RMSE0.0560.0680.0490.055
MAE0.0450.0490.0380.045
TrmmolR20.490.990.880.50
RMSE2.0782.481.882.06
MAE1.651.741.341.46
Publisher’s Note: MDPI stays neutral with regard to jurisdictional claims in published maps and institutional affiliations.