Abstract
The mean radiant temperature (MRT) is an indicator for evaluating the radiant heat environment near occupants and is determined by the radiant heat exchange between the occupants and their surroundings. To control various heating and cooling systems according to the occupants’ thermal comfort, it is essential to consider MRTs in the real-time evaluation of thermal environment. This study proposes a pan–tilt infrared (IR) scanning method to estimate the MRTs at multiple occupant locations in real buildings. The angle factor was calculated by defining the specific classification criteria for dividing the entire indoor surface into sub-surfaces. The coupling IR camera and pan–tilt motor were applied to enable storing data pairs of IR thermal image frame (IR image frame) and pan–tilt angle so each surface area taken by the IR camera can have its direction information. The measurement method of the mean surface temperature using the pan–tilt IR system was presented. The pan–tilt IR system hardware and MRT monitoring software were developed. An experiment was performed to verify the applicability of the proposed pan–tilt IR scanning method. By comparing the surface temperatures measured using a contact thermometer and the proposed IR system, the contact thermometer could cause inaccurate measurement of surfaces with a non-uniform distribution of temperature. The difference between surface temperatures increased by up to 15 °C and, accordingly, the MRT distributions differed by up to 6 °C within the same space. The proposed IR scanning method showed good applicability in various aspects. This paper reports that the MRT has a significant effect on the occupants’ thermal comfort and also suggests considering MRTs in the real-time evaluation of thermal environment to control various heating and cooling systems appropriately.
1. Introduction
Radiant heat is an essential factor that determines thermal comfort. Existing research [1] has reported that approximately half of the thermal comfort is influenced by radiant heat exchange between the occupants and their surroundings. This factor also influences human health, well-being, and work performance [2]. Therefore, it is essential to evaluate the radiant heat stress experienced by humans to provide a quality indoor environment. The mean radiant temperature (MRT) is an indicator for evaluating the radiant heat environment near occupants. Therefore, it is important to consider MRTs in the real-time evaluation of thermal environment to appropriately control various heating and cooling systems according to the occupants’ thermal comfort.
MRT evaluation methods can be classified using two different approaches: methods measuring the MRT from installed instruments directly on the target location and methods calculating the MRT from the surrounding surface temperatures. Direct measurement methods are common methods to evaluate the thermal environments of buildings. A globe thermometer (GT) is a typical instrument widely used for direct measurements of MRT [3,4,5]. Net radiometers and six-directional shortwave and longwave sensors are also used widely in MRT measurement studies [6,7,8]. These devices have primarily been used to evaluate the MRT of unoccupied spaces. On the other hand, owing to the nature of these devices, they must be placed in locations where the occupants are supposed to be, limiting real-time MRT measurements for buildings in use.
The MRT calculation methods estimate the MRT values at the target location via indoor surface temperature measurements. The angle factors are used to calculate the mean radiant temperatures at specific locations. Evaluation of MRT using the angle factor (AF) method was suggested by Fanger [9]. MRT at every target location can be evaluated by applying angle factors calculated in a 3D space model without directly installing measuring devices around the occupant area. Therefore, the angle factor method can be applied to the real-time MRT evaluation of actual buildings. The AF method was primarily developed in numerical studies focusing on evaluating the heat environment based on the construction plan of the space and calculating the AF for different human postures [9,10]. Therefore, accurate real-time measurements of the surface temperature are important for applying the angle factor method to an actual building MRT evaluation.
Annex F in ISO 7726 [11] recommends using a contact thermometer and an IR sensor to measure the surface temperature. The contact thermometer method measures the conductive heat from the indoor surface at a location to which the thermocouple adheres. For the MRT evaluation, the contact thermometer method requires too many sensors and excessively long thermocouple lengths. In addition, the measured point temperature using a contact thermometer can differ from the average surface temperature. Contact thermometers are rarely used for real building applications owing to this property. The IR sensor can be the most suitable solution for evaluating the real-time MRT in buildings. As a single IR sensor can measure multiple surface temperatures remotely, the installation location of the device to measure the indoor surface is not limited. In addition, use of a single device can minimize device maintenance and the scale of installation.
Several studies have applied IR sensing to MRT evaluations [12,13,14,15]. In these studies, infrared thermal imaging cameras [12,15] and infrared sensors [13,14] were applied to measure the surface temperature. Cheong et al. [12] used an IR camera (testo, 870 Pro) to measure the average surface temperature. They calculated MRT values at two time points by deriving the area-weighted average value. This simple MRT calculation method does not require an angle factor calculation. On the other hand, MRT evaluation for various occupant locations is impossible, and real-time MRT evaluation is complex because of the need for manual manipulation. Guo et al. [13] used eight surface temperature sensors (Melexis, MLX90614). The sensors pointed to each surface, and the temperature data were collected every 20s. They applied the angle factor method that allowed continuous MRT monitoring for various occupant locations. Revel et al. [14] used a low-cost IR sensor composed of an array of eight thermopiles arranged in a row. The pan–tilt motor allowed IR to point in five different directions. In this method, the occupant areas can be secured by installing IR sensors on the ceiling. In similar work, Dizeu et al. [15] presented pan–tilt IR camera with two RGB cameras to visualize indoor thermal conditions. A set of movable measurement grid with 56 spherical sensors were used so that the pan–tilt IR camera can measure indoor stereoscopic temperature distributions.
The development of infrared sensor applications can evaluate MRTs continuously in multiple locations. These methods assume that the measured temperature at a specific direction is the average temperature of the corresponding surface. In buildings with complex indoor shapes and materials, it is important to measure the average temperature accurately within each surface boundary. Therefore, it is essential to classify the entire surface into separate surfaces based on the surface characteristics, such as a blind, wall, radiant cooling panel, and radiant floor. The infrared sensor should measure the average temperature within the boundary for each classified surface.
This paper presents a method for estimating real-time MRTs at multiple locations in an indoor space without the direct installation of instruments in the occupant area. Section 2 reports a method for classifying the boundaries of the indoor surface and calculating the angle factor through simple 3D modeling. A pan–tilt IR scanning method which uses multiple thermal images is proposed to measure the mean temperature of the indoor surface areas with various sizes. The coupling of a pan–tilt motor and IR camera is proposed to memorize each classified surface with its direction. Two methods (measuring the average surface temperature and the reflected temperature) are proposed to measure mean surface temperature correctly by combining multiple IR images, including the polygon coordinates. Section 3 reports the design of the structure of the pan–tilt IR scanning system. Three major steps are defined considering real building applications: pre-investigation, building major parameters, and real-time MRT monitoring. Pan–tilt IR system hardware and software are developed. Section 4 discusses the applicability of the developed IR system through an experimental study. The advantages of the method, limitations, and future work are discussed in the Section 5, Conclusions.
2. IR Application Methods
2.1. Outline of the Method
The AF method is applied to monitor the MRT at various occupant locations in the operating building. As shown in Figure 1, the angle factor method evaluates the MRT by considering the indoor surface temperature and the angle factor between the occupant and the surface. The angle factor for each surface is a calculated value that varies according to the occupant’s location. The indoor surface temperature is a measured value.
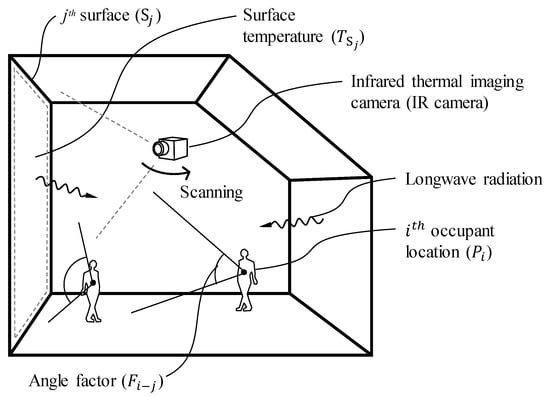
Figure 1.
Concept diagram of the applied MRT evaluation method.
Fanger’s method is based on the idea that the entire surroundings of the human body are divided into several isothermal surfaces. The MRT can be calculated through the relationships between the human body and each surrounding isothermal surface, as shown in Equation (1).
where is the surface temperature and is the angle factor. The impact of radiation transferred from the indoor surface to the occupant location is determined by the angle factor.
2.1.1. Simplified Modeling for Calculating
The angle factor is a geometrical shape factor describing the radiant heat exchange between a human body and its surrounding surface. The calculation of the angle factor was developed further primarily in numerical studies [10,16,17,18,19], with a focus on evaluating the heat environment based on the construction plan of the space and calculating the angle factor for different human postures. In this study, for simplification, each MRT value was obtained from a spherical surface located at approximately the center of gravity of a human occupant. This study applied the solid angle (Ω) calculation method to obtain the AFs [20,21]. The applied AF method was verified through a field study on MRT measurement compared with the method using a globe thermometer [22]. The AFs for multiple occupant locations were calculated after a simplified modeling procedure.
Section 2.2 proposes a simplified modeling method by classifying the entire indoor surface into sub-surfaces. Sub-surfaces were modeled in 3D space. Regarding the occupant’s location, multiple locations can be set up in 3D space, as many as the occupants need or considering the conditioned zone. This derives modeling the most simplified indoor space built with only the surfaces needed for the MRT evaluation. This model assumes that each indoor surface has the same temperature distribution inside the surface boundary. Finally, the angle factor was calculated at the configured occupant locations, respectively. Once the calculation of the AFs was complete, they were applied to the MRT calculation as constant values so that the calculation process needed to be conducted just once.
2.1.2. Pan–Tilt IR Scanning for Measuring
The mean temperature of indoor surfaces () classified through the simplified model should then be measured to evaluate MRTs continuously in a building in use. The instruments, including contact thermometer, infrared thermometer, infrared sensor, and infrared thermal imaging camera, can be used to measure the surface temperatures, but real-time measurements of the mean surface temperatures are challenging. Several limitations exist when setting the boundaries of classified surfaces, measuring the mean surface temperatures and reflected temperatures, and memorizing and continuously measuring classified surfaces.
The coupling of a pan–tilt motor and an infrared camera is proposed to solve these problems and is called the automatic pan–tilt IR scanning system (IR scanning). The pan–tilt motor memorizes the pan and tilt angles for the direction of where the IR camera is looking. Therefore, each image frame pictured by an IR camera has its direction information. In the IR camera, the polygon image coordinates are set to extract the indoor surface area for each IR image frame for accurate temperature measurements inside the indoor surface boundary. The surface temperature data are extracted within the boundary of the set polygon image coordinates. Here, multiple IR image frames can be added (combined) to measure the large-scale indoor surface defined as ‘IR scanning’ in this study. The correction process for emissivity, reflected temperature, and atmospheric transmittance is performed on the measured surface temperatures. Finally, the mean temperature is calculated for each classified indoor surface of the simplified 3D model, which is assumed to have a homogenous temperature distribution. Therefore, the mean surface temperature and the angle factor are used to monitor real-time MRTs at multiple locations of the buildings.
2.2. Classification of Indoor Surfaces
Classifying a whole indoor surface into sub-indoor spaces is an important preceding step for calculating the angle factor. The indoor surface can be classified according to surface structure and location, material properties, and thermal characteristics. These surface classifications can vary according to the use, such as atriums, exhibition halls, performance halls, sports stadiums, and small residential and office spaces. In this study, a method of classifying the entire indoor surface into sub-indoor surfaces with respective boundaries is defined.
Figure 2 presents a schematic diagram of classified indoor surfaces. Once indoor surfaces are classified, simplified indoor space can be modeled in 3D space. This model assumes that each surface has the same temperature distribution, as discussed earlier.
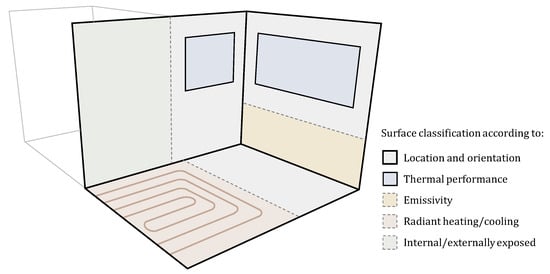
Figure 2.
Example of indoor surface classifications for simplified modeling.
The classification of indoor surfaces requires a close on-site inspection process because it includes an investigation of the indoor space dimension and material properties. The main criteria and application method for the surface classification derived in this study are as follows.
2.2.1. Surface Structure and Location
Surface structure and location were set using the most basic surface dividing criteria. The surfaces can be divided based on the edges where indoor surfaces such as wall, ceilings, and floor join. As a common example, a concrete structure space with a rectangular floor plan can be classified into six indoor surfaces consisting of a ceiling, floor, and four walls of different locations and orientations. More than six surfaces can be classified if the floor plan is not rectangular and has various planes and cross-sectional shapes.
2.2.2. Material Properties
Even for the same location and orientation, if an indoor surface is composed of different materials, it can be classified into different surfaces based on the boundary of heterogeneous materials. The first factor to consider is the thermal performance of surface material. The time and magnitude of temperature change according to the thermal capacity and thermal transmittance. The surface emissivity was also set as an important criterion of surface classification. Indoor surfaces with different emissivity have different amounts of radiant heat exchange with the indoor surroundings. Furthermore, the emissivity is a crucial parameter required in the correction process of an IR camera. This can be classified clearly by measuring the emissivity in the field using an IR camera.
2.2.3. Thermal Conditions and Characteristics
An indoor surface area with different thermal conditions should be classified as different surfaces even if composed of the same structure and materials. The surface area, on which the surface temperature is controlled by a radiant heating [23] or cooling system [24], can be a major criterion of surface classification. In addition, a surface should be classified based on the boundary line between an externally exposed wall and an interior wall.
2.3. Pan–Tilt IR Scanning Method
2.3.1. Proposition of IR and Pan–Tilt Coupled System
The auto IR scanning method is proposed to enable the IR scanning system to repeat the process of storing information on the area of the target surface as well as measuring and correcting the mean temperature of the indoor surface according to the set time interval. The coupling IR camera and pan–tilt motor were applied to enable storing data pairs of IR thermal image frame (IR image frame) and pan–tilt angle. Each surface area taken by the IR camera can have its direction information.
IR Image Frame with Angular Data
The coupling system was applied to designate the unique horizontal and vertical direction vector values for the IR image captured through the IR system. By applying the coupling system, all measured IR images obtain their location information, and the IR system could measure the corresponding direction repeatedly according to the frame unique number m.
Figure 3 shows the conceptual diagram and main parameters of the pan–tilt IR system. The mth IR image frame has information of its horizontal pan angle () and vertical tilt angle (). Several IR image frames can be merged according to the size of the jth surface area. Here, the merged IR image frame is the same as j, the surface identifier. The location information of the mth IR image frame can be expressed as Equation (2).
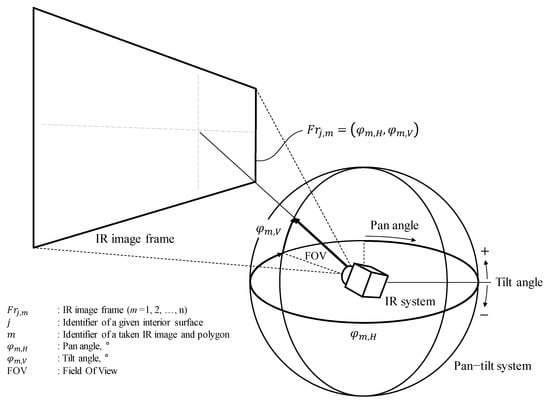
Figure 3.
Conceptual diagram of IR and pan–tilt coupled system.
IR Image Frame with Polygon Image Coordinates
Each IR image frame contains single polygon image coordinates for identifying the boundary of the jth surface to which the frame belongs. Figure 4 represents the polygonal and pixel unit areas in an IR image frame. The right and upward orientations are indicated by the x-axis and y-axis, respectively.
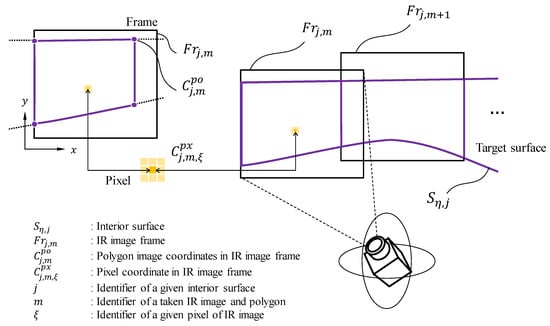
Figure 4.
Conceptual diagram of polygon image coordinates in an IR image frame.
Several pixels exist within the boundary of the polygon image coordinates, which can be expressed as Equation (3).
where is mth polygon image coordinates within mth IR image frame. is th pixel coordinate within mth polygon image coordinates. Using the Equation (3), each set of pixels that lie within the boundaries of the classified surface can be set. Therefore, only the temperature of the pixels within the boundary of the polygon image coordinate can be extracted in the process of calculating the surface temperature of the target surface.
2.3.2. Measurement of the Mean Surface Temperature
The IR camera is a device because the released IR changes with the surface temperature of the object. Intrinsically, it measures the radiation power (W) and not temperature; subsequently, it converts it to the surface temperature of the object [25]. The total radiation power incident on the detector () is expressed in Equation (4) [26].
where ε and 1 − ε are the emissivity and reflectivity of the target object, and is the transmittance of air. The IR camera detects a radiant power mixture. The total radiation power incident on the detector () is affected by the radiation power emitted by the object () as well as the radiation power reflected from the surroundings () and the radiation power emitted by the atmosphere (). Therefore, to measure the indoor surface temperature accurately, it is important to undergo the correction process considering ε, , and . The emissivity value can be measured during a preliminary field review. The emissivity data for each surface can be used as fixed values unless there are changes in the materials.
An algorithm that automatically measures and corrects the surface temperature in real-time is needed to apply the IR scanning method. Therefore, an auto IR scanning method is proposed to allow the IR scanning system to repeat the process of measuring and correcting the mean temperature of the indoor surfaces.
Measurement of the Average Reflected Temperature
When the radiant temperature of the entire indoor surface () is measured, the reflected temperature can be calculated according to each surface. The concept of the surface group (η) was introduced for the reflected temperature to exclude the surfaces located on the same plane in the calculation of the reflected temperature. Here, it was assumed that there is no reflection between the two surfaces located on the same plane. This is expressed as Equation (5).
The concept of the surface group () is designed to be applied only to the reflected temperature measurement process. The mean reflected temperature excludes only the group surface to which the target surface belongs (See Figure 5).

Figure 5.
Conceptual diagram of measuring reflected temperature.
The area of these surfaces can be expressed as a complementary set (). All surface groups in the complementary sets to be measured were recalculated with the emissivity value as 1 and the distance as 0 (i.e., , ). The final calculated value is the reflected temperature () of the jth surface and is input as data for the correction process of the thermal imaging algorithm. The reflection temperatures of all surfaces in the surface group () are the same. The equation for calculating the reflection temperature of the jth surface is expressed as Equation (6). denotes the number of elements in a set.
Calculation of the Mean Surface Temperature
Based on the real-time measured air temperature and the reflected temperature of the surface obtained earlier, each actual pixel temperature can be derived according to the correction process. Referring to Equation (4), the detected radiation power incident from the th pixel location within the mth polygon coordinate area () can be expressed as Equation (7) in consideration of the radiation power contribution to the detector signal (). The actual temperature of the pixel location () at time t can be corrected as Equation (8). Therefore, the jth mean surface temperature () can be calculated by averaging all the pixel temperatures within the jth surface area according to Equation (9).
The transmittance of air () is determined by considering subject distance and relative humidity. The calculation of the air transmittance can have slight difference depending on the manufacturers. The angle factor method uses interior surfaces, which are assumed to be a homogeneous temperature. By applying this method, it is possible to accurately measure the mean temperature of the indoor surfaces continuously (See Figure 6).
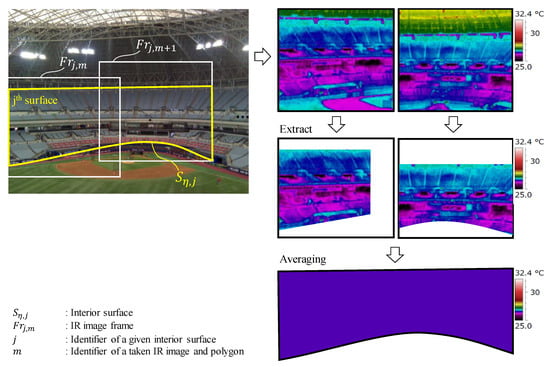
Figure 6.
Process averaging radiant power of the target surface.
Note that correction of IR images for intrinsic geometric deformation can be a crucial factor in the field of visualizing IR images [27]. This study focuses on measuring accurate mean temperature by averaging temperatures within the boundary of each classified surface. Therefore, correction of IR images and storage of IR image data are not necessary after the mean temperature value is measured.
3. Development of Pan–Tilt IR Scanning System
3.1. Development of System Structure
Figure 7 shows the system structure of the pan–tilt IR scanning system developed in this study. The system consists of three major steps: (1) pre-investigation on site for measuring the surface dimensions, emissivity, reviewing the occupant locations and IR installation location, and surface classification, (2) building major parameters—angle factors and surface directory, and (3) real-time evaluation of the MRT.
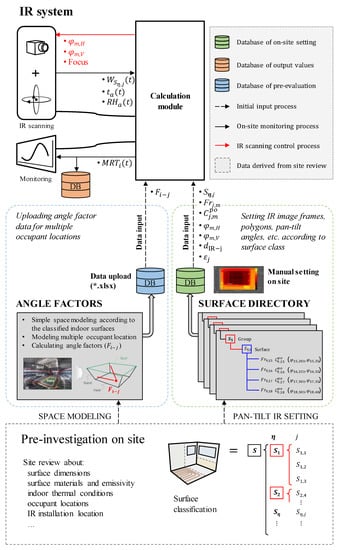
Figure 7.
Developed system design of pan–tilt IR scanning system.
A dataset should be constructed for the target space through preliminary field investigation. The surface classification introduced in Section 2.2 is performed. Direct measurement of the emissivity value can be conducted using an IR camera using the reflector method [28] and non-contact thermometer method [29]. Before field monitoring, a pre-evaluation is performed using the established information based on the pre-investigation results. The database of the angle factors at multiple occupant locations for each classified surface is uploaded. The information regarding the IR image frames of the interior surfaces and their polygon coordinates must be established using the IR system on the site. In this process, the IR system builds a database with the surface class directory of each interior surface, as shown in Figure 8. One classified surface () within the surface group () has one or more assigned frames (). For each frame, its pan and tilt angles () as well as its polygon coordinates () are included as information in the surface directory.
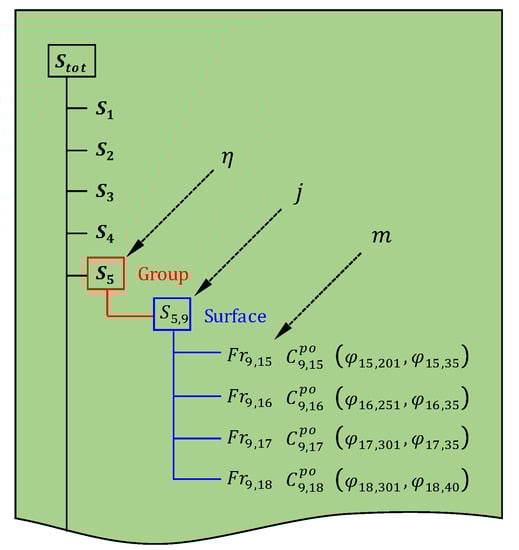
Figure 8.
Example of the surface directory.
Once the database is built, an infrared thermal image is taken for each frame in the same order as that in which the frames have been saved in the corresponding directory. One cycle is finished when all the photographing in the directory is completed. At this time, the reflected temperature on the surface is calculated, and the surface temperature is determined using the correction process. The real-time MRT is calculated using the angle factor and surface temperature.
3.2. The IR System Development
The hardware system is composed of a pan–tilt IR scanning system (IR system) and a PC for calculating and monitoring. The IR system is composed of a single integrated system with an IR detector, a pan–tilt motor, and temperature and humidity sensors. A separate power supply activates the system. The data are transmitted through the local area network (LAN). Figure 9 presents a photograph of the hardware of the developed IR system, and Table 1 lists the specifications of each system.
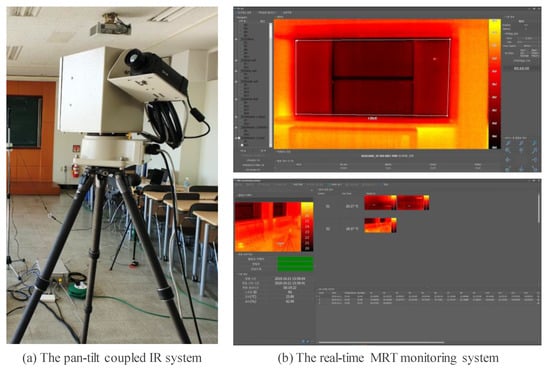
Figure 9.
Developed IR system and monitoring software.

Table 1.
Specifications of the developed pan–tilt IR scanning system.
The IR detector shown in Figure 9a measures the radiation power of the surface and can measure surface temperatures in the range of −20 to +350°C, covering most indoor and outdoor spaces. The field of view (FOV) is 45° horizontally and 33.8° vertically, covering a wide area to prevent the number of frames per cycle from becoming too large. The accuracy is within ±2%. The pan–tilt brushless direct current (BLDC) electric motor was designed to have a maximum horizontal rotation angle of 355° and a vertical rotation angle of −85° to +85°, which covers all interior surfaces considering the FOV of the IR detector. The rotation speed is 60°/s for panning and 30°/s for tilting. The accuracy is ±1°. The temperature and humidity sensors have measurements in the ranges of −20 to +60 °C and 0% to 99.9%, respectively. The accuracy is ±1% for the temperature and ±2% for the humidity at room temperature.
The IR system is connected to the MRT monitoring system. The top image in Figure 9b shows the pre-input process screen and illustrates building the frame and polygon coordinates of all the interior surfaces required for one cycle. Before starting the measurement, the user must specify the surface area, number of frames per surface, and polygon area while viewing the IR screen. When this process is complete, the directory of the surface class database for every indoor surface of the target space is established in the IR system. The bottom image in Figure 9b presents a typical real-time surface measuring screen based on the established directory. Here, the current IR screen is shown on the left bar, and the measured frames for each surface are shown on the right list. The MRT monitoring program is written in C# language.
4. Experimental Study
4.1. Description of Experimental Study
An experimental study was conducted with two objectives. One was to compare two surface temperatures measured by the proposed IR method and the existing contact thermometer method (CT method). The other was to verify the applicability of the proposed IR method to a real-time MRT estimation at multiple locations.
The target space for estimating the MRT was a university lecture room located in Incheon. The shape of the space was a long rectangle in the east and west directions, and three windows and indoor roll blinds were installed in the south (see Figure 10). Adjacent offices are located in the east and west, and corridors are located in the north. The experiment was performed from 3 a.m. to 8 p.m. on 3 November 2019. To minimize changes in the indoor environment due to other factors, the air conditioner was not operated, and all indoor blinds were kept closed.
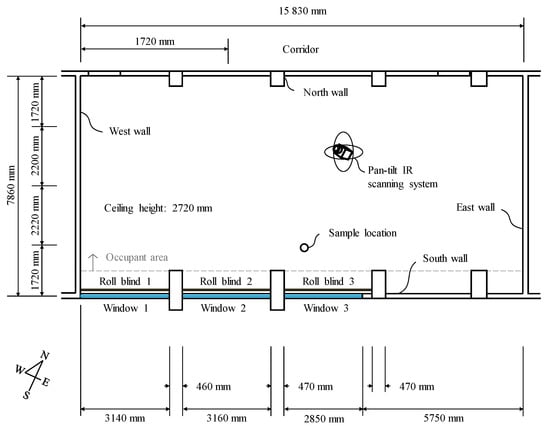
Figure 10.
Experimental set for MRT evaluation.
The CT method is a method that uses a temperature sensor in direct contact with the target surface. This method assumes that the average temperature measured at one or several points is the surface temperature [3], which is the major difference between the CT and IR method, as shown in Figure 11.
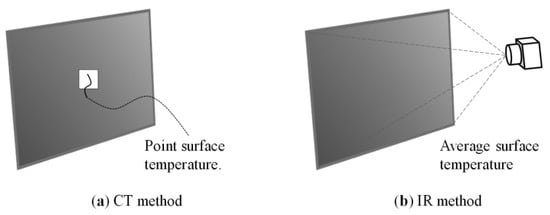
Figure 11.
Two different methods for measuring indoor surface temperature.
The contact thermometer used was CEM DT-3891G with K-type thermocouples, which have a measurement range of −200 to +1322 °C and an accuracy of ±0.15% at moderate temperatures [32]. They were installed on each blind and indoor walls, ceiling, and floor, respectively. For accurate measurements, a large pressure was induced between the sensor and the contacted surface to be closely contacted so the heat exchange between the contact temperature sensor and the surface could be much higher than the heat exchange between the sensor and the surrounding environment. In the case of blinds, the sensor was placed in the center of the blind surface, avoiding the shadow generated by the window frames.
The thermal imaging camera was installed in the center so that the IR viewing angle to the object surface normal was less than 40° or 45° to ensure the measured data accuracy [26]. The equipment shown in Table 1 was used to measure the indoor surface temperature according to the above installation environment and measurement settings.
4.2. Pre-Investigation and Pre-Evaluation
The surface dimensions and emissivity and the installed location of the thermal imaging camera were reviewed through an on-site investigation. The surface classification was derived according to the orientation of the building, configuration of the interior surfaces, and the identified material properties. Table 2 lists the major investigation results. The surfaces were divided into groups of six main directions, including the ceiling and floor surfaces. The south was set as surface group 3, which was composed of three roll blinds and one wall. The emissivity of each surface was determined from measurement using the non-contact thermometer method [29].
Table 2.
Major investigation results.
After a pre-investigation, the surface class directory was set up. The IR system was installed, and the number of IR image frames and polygon coordinates were set to nine indoor surfaces () seen through the IR detector. Three frames were set for the east and west surfaces and four and five frames for the ceiling and floor, respectively. Therefore, a total of 20 frames were set as one cycle. Figure 12 and Table 3 show the example settings for the polygon image coordinates and directory dataset input to the monitoring program.
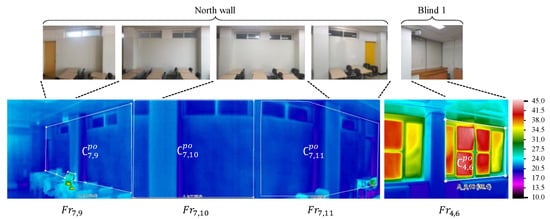
Figure 12.
Example showing polygon coordinates for north wall and blind 1.
Table 3.
Directory dataset of IR image frames input to the pan–tilt IR system.
For the angle factor calculation, the interior surfaces in the simplified 3D model were used. The dimensions of the interior surfaces were used for 3D modeling. The angle factor determines the amount of longwave radiation delivered from an interior surface with a specific temperature to an occupant at a specific location. In this study, the angle factors were calculated for 2500 occupant locations at a 1000 mm height to verify the applicability of the proposed IR method and review the MRT distribution.
The time intervals must be set to be larger than the minimum time interval limit to maintain the user’s set time interval; if the IR measurement is not completed within the time of a single cycle, the time will not match with the measured data obtained from the T/RH sensor set at the same interval. Considering the time required in IR focusing, shooting, and pan–tilt rotating repetitively for twenty frames, the minimum time interval was calculated to be six minutes for this space. Table 4 lists the major monitoring set of parameters that was input into the IR system.
Table 4.
Summary of major monitoring set.
4.3. Measurement Results
4.3.1. Comparison Results of Surface Temperatures: CT vs. IR Methods
Surface temperatures were measured by two measurement methods using a contact thermometer (CT method) and the developed pan–tilt IR system (IR method). Figure 13 shows the measurement results for three blinds and the north wall. The surface temperatures of the walls by the two methods had similar levels. Figure 13b shows the measurement result for the north wall. In the case of blinds, the temperature difference between the two methods increased during the afternoon. Figure 13a shows the measurement results for blind 3 as an example case. In this case, the largest temperature difference was up to approximately 10 °C.
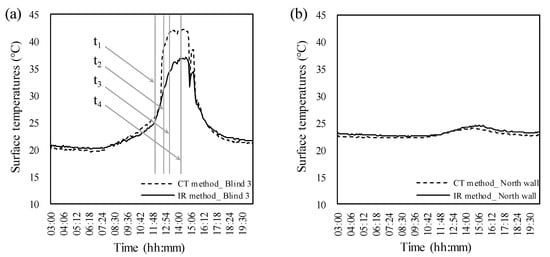
Figure 13.
Measured surface temperatures from CT and IR methods: (a) measured surface temperatures of blind 3 via CT and IR methods, (b) measured surface temperatures of the north wall via CT and IR methods.
The measured IR images were analyzed to understand the cause of the error. Figure 14 shows the IR images and their histograms at four time points starting at 12 o’clock, where the two temperatures are similar. The box in the IR image represents the polygonal area for averaging the surface temperature via the IR method. The circle represents the measurement point for the CT method for the surface temperature measurement. The IR images showed that non-uniform temperatures were distributed on the measurement area (see Figure 14 left). A large difference between the average surface temperature and the point temperature occurred as the incident area of the solar irradiance over the blind was changed. In addition, a temperature difference also occurred between the parts solar shaded by the frame and other surfaces.
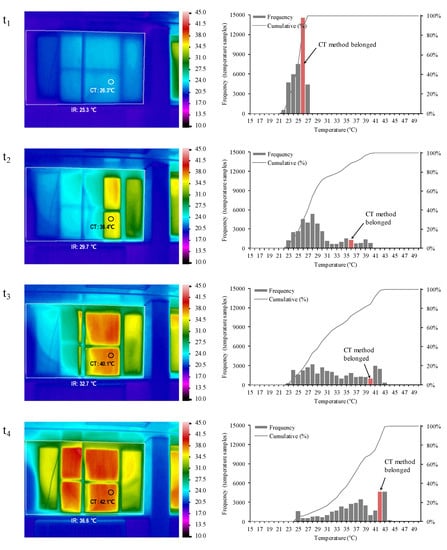
Figure 14.
Measured IR images and histograms at four time points.
The non-uniform distribution of temperature was examined more objectively by placing the data of the measurement area in a histogram (see Figure 14 right). The total number of measured temperature samples in the polygonal area was 38,192. In the histogram, each measurement was analyzed by setting the bin width as 1 °C in the range from 15 to 50 °C. The red bin shows where the temperature measured using the CT method belongs. In the case of t1 in Figure 13, the histogram showed that the surface temperature measured using the CT method was located in the same phase as the range having the highest frequency within the polygonal area. The temperature distribution was narrow from 24 to 27 °C. This resulted in a slight temperature difference between the two methods. On the other hand, the other cases (t2, t3, t4) showed broad temperature distributions from 23 to 43 °C, unlike the case of t1. Furthermore, the frequency was distributed evenly. In these cases, the measurement value can have significant errors depending on the location measured. This result showed that a non-uniform temperature distribution occurring within the surface area might result in erroneous measurements in the CT method.
The mean temperatures of each classified surface could be monitored for every set time interval using the proposed IR method. Figure 15 shows the temperature changes for the nine interior surfaces measured during the monitoring period. The three red lines showed dramatic temperature changes in the blind surfaces during the day and night.
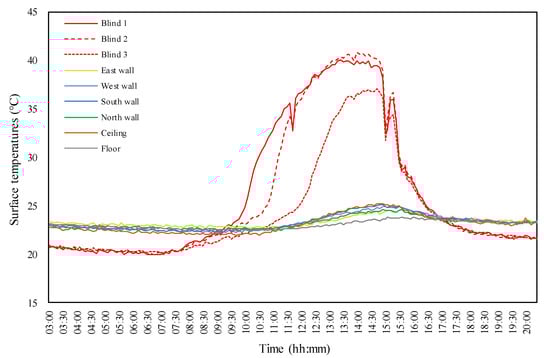
Figure 15.
Real-time surface temperatures monitored by the IR method.
The temperature on the blind surfaces (red lines) increased up to approximately 40 °C. The blind surface temperature increased first on the blind located in the east, where the sunlight reached first (i.e., blind 1). A comparison of the blind surface temperature with the surface temperature of the north wall at the opposite side (green line) showed that the blind surface temperature during the day increased to approximately 15 °C higher than the north wall surface temperature. During the night, the blind surface temperature decreased to approximately 2 °C lower than the wall surface temperature. Consequently, the temperature change range between the day and night was approximately 3 °C for the wall, but the blind surface temperature changed over a wide range of approximately 25 °C. This may be because the blinds had a low thermal capacity and were directly affected by the solar irradiance. The measurement result confirmed that this proposed IR method enables remote real-time measurements of multiple surface temperatures classified by the users.
4.3.2. Real-Time MRT Distributions
The MRT monitoring system calculates the MRT value according to the time interval set in the IR system. The surface temperatures and angle factors were used for real-time MRT calculations depending on the occupant’s location. In the experiment, the indoor MRT distributions were monitored using the IR system every six minutes during the daytime on 3 November. Figure 16 shows a heat map of the hourly MRT distributions. The MRT can have a broad temperature range of 6 °C during the daytime within the same space. This suggests that the occupants can experience different thermal comfort levels depending on their locations in the buildings. For example, assume two occupants are standing near the blind (MRT = 30.1 °C) and east wall (MRT = 24.2 °C) at 4 p.m. They are assumed to have the same personal parameters (i.e., 0.45 clo for closing insulation and 1.2 met for metabolic rates). The measured room air temperature, relative humidity, and air velocity were 23 °C, 39%, and zero, respectively. In this case, the predicted mean vote (PMV) values were evaluated at 0.33 for standing near the blind and −0.52 for the east wall. Therefore, the thermal conditions around the east wall exceeded the acceptable range of thermal environment presented in the standard (PMV < ±0.5) [33,34]. This suggests that the mean radiant temperature has a significant effect on the thermal environment.
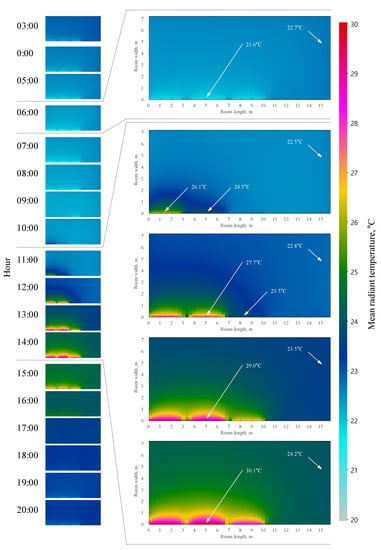
Figure 16.
Distribution of the mean radiant temperatures monitored in real-time on 3 November.
Existing research [1] reported that approximately half of the thermal comfort experienced by the human body is affected by the radiant heat exchange between the occupants and surroundings. Therefore, the effects of MRT should be considered in studies evaluating heat environments for indoor air conditioning and heating control. In actual buildings, considering the MRT values in an evaluation of the thermal environment was challenging. This is because the general method using a globe thermometer requires direct measurements at the occupant location. This experiment verified that the proposed pan–tilt IR method allows rapid, accurate, and remote measurements of the mean temperatures of all classified surrounding surfaces. Furthermore, the IR application method effectively evaluated the MRTs at multiple occupant locations.
5. Conclusions
MRTs were applied to the real-time evaluation of thermal comfort, and a method for estimating MRTs at multiple occupant locations was proposed. To calculate the angle factor, this study defined the specific classification criteria for dividing the entire indoor surface into sub-surfaces according to surface characteristics. Coupling a pan–tilt motor and IR camera was applied to measure repeatedly the mean temperature within the classified surface boundary. The developed pan–tilt IR system hardware and MRT monitoring software were presented. The experiment showed good applicability of the proposed IR scanning method to actual buildings. The MRT has a significant effect on the thermal environment.
The proposed method could evaluate the MRTs at various locations without placing a sensor at the occupant’s location. The method could remotely measure the temperatures of the entire surface at long distances. This enables the users to control the heating and cooling systems based on comprehensive thermal comfort conditions considering radiant heat stress. The major advantages of applying this method are as follows:
- No requirement to install measuring devices in occupant areas—the MRTs can be monitored remotely in a space with a high occupant density or complex occupant movement lines.
- Memorization of each location of classified indoor surfaces and repeated measurements of their average temperature—this enables continuous monitoring of the indoor surface temperature. Moreover, it can be applied to controlling radiant heating and cooling systems, such as radiant ceiling panels and floor heating, by continuously monitoring and controlling their surface temperatures.
- MRT evaluations at multiple indoor locations—individual MRT evaluations are possible for multiple occupant zones especially in large spaces, such as concert hall, dome stadium, and station.
- Minimization of the equipment installation size—single equipment can be installed in the space. Therefore, space utilization is high. This is advantageous in terms of maintenance and repair.
Despite its applicability in actual buildings, the proposed IR scanning method has limitations in the following aspects. The development cost is high. Although the globe thermometer has been widely distributed at low cost, thermal imaging cameras are expensive. Recently, several low-cost IR cameras have been produced. Applying a low-cost IR camera to the proposed method will reduce the unit price. Moreover, the proposed method can be applied in a limited fashion to measure longwave MRTs in dome structures with no windows or glass. In spaces with windows or glass, the radiation temperature at the occupant location changes because of the longwave and shortwave radiation produced by direct and diffuse solar radiation. Thus, in future work, longwave and shortwave radiation should be considered when evaluating MRT.
Author Contributions
Conceptualization, D.-S.L., and J.-H.J.; methodology, D.-S.L.; writing—original draft preparation, D.-S.L.; writing—review and editing, J.-H.J.; visualization, D.-S.L.; supervision, J.-H.J. All authors have read and agreed to the published version of the manuscript.
Funding
This research was supported by the National Research Foundation of Korea (NRF) grant (NRF-2020R1A2C3013676) funded by the Korean Government (MSIP), and this research was also supported by a grant (21AUDP-B100343-07) from the Architecture & Urban Development Research Program funded by Ministry of Land, Infrastructure, and Transport of Korean government.
Conflicts of Interest
The authors declare no conflict of interest.
Nomenclature
| Symbols | |
| polygon image coordinates (pixels) | |
| pixel coordinate (pixels) | |
| distance between IR camera to object (mm) | |
| angle factor | |
| IR image frame | |
| interior surface | |
| group of interior surfaces | |
| temperature (°C) | |
| absolute temperature (K) | |
| mean surface temperature (K) | |
| radiation power (W) | |
| Abbreviations and acronyms | |
| 3D | three-dimensional |
| AF | angle factor |
| CT | contact thermometer |
| FOV | field of view |
| GT | globe thermometer |
| IR | infrared |
| MRT | mean radiant temperature |
| Greek letters | |
| emissivity | |
| identifier of a given surface group | |
| identifier of a given pixel of IR image | |
| transmittance | |
| radiant power contribution | |
| identifier of a given pan–tilt angle | |
| Subscripts | |
| a | air, atmospheric |
| H | pan rotation |
| i | identifier of a given occupant location |
| j | identifier of a given interior surface |
| m | identifier of a taken IR image and polygon |
| obj | abject |
| refl | reflected, reflection |
| th interior surface of indoor space | |
| th surface group | |
| t | time |
| tot | total |
| tilt rotation | |
| Superscripts | |
| bb | black body |
| po | polygon |
| px | pixel |
| Etc | |
| mean value | |
| number of elements in a set | |
| complementary set |
References
- Guo, H.; Aviv, D.; Loyola, M.; Teitelbaum, E.; Houchois, N.; Meggers, F. On the understanding of the mean radiant temperature within both the indoor and outdoor environment, a critical review. Renew. Sustain. Energy Rev. 2020, 117, 109207. [Google Scholar] [CrossRef]
- Walikewitz, N.; Jänicke, B.; Langner, M.; Meier, F.; Endlicher, W. The difference between the mean radiant temperature and the air temperature within indoor environments: A case study during summer conditions. Build. Environ. 2015, 84, 151–161. [Google Scholar] [CrossRef]
- Aparicio, P.; Salmerón, J.M.; Ruiz, Á.; Sánchez, F.J.; Brotas, L. The globe thermometer in comfort and environmental studies in buildings. Rev. de la Construcción 2016, 15, 57–66. [Google Scholar] [CrossRef][Green Version]
- Halawa, E.; Van Hoof, J.; Soebarto, V. The impacts of the thermal radiation field on thermal comfort, energy consumption and control—A critical overview. Renew. Sustain. Energy Rev. 2014, 37, 907–918. [Google Scholar] [CrossRef]
- Guo, H.; Teitelbaum, E.; Houchois, N.; Bozlar, M.; Meggers, F. Revisiting the use of globe thermometers to estimate radiant temperature in studies of heating and ventilation. Energy Build. 2018, 180, 83–94. [Google Scholar] [CrossRef]
- d’Ambrosio Alfano, F.R.; Dell’Isola, M.; Palella, B.I.; Riccio, G.; Russi, A. On the measurement of the mean radiant temperature and its influence on the indoor thermal environment assessment. Build. Environ. 2013, 63, 79–88. [Google Scholar] [CrossRef]
- Lindberg, F.; Holmer, B.; Thorsson, S. SOLWEIG 1.0—Modelling spatial variations of 3D radiant fluxes and mean radiant temperature in complex urban settings. Int. J. Biometeorol. 2008, 52, 697–713. [Google Scholar] [CrossRef]
- Lau, K.K.L.; Ren, C.; Ho, J.; Ng, E. Numerical modelling of mean radiant temperature in high-density sub-tropical urban environment. Energy Build. 2016, 114, 80–86. [Google Scholar] [CrossRef]
- Fanger, P.O. Thermal Comfort: Analysis and Applications in Environmental Engineering; McGraw-Hill: New York, NY, USA, 1972; Volume 139, ISBN 0070199159. [Google Scholar]
- Vorre, M.H.; Jensen, R.L.; Le Dréau, J. Radiation exchange between persons and surfaces for building energy simulations. Energy Build. 2015, 101, 110–121. [Google Scholar] [CrossRef]
- ISO 7726. Ergonomics of the Thermal Environment—Instruments for Measuring Physical Quantities; ISO: Geneva, Switzerland, 1998. [Google Scholar]
- Cheong, C.-H.; Hwang, S.-H.; Park, B.-Y. Analysis on Indoor Thermal Comfort of Buildings. J. Arch. Inst. Korea 2014, 16, 187–194. [Google Scholar]
- Guo, H.; Ferrara, M.; Coleman, J.; Loyola, M.; Meggers, F. Simulation and measurement of air temperatures and mean radiant temperatures in a radiantly heated indoor space. Energy 2020, 193, 116369. [Google Scholar] [CrossRef]
- Revel, G.M.; Arnesano, M.; Pietroni, F. Development and validation of a low-cost infrared measurement systemfor real-time monitoring of indoor thermal comfort. Meas. Sci. Technol. 2014, 25. [Google Scholar] [CrossRef]
- Dizeu, F.B.D.; Maldague, X.; Bendada, A. Mapping of the indoor conditions by infrared thermography. J. Imaging 2016, 2, 10. [Google Scholar] [CrossRef]
- Frenzel, C.; Gröger, S.; Hiller, M.; Kessling, W.; Müllner, K. Simulation of Thermal comfort in soccer stadia using trnsys 17 transsolar Energietechnik GmbH, Stuttgart, Germany Technische Universität München, Lehrstuhl für energieeffizientes und nachhaltiges Planen und Bauen, Munich, Germany. Proc. Build. Simul. 2011, 2011, 14–16. [Google Scholar]
- La Gennusa, M.; Nucara, A.; Rizzo, G.; Scaccianoce, G. The calculation of the mean radiant temperature of a subject exposed to the solar radiation—A generalised algorithm. Build. Environ. 2005, 40, 367–375. [Google Scholar] [CrossRef]
- Hiller, M.; Aschaber, J.; Dillig, M. Integration of low-e surfaces and shortwave solar radiation into human comfort calculation in TRNSYS 17. BauSim 2010 Build. Perform. Simul. A Chang. Environ. 2010, 247–253. [Google Scholar]
- Kim, D.G.; Han, K.I.; Choi, J.H.; Lee, J.J.; Kim, T.K. Study on View Factor Calculation for Radiative Heat Transfer By Using the Mesh Subdivision Method. J. Comput. Fluids Eng. 2014, 19, 1–6. [Google Scholar] [CrossRef]
- Eriksson, F. On the Measure of Solid Angles. Math. Mag. 1990, 63, 184–187. [Google Scholar] [CrossRef]
- Van Oosterom, A.; Strackee, J. The Solid Angle of a Plane Triangle. IEEE Trans. Biomed. Eng. 1983, BME-30, 125–126. [Google Scholar] [CrossRef]
- Lee, D.S.; Kim, E.J.; Cho, Y.H.; Kang, J.W.; Jo, J.H. A field study on application of infrared thermography for estimating mean radiant temperatures in large stadiums. Energy Build. 2019, 202, 109360. [Google Scholar] [CrossRef]
- La Gennusa, M.; Nucara, A.; Pietrafesa, M.; Rizzo, G.; Scaccianoce, G. Angle factors and projected area factors for comfort analysis of subjects in complex confined enclosures: Analytical relations and experimental results. Indoor Built Environ. 2008, 17, 346–360. [Google Scholar] [CrossRef]
- Sui, X.; Zhang, X.U. Analysis on combinations of indoor thermal microclimate parameters in radiant cooled residential buildings and drawing of new thermal comfort charts. Build. Serv. Eng. Res. Technol. 2016, 37, 66–84. [Google Scholar] [CrossRef]
- Choi, D.-S.; Ko, M.-J. Prediction and Sensitivity Analysis of Thermal Insulation Performance of Wall Using Infrared Thermograph(IRT). J. Korean Soc. Living Environ. Syst. 2017, 24, 223–231. [Google Scholar] [CrossRef]
- Vollmer, M.; Mollmann, K.-P. Infrared Thermal Imaging; WILEY_VCH Verlag GmbH &, Co.: Weinheim, Germany, 2010; ISBN 9783527403820. [Google Scholar]
- Gargano, M.; Cavaliere, F.; Viganò, D.; Galli, A.; Ludwig, N. A new spherical scanning system for infrared reflectography of paintings. Infrared Phys. Technol. 2017, 81, 128–136. [Google Scholar] [CrossRef]
- ASTM E 1862 Standard test methods for measuring and compensating for reflected temperature using infrared imaging radiometers. ASTM Int. 2010, 1–3. [CrossRef]
- ASTM E 1933 Standard test methods for measuring and compensating for emissivity using infrared imaging radiometers. ASTM Int. 2007, 1–3.
- FLIR. Available online: http://www.flir.com (accessed on 10 September 2018).
- Autonics. Available online: https://www.autonics.com/main (accessed on 5 January 2019).
- CEM. Available online: http://www.cem-instruments.com/ (accessed on 12 January 2019).
- ASHRAE 55. Thermal Environmental Conditions for Human Ocupancy. ASHRAE Stand. 2010, 55, 227. [Google Scholar]
- ISO 7730. Ergonomics of the thermal environment—Analytical determination and interpretation of thermal comfort using calculation of the PMV and PPD indices and local thermal comfort criteria. ISO 2005, 2, 3–4. [Google Scholar]


Publisher’s Note: MDPI stays neutral with regard to jurisdictional claims in published maps and institutional affiliations. |
© 2021 by the authors. Licensee MDPI, Basel, Switzerland. This article is an open access article distributed under the terms and conditions of the Creative Commons Attribution (CC BY) license (https://creativecommons.org/licenses/by/4.0/).