Article

Time Series InSAR Three-Dimensional Displacement Inversion Model of Coal Mining Areas Based on Symmetrical Features of Mining Subsidence

1
Key Laboratory of Digital Earth Science, Aerospace Information Research Institute, Chinese Academy of Sciences, Beijing 100094, China
2
College of Resources and Environment, University of Chinese Academy of Sciences, Beijing 100049, China
3
School of Surveying and Mapping Science and Technology, Xi’an University of Science and Technology, Xi’an 710054, China
*
Author to whom correspondence should be addressed.
Remote Sens. 2021, 13(11), 2143; https://doi.org/10.3390/rs13112143
Submission received: 20 April 2021 / Revised: 14 May 2021 / Accepted: 27 May 2021 / Published: 29 May 2021

Abstract

:
The three-dimensional (3-D) displacements of mining areas is the basis of studying the mining subsidence law and obtaining surface movement parameters. The traditional multi-temporal interferometry synthetic aperture radar (InSAR) technology can only obtain the surface deformation in line-of-sight (LOS) direction, even if some methods can obtain the 3-D displacements of mining area based on InSAR. However, it has high data requirements for data types, which are not conducive to the inversion of 3-D displacements. In this paper, the symmetry of the surface basin caused by mining subsidence under different mining degrees is analyzed. According to the basic symmetrical features of mining subsidence—that the surface vertical displacement and horizontal displacement in near horizontal coal seam is symmetrical with respect to the main section of the basin, combined with time series InSAR technology (TS-InSAR)—a novel method for retrieving the 3-D displacement results from a single-geometry InSAR dataset based on symmetrical features (hereafter referred to as the SGI-SF method) is proposed. The SGI-SF method first generates multi-temporal observations of LOS displacement from a single-geometry InSAR dataset, and then transforms them into multi-temporal observations of 3-D displacement datasets according to symmetrical features. There is no necessity to obtain the surface movement parameters from the measured data to calculate 3-D displacement fields. Finally, the time series of 3-D displacements are estimated from multi-temporal 3-D displacements using the singular value decomposition (SVD) method. Nine descending Sentinel-1 images from the Yulin mining area of China are used to test the proposed SGI-SF method. The results show that the average root mean square errors (RMSE) in the vertical and horizontal direction of the three-dimensional deformations are approximately 9.28 mm and 13.10 mm, respectively, which are much smaller than mining-induced displacements and can provide support for deformation monitoring in mining areas.

Graphical Abstract

1. Introduction

Most advanced monitoring technologies are used to monitor the surface subsidence and movement in the mining area of the working panel regularly and periodically and then to understand the development trend and dynamic changes in real time, thus preventing upcoming disasters and reducing losses [1,2,3,4,5]. Various mining movement parameters can be obtained by obtaining the in-situ surface deformation of observation stations in mining areas [2]. The commonly used methods of monitoring surface displacement are traditional geodetic methods, such as leveling surveying, total station observation, Global Navigation Satellite System (GNSS) measurement [6,7,8], conventional photogrammetry based on airborne imagery [9] and airborne laser (Light Detection and Ranging or LiDAR) [10]. However, these methods are usually time-consuming, climate-sensitive, expensive and labor-intensive and cannot obtain the mining-induced surface deformation of the whole basin [11].
InSAR technology has been developed in recent years and, compared with traditional monitoring methods, has the advantages of measurements in all-weather conditions, low cost, high resolution, wide coverage, etc. [12,13]. With its development, InSAR technology has been gradually introduced into the monitoring of surface deformation [11,14,15,16,17,18,19,20]. In the recent 20 years, temporal InSAR technology has effectively overcome the problems of temporal and geometrical decorrelations [21] and atmospheric delay anomalies [22]. TS-InSAR algorithms include Permanent Scatterer (PSInSAR) [23], Small Baseline Subset (SBAS) [24], Interferometric Point Target Analysis (IPTA) [25], Stanford Method for Persistent Scatterers (StaMPS) [26], Quasi-Persistent Scatterers (QPS) [27], Persistent Scatterer Pairs (PSP) [28] and Spatio-Temporal Unwrapping Network (STUN) [29]. InSAR technology and above TS-InSAR technology can only obtain the displacement in the LOS direction of radar but cannot meet the requirements of 3-D deformation monitoring.
In the past, most of the surface deformation monitoring results based on InSAR of coal mining areas are 1-D LOS deformation. Wright and Stow obtained LOS deformation maps over the Selby coalfield in the United Kingdom from European remote sensing (ERS) satellite SAR images in 1999 and confirmed the subsidence can be measured by D-InSAR to an accuracy of a few centimetres [30]. The application of TS-InSAR in coal mining areas can better reveal the temporal evolution law of mining deformation and SBAS-InSAR performs better than PS-InSAR in deformation monitoring of mining area [31,32,33,34]. Zhang and Wang et al. proposed an algorithm that modified time-series InSAR technique combining persistent scatterers (PSs) and distributed scatterers (DSs) for surface deformation monitoring in coal mining areas, which increased the density of measurement points [35,36]. In addition, the SAR datasets with longer wavelengths (e.g., L band) have a greater ability to measure mining-induced displacement than those with shorter wavelengths (e.g., X and C bands) [37,38].
The LOS displacement result is a superposition of the surface point 3-D displacements in the up-down, north-south and west-east directions [39]. To retrieve full 3-D displacement fields, various methods based on InSAR technology have been developed, such as the integration of measurements from multiple sensors by multitrack D-InSAR [40,41,42], D-InSAR combined with offset tracking [43,44], D-InSAR combined with multi-aperture interferometry [45,46], D-InSAR combined with GPS [47], the method of establishing physical relationship between horizontal displacement and vertical deformation and (hereafter referred to as the PRHV method) [48], and retrieved three-dimensional displacement fields of mining areas from a single InSAR pair (SIP) [49,50]. The PRHV method and SIP-based method are both inversed the 3D deformation by establishing the gradient relationship between subsidence and horizontal movement. The PRHV method is based on the hypothesis proposed by Kratzsch that the horizontal displacement is proportional to the tilt; the SIP-based method is based on the stochastic medium model [51] proposed by Litwiniszyn. The SIP-based method has the problem of error propagation: when calculating the deformation along the north–south and west–east directions, it is affected by the subsidence error, which leads to the error of horizontal displacement becoming larger [50]. Additionally, the SIP-based method needs surface movement parameters, such as a horizontal movement constant and major influence angle, that are obtained from the observation data. The dynamic distribution of vertical displacement and horizontal displacement characteristics are very complicated in the process of mining and the existing mining subsidence theory has not yet established a functional model for vertical displacement with horizontal displacement under dynamic mining condition. Therefore, the 3-D displacement inversion method based on the deterministic function relationship between subsidence and horizontal displacement has some limitations.
In this paper, we analyze the symmetry of mining subsidence from the theory of mining subsidence. According to the basic characteristics of the symmetry of the surface subsidence and horizontal displacement in a near-horizontal coal seam, combined with time series InSAR technology, a novel method for retrieving the 3-D displacement results from a single-geometry InSAR dataset based on symmetrical features is proposed. As surface subsidence lags behind underground mining, it is necessary to determine the center of surface movement basin at each interference period of image dataset. Based on the characteristics about the displacement of basin center on near horizontal coal seam, we propose a novel method for automatically searching the center of a basin. In the inversion of 3-D deformation, the proposed method does not need the prior surface movement parameters obtained from the measured data, so it has a wide range of applicability. The three-dimensional deformation field retrieved by SGI-SF method is verified by the sentinel-1 data and measured data of Yulin mining area and the result show the effectiveness of the method.

2. Methodology

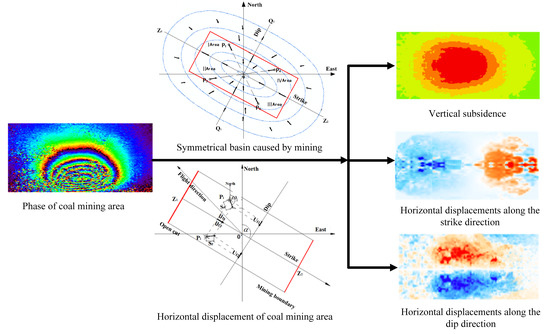
2.1. Symmetry Analysis of Mining Areas Based on Mining Theory

According to the existing theory of mining subsidence, under normal horizontal coal seam mining conditions, because the dip angle of the coal seam is close to zero, the geometric characteristics and physical properties of the overlying rock formation and the surface are all isotropic. The overlying strata and surface subsidence basins caused by mining are symmetrically distributed, and their symmetry axes are major cross section along dip direction and along strike direction, which go through the center of the mined-out areas and are parallel and perpendicular to the direction of the working panel, respectively [52]. The subsidence and horizontal displacement of any point on the surface of the subsidence basin have a symmetrical point about the major cross section along dip direction and along strike direction under a stable surface [53,54,55,56]. Therefore, only half of the observation line is set on one side of the open cutting or stopping line of the working panel, and the characteristics of the whole surface of the moving basin are described by the observed values on the main section of half of the moving basin [52].
According to the basic principle of mining subsidence in horizontal coal seams, the distribution of subsidence and horizontal displacement in the main section under different mining levels is shown in Figure 1 [57,58]. In Figure 1, under the conditions of non-full mining and super-full mining, the subsidence and horizontal displacements in the main section of the movement surface are all symmetrically distributed around the surface point O (the point of maximum subsidence above the center of the basin). The horizontal displacement direction at all points in the surface movement basin points to point O, which corresponds to the center of the mined-out areas, as shown in Figure 2. The major cross section along dip direction Z1Z2 and along strike direction Q1Q2 intersect at the O point, and the surface movement basins are divided into four regions: I, II, III and IV. It can be seen from the horizontal movement curve in Figure 1 and the subsidence isoline in Figure 2 that, (1) any two symmetrical points P1 and P3 in symmetrical regions I and III have the same subsidence, and the horizontal displacements are equal in value and opposite in direction, as are the two symmetrical points P2 and P4 in symmetrical regions II and IV and, (2) any two symmetrical points P1 and P2 in symmetrical regions I and II have the same subsidence and same horizontal displacement along strike direction, and the horizontal displacements along the dip direction are equal in value and opposite in direction, as are the two symmetrical points P3 and P4 in symmetrical regions III and IV [52].

2.2. Geometric Relationship between the Radar LOS Direction and 3-D Direction

The displacements of the surface point along the LOS direction are projected from the east–west, north–south and up–down 3-D displacements of the movement surface, and the geometric relation between them is shown in Figure 3 [49].
As shown in Figure 3, θ is the incident angle of the radar, and αh is the heading angle of the platform, which is defined as the angle between the flight direction of the satellite and the north direction (the clockwise direction is positive). The relationship between the radar LOS displacements and the 3-D displacements of the surface points can be described by the spatial geometric relationship of Figure 3, which is shown as Equation (1).
d L O S = W cos θ sin θ [ U N cos ( α h 3 π / 2 ) + U E sin ( α h 3 π / 2 ) ]
As shown in Equation (1), the west–east, north–south and up–down components of the real ground displacements are UN, UE and W, respectively. InSAR-derived deformation is along the radar line-of-sight (LOS) direction, which is the joint contribution of actual 3-D ground surface displacements in accordance with the imaging geometries of SAR sensors [59,60].

2.3. The SGI-SF Method for Deriving Time Series 3-D Displacement Fields

2.3.1. The SGI-SF Inversion Method at Pixel Level

As the dip angle of the near-horizontal coal seam is close to zero, the subsidence and horizontal displacement in the movement surface state are always symmetrical with the major cross section along strike direction. As shown in Figure 4, the main strike section Z1Z2 is always taken as the symmetry axis of the movement and deformation of the surface point during the advance of the working panel. The subsidence values of P1 and P2 and the horizontal displacement value along the strike direction are equal, while the horizontal displacement value along the dip direction is equal and the direction is opposite. In Figure 4, the horizontal displacement direction of P1 points to the dynamic surface movement basin with center O’, and the angle between this direction and the north direction is ω1. Due to the lag in the surface subsidence, the center O’ of the mining movement basin is not located in the center of the dynamic mined-out areas and generally tends towards the side of the open cut. The angle between the advancing direction of the working panel and the north direction is the azimuth of the advancing direction of the working panel, and the angle between the horizontal displacement direction of symmetrical points P1 and P2 and Z1Z2 is (ω1 − α).
The horizontal displacements of the strike and dip are UT and UI, respectively, and the horizontal displacement components UN and UE are along the north–south and east–west directions; then, the conversion relationship between the two displacement components is as follows:
U T = U E sin α + U N cos α U I = U E cos α U N sin α
According to the symmetrical characteristics of the moving surface in near-horizontal coal seam mining, the following relations can be obtained:
U T 1 = U T 2 U I 1 = U I 2 W 1 = W 2
Let the LOS displacement of symmetry points P1 and P2 in Figure 4 be dLOS1 and dLOS2, respectively. Refer to Equation (1) can obtain the relationship between the LOS displacement and the vertical, south–north, east–west displacement W1, W2, UN1, UN2, UE1 and UE2. According to Equations (1)–(3), the relations between the LOS displacement and the vertical, dip direction, strike direction displacement W1, W2, UI1, UI2, UT1 and UT2 can be obtained:
d L O S 1 = cos θ W 1 + ( B sin α + C cos α ) U I 1 + ( B cos α C sin α ) U T 1 d L O S 2 = cos θ W 2 ( B sin α + C cos α ) U I 2 + ( B cos α C sin α ) U T 2
In Equation (4), B = −sinθ cos(αh − 3/2π), C = −sinθ sin(αh − 3/2π). The horizontal displacement components UI1 and UI2 and the horizontal displacement components of strike UT1 and UT2 can be obtained by the difference of the two expressions in Equation (4):
U I 1 = d L O S 1 d L O S 2 2 ( B sin α + C cos α ) = U I 2
U T 1 = U I 1 tan ( α ω 1 ) = d L O S 1 d L O S 2 2 tan ( α ω ω 1 ) ( B sin α + C cos α ) = U T 2
Adding the two equations in Equation (4), and then substituting Equation (6), the sinking components W1 and W2 can be obtained as follows:
W 1 = [ d L O S 1 + d L O S 2 [ ( B cos α C sin α ) ( d L O S 1 d L O S 2 ) ] / tan ( α ω 1 ) ( B sin α C cos α ) ] ] / 2 cos θ = W 2
Substituting Equations (5) and (6) into Equation (2) obtains the displacement of points P1 and P2 in the north–south and east–west directions:
U N 1 = ( d L O S 1 d LOS 2 ) [ sin α tan ( α ω 1 ) + cos α ] / 2 tan ( α ω 1 ) ( B sin α + C cos α ) U N 2 = ( d L O S 1 d LOS 2 ) [ sin α tan ( α ω 1 ) + cos α ] / 2 tan ( α ω 1 ) ( B sin α + C cos α ) U E 1 = ( d L O S 1 d LOS 2 ) [ cos α tan ( α ω 1 ) sin α ] / 2 tan ( α ω 1 ) ( B sin α + C cos α ) U E 2 = ( d L O S 1 d LOS 2 ) [ cos α tan ( α ω 1 ) sin α ] / 2 tan ( α ω 1 ) ( B sin α + C cos α )
Equations (7) and (8) are the inversion models of the three-dimensional displacement from InSAR LOS deformation. The intermediate variables B and C in the formula are the same as in Equation (4).

2.3.2. Deriving Time Series 3-D Displacement Fields

Assuming that there are N+1 SAR images acquired from a single imaging geometry and relative to the same mining areas, we define these acquisition times as t = [t0, t1tN]. M small-baseline interferograms are formed from the N+1 SAR images by setting a given threshold for the spatiotemporal baselines. M interference pairs are processed by differential interferometry, and M interference phases are obtained. The minimum cost flow method (MFC) [61] is used to unwrap M interference phases, M unwrapped phases are obtained and the unwrapped phase is expressed as follows:
Δ ϕ M × 1 = [ Δ ϕ 1 , Δ ϕ 2 , Δ ϕ 3 , , Δ ϕ M ]
According to Equations (7) and(8), the relationship between the phase and vertical deformation and horizontal deformation can be obtained:
Δ W i 1 = [ λ 4 π ( ( Δ ϕ i 1 + Δ ϕ i 2 ) ( B cos α C sin α ) ( Δ ϕ i 1 Δ ϕ i 2 ) ) / 2 tan ( α ω 1 ) ( B sin α + C cos α ) ] / 2 cos θ
Δ U N i 1 = λ ( ( Δ ϕ i 1 + Δ ϕ i 2 ) [ sin α tan ( α ω 1 ) + cos α ] / 8 π tan ( α ω 1 ) ( B sin α + C cos α )
Δ U E i 1 = λ ( ( Δ ϕ i 1 + Δ ϕ i 2 ) [ cos α tan ( α ω 1 ) sin α ] / 8 π tan ( α ω 1 ) ( B sin α + C cos α )
Superscripts 1 and 2 represent point 1 and corresponding point 2 in Figure 4, respectively. Other parameters have the same meaning as in Section 2.3, and i represents the i-th interference pair I = [1, 2, 3……M]. We get the vector of the mean subsidence velocity and deformation velocity along north–south and west–east directions between each two time-adjacent SAR acquisitions, and thus, we can obtain the following system for each pixel:
F M × N V W N × 1 = Δ W 1 × M F M × N V U N N × 1 = Δ U N 1 × M F M × N V U E N × 1 = Δ U E 1 × M V W = [ V W 1 , V W 2 , , V W N ] T V U N = [ V U N 1 , V U N 2 , , V U N N ] T V U E = [ V U E 1 , V U E 2 , , V U E N ] T
where F is a coefficient matrix that depends on the formed small-baseline InSAR pairs. To easily and effectively combine all the available small-baseline interferograms, the minimum-norm criterion and the singular value decomposition (SVD) method are used to obtain the 3-D displacement velocity between each pair of time-adjacent SAR acquisitions from M small-baseline interferograms. Then, the time series 3-D displacements of the mining area can be estimated by the following:
W ( t m ) = i = 1 m ( t i t i 1 ) V W i , ( m = 1 , 2 , , N ) U N ( t m ) = i = 1 m ( t i t i 1 ) V U N i , ( m = 1 , 2 , , N ) U E ( t m ) = i = 1 m ( t i t i 1 ) V U E i , ( m = 1 , 2 , , N )
After obtaining the three-dimensional deformation, the movement basin can be analyzed and the surface movement parameters can be inversed. In addition, the displacements along the up–down, west–east and north–south directions can convert to displacements along the vertical and horizontal directions.

2.3.3. Determining the Center of the Dynamic Surface Movement Basin

To obtain the azimuth of horizontal displacement ω1 when the working panel is advancing, it is necessary to determine the dynamic center O’ of the surface movement basin. It takes time for the influence of underground mining to propagate from underground to the surface, which makes the surface movement basin center O’ lag behind the corresponding central position of the mined-out areas, and the specific lag position is difficult to determine due to different geological mining conditions. According to the basic law of mining subsidence, the dynamic movement basin center O’ point of the near horizontal coal seam has following characteristics [10]:
  • The subsidence value of the center point O’ in the moving basin should be the maximum value in the whole major cross section along strike direction; and
  • The absolute value of the horizontal displacement at the center point O’ in the moving basin should be close to zero.
According to the above characteristics, based on the superposition calculation of the D-InSAR LOS displacement on the major cross line along strike direction Z1Z2, the moving basin center O’ is examined. In the geometric relationship between the LOS displacement and subsidence and the dip horizontal displacement and strike horizontal displacement, since the horizontal displacement perpendicular to the major cross line along the strike direction is zero, the three-dimensional displacement decomposition formula of any point of the major cross line along strike direction can be obtained from Equation (1):
d L O S = cos θ W + ( B cos α C sin α ) U T
Since the subsidence values of symmetrical points on both sides of the center O’ of the basin are equal and the horizontal displacement is equal in value and opposite in direction (both pointing to the center O’), the LOS displacements of symmetrical points on both sides of the center point O’ (adjacent pixels on both sides of the point O’ can be selected) are added, and then the average value, which is the subsidence value WM, is calculated. The value of the horizontal displacement UM can be obtained by the difference in the LOS displacement of symmetrical points on both sides of the center O’. Since the point is in the center point O’ of the moving basin, the subsidence value WM should be the maximum subsidence value in the whole major cross section along strike direction and the horizontal displacement value should approach zero. Therefore, the 0displacement values of any two adjacent pixels (or a certain window area) on the main section of the whole strike are superposed and differentially processed, and the pixel pairs satisfying the maximum subsidence value and zero horizontal displacement are investigated. The middle position is the dynamic basin center O’. The specific steps are as follows:
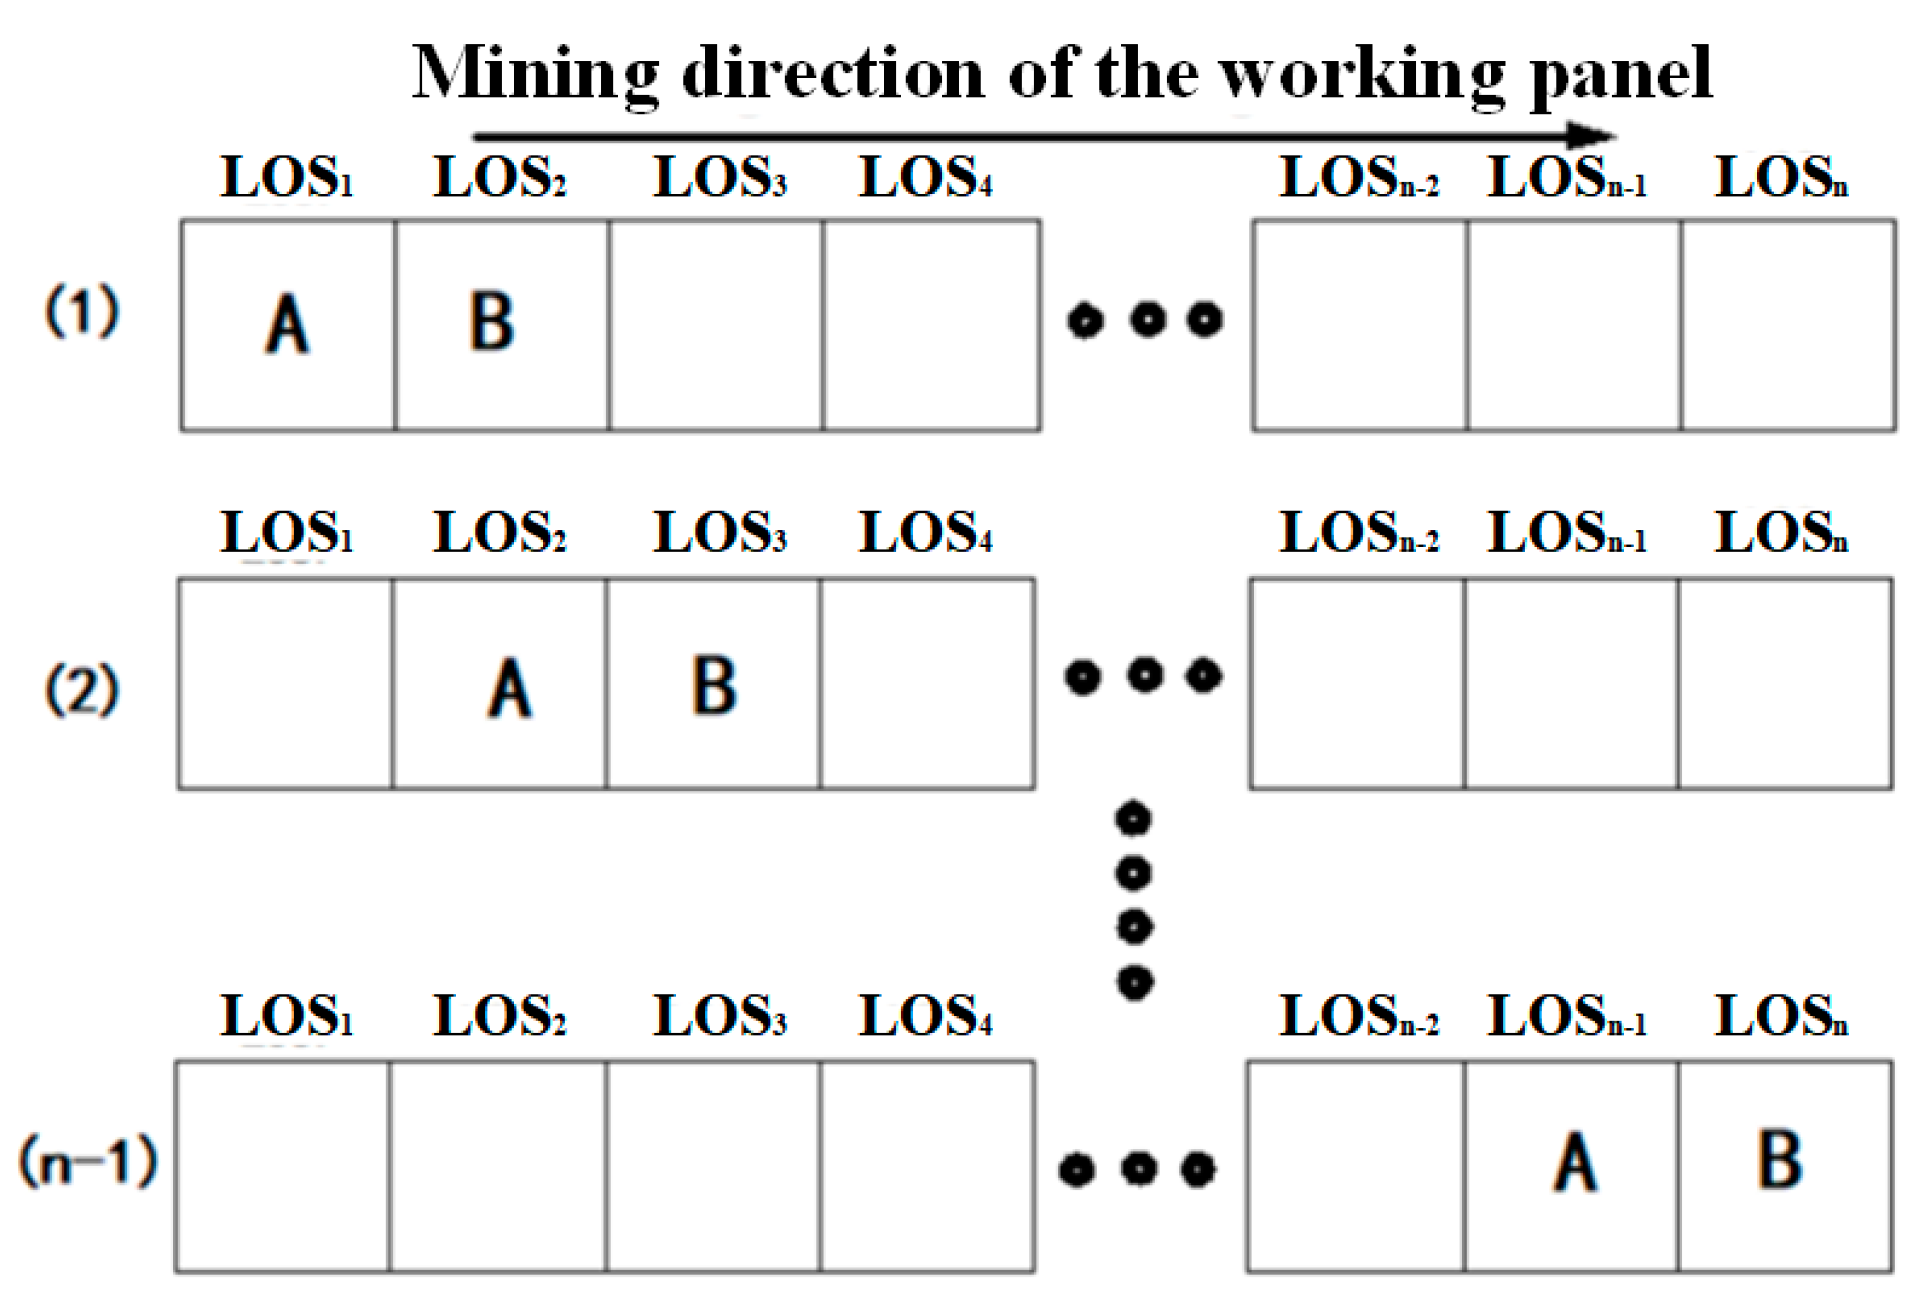
  • Number the pixel displacement on the major cross section along strike direction in the LOS displacement map (LOS1, LOS2, LOS3, LOS4LOSn−2, LOSn−1, LOSn). As the center of the basin cannot deviate beyond the mined-out areas, the search can start from the open cut.
  • Select the displacement values of pixel 1 and pixel 2, express them with dLOSA and dLOSB, and substitute them into Equation (15).
d L O S A = cos θ W A + ( B cos α C sin α ) U T A d L O S B = cos θ W B + ( B cos α C sin α ) U T B W A = W B U T A = U T B
The dLOSA and dLOSB in the above formula are superposed and differentiated, respectively, and the subsidence and horizontal displacement values of pixel 1 and pixel 2 are calculated and recorded as the first group displacement (W1, UT1).
  • The displacement values of pixel 2 and pixel 3 are selected and assigned to dLOSA and dLOSB, respectively. The subsidence and horizontal displacement values of pixel 2 and pixel 3 are calculated from Equations (7) and (8) and recorded as the second group displacement (W2, UT2).
  • This process continues until the subsidence and horizontal displacement values of pixels N-1 and N are calculated and recorded as a group of N−1 data, forming an array of displacement values (W1, UT1), (W2, UT2)… (WN−1, UT(N−1)). The calculation flow is shown in Figure 5.
  • By comparing the above (n−1) values, the pixel group with the largest subsidence value and the pixel group with the smallest absolute value of horizontal displacement are found. When the two pixel groups are the same, the middle position of this pixel group is the center point O’ of the moving basin. When the two pixel groups conflict, the middle position of the group with the largest subsidence value is preferred as the basin center O’.
The “flat bottom” phenomenon appears in the center of the moving basin after the local surface subsidence reaches super-full mining. According to the above search method, multiple groups of pixel regions satisfying the conditions are obtained. In this case, the horizontal displacement in the half basin on one side of the cutting hole points to the first group of qualified pixel positions, while the horizontal displacement in the half basin on the other side of the advancing boundary points to the last group of qualified pixel positions.

3. Study Area and Datasets

3.1. Study Area

The Yulin coal mining area (marked by the red dashed line in Figure 6), which is located northwest of the city of Yulin, Shanxi Province, China, was selected to test the SGI-SF method.
The minerals in the geological strata above the coal seam are mainly quartz and feldspar. The surface of the working panel is covered by thick eolian sand and vegetation. To mitigate the potentially adverse effects caused by the interpolation error of the external digital elevation model (DEM) and the atmospheric artifact phase, we chose a study area with a relatively flat terrain (see the black point in Figure 6a). From 7 November 2018 to 3 September 2019, the 301 working panels of the Yulin mining area was operated at a mean mining depth of approximately 550 m, with a mean advancing velocity of approximately 2.5 m/day. The geographic locations of this working panel are shown in Figure 6b. The mining length of the 301 working panels is 1078 m, the average mining width is 241 m, the average mining thickness is 5.3 m and the coal seam dip angle is 0.5°.

3.2. SAR Data Selection and Data Processing

Sentinel 1 contains C-band data, and the wavelength is 5.6 cm. It is difficult to monitor the large deformation gradient in mining areas due to serious decorrelation phenomena. The dramatic seasonal variation in the land cover can give rise to severe decorrelation in interferograms. To ensure the reliability of the processing results, the winter with a high coherence is selected as the experimental period. We select 9 images from 26 November 2018 to 7 April 2019 for processing. The footprint of these SAR images is marked by the red rectangle in Figure 6a.
To select suitable thresholds for the perpendicular and temporal baselines of the InSAR pairs, we set 500 m and 48 days as the thresholds of the perpendicular and temporal baselines. After eliminating the interferograms with severe decorrelation, we obtain 18 available InSAR pairs, and their perpendicular and temporal baselines are plotted in Figure 7.
Subsequently, the two-pass D-InSAR procedure [62] is utilized to process the 18 available InSAR pairs. In this procedure, the 1 arc-second Shuttle Radar Topography Mission (SRTM) DEM is applied to remove the topographic phase component of the interferograms. Additionally, the least squares-based filter [63] and time filter is utilized to suppress the noise in the interferograms.
We use SRTM DEM and precise orbit data to preprocess the sentinel data and then generate the single look complex (SLC) data after registration. The SRTM DEM is applied to remove the topographic phase component of the interferograms and generate 18 pairs of interference phase, and the temporal and perpendicular baselines are shown in Figure 8. In this procedure, a multi-look operation, of 2:8 pixels in the range and azimuth directions, is carried out. To further suppress the noise in the interferograms, Goldstein filtering is performed. The minimum cost flow algorithm [61,64] is applied to unwrap the differential interferograms with the same reference point. Finally, the SVD method is used to obtain the time series LOS deformation.
Before the 3-D displacements are generated, the basic parameters of the working panel and the basic information of the Sentinel 1 satellite parameters need to be determined. We only need to determine the mining azimuth angle and the spatial position of the major cross section along dip direction of the working panel and do not need to determine the mining height, horizontal motion constant, mining depth, or major influence angle of the working panel. When the major cross section along dip direction is uncertain, the maximum subsidence point of the major cross section along dip direction and strike direction can be evaluated by twice basin center search methods to determine the basin center. The incidence angle and heading angle of the SAR data are 36.67° and 67° and 347.66°, respectively. After acquiring the values of these parameters, we apply the SGI-SF method to process the 8 geocoded LOS deformation maps to generate the multi-temporal observations of vertical subsidence.

4. Results

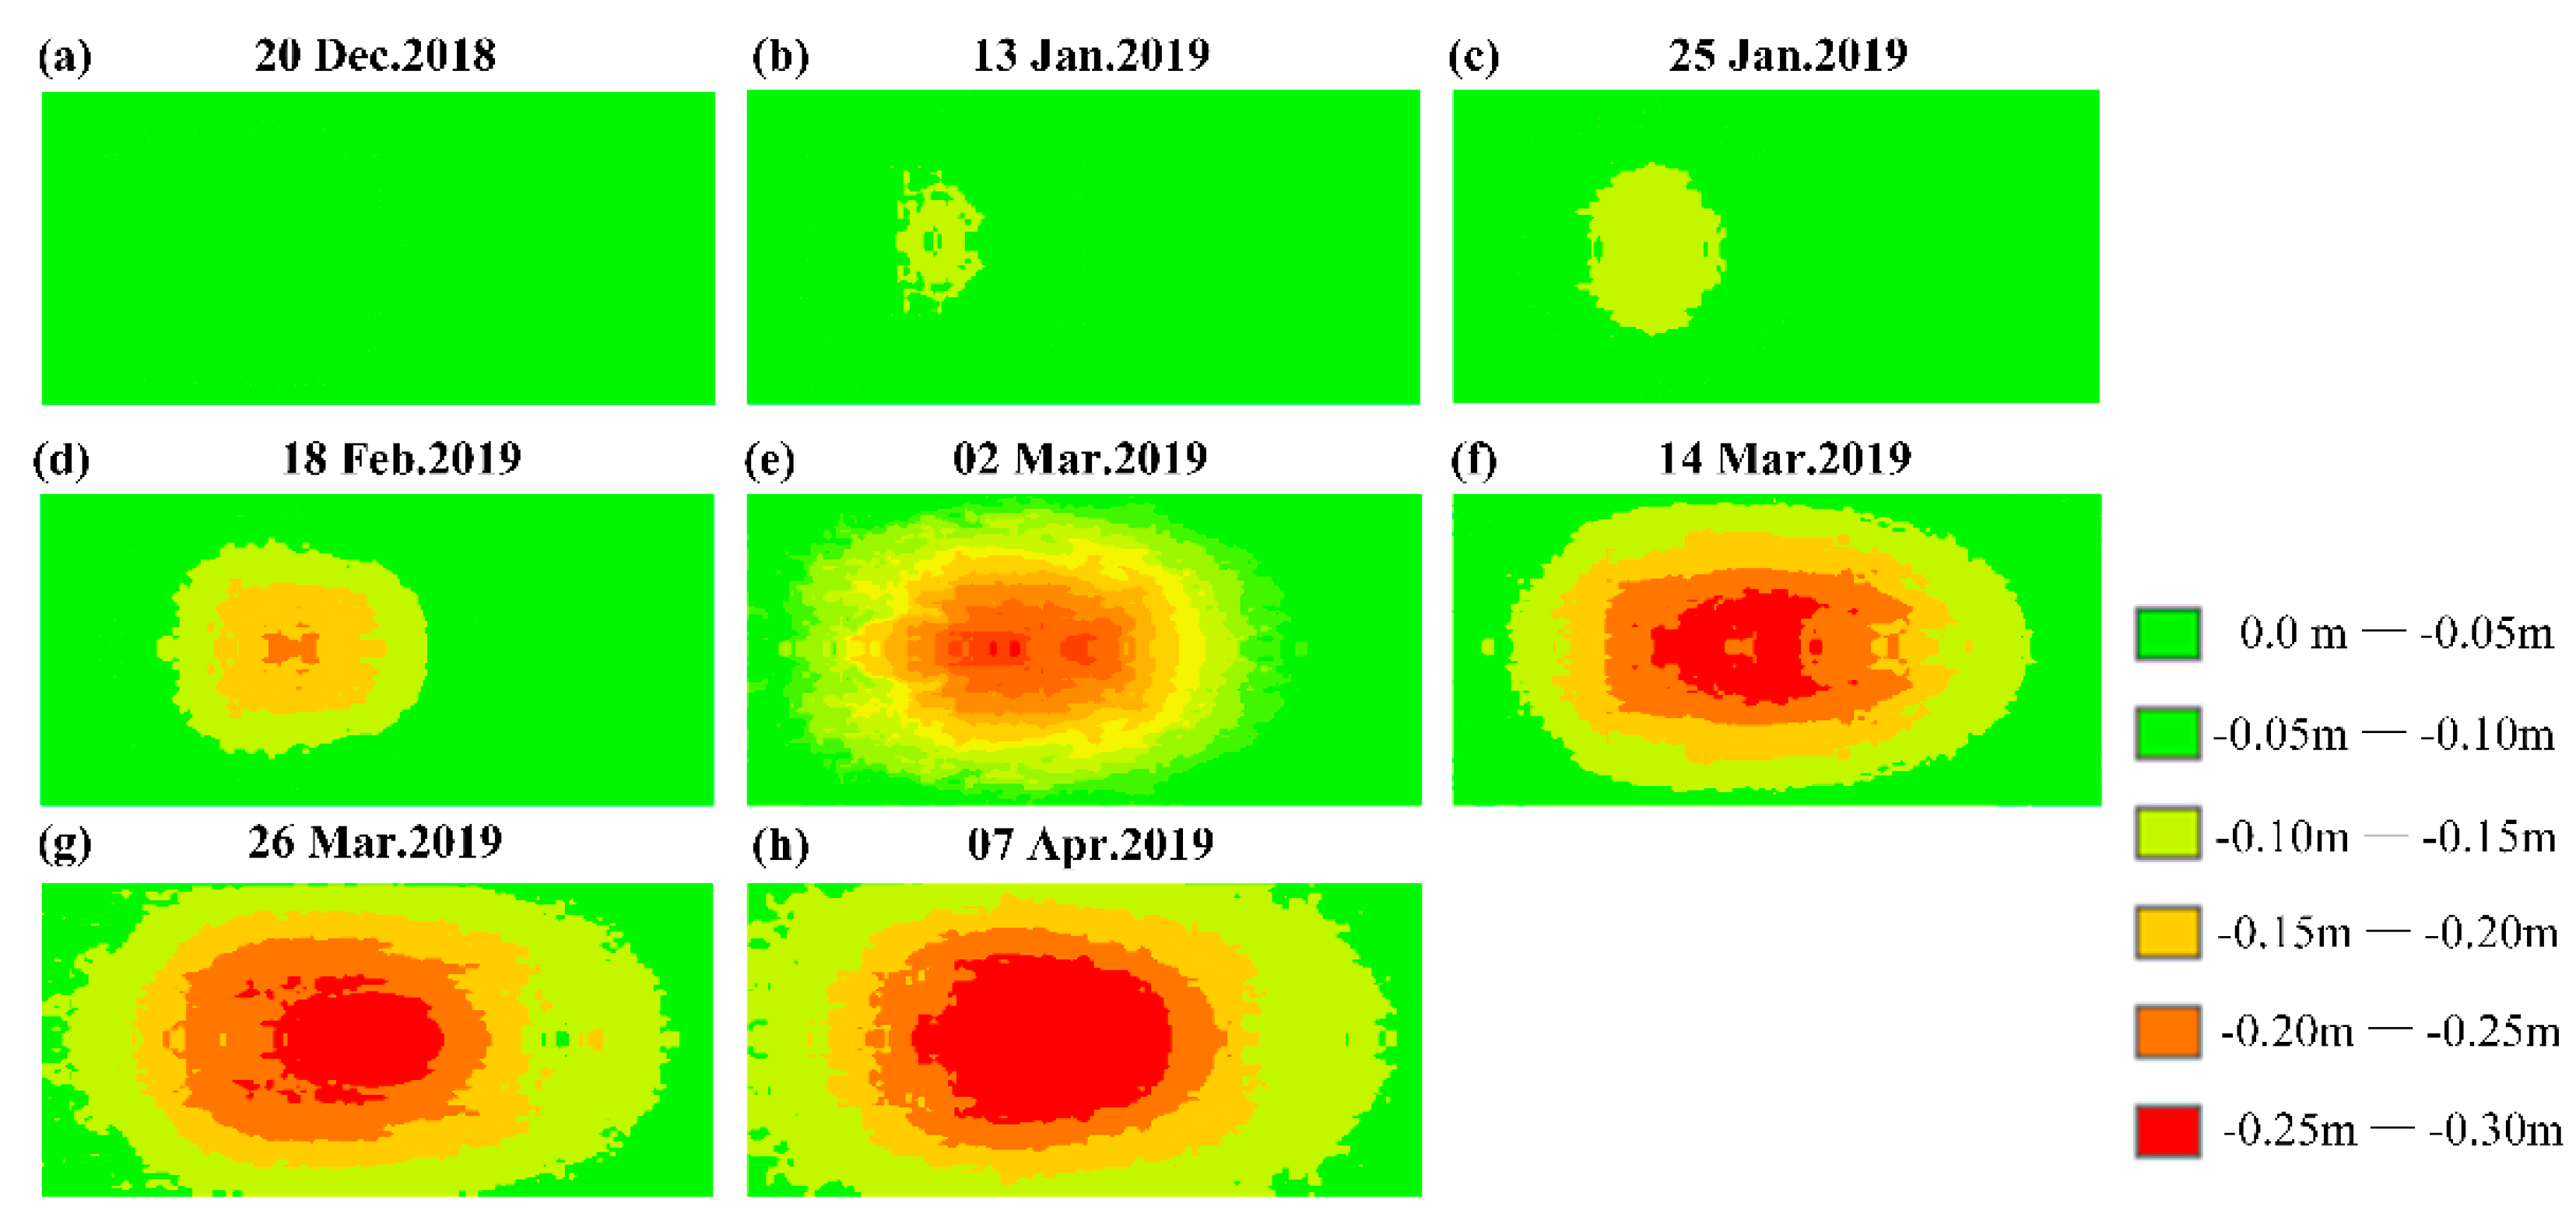
4.1. Estimation of Time Series 3-D Displacements

For each pixel in the study area, the eight unknown 3-D displacements between time-adjacent SAR acquisitions needed to be estimated by 18 multi-temporal observation of phase and transformed into multi-temporal observation of 3-D displacement datasets according. The time series displacements along the up–down, west–east and north–south directions in the study area with respect to the reference acquisition of 26 November 2018 are estimated by Equation (20). For analysis, displacements along the up–down, west–east and north–south directions are converted to displacements along the up–down, strike and dip directions. The time series displacement results along the up-down, strike and dip directions are shown in Figure 8, Figure 9 and Figure 10, respectively.
With the advancement of underground mining (see the red arrow in Figure 6a), the subsidence of the basin expanded extensively in the following 5 months. The maximum subsidence value reached −0.30 m, and the maximum absolute horizontal displacement in the strike and dip directions increased to 0.15 m and 0.08 m, respectively.
For each pixel in the study area, the eight unknown 3-D displacements between time-adjacent SAR acquisitions needed to be estimated by 18 SIP-derived multi-temporal 3-D displacements. The time series displacements along the up–down, west–east and north–south directions in the study area with respect to the reference acquisition of 26 November 2018 were estimated by Equation (20).
For analysis, displacements along the up–down, west–east and north–south directions are converted to displacements along the up–down, strike and dip directions. The time series displacement results along the up–down, strike and dip directions are shown in Figure 8, Figure 9 and Figure 10, respectively. With the advancement of underground mining (see the white arrow in Figure 6b), the subsidence basin expanded extensively in the following 5 months. The maximum subsidence value reached −0.30 m, and the maximum absolute horizontal displacement in the strike and dip directions increased to 0.15 m and 0.08 m, respectively.

4.2. Verification

The in-situ GPS measurements of the mining-induced vertical subsidence and horizontal motions at 45 surface observation points along the dip observation line (see line AA’ in Figure 6) from 10 April 2018 to 17 February 2019 are used as validation data. In these measurements, the observations of the horizontal motions are generated by synthesizing the 2-D horizontal motions in the east and north directions (or strike and dip directions). The 3-D displacement results on 7 April 2019 are compared with the verification data, and the two time periods are more consistent, which allows us to quantitatively evaluate the accuracies of the estimated 3-D displacements. We then synthesize the accumulated 2-D horizontal motions in the east and north directions. Finally, we compare the vertical subsidence and horizontal motions with the in-situ GPS measurements, and the results are plotted in Figure 11.
The comparison shows that the trend of the deformation reflected by the proposed method is basically consistent with the in-situ GPS observation value. The average root mean square error (RMSE) of the estimated subsidence over all of the observation points is approximately 9.28 mm. The RMSE of the estimated horizontal motions over all of the observation points is approximately 13.10 mm. These RMSEs equate to 3.6% and 6.3% of the maximum SGI-SF estimated 3-D displacements in the vertical (0.305 m) and horizontal (0.213 m) directions, respectively. This result indicates that the SGI-SF estimated time series 3-D displacements are reliable. As InSAR is not sensitive to north–south deformation, the estimation error of horizontal movement is larger than that of subsidence.

5. Discussion

As we know, the PRHV method proposed by S. Samieie-Esfahany et al. and SIP-based method proposed by Z.W. Li et al. are both inversed the 3-D deformation by establishing the gradient relationship between subsidence and horizontal movement, but the latter method has better performance than the PRHV method because it assumes a simpler gradient relationship. Different from the two methods, this paper proposes SGI-SF method based on the analysis of symmetry characteristics of surface movement caused by coal mining, which has never been used in 3-D deformation inversion of coal mining area. This method has the following advantages: (1) there is no error propagation problem, and there is no need to calculate horizontal displacement by settlement; (2) in the calculation, it is not necessary to know the surface movement parameters obtained from the measured data, but only need to know the location of mined-out areas, which is easier to obtain than measured data. Therefore, the proposed method has a wider range of application scenarios than other methods.
Existing mining subsidence research confirmed that in the case of near-horizontal coal seam longwall face mining with a small topographic relief, the surface movement basin does have obvious symmetrical morphological characteristics. In the process of advancing the working panel, the dynamic subsidence and horizontal displacement of the surface also have symmetrical characteristics with major cross section along strike direction. In the most ideal state, the surface movement basin above the working panel must have the symmetry characteristics mentioned above, but the measurement results are not completely symmetrical due to the influence of complex geological conditions on the surface movement and deformation. Under complex geological conditions (such as large faults, folds, aquifers or mountain surface conditions), the movement and deformation trends of surface basins are covered, showing unique trends that vary from place to place, and the research in this area is still insufficient, which is a difficult problem in the field of mining damage research. Several complex geologies influence the law of surface subsidence and are listed as follows: (1) the influence of faults on mining subsidence; (2) the characteristics of surface movement and deformation in mountainous terrain; (3) the rich water layer greatly influences the surface movement and deformation; (4) the influence of the mining method and roof management method; and (5) the influence of the uneven nature of the rock stratum [65]. In reality, it is almost impossible to find a place without faults, dip angles, water layers, flat terrain and coal mines, so in most cases, the ground movement of coal mining is affected by complex geological conditions [66].

6. Conclusions

In this paper, we proposed a new model of time series 3-D displacement inversion from a single-geometry InSAR dataset according to the symmetrical characteristics of subsidence and horizontal displacement in the surface basin of near the horizontal coal seam. We selected nine descending Sentinel-1 images over the Yulin mining area of China from 26 November 2018 to 7 April 2019 to test the proposed SGI-SF method. The results show that the maximum time series 3-D displacements in the time period of SAR data acquisition reach 0.305, 0.151 and 0.82 m in the vertical, strike, and dip directions, respectively. In addition, the accuracy of the SGI-SF method was evaluated by comparing time series 3-D displacements results with in-site GPS or leveling measurements. The comparison result shows that the average root mean square error (RMSE) of the estimated subsidence and horizontal motions over all of the observation points was approximately 9.28 mm and 13.10 mm, respectively. These RMSEs equate to 3.6% and 6.3% of the maximum SGI-SF-estimated 3-D displacements in the vertical (0.305 m) and horizontal (0.213 m) directions, respectively.
This result indicates that the SGI-SF-estimated time series 3-D displacements are reliable. Testing of the model with practical examples reveals that the 3-D displacements estimated by the model are effective. In the inversion of 3-D deformation, the proposed method does not need the prior surface movement parameters obtained from the measured data, so it has a wide range of application scenarios.

Author Contributions

Conceptualization, L.D., C.W., H.Z. and F.T.; methodology, L.D and F.T.; software, L.D., Y.T. and J.W.; validation, L.D., C.W. and W.D.; formal analysis, L.D., F.T. and H.Z.; investigation, L.D.; resources, C.W., H.Z. and Y.T.; data curation, L.D., and J.W.; writing—original draft preparation, L.D.; writing—review and editing, C.W., H.Z. and Y.T.; visualization, L.D.; supervision, C.W. and H.Z.; project administration, C.W.; funding acquisition, C.W. All authors have read and agreed to the published version of the manuscript.

Funding

This research was funded by the National Natural Science Foundation of China (41930110 and 41801348) and the National Key Research and Development Program of China (2016YFB05 01501).

Data Availability Statement

Sentinel-1 data is provided by the European Space Agency (ESA) and available from the Alaska Satellite Facility (ASF) (https://vertex.daac.asf.alaska.edu). SRTM DEM data is available at https://srtm.csi.cgiar.org/srtmdata/.

Acknowledgments

The authors would like to thank ESA and EU Copernicus Programme for providing the Sentinel-1A SAR data, and thank NASA and CGIAR-CSI for providing SRTM DEM data.

Conflicts of Interest

The authors declare no conflict of interest.

References

  1. Yang, Z.; Li, Z.; Zhu, J.J. InSAR-based model parameter estimation of probability integral method and its application for predicting mining-induced horizontal and vertical displacements. IEEE Trans. Geosci. Remote Sens. 2016, 54, 4818–4832. [Google Scholar] [CrossRef]
  2. Boone, S.J. Ground-movement-related building damage. J. Geotech. Eng. 1996, 122, 886–896. [Google Scholar] [CrossRef]
  3. Malinowska, A.; Hejmanowski, R. Building damage risk assessment on mining terrains in Poland with GIS application. Int. J. Rock Mech. Min. Sci. 2010, 47, 238–245. [Google Scholar] [CrossRef]
  4. Saeidi, A.; Deck, O.; Verdel, T. Comparison of building damage assessment methods for risk analysis in mining subsidence regions. Geotech. Geol. Eng. 2013, 31, 1073–1088. [Google Scholar] [CrossRef] [Green Version]
  5. Yang, Z.F.; Li, Z.W.; Zhu, J. Deriving dynamic subsidence of coal mining areas using InSAR and logistic model. Remote Sens. 2017, 9, 125. [Google Scholar] [CrossRef] [Green Version]
  6. Carne, C.; Delacourt, C. Three years of mining subsidence monitored by SAR interferometry, near Gardanne, France. J. Appl. Geophys. 2000, 43, 43–54. [Google Scholar] [CrossRef]
  7. Ge, L.; Rizos, C.; Han, S. Mining Subsidence Monitoring Using the Combined InSAR and GPS Approach. In Proceedings of the 10th International Symposium on Deformation Measurements, Orange, CA, USA, 19–22 March 2001; pp. 1–10. [Google Scholar]
  8. Ng, A.; Chang, H.C.; Ge, L. Assessment of radar interferometry performance for ground subsidence monitoring due to underground mining. Earth Planets Space 2009, 61, 733–745. [Google Scholar] [CrossRef] [Green Version]
  9. Soole, K. Displacement monitoring and visualisation using terrestrial photogrammetry. In Proceedings of the 5th Mine Subsidence Technology Society Conference, Maitland, NSW, Australia, 26–28 August 2001; pp. 181–187. [Google Scholar]
  10. Mills, K.W. Developments in understanding subsidence with improved monitoring. In Proceedings of the 8th Conference on Mine Subsidence, Hunter Valley, NSW, Australia, 15–17 May 2011; pp. 25–41. [Google Scholar]
  11. Samsonov, S.; d’Oreye, N.; Smets, B. Ground deformation associated with post-mining activity at the French- German border revealed by novel InSAR time series method. Int. J. Appl. Earth Obs. 2013, 23, 142–154. [Google Scholar] [CrossRef]
  12. Ferretti, A.; Savio, G.; Barzaghi, R. Submillimeter accuracy of InSAR time series: Experimental validation. IEEE Trans. Geosci. Remote Sens. 2007, 45, 1142–1153. [Google Scholar] [CrossRef]
  13. Pepe, A.; Calò, F. A review of interferometric synthetic aperture RADAR (InSAR) multi-track approaches for the retrieval of Earth’s surface displacements. Appl. Sci. 2017, 7, 1264. [Google Scholar] [CrossRef] [Green Version]
  14. Raucoules, D.; Maisons, C.; Camec, C.; Le Mouelic, S.; King, C.; Hosford, S. Monitoring of slow ground deformation by ERS radar interferometry on the Vauvert salt mine (France): Comparison with ground-based measurement. Remote Sens. Environ. 2003, 88, 468–478. [Google Scholar] [CrossRef]
  15. Wang, C.; Zhang, Z.; Zhang, H.; Wu, Q.; Zhang, B.; Tang, Y. Seasonal deformation features on Qinghai–Tibet railway observed using time-series InSAR technique with high-resolution TerraSAR-X images. Remote Sens. Lett. 2017, 8, 1–10. [Google Scholar] [CrossRef]
  16. Wang, C.; Zhang, Z.; Zhang, H.; Zhang, B.; Tang, Y.; Wu, Q. Active Layer Thickness Retrieval of Qinghai–Tibet Permafrost Using the TerraSAR-X InSAR Technique. IEEE J. Sel. Top. Appl. Earth Obs. Remote Sens. 2018, 11, 4403–4413. [Google Scholar] [CrossRef]
  17. Wang, J.; Wang, C.; Zhang, H.; Tang, Y.; Zhang, X.; Zhang, Z. Small-Baseline Approach for Monitoring the Freezing and Thawing Deformation of Permafrost on the Beiluhe Basin, Tibetan Plateau Using TerraSAR-X and Sentinel-1 Data. Sensors 2020, 20, 4464. [Google Scholar] [CrossRef]
  18. Hartwig, M.E.; Paradella, W.R.; Mura, J.C. Detection and monitoring of surface motions in active open pit iron mine in the Amazon Region, using persistent scatterer interferometry with terrasar-x satellite data. Remote Sens. 2013, 5, 4719–4734. [Google Scholar] [CrossRef] [Green Version]
  19. Zhao, C.; Lu, Z.; Zhang, Q. Time-series deformation monitoring over mining regions with SAR intensity -based offset measurements. Remote Sens. Lett. 2013, 4, 436–445. [Google Scholar] [CrossRef]
  20. Paradella, W.R.; Ferretti, A.; Mura, J.C.; Galo, M.; Camargo, P.O.; Gama, F.F.; Tamburini, A.; Santos, R.A.; Novali, F.; Galo, M.; et al. Mapping surface deformation in open pit iron mines of Carajas Province (Amazon Region) using an integrated SAR analysis. Eng. Geol. 2015, 193, 61–78. [Google Scholar] [CrossRef] [Green Version]
  21. Zebker, H.A.; Villasenor, J. Decorrelation in interferometric radar echoes. IEEE Trans. Geosci. Remote Sens. 1992, 30, 959. [Google Scholar] [CrossRef] [Green Version]
  22. Massonnet, D.; Feigl, K.L. Radar interferometry and its application to changes in the Earth’s surface. Rev. Geophys. 1998, 36, 441–500. [Google Scholar] [CrossRef] [Green Version]
  23. Ferretti, A.; Prati, C.; Rocca, F. Permanent scatterers in SAR interferometry. IEEE Trans. Geosci. Remote Sens. 2001, 39, 8–20. [Google Scholar] [CrossRef]
  24. Berardino, P.; Fornaro, G.; Lanari, R.; Sansosti, E. A new algorithm for surface deformation monitoring based on small baseline differential SAR interferograms. IEEE Trans. Geosci. Remote Sens. 2002, 40, 2375–2383. [Google Scholar] [CrossRef] [Green Version]
  25. Werner, C.; Wegmuller, U.; Strozzi, T.; Wiesmann, A. Interferometric point target analysis for deformation mapping. In Proceedings of the 2003 IEEE International Geoscience and Remote Sensing Symposium, Toulouse, France, 21–25 July 2003; pp. 4362–4364. [Google Scholar]
  26. Hooper, A.; Zebker, H.; Segall, P.; Kampes, B. A new method for measuring deformation on volcanoes and other natural terrains using InSAR persistent scatterers. Geophys. Res. Lett. 2004, 31. [Google Scholar] [CrossRef]
  27. Perissin, D.; Wang, T. Time-Series InSAR Applications Over Urban Areas in China. IEEE J. Stars. 2011, 4, 92–100. [Google Scholar] [CrossRef]
  28. Costantini, M.; Falco, S.; Malvarosa, F.; Minati, F.; Trillo, F.; Vecchioli, F. Persistent Scatterer Pair Interferometry: Approach and Application to COSMO-SkyMed SAR Data. IEEE J. Stars. 2014, 7, 2869–2879. [Google Scholar] [CrossRef]
  29. Kampes, B.M.; Hanssen, R.F. Ambiguity resolution for permanent scatterer interferometry. IEEE Trans. Geosci. Remote Sens. 2004, 42, 2446–2453. [Google Scholar] [CrossRef] [Green Version]
  30. Wright, P.; Stow, R. Detecting mining subsidence from space. Int. J. Remote Sens. 1999, 20, 1183–1188. [Google Scholar] [CrossRef]
  31. Colesanti, C.; Mouelic, S.; Bennani, M.; Raucoules, D.; Carnec, C.; Ferretti, A. Detection of mining related ground instabilities using the permanent scatterers technique—a case study in the east of France. Int. J. Remote Sens. 2005, 26, 201–207. [Google Scholar] [CrossRef]
  32. Mura, J.C.; Paradelle, W.R.; Gama, F.F.; Silva, G.G.; Galo, M.; Camargo, P.O.; Silva, A.Q.; Silva, A. Monitoring of non-linear ground movement in an open pit iron mine based on an integration of advanced DInSAR techniques using TerraSAR-X data. Remote Sens. 2016, 8, 409. [Google Scholar] [CrossRef] [Green Version]
  33. Dong, S.; Samsonov, S.; Yin, H.; Yao, S.; Xu, C. Spatio-temporal analysis of ground subsidence due to underground coal mining in Huainan coalfield, China. Environ. Earth Sci. 2015, 73, 5523–5534. [Google Scholar] [CrossRef]
  34. Grzovic, M.; Ghulam, A. Evaluation of land subsidence from underground coal mining using TimeSAR (SBAS and PSI) in Springfield, Illinois, USA. Nat. Hazards 2015, 79, 1739–1751. [Google Scholar] [CrossRef]
  35. Zhang, Z.; Wang, C.; Tang, Y.; Zhang, H.; Fu, Q. Analysis of ground subsidence at a coal-mining area in Huainan using time-series InSAR. Int. J. Remote Sens. 2015, 36, 5790–5810. [Google Scholar] [CrossRef]
  36. Zhang, Z.; Wang, C.; Tang, Y.; Fu, Q.; Zhang, H. Subsidence monitoring in coal area using time-series InSAR combining persistent scatterers and distributed scatterers. Int. J. Appl. Earth Obs. Geoinf. 2015, 39, 49–55. [Google Scholar] [CrossRef]
  37. Strozzi, T.; Wegmuller, U.; Werner, C.; Wiesmann, A.; Spreckels, V. JERS SAR interferometry for land subsidence monitoring. IEEE Trans. Geosci. Remote Sens. 2003, 41, 1702–1708. [Google Scholar] [CrossRef]
  38. Ng, A.; Ge, L.; Du, Z.; Wang, S.; Ma, C. Satellite radar interferometry for monitoring subsidence induced by longwall mining activity using Radarsat-2, Sentinel-1 and ALOS-2 data. Int. J. Appl. Earth Observ. Geoinf. 2017, 61, 92–103. [Google Scholar] [CrossRef]
  39. Hanssen, R.F. Radar Interferometry: Data Interpretation and Error Analysis; Springer Science & Business Media: New York, NY, USA, 2001; Volume 2, pp. 132–159. [Google Scholar]
  40. Gray, L. Using multiple RADARSAT InSAR pairs to estimate a full three-dimensional solution for glacial ice movement. Geophys Res Lett. 2011, 38, L05502/1–L05502/6. [Google Scholar] [CrossRef]
  41. Wright, T.J.; Parsons, B.E.; Lu, Z. Toward mapping surface deformation in three dimensions using InSAR. Geophys. Res. Lett. 2004, 31. [Google Scholar] [CrossRef] [Green Version]
  42. Hu, J.; Ding, X.L.; Li, Z.W.; Zhu, J.J.; Sun, Q.; Zhang, L. Kalman. filter-based approach for multi-sensor, multitrack and multitemporal InSAR. IEEE Trans. Geosci. Remote Sens. 2013, 51, 4226–4239. [Google Scholar] [CrossRef]
  43. Fialko, Y.; Sandwell, D.; Simons, M.; Rosen, P. Three-dimensional deformation caused by the Bam, Iran, earthquake and the origin of shallow slip deficit. Nature 2005, 435, 295–299. [Google Scholar] [CrossRef] [PubMed]
  44. Hu, J.; Li, Z.W.; Zhu, J.J.; Ren, X.C.; Ding, X.L. Inferring three-dimensional surface displacement field by combining SAR interferometric phase and amplitude information of ascending and descending orbits. Sci China Earth Sci. 2010, 53, 550–560. [Google Scholar] [CrossRef]
  45. Jung, H.S.; Lu, Z.; Won, J.S.; Poland, M.P.; Miklius, A. Mapping three-dimensional surface deformation by combining multiple-aperture interferometry and conventional interferometry: Application to the June 2007 eruption of Kilauea Volcano, Hawaii. IEEE Geosci. Remote Sens. Lett. 2011, 8, 34–38. [Google Scholar] [CrossRef]
  46. Hu, J.; Li, Z.W.; Ding, X.L.; Zhu, J.J.; Zhang, L.; Sun, Q. 3D coseismic displacement of 2010 Darfield, New Zealand earthquake estimated from multi-aperture InSAR and D-InSAR measurements. J. Geodesy 2012, 86, 1029–1041. [Google Scholar] [CrossRef]
  47. Gudmundsson, S.; Sigmundsson, F.; Carstensen, J.M. Three-dimensional surface motion maps estimated from combined interferometric synthetic aperture radar and GPS data. J. Geophys Res. 2002, 107, 2250. [Google Scholar] [CrossRef]
  48. Samieie-Esfahany, S.; Hanssen, R.; van Thienen-Visser, K.; Munt- endam-Bos, A. On the effect of horizontal deformation on InSAR subsidence estimates. In Proceedings of the Fringe 2009 Workshop, Frascati, Italy, 30 November–4 December 2009; Volume 30. [Google Scholar]
  49. Li, Z.W.; Yang, Z.F.; Zhu, J.J. Retrieving three-dimensional displacement fields of mining areas from a single InSAR pair. J. Geodesy 2015, 89, 17–32. [Google Scholar] [CrossRef]
  50. Yang, Z.; Li, Z.; Zhu, J. Deriving time-series three-dimensional displacements of mining areas from a single-geometry InSAR dataset. J. Geodesy 2018, 92, 529–544. [Google Scholar] [CrossRef]
  51. Litwiniszyn, J. The theories and Model Research of Movements of Ground Masses. In Proceedings of the European congress Ground Movement, Leeds, UK, 9 April–12 April 1957; pp. 203–209. [Google Scholar]
  52. Kratzsch, H. Mining Subsidence Engineering; Springer Science & Business Media: New York, NY, USA, 2012; pp. 183–242. [Google Scholar]
  53. Yang, Y.; Gong, Z.; Liang, B. Dynamic subsidence basins in coal mines based on rock mass rheological theory. Min. Sci. Technol. 2011, 21, 333–335. [Google Scholar] [CrossRef]
  54. Li, Y.Y.; Chen, L.Q.; Wen, H.Y.; Hongyu, W.; Zhou, T.J.; Zhang, T. Pyrosequencing-based assessment of bacterial community structure in mine soils affected by mining subsidence. Int. J. Min. Sci. Technol. 2014, 24, 701–706. [Google Scholar] [CrossRef]
  55. Zhou, D.W.; Wu, K.; Cheng, G.L. Mechanism of mining subsidence in coal mining area with thick alluvium soil in China. Arab. J. Geosci. 2015, 8, 1855–1867. [Google Scholar] [CrossRef]
  56. Li, P.X.; Peng, D.; Tan, Z.X.; Deng, K.Z. Study of probability integration method parameter inversion by the genetic algorithm. Int. J. Min. Sci. Technol. 2017, 27, 1073–1079. [Google Scholar] [CrossRef]
  57. Guo, G.L.; Zha, J.F.; Bin, W.; Jia, X.G. Study of “3-step mining” subsidence control in coal mining under buildings. J. China Univ. of Min. and Technol. 2007, 17, 316–320. [Google Scholar] [CrossRef]
  58. Hu, J.; Li, Z.W.; Ding, X.L. Resolving three-dimensional surface displacements from InSAR measurements: A review. Earth Sci. Rev. 2014, 133, 1–17. [Google Scholar] [CrossRef]
  59. Bamler, R.; Hartl, P. Synthetic aperture radar interferometry. Inverse Probl. 1998, 14, R1–R54. [Google Scholar] [CrossRef]
  60. Hu, J.; Ding, X.-L.; Zhang, L.; Sun, Q.; Li, Z.W.; Zhu, J.-J.; Lu, Z. Estimation of 3-D surface displacement based on InSARand deformation modeling. IEEE Trans. Geosci. Remote Sens. 2017, 55, 2007–2016. [Google Scholar] [CrossRef]
  61. Costantini, M. A novel phase unwrapping method based on network programming. IEEE Trans. Geosci. Remote Sens. 1998, 36, 813–821. [Google Scholar] [CrossRef]
  62. Casu, F.; Manzo, M.; Lanari, R. A quantitative assessment of the SBAS algorithm performance for surface deformation retrieval from DInSAR data. Remote Sens. Environ. 2006, 102, 195–210. [Google Scholar] [CrossRef]
  63. Vaidyanathan, P.; Nguyen, T. Eigenfilters: A new approach to least-squares FIR filter design and applications including Nyquist filters. IEEE Trans. Circuits Syst. 1987, 34, 11–23. [Google Scholar] [CrossRef] [Green Version]
  64. Chen, C.W.; Zebker, H.A. Network approaches to two-dimensional phase unwrapping: Intractability and two new algorithms. J. Opt. Soc. Am. Opt. Image Sci. Vis. 2000, 17, 401–414. [Google Scholar] [CrossRef]
  65. McNally, G.H.; Willey, P.L.; Creech, M. Geological Factors Influencing Longwall-Induced Subsidence. In Geology and Longwall Mining; McNally, G.H., Ward, C.R., Eds.; Coalfield Geology Council of New South Wales & Conference Publications: Maitland, NSW, Australia, 1996; pp. 257–268. [Google Scholar]
  66. Bell, F.G.; Stacey, T.R.; Genske, D.D. Mining subsidence and its effect on the environment: Some differing examples. Environ. Geol. 2000, 40, 135–152. [Google Scholar] [CrossRef]
Figure 1. Surface movement curve of the main section of near-horizontal seam mining: (1) the curves of the subsidence and (2) the curves of the horizontal displacement.
Remotesensing 13 02143 g001
Figure 2. Vector map of subsidence and horizontal displacement of surface movement in the symmetrical basin area. The blue line is the settlement isoline and the red frame is the location of mined-out areas. The arrow is the horizontal displacement vector.
Remotesensing 13 02143 g002
Figure 3. Geometric relationships between the LOS displacement and the 3-D displacements of ground points.
Remotesensing 13 02143 g003
Figure 4. The horizontal movement of the surface during mining.
Remotesensing 13 02143 g004
Figure 5. Flow diagram of the search for the center of the moving basin.
Remotesensing 13 02143 g005
Figure 6. (a) Geographic location of the Yulin mining area and the coverage of the SAR acquisitions superposed on the TanDEM. (b) Advancing locations of the working panels from 7 November 2018 to 3 December 2019 on the optical image. The white solid rectangles denote the mined working panels. The yellow point is the monitoring point on dip observation line AA’, and the interval between each point is 20 m.
Remotesensing 13 02143 g006
Figure 7. Temporal and perpendicular baseline distributions of the remaining small-baseline InSAR pairs.
Remotesensing 13 02143 g007
Figure 8. SGI-SF-derived time series of vertical subsidence with reference to 26 November 2018. (ah) are the vertical subsidence results between 26 November 2018, 20 December 2018, 13 January 2019, 25 January 2019, 18 February 2019, 02 March 2019, 14 March 2019, 26 March 2019, 07 April 2019 with 26 November 2018 respectively.
Remotesensing 13 02143 g008
Figure 9. SGI-SF-derived time series of the horizontal displacements in the strike direction with reference to 26 November 2018. Positive and negative values denote the points moving toward the mining and reverse-mining directions, respectively. (ah) are the horizontal displacements in the strike direction between 26 November 2018, 20 December 2018, 13 January 2019, 25 January 2019, 18 February 2019, 02 March 2019, 14 March 2019, 26 March 2019, 07 April 2019 with 26 November 2018 respectively.
Remotesensing 13 02143 g009
Figure 10. SGI-SF-derived time series of the horizontal displacements in the dip direction with reference to 26 November 2018. Positive and negative values denote the points moving toward the upward (vertical to the mining direction) and downward (vertical to the mining direction) directions, respectively. (ah) are the horizontal displacements in the dip direction between 26 November 2018, 20 December 2018, 13 January 2019, 25 January 2019, 18 February 2019, 02 March 2019, 14 March 2019, 26 March 2019, 07 April 2019 with 26 November 2018 respectively.
Remotesensing 13 02143 g010
Figure 11. Comparison between the in-situ GPS measurements (orange line) and the displacements estimated by the proposed method (blue line) over the field observation points (i.e., profile AA’ in Figure 6) in the vertical (a) and horizontal (b) directions. The gray line is the difference between the GPS and InSAR measurements at the monitoring points.
Remotesensing 13 02143 g011
Publisher’s Note: MDPI stays neutral with regard to jurisdictional claims in published maps and institutional affiliations.

