Article

Impact of Atmospheric Optical Properties on Net Ecosystem Productivity of Peatland in Poland

by
Kamila M. Harenda
1,*,
Mateusz Samson
1,
Radosław Juszczak
1,
Krzysztof M. Markowicz
2,
Iwona S. Stachlewska
2,
Małgorzata Kleniewska
3,
Alasdair MacArthur
4,
Dirk Schüttemeyer
5 and
Bogdan H. Chojnicki
1
1
Laboratory of Bioclimatology, Department of Ecology and Environmental Protection, Faculty of Environmental and Mechanical Engineering, Poznan University of Life Sciences, 60-637 Poznan, Poland
2
Faculty of Physics, Institute of Geophysics, University of Warsaw, 02-093 Warsaw, Poland
3
Department of Remote Sensing and Environmental Assessment, Institute of Environmental Engineering, Warsaw University of Life Sciences—SGGW, 02-787 Warsaw, Poland
4
Grant Institute, School of Geosciences, University of Edinburgh, Edinburgh EH9 3JW, UK
5
European Space Agency (ESA), 2201 AZ Noordwijk, The Netherlands
*
Author to whom correspondence should be addressed.
Remote Sens. 2021, 13(11), 2124; https://doi.org/10.3390/rs13112124
Submission received: 30 March 2021 / Revised: 11 May 2021 / Accepted: 26 May 2021 / Published: 28 May 2021
(This article belongs to the Special Issue Application of Remote Sensing for Monitoring of Peatlands)

Abstract

:
Peatlands play an important role in the global carbon cycle due to the high carbon storage in the substrate. Ecosystem production depends, for example, on the solar energy amount that reaches the vegetation, however the diffuse component of this flux can substantially increase ecosystem net productivity. This phenomenon is observed in different ecosystems, but the study of the atmosphere optical properties on peatland production is lacking. In this paper, the presented methodology allowed us to disentangle the diffuse radiation impact on the net ecosystem production (NEP) of Rzecin peatland, Poland. It allowed us to assess the impact of the atmospheric scattering process determined by the aerosol presence in the air mass. An application of atmospheric radiation transfer (ART) and ecosystem production (EP) models showed that the increase of aerosol optical thickness from 0.09 to 0.17 caused NEP to rise by 3.4–5.7%. An increase of the diffusion index (DI) by 0.1 resulted in an NEP increase of 6.1–42.3%, while a DI decrease of 0.1 determined an NEP reduction of −49.0 to −10.5%. These results show that low peatland vegetation responds to changes in light scattering. This phenomenon should be taken into account when calculating the global CO2 uptake estimation of such ecosystems.

Graphical Abstract

1. Introduction

The interaction between terrestrial ecosystems and the Earth’s atmosphere is one of the most critical ecological issues, since the properties of the atmosphere determine each ecosystem’s sustainability, development, or extinction [1]. The water and carbon dioxide balances of the biosphere are determined by both biotic and abiotic factors, and their global cycles are efficiently controlled by the solar energy that flows throughout the Earth’s system. Thus, physical parameters of the atmosphere such as temperature and transmissivity determine the global carbon cycle. Changes in the physical properties of the atmosphere determine the fate of the ecosystems, and their carbon balance are important issues in the context of the greenhouse effect phenomenon. Earth surface-atmosphere CO2 exchange is strongly related to photosynthesis and respiration rates. Both processes depend directly and indirectly on the total (SWin) solar radiation (the sum of direct (SWdir) and diffuse (SWdif) radiation) [2]. Thus, research into the optical parameters of the atmosphere is a basis for the assessment of one of the most fundamental controls of CO2 exchange.
In the short time scale, the ecosystem’s C balance consists of the net ecosystem production (NEP) which is the result of two key processes: gross primary production (GPP) and ecosystem respiration (ER) (Equation (1)) [3]:
NEP = GPP − ER,
where GPP represents the vegetation’s CO2 uptake through photosynthesis, while ER is the release of CO2 into the atmosphere through autotrophic and heterotrophic respiration processes.
Since peatlands play one of the most important roles in the global carbon cycle, as an ecosystem with significant potential for a highly positive impact on the climate system (net cooling effect over centuries) [4,5,6], the study of the CO2 exchange between these ecosystems and the atmosphere is crucial for the prediction of the functioning of this huge natural soil carbon stock under global warming that appears in all climate zones [7,8,9,10]. This C storage has been formed through the photosynthetic fixation of carbon dioxide by vegetation, which in the long term has been larger than the release of C through plant respiration and peat decomposition [11]. Thus, the transformation of peatlands into carbon sources as the result of global warming is currently one of the biggest threats that may contribute substantially to the instability of the Earth-atmosphere thermodynamic system. Simultaneously, these ecosystems may prevent the loss of stability caused by crossing the planetary threshold. In other words, they have the potential to stop the independent process of increasing the greenhouse gas concentration and significantly slowing down or even reversing these couplings [12].
The canopy net photosynthesis is found to be dependent not only on the quantity but also on the degree of scattering of solar radiation, which has been confirmed by numerous simulations [13,14,15]. The increased production under more diffuse radiation is explained inter alia, as diffuse radiation more effectively penetrates the plant canopy [16,17,18]. This improves the photosynthetic activity of the lower located leaves in the canopy [2]. Long-term observations show that in the last several decades, both positive (dimming - until mid-1990s) and negative (brightening) trends of diffuse irradiance have been observed on the Earth’s surface [19,20,21,22]. The trends of total solar radiation have been found as well [21], and their significance and direction are often related to local circumstances, e.g., urbanization [23,24,25]. Light scattering processes in the atmosphere are mainly determined by the presence of suspended components in the air, e.g., gases and different sized particles in the solid and liquid phases [26]. The presence of atmospheric aerosols, both at their height of occurrence in the air column [27] and the aerosol type [28,29], can affect the climate system due to their impact on the heat and water balances at both local and global scales [30]. Since aerosols also play an important role in the scattering process of the atmosphere [31,32], atmospheric radiative transfer (ART) models have been developed (e.g., [33]) in order to effectively simulate the radiation processes in the atmosphere [34]. The calculation of the solar irradiance with this model is realized on the basis of the parameters that integrate the effect of the presence of the aerosol on air properties. The aerosol optical thickness (AOT) is defined as the parameter that represents the airborne aerosol loading in the atmospheric column [35]. This measure can be effectively used for the assessment of the radiation transfer processes in the atmosphere [36]. AOT values measured on the ground are usually realized with sun photometers, which are often deployed within networks that provide technical support in terms of calibration and data processing, e.g., aerosol robotic networks (AERONET) [37].
The impact of diffuse solar radiation on ecosystem production was initially analyzed for agricultural areas, e.g., soybean, maize, peanut, and sugar beet crops [38,39,40,41]. Later studies were extended to other types of ecosystems, mainly deciduous and coniferous forests, tundra, grassland, and the Canadian peatlands [14,16,42,43,44,45,46,47,48,49,50], but there is still a lack of such analyses for central European peatlands. The scattering process that determines the diffuse radiation amount is the result of the presence of both clouds and aerosols in the atmosphere. However, in a recently published study of diffuse radiation impact on peatland productivity, the separate effects of cloud and aerosol presence in the air column were not presented. In the case of the Canadian peatland studies, the analyses were focused on the impact of cloudiness on ecosystem production using a clearness index [50] or light use efficiency models [15,51], while New Zealand bog studies were based on different light response functions [52]. Thus, the main goal of the study was a quantitative estimation of the impact of optical parameter changes, determined by the aerosol presence in the atmosphere, on peatland net CO2 uptake in cloudless conditions.

2. Materials and Methods

2.1. Site Description

Data presented in this paper were obtained at Rzecin peatland, located in the north-western part of the Greater Poland Region, Poland, in Rzecin village (52°45′N; 16°18′E; 54 m a.s.l) (Figure 1) [53]. The peatland is located around 70 km northwest of Poznań city in the Notecka Primeval Forest complex. This peatland is classified as fen and the vegetation is comprised of typical peatland species, e.g., roundleaf sundew (Drosera rotundifolia), bog cranberry (Oxycoccus palustris), and bog sedge (Carex limosa). There are also various mosses found at this site with rigid bog moss (Sphagnum teres) (Schimp.) being the dominant species [54]. Tall vascular plants, e.g., common reed (Phragmites australis), broadleaf cattail (Typha latifolia), and sedges (Carex spp.) with LAI >4.8 m2·m−2 dominate at the edge of the peatland, while bog mosses (Sphagnum spp.), fine bogmoss (Sphagnum angustifolium), flat topped bog moss (S. fallax), rigid bog moss (S. teres), and short, vascular plants like bog cranberry (Oxycoccus palustris), bog sedge (Carex limosa), bottle sedge (C. rostrate), wollyfruit sedge (C. lasiocarpa), common cottongrass (Eriophorum angustifolium), and roundleaf sundew (Drosera rotundifolia), with LAI < 1.0 m2·m−2 dominate in the middle of the ecosystem [55,56]. At the eastern part of this ecosystem, there is a shallow lake (remnants of a larger body of water) that has been partly covered within the peat formation process [57]. The floating carpet of poorly degraded peat (approximately 70 cm thick) is a particular feature of the Rzecin peatland. This is an effect of the moss layer growing process that has been ongoing on the lake surface over the last 200 years [58]. There are cultivated fields, pastures, and pine forests located around the peatland, and their impact on the ecosystem has been noticeable over the last 200 years [59]. The site substrate water pH is 4.9, and conductivity is 52.8 S·cm−1 [60]. A Nature 2000 site was established at the site in 2006 due to both plant and bird species richness.
The site is characterized by a moderately warm climate, where the annual mean air temperature is 8.5 °C, the annual mean precipitation is 526 mm, and there is a prevailing western wind [61].

2.2. Meteorological Conditions

Between 13 June and 18 September, the average 30-minute air temperature was 17.6 °C (minimum 2.0 °C, maximum 35.3 °C), while the vapor pressure deficit ranged from 0 to 36 hPa, and the average relative humidity over this time was 79%—with minimum and maximum values of 32% and 100%, respectively. The DI values varied between 0.12 and 1.0 over the studied period. The mean value of AOT500 collected with CIMEL sun photometer was equal to 0.15234, while the minimum and maximum values were 0.03535 and 0.56571, respectively. The sum of total solar radiation and precipitation for this period were 1745 MJ·m−2 and 286.6 mm, respectively.

2.3. Measurement Equipment

2.3.1. Eddy Covariance

The eddy covariance technique (EC) is a widely used method of CO2 exchange estimation [2,62] on the scale of the entire ecosystem (100–2000 meters) [63,64] without vegetation and soil disturbances [62,65]. This method is based on the simultaneous measurement of instantaneous values (fluctuations) of mass, e.g., CO2 concentration and vertical wind speed component. Such a measurement strategy allows the direct observation of vertical mass exchange between the atmosphere and ecosystem surface [66]. EC technique is currently the state-of-the-art measuring method that provides the most reliable estimation of gas fluxes under field conditions [62].
The measurements of CO2 exchange at the Rzecin site were carried out with the eddy covariance system installed on a 4.5 m tall tower that was located in the middle of the peatland [53]. The EC system consists of a sonic anemometer R3-100 (Gill Ltd., UK) and an enclosed CO2/H2O gas analyzer LI-7200 (LI-COR, USA), which measures the fluctuations of the vertical wind speed component and CO2/H2O concentration, respectively, at 20 Hz frequency.
The 30-minute values of the CO2 fluxes were calculated with EddyPro [67]. Initially, the quality of the raw time series statistical tests recommended by [68] were applied (amplitude resolution, dropout, absolute limit, skewness, and kurtosis), as well as the spike count/removal according to [69]. Then, the following procedures were applied: compensation of the fluctuation of air density [70], correction for spectral losses [71], flagging according to Carbo Europe standard [72], and footprint calculations [73]. The footprint analysis showed that the origin of the measured fluxes was located within a 200 m radius around the tower.

2.3.2. Sun Radiometer

The aerosol optical thickness (AOT) was measured by the multiband automatic sun/sky radiometer CE318 (CIMEL Electronique, Paris, France) that has been operating at the study site since May 2016. This solar-powered and weather-resistant robotic device has 9 spectral bands [37,74] and it is installed at a dedicated tripod tower (52°45′43.2″N; 16°18′34.4″E) (Figure 1) at a height of 4 m above the surface a short distance from EC tower. The data obtained with the CE318 is automatically processed and transmitted to the AERONET website [75]. This ground-based global monitoring system coordinated by NASA consists of around 900 measurement stations around the world [74,75,76]. The strength of this network relies on provision and standardization of the measurement protocol, data processing, and calibration, allowing for multiyear and large-scale comparisons [37].

2.3.3. Meteorological Measurements

The measurements of the air temperature (Ta) and relative humidity were carried out using a HC2A-S humidity probe installed at a standard height of 2 m above the surface (RotronicMessgeräte GmbH, Ettlingen, Germany). The values of both total (It) and diffuse (If) photosynthetic photon flux density (PPFD) were obtained with the sunshine sensor BF5 (Delta-T Devices, Burwell, UK) [77]. It was installed at a height of 3.0 m, and was placed on the same scaffold as the EC system. The height of BF5 installation prevented the obstacles e.g., tall plants in the sunshine sensor field of view. The diffusion index (DI) was calculated on the basis of these values as the ratio of If and It [47]. The solar radiation was measured also with a pair of upward and downward facing CM3 pyranometers (Kipp&Zonen, Delft, the Netherlands) that were used for total (SWin) and reflected (SWref) shortwave radiation flux densities, respectively. An additional pair of Quantum sensors (SKP215, Skye Instruments Ltd., Powys, UK) was applied for the measurements of both total (It) and reflected (Iref) photosynthetic photon flux density. Both pairs of sensors were installed on a steel arm at a height of 2.35 m above the Menyantho trifoliatae-Sphagnetum teretis Warén 1926 vegetation community [78], next to EC tower. This set of sensors provided the data that was used for the Broad–band Normalized Difference Vegetation Index (NDVIb) calculation according to the following formula (Equations (2)–(4)) [79]:
NDVIb = ρ RS ρ I ρ RS + ρ I
where:
ρ RS = RSref I ref RSin I t
and:
ρ I = I ref I t
where: It is total PPFD [W⋅m−2], Iref is reflected PPFD [W⋅m−2], RSin is total shortwave radiation flux density [W⋅m−2], and RSref is reflected shortwave radiation flux density [W⋅m−2].
The values of NDVIb correlate well with satellite normalized difference vegetation index (NDVI) data, but it does not suffer from discontinuity problems that stem from the remotely obtained observations [80]. Thus, the NDVIb was used here as a proxy for vegetation CO2 uptake capacity since the relation between NDVIb and gross ecosystem production (GEP) was found to be noticeable on the studied site [81]. Within this study, the gross ecosystem production (GEP) is approximated as GPP, and small discrepancies between GPP and GEP were ignored here.

2.4. Ecosystem Productivity (EP) and Atmospheric Radiative Transfer (ART) Modeling

There are several ecosystem production models developed for peatlands [82,83,84,85]. They are effective tools for CO2 uptake estimation, but the solar radiation scattering process is not taken into account as a factor in these algorithms. There were several models developed for higher vegetation (usually trees) where the spatial structure is taken as a factor that impacts the solar radiation interception in the plant canopy [86,87]. Due to the limited information about the peatland canopy structure, the simplified diffuse radiation ecosystem production (EP) model was applied within this study, where NEP was estimated on the basis of the separate impact of direct (Ir) and diffuse (If) solar radiation [87] (Equation (5)). This model consisted of two ecosystem CO2 balance components: GEP, where the rectangular hyperbola equation’s parameters α (initial quantum yield) and β (empirical coefficient) are estimated separately for Ir and If, while ER is estimated on the basis of air temperature (Ta):
NEP = 1 c 1 exp c 2 T a α f I f + α r I r β f I f + β r I r β f I f + β r I r + α f I f + α r I r I
where NEP is net ecosystem production flux [µmol⋅m−2⋅s−1], Ta is air temperature at 2 m height [°C], If is diffuse PPFD [µmol⋅m−2⋅s−1], Ir is direct PPFD [µmol⋅m−2⋅s−1], It is total PPFD [µmol⋅m−2⋅s−1], and c1, c2, αf, αr, βf, and βr are empirical parameters.
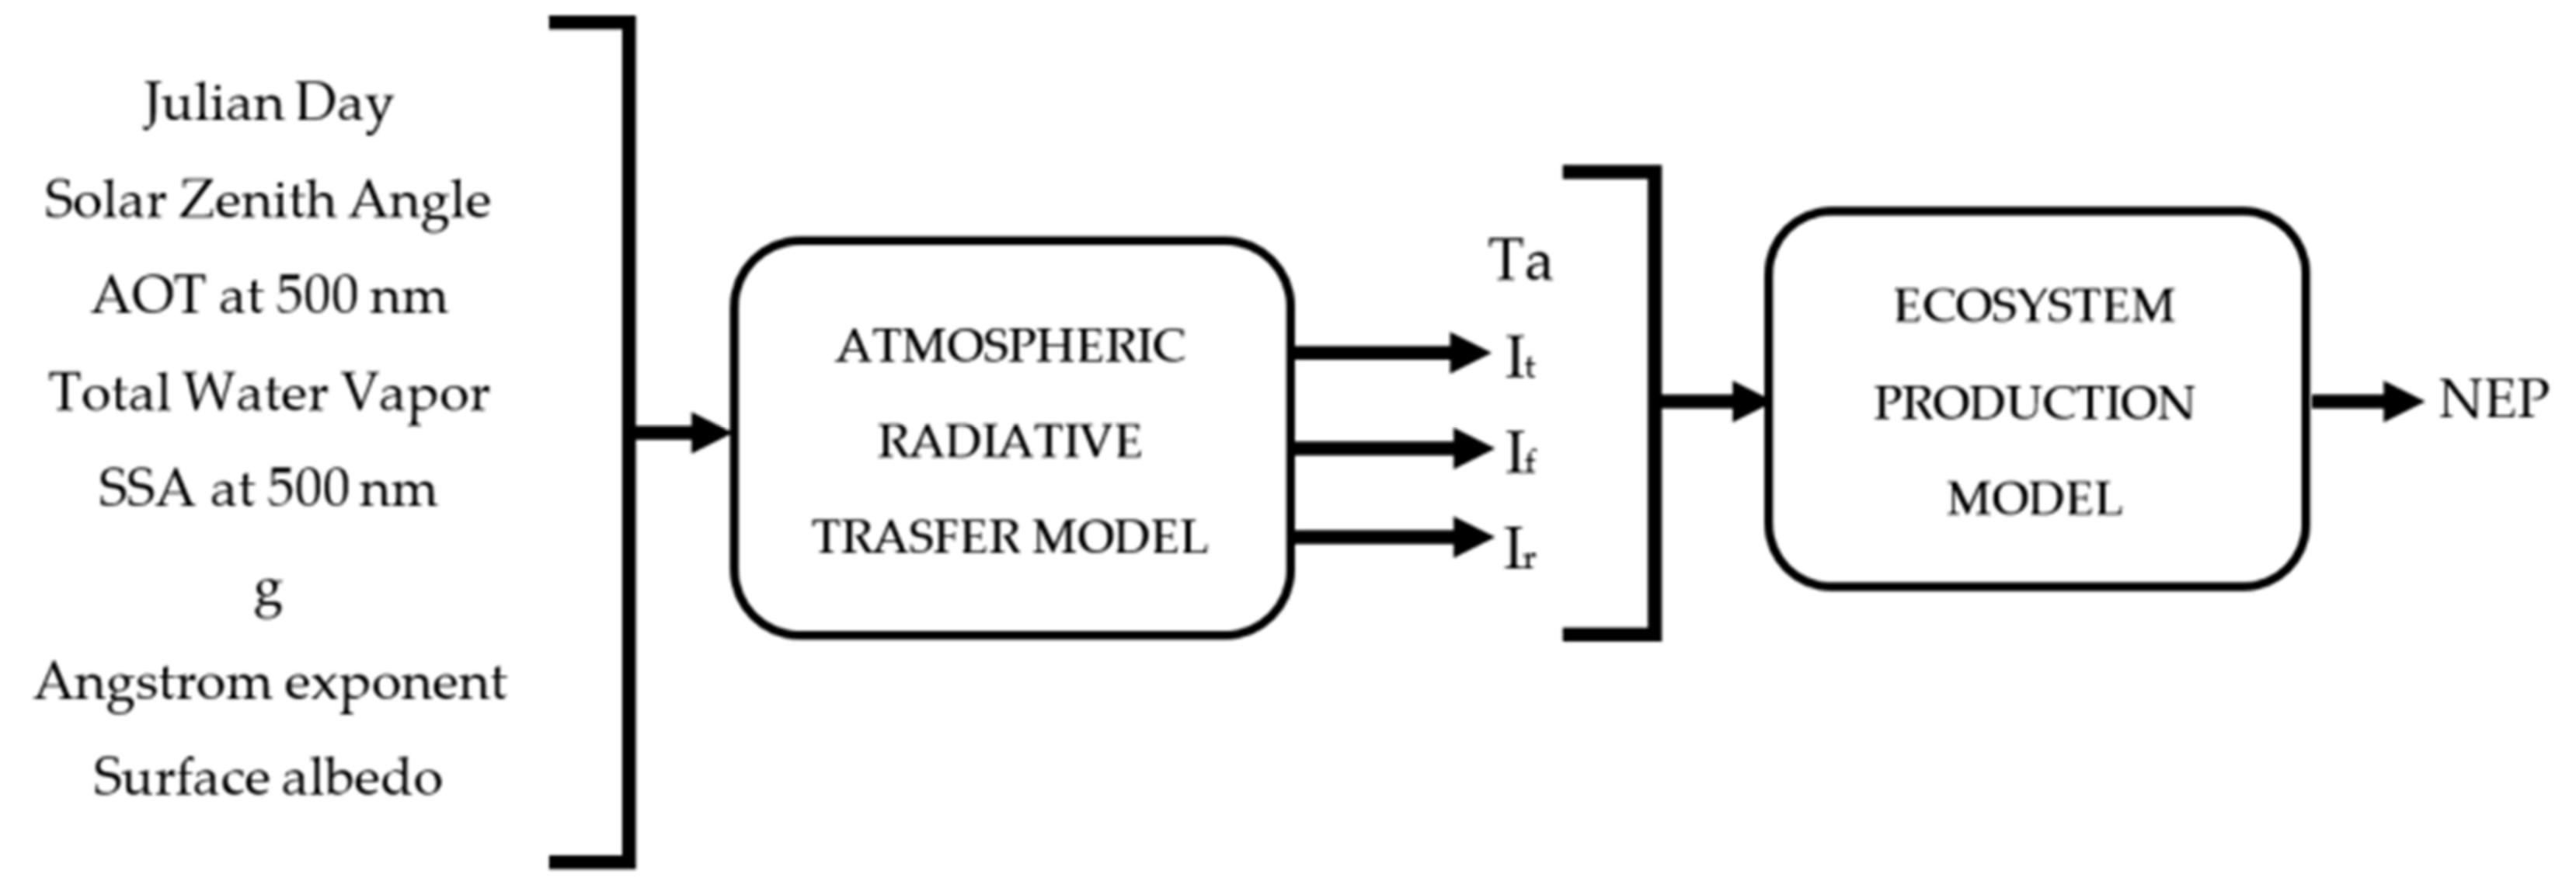
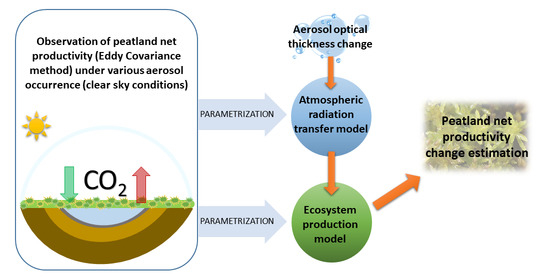
The ecosystem respiration flux density (the exponential part of the formula) is assumed to be Ta dependent. A simple atmospheric radiative transfer (ART) model described by [33] has been applied to simulate solar irradiation (Figure 2). This model is mostly used for renewable energy applications [88], for ecosystem productivity simulations [89], and for cloud screening data of solar irradiation [90]. Some empirical formulas described by Justus and Paris, [33] are used to define other ATM models [91,92]. Although the Justus and Paris ART model is very simple and it shows relatively good agreement with clear-sky observations (root mean square error of 3.5%). In this study, we used the second class pyranometer (CM3) with an accuracy of ±10% for daily sum flux, therefore the use of the simple ART model is justified.
This ART model calculates clear-sky spectral direct and diffuse irradiance, spectral absorption within the atmosphere, and the upward reflected spectral irradiance at the top of the atmosphere. The irradiance model, based on similar approaches by [93], evaluates the spectral irradiance between 0.29 and 4.0 μm, with a resolution that varies from 0.005 to 0.1 μm. This empirical ART includes absorption by two uniformly mixed trace gases (water vapor and ozone) as well as both the scattering and absorption by aerosol and the scattering by molecular particles. Both molecular and aerosol optical properties are modeled with a simple wavelength-dependent optical thickness described by the Angstrom exponent, single scattering albedo, and asymmetry parameter. In the case of ozone and water vapor, the total columnar values are assumed. The broadband surface albedo is used to estimate the multi-scattering effect of incoming and outgoing solar radiation. There are the following input parameters used for testing and parameterizing this model: Julian day, solar zenith angle, aerosol optical thickness at 500 nm, total water vapor [g⋅cm−3], single scatter albedo at 500 nm (SSA500 = 0.95), asymmetry parameter (g = 0.65), Angstrom exponent, and surface albedo. The values of AOT500 were applied during all calculations because this wavelength is in the range of radiation used for the photosynthesis process.
The compilation of ART and EP models was performed in order to develop the model where NEP is determined by the AOT values. In this case, the output values of direct and diffuse irradiance from the ART model are used as input data for the EP model (Figure 2).

2.5. Data Selection

2.5.1. Broad–band Normalized Difference Vegetation Index

The first step of data selection consisted of the extraction of the period when the plant’s photosynthetic efficiency was stationary in order to avoid the canopy stage of development impact on CO2 exchange parametrization. Thus, the NDVIb’s weekly populations collected during 2016 were analyzed with a post hoc Tukey’s test to identify the periods of similar NDVIb values.

2.5.2. Vapor Pressure Deficit (VPD)

Due to the fact that the daytime leaf stomata activity is vapor pressure deficit dependent [94], its impact on NEP was analyzed within the second step of data selection. It was found that if VPD value exceeds a certain threshold, it determines the stomata closing and the gas exchange between the plant and ambient air is substantially reduced or stopped [95,96].

2.5.3. Clear Sky Conditions

In order to estimate the separate aerosol effect on the peatland productivity, the clear sky conditions were needed to be extracted from the previously selected data set. Since the AOT values collected by the sun photometer are processed using the quality assessment and quality check (QAQC) algorithm by AERONET, the final AOT database contains three levels of quality data: 1.0, 1.5, and 2.0. All unprocessed data obtained by the radiometer are stored on level 1.0, while level 1.5 is selected by the cloud-screening and quality control algorithm application [37,75]. The data from level 2.0 is the result of corrections that are based on AERONET calibration procedures and reflect cloudless conditions. The periods when AOT data from level 2.0 were available were used as the last criteria of the data selection. Finally, the selected set of NEP, AOT, and meteorological data was the basis of parametrizing EP and ART models in order to estimate the Rzecin peatland CO2 productivity change to the AOT modifications during clear sky conditions. The simulation was performed on 23 June 2016 since it was characterized by clear sky conditions, all necessary data availability, optimal plant development stage, and VPD values below 20 hPa. Additionally, it is one of the longest days of the year.

2.6. EP and ART Models Accuracy Assessment

The models were evaluated in terms of accuracy using the following parameters: mean absolute error (MAE), root mean square error (RMSE) [97], and normalized root mean square error (NRMSE). The standard error (SE) of EP model parameters was calculated according to the following formula (Equation (6)) [98]:
SE = σ N
where σ is population standard deviation and N is the number of elements in the sample.
All analyses presented in this paper were performed within R software [99].

3. Results

3.1. Seasonal Patterns of NDVIb

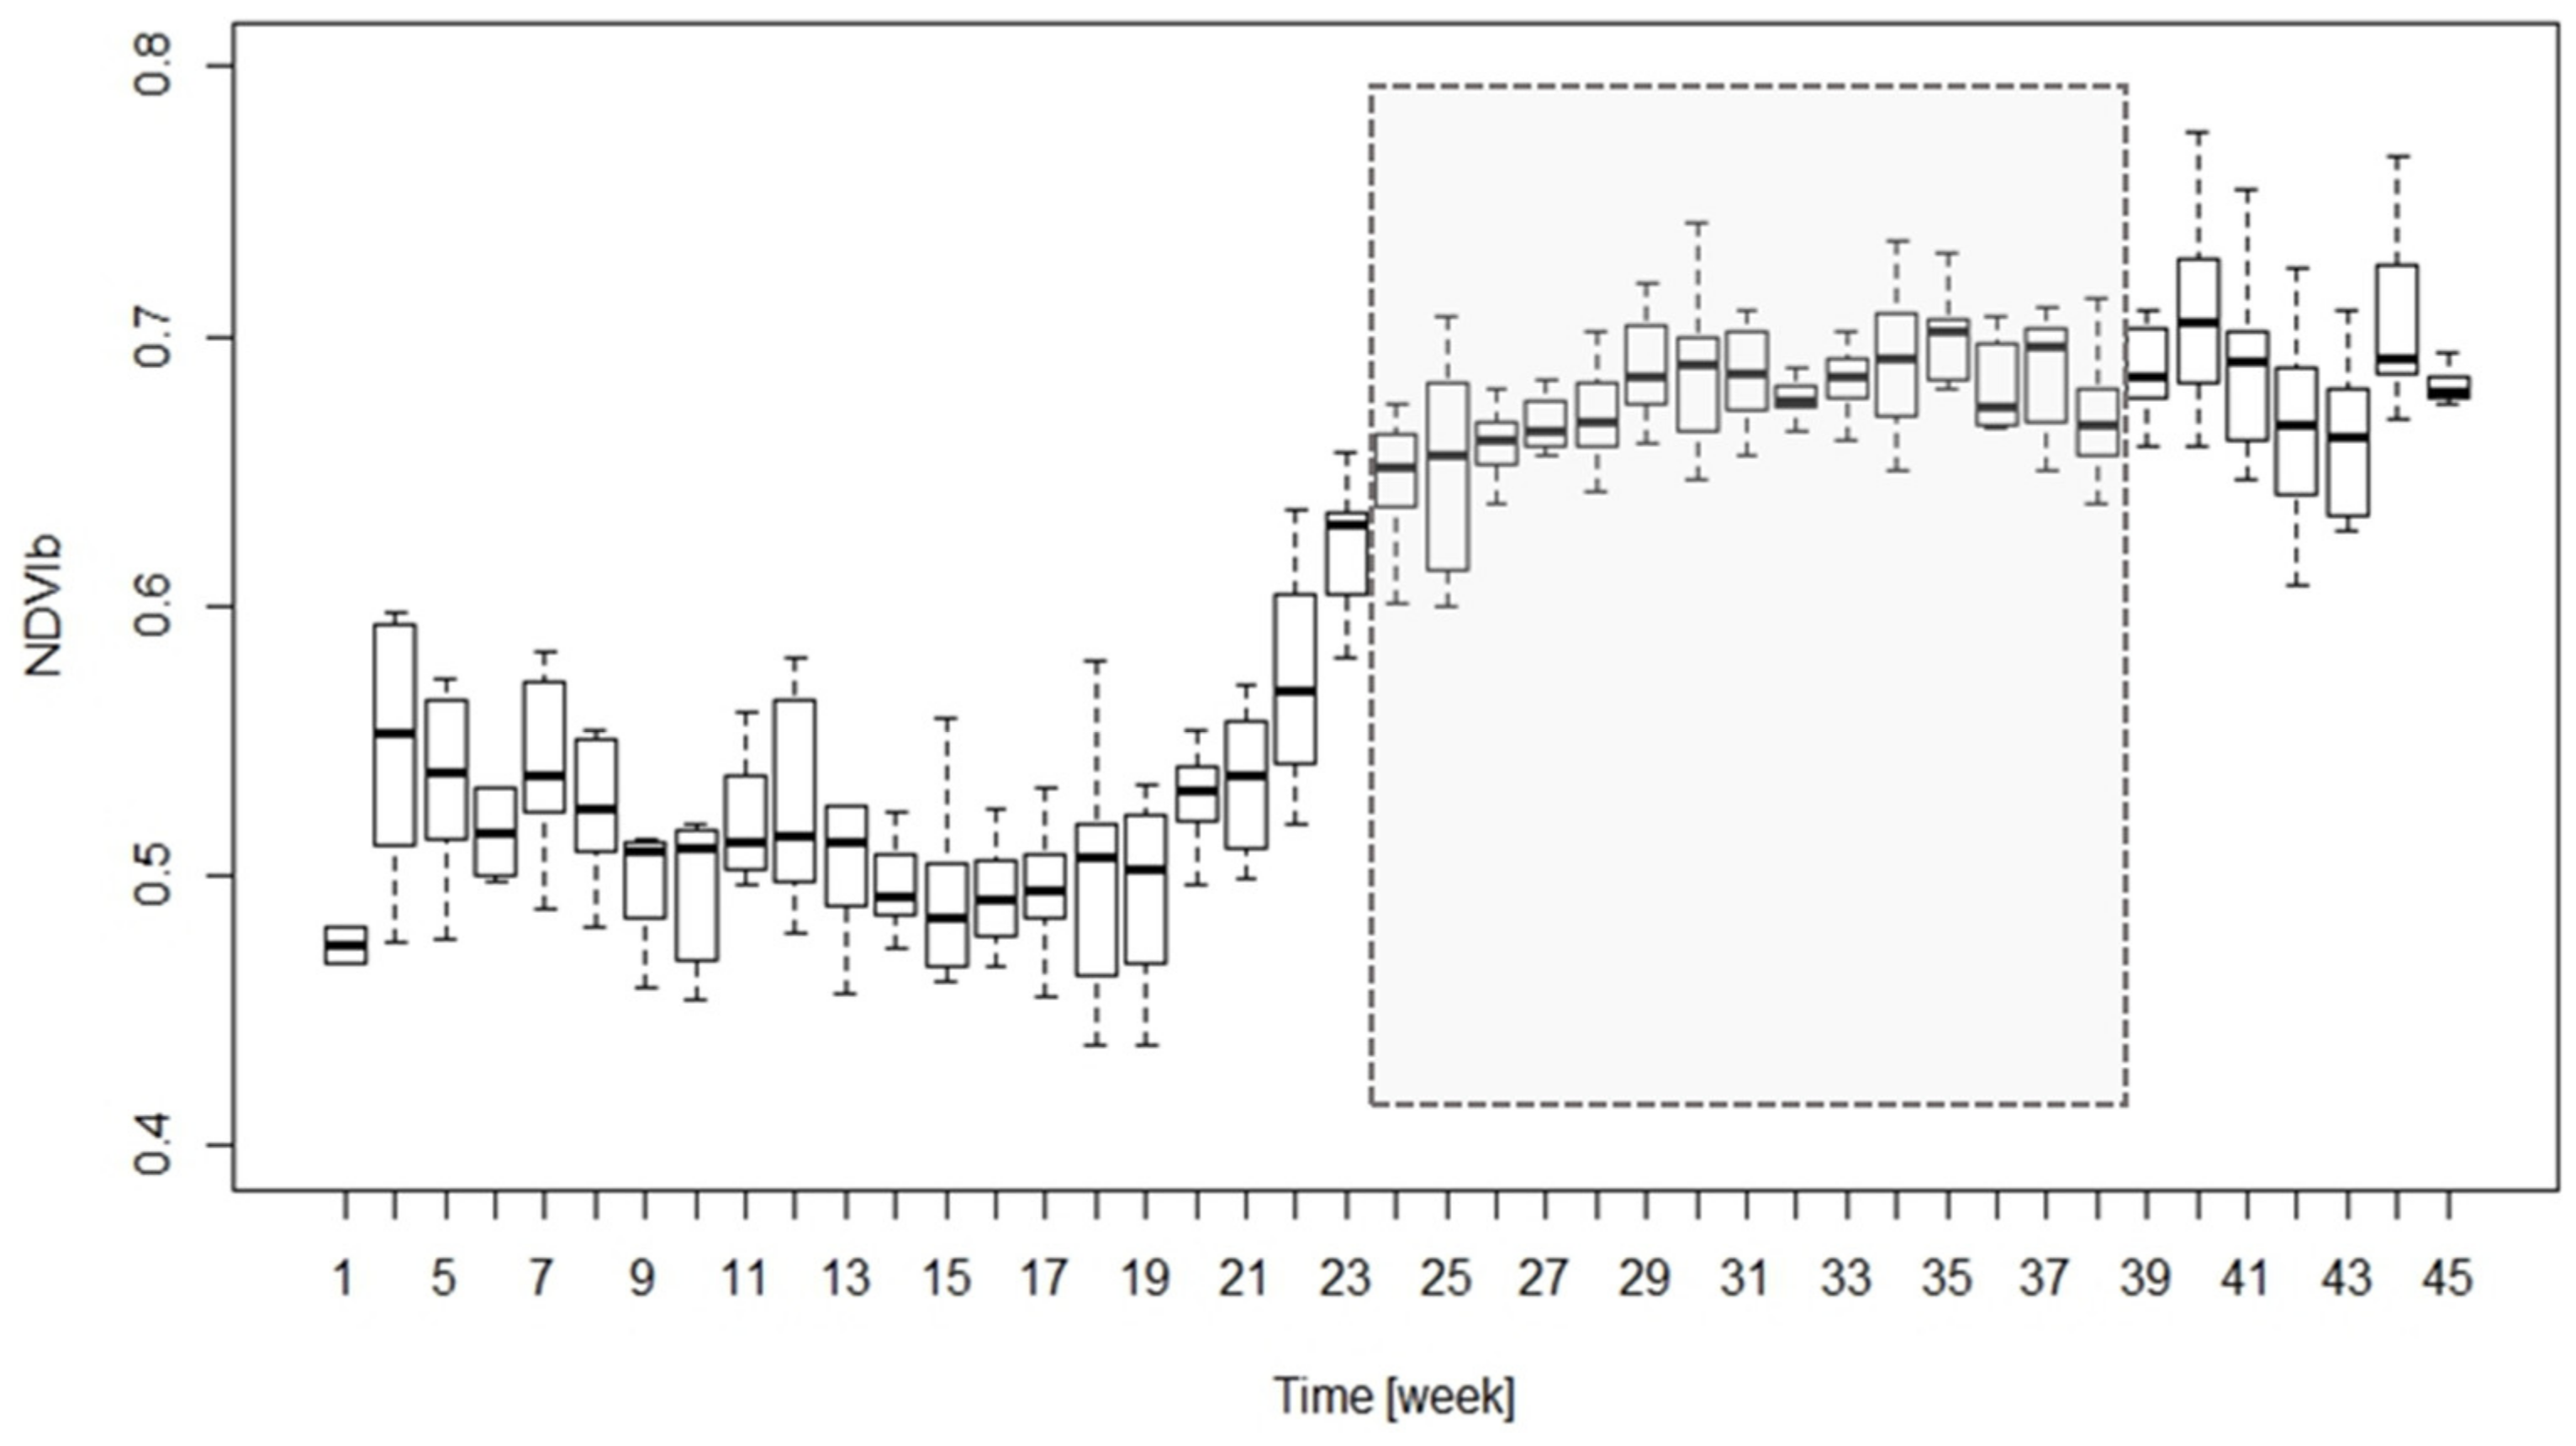
The NDVIb populations were found to be homogeneous within the period from week 24 to week 39 of 2016 (Figure 3). The test indicated no statistical difference (significance level p = 0.05) between the NDVIb population of week 24 and the populations placed within the weeks from 25 to 39. On the basis of this analysis, the assumption that the CO2 uptake capacity of the plant canopy was constant over this period was done. Finally, only data collected during the period from 24 to 38 weeks were taken into analysis due to the lack of AOT observation during week 39, so the analyzed data covered the period from 13 June to 18 September 2016.

3.2. Diurnal Patterns of VPD

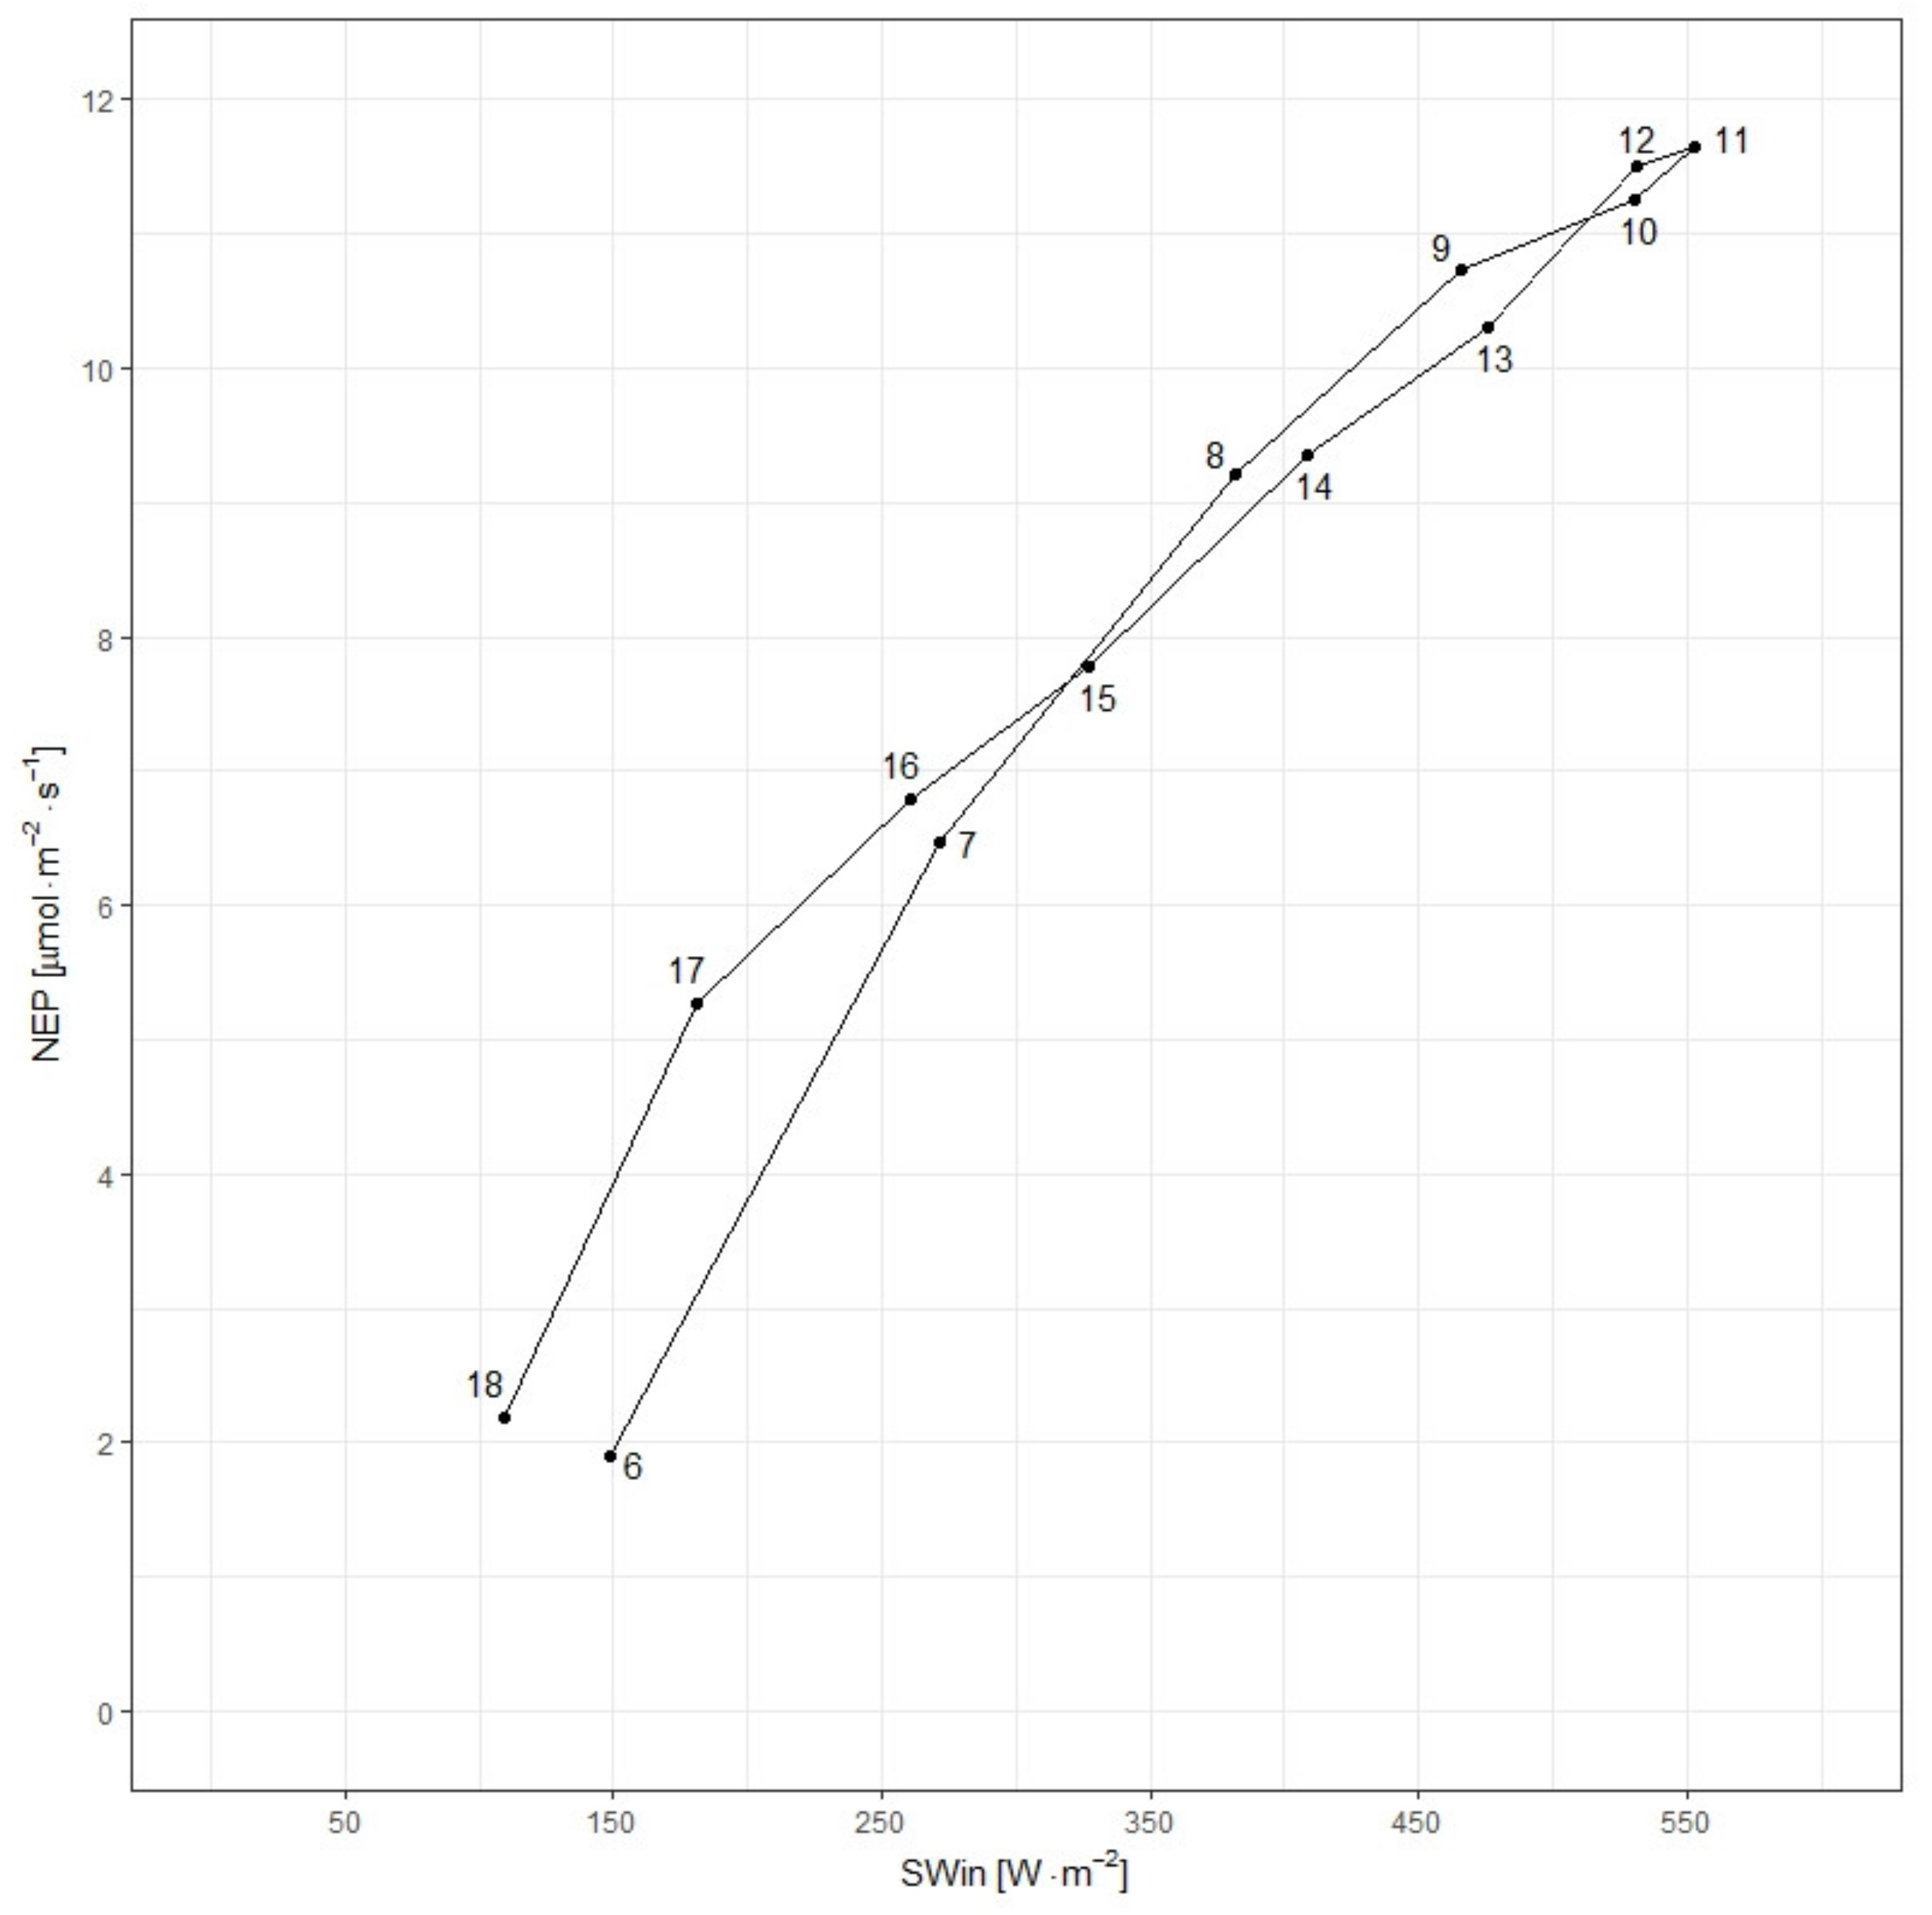
The NEP vs. SWin dependency was used during this analysis and since carbon dioxide uptake of the peatland has a regular diurnal pattern, the hours of day values (UTC + 1) were used as a proxy for solar angle [100] (Figure 4 and Figure 5). At the Rzecin site, the reduction of NEP was found between 12PM and 15PM (Figure 4) and it is associated with VPD values higher than 20 hPa. This observation corresponds with literature findings where VPD threshold values between 15 and 20 hPa were reported [96,101,102].
Thus, the data collected during the periods when VPD exceeded the threshold of 20 hPa was excluded from further analysis. The result of this selection has been presented in Figure 5d.

3.3. Diurnal Patterns of Micrometeorological Parameters

The meteorological variables of Ta, VPD, DI, and NEP were presented in the context of both local time (solar angle proxy) and SWin (Figure 5). The afternoon values of Ta and VPD are higher than those observed in the morning (Figure 5a,b). The diffusion index (DI) is also higher in the afternoon than in the morning (Figure 5c). There is a drop of DI values between the hours of 15PM and 18PM, but the values are still higher than in the analog time of the morning and it corresponds to slight Ta increase that will be determined by higher insolation during this part of the day (Figure 5a). The ecosystem was more effective in terms of carbon dioxide absorption (higher NEP) during the afternoon than in the morning hours (Figure 5d).

3.4. ART Model Parametrization

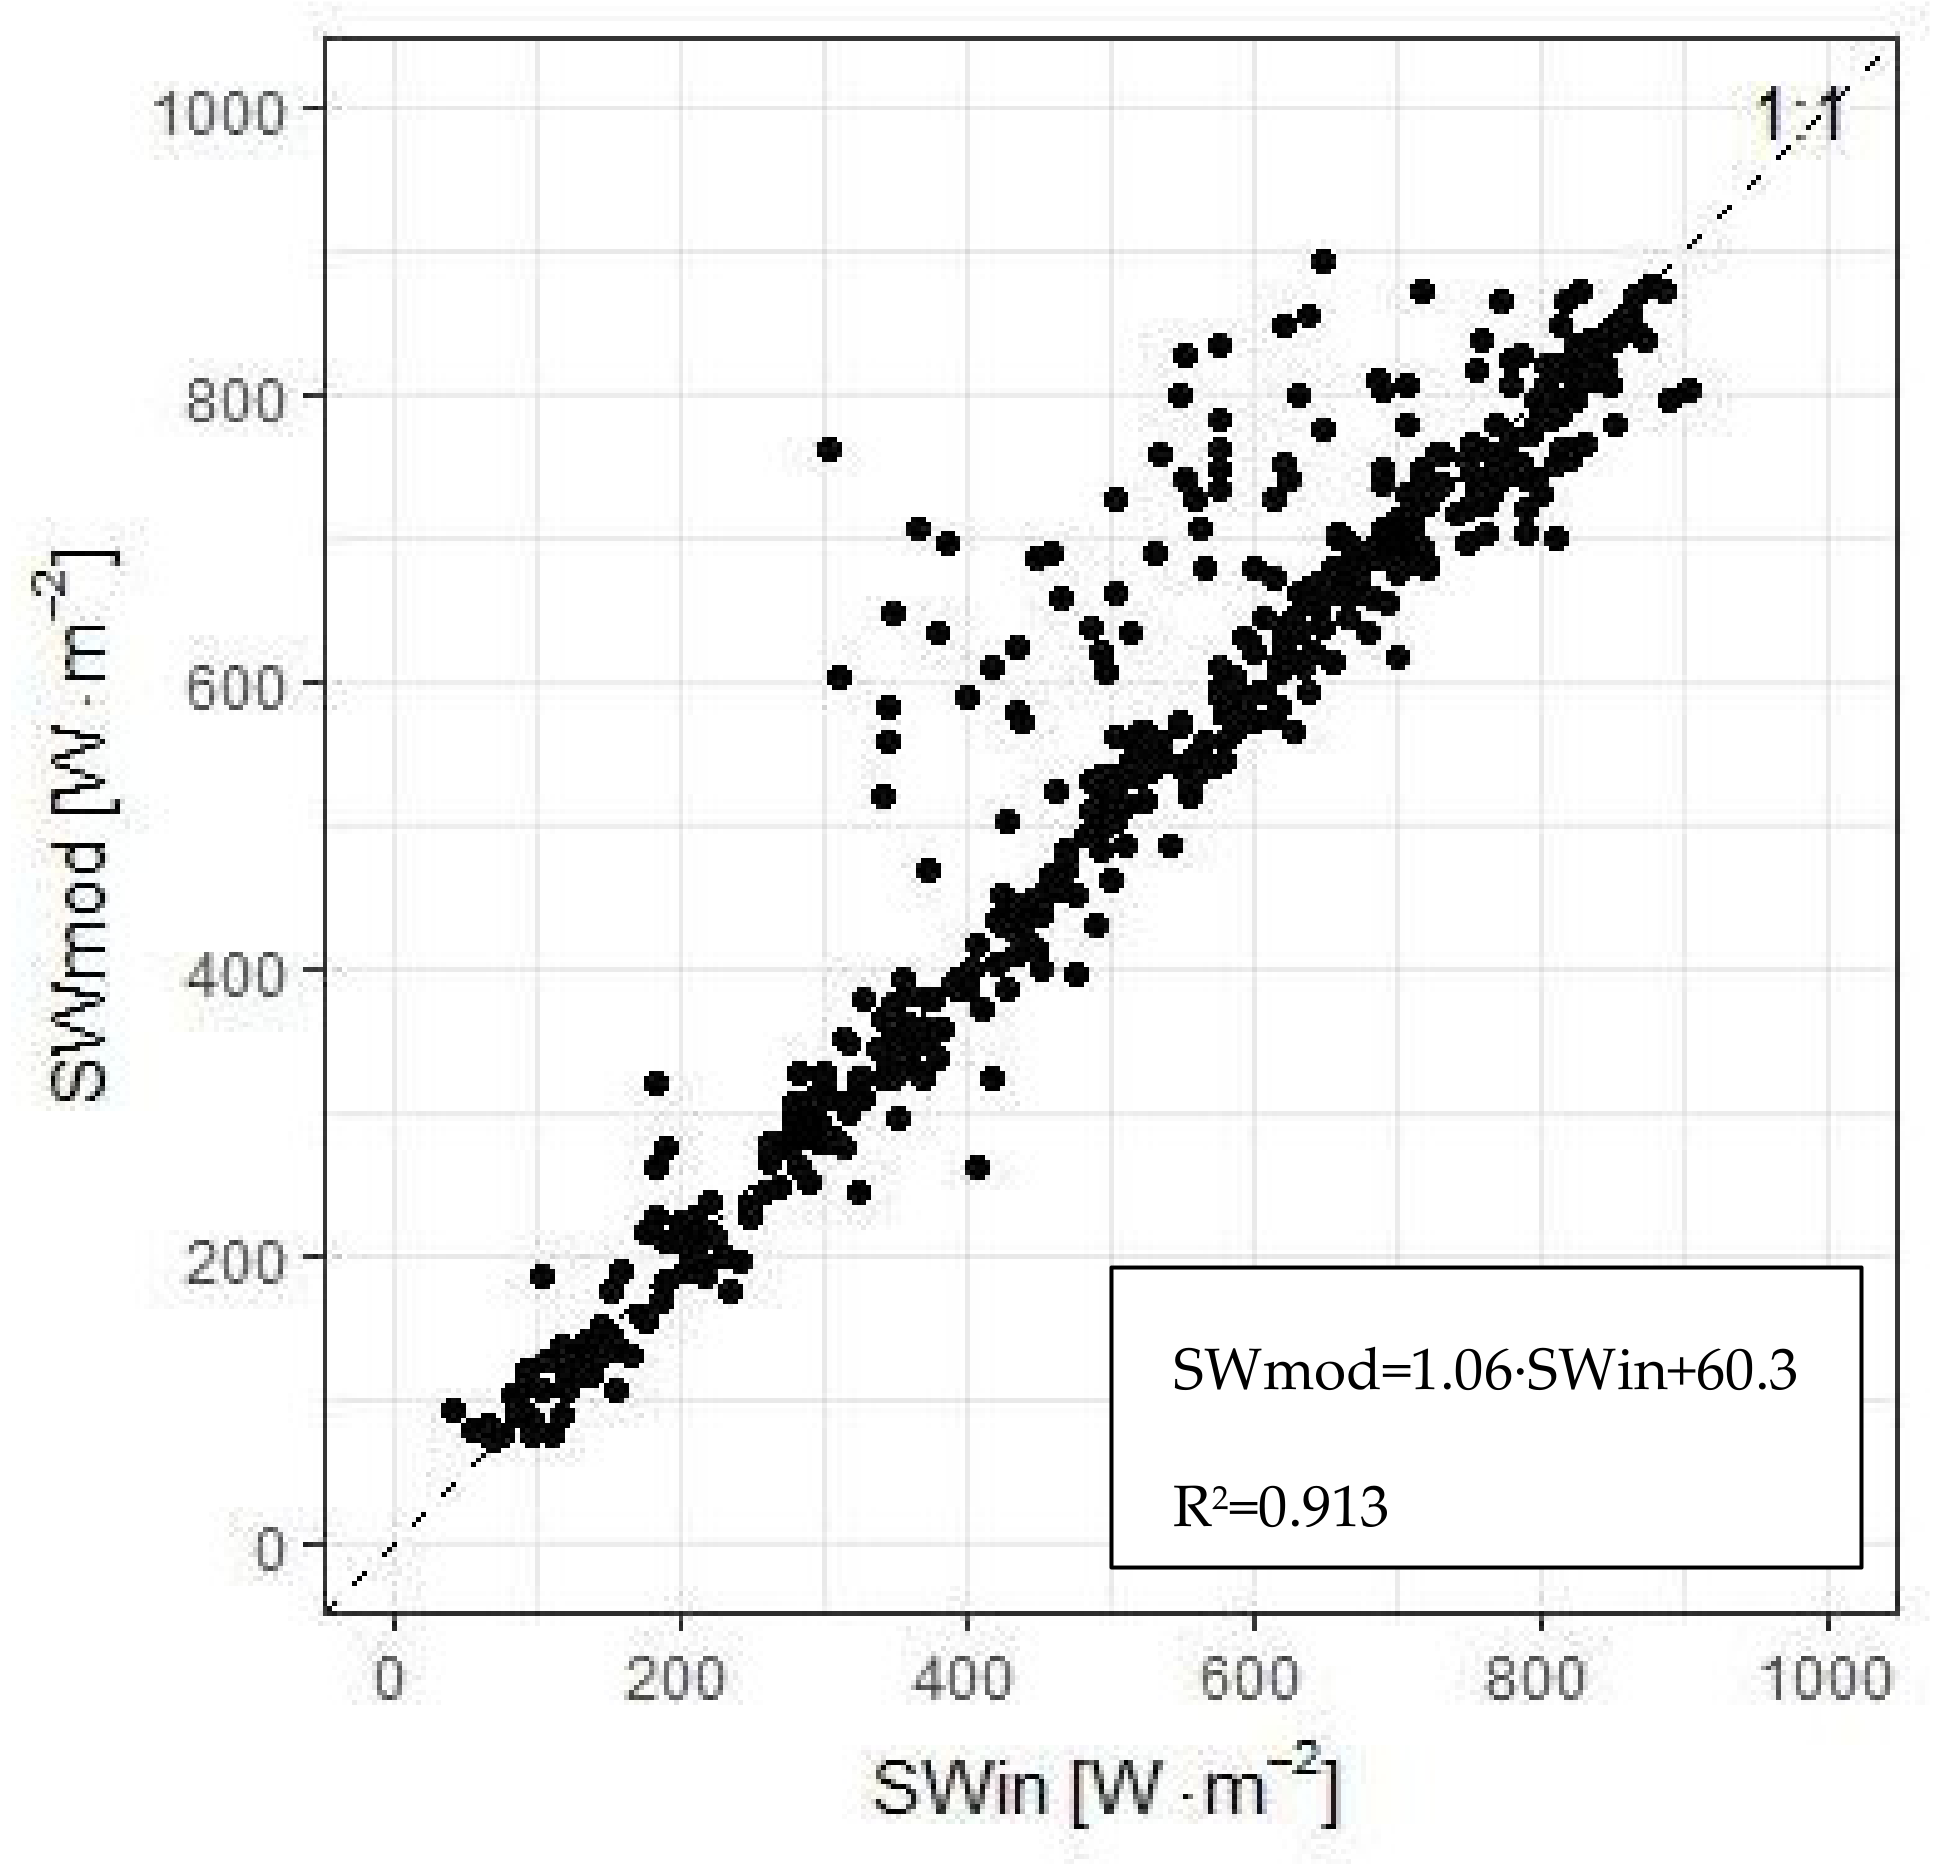
In order to estimate the direct and diffuse solar irradiance using photometric measurements, the ART model was used. The estimated values of solar irradiance (SWmod) were compared with the measured ones (SWin). There were very good matches found for total and diffuse irradiance, where b1 = 1.06, b0 = 60.3, R2 = 0.913 (Figure 6), and b1 = 0.5948, b0 = 26.1594, R2 = 0.667, respectively (MAE = 39.0 W⋅m−2, RMSE = 71.4 W⋅m−2, NRMSE = 4.75%, N = 489).
The ART overestimates some of the shortwave flux density values (SWmod) (Figure 6). This is probably due to the fact that the instantaneous values of AOT are applied for the 30-minute shortwave radiation flux estimation while pyranometer’s observations are carried out over the whole observation period. Additionally, both the field of view and measuring procedures of those sensors differ substantially and it can lead to SWmod overestimation during the moments when sparse clouds are present in the atmosphere.

3.5. EP Model Parametrization

The EP model was parameterized on the basis of measured values of Ta, total (It), direct (Ir), and diffused (If) irradiance. Nonlinear least-squares model was applied and all model parameters were found to be statistically significant (MAE = 2.36 µmol·m−2·s, RMSE = 3.09 µmol·m−2·s, NRMSE = 8.7%, N =1 034 (Table 1).

3.6. Effects of Meteorological Conditions and Optical Properties on NEP

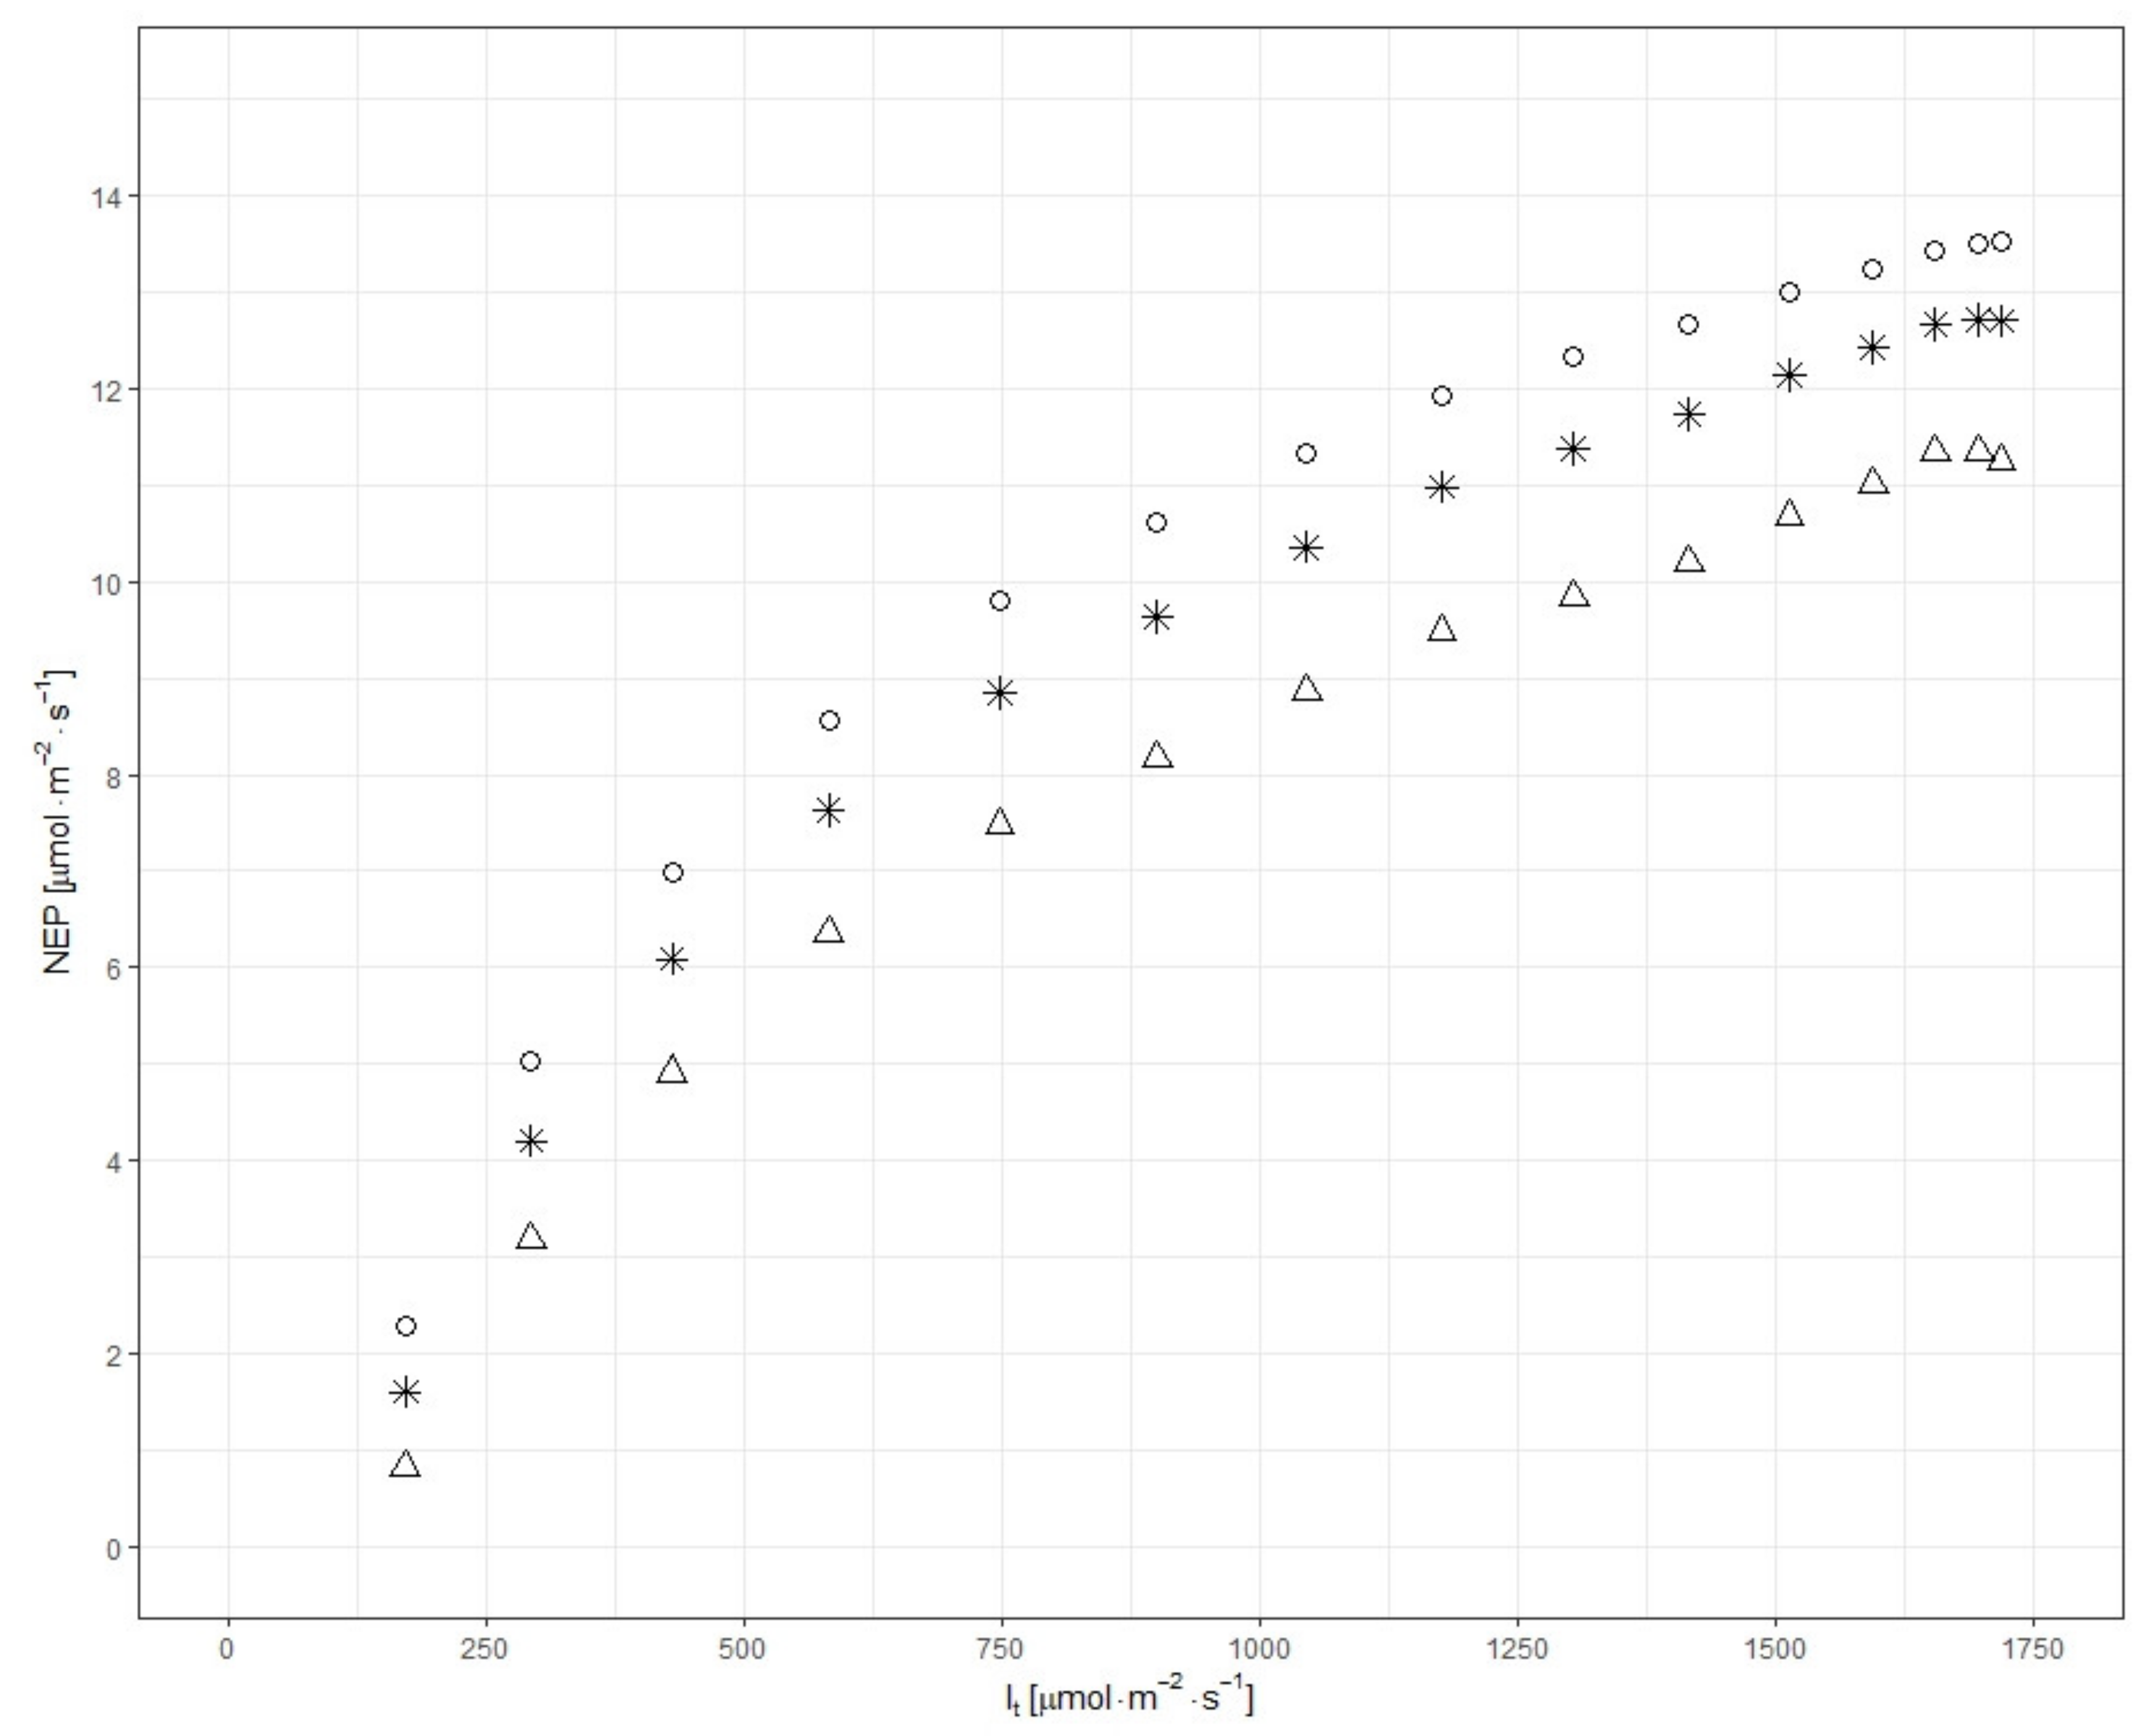
Three levels of DI values were used during these calculations, where the observed DI values were increased and decreased by 0.1 (Table 2, Figure 7). This range of DI values is considered typical for cloud free conditions [47].
The values of the measured DI that were applied in the calculation ranged between 0.16 and 0.57 during the analyzed day. These values are typical for sunny conditions, however, the additional turbidity virtually introduced by the modification of DI can be determined by the presence of clouds, e.g., thin cirrostratus type or increased transparency of air. Thus, only the simulations performed with the clear sky ART model enables the estimation of the cloud free atmosphere optical parameters impact on the peatlands production.
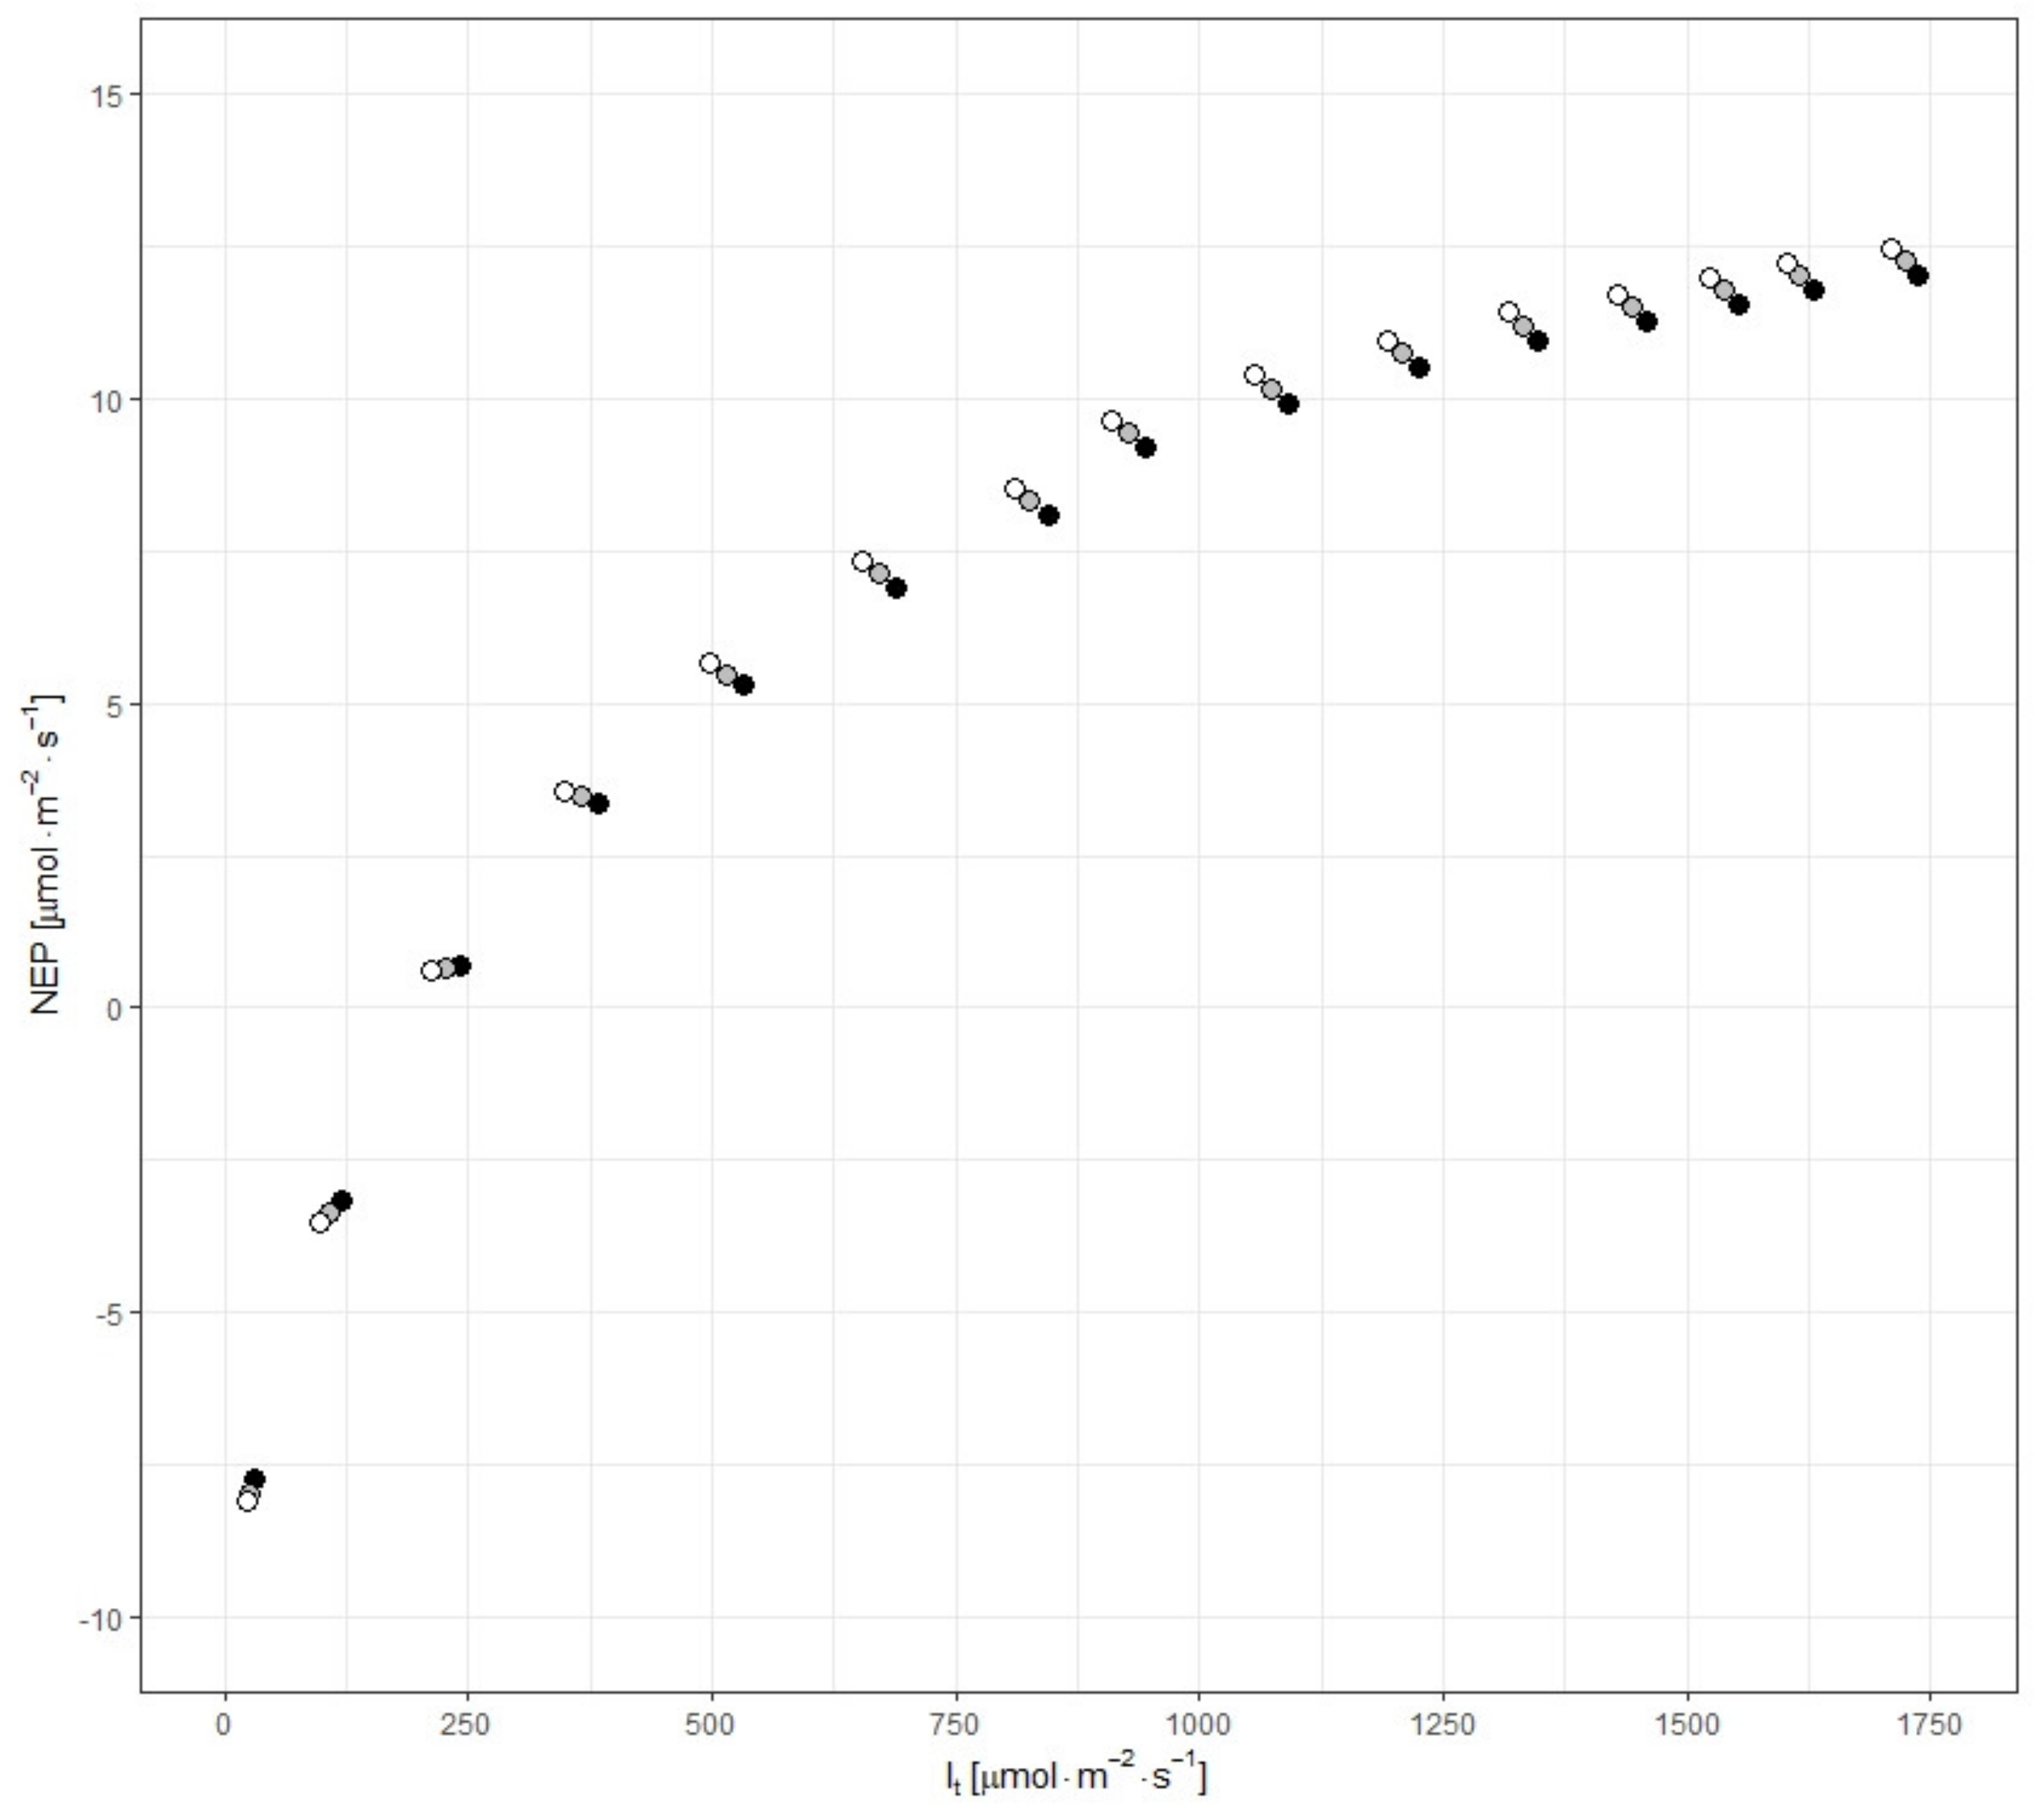
The conditions from the 23rd of June 2016 were applied again as input data in the EP model, however the ART model was used for the calculation of the total, direct, and diffused PPFD. These estimations were done for three AOT500 values: 0.09, 0.13, and 0.17 that are the 1st quartile, median, and 3rd quartile of AOT500 population, respectively (Table 3, Figure 8).
The change in diffusion index (DI) caused by the addition or subtraction of 0.1 from the measured values induced an NEP change of 0.68–0.98 µmol⋅m−2⋅s−1 (6.1–42.3%) and −1.55 to −0.79 µmol⋅m−2⋅s−1 (−49% to −10.5%) of CO2 uptake, respectively (Table 2). The application of the ART model allowed for the assessment of aerosol impact on peatland NEP. The increase of AOT500 value from 0.09 to 0.13 and 0.17 determined the rise of NEP in the range between 0.08 to 0.22 µmol⋅m−2⋅s−1 (1.9–3.1%) and 0.16 to 0.48 µmol⋅m−2⋅s−1 (3.4–5.7%) of NEP, respectively (Table 3). On the basis of these results, it was found that the method is responsive to AOT changes and there is a potential in CO2 uptake that is noticeable in the AOT increase from 0.09 to 0.17.
Aerosols can both absorb and scatter the radiation, thus the increase of AOT attenuates the total irradiance (It) and increases the share of diffuse radiation (DI) in this energy flux. Usually, the increase of DI determined by AOT500 increase results in ecosystem production (NEP) rise, however during the morning period the photosynthesis reduction determined by It attenuation prevails the gain obtained due to diffuse radiation impact. This situation is observed under low It values (<250 umol⋅m−2⋅s−1) when NEP values are close to zero (gross ecosystem production compensates ecosystem respiration) (Figure 8).

4. Discussion

Peatlands, due to their hydrogenic origin, are very sensitive to shifts of both thermal and hydrological conditions, but seem to be sensitive also to diffuse radiation that can determine their productivity rise as a result of higher light use efficiency, which is known as a diffuse fertilization effect [103]. The application of locally parametrized ART and EP models allowed the estimation of the peatland’s productivity change as a result of the radiation scattering modifications determined by AOT change. Such a strategy of study does not often appear in the context of the research of diffuse radiation impact on terrestrial vegetation productivity [104].
The short-term afternoon reduction of NEP (Figure 4) was observed in Rzecin. This limitation of NEP is probably determined by both the high leaf/air temperature that determines the heat stress, as well as the high vapor pressure deficit that reduces the gas exchange between leaf and ambient atmosphere [46]. This midday depression of the net ecosystem photosynthesis can be reduced by the aerosol presence in the atmosphere due to the leaf temperature decrease, which was also found in studies of terrestrial vegetation in East Asia [105].
The initial analysis of the collected data showed that NEP is noticeably reduced during periods when high values of VPD are found. Similar strong negative sensitivity to VPD of the Siberian taiga NEP was found on the basis of cloud and fire events analysis [106]. Thus, the stepwise data elimination showed that the afternoon NEP depression was not observed when VPD was lower than 20 hPa. This value corresponds with the results obtained by other authors for spruce, semi-arid steppe, and alpine shrub vegetation [16,107]. The wetland plants (well-watered environment) react to VPD similarly to other non-aquatic plants, and this indicates that the stomata of all plants act according to a common scheme.
The diurnal patterns of Ta and VPD have characteristic shapes where the afternoon values of both have been found to be higher than in the morning (analogous hours). Maximum values of both Ta and VPD were found around noon. The temperature rise induces CO2 efflux (ER). Additionally, higher air temperature results in an increased VPD that may inhibit photosynthesis (GEP). Thus, the higher values of Ta and VPD observed during the afternoon seemingly negatively affect NEP. In contrast to those two parameters, afternoon NEP values are higher than those observed during analogous hours in the morning. Response of DI between 15PM and 18PM can be unexpected (Figure 5c). This afternoon’s DI decrease is probably the effect of the convection process disappearance that leads to a situation where the sun’s disc is less often obscured by the clouds during low solar angles. However, in general, the DI values in the afternoon are still higher than in the morning, and this parameter seems to be a factor that is able to compensate and even surpass the reduction of NEP determined by higher Ta and VPD. The results of this analysis are in very good agreement with other authors findings in case of Beech forest [100].
The Canadian peatland study showed no evidence of higher net ecosystem CO2 exchange under diffuse light conditions; however, this study area was covered mainly by the vegetation characterized by noticeably lower LAI (maximum 1.3 m2·m−2) [50].
Typical values of DI for cloud free conditions are usually found in the range between 0.1 and 0.3 [16]. In this analysis, real measured values (0.16–0.57) were used as an input for NEP estimation using the EP model. The impact of a diffusion intensity change was estimated by the application of both the increase and decrease of DI by 0.1. Those modifications resulted in the change of DI values and its minimum values remained in a reasonable range from 0.06 to 0.26. For all It values, the NEP rose by 0.68–0.98 µmol⋅m−2⋅s−1 (6.1–42.3%) for a DI increase of 0.1 and declined by 0.79–1.55 µmol⋅m−2⋅s−1 (−49.0% to −10.5%) for a DI decrease of 0.1 (Table 2). The decrease of DI by 0.1 results in higher NEP reduction (−49.0 to −10.2%) than a DI increase (6.1–42.3%). Such asymmetric reactions of the ecosystem to changes of DI values can be explained by the lower radiation use efficiency of upper leaves that gain the radiation load under less scattered radiation.
The same EP model was used for the estimation of NEP during the cloud free conditions when the AOT500 value increased from 0.09 to 0.13 and from 0.13 to 0.17 (Table 3). The direct effect of AOT increase resulted in a reduction in incoming radiation, but simultaneously it determined an increase of NEP for It values higher than 300 µmol⋅m−2⋅s−1. The estimated NEP rises were determined by the changes in AOT500 value from 0.09 to 0.13 and from 0.13 to 0.17 resulting in an NEP increase in the range of 0.08–0.26 µmol⋅m−2⋅s−1 (1.9–3.1%) and 0.15–0.48 µmol⋅m−2⋅s−1 (1.6–2.7%), respectively (Table 3). In the case of It values below 300 µmol⋅m−2⋅s−1, a reduction of NEP was found, and under these conditions the increase of diffuse radiation did not compensate for the loss of NEP caused by It decrease. The presented results correspond with other studies (e.g., [108,109,110]) where the effects of atmospheric aerosol presence on the absorption of CO2 by terrestrial ecosystems showed opposite tendencies. An upward trend under moderate aerosol concentrations and cloudless conditions was found when the Mount Pinatubo eruption enhanced the deciduous forests photosynthesis rate by 23% and 8% in 1992 and 1993, respectively [44], while the increase in aerosol loading by 0.09 to 0.16 caused the boreal and hemiboreal forest GPP to rise by 6–14% [111]. The opposite situation was found during the significant reduction of total radiation determined by high AOT values, i.e., higher than 2.7 [110], and the forest canopy modeling study showed that crossing the AOT threshold of 1.0 resulted in canopy photosynthesis rate reduction despite the continuous light use efficiency increase [112].
These results are not surprising, since the diffuse irradiance values obtained from the ART model (cloud free conditions) were at least 40% lower than the observed one (b1 = 0.5948, b0 = 26.1594, R2 = 0.667). The agreement between simulated and measured diffuse irradiance values was also reduced (lower R2) by the possible presence of clouds on the sky dome (Figure 6). In other words, the disagreement between simulated and observed values may be rooted in uncertainty of the cloud free conditions described in the results section.
The changes in NEP determined by both DI and AOT500 modifications are weaker for higher values of It. This result indicates that ecosystem production potential for higher It is usually limited due to reaching the maximum capacity of plants to capture light and fix CO2 [104]. However, even in these circumstances the activation of lower leaves can determine higher CO2 uptake of the canopy.
These findings show that NEP of short plant canopies is sensitive to diffuse radiation. This indicates that a complex spatial structure of a vegetation layer is the primary feature, more than plant size, causing the interaction of ecosystems with diffused radiation. The results presented here show that aerosols can noticeably impact the peatland CO2 uptake. This determines the necessity of peatland-atmosphere interaction studies at larger spatial and temporal scales to account for aerosol variability. This extrapolation in time and space can be obtained by the application of observational networks that operate at a global scale. The following networks, then, can be the source of data for such extrapolation: integrated carbon observation system (ICOS) [113], baseline surface radiation network (BSRN) [114], and aerosol robotic network (AERONET), [37] where the ecosystem production, solar irradiance, and aerosol optical thickness are permanently measured, respectively.
Changes in the diffuse solar radiation (SWdif) received at the Earth’s surface have been observed over the last several decades [18,20,21,22,115]. In detail, changes in SWdif vary over the world, depending on the geographical location and measurement period. It has been noticed that there was a decrease in the annual mean series of SWdif in Spain from 1985–2010 of 2.1 W⋅m−2 per decade [116]. These results agree with the trends reported since the 1980s from a rural site in Estonia [19]. However, in the period from 1955–1992, no significant trend of SWdif was found there. A weak tendency towards a decrease in diffuse solar radiation during the period 1955–2005 was obtained in Moscow [20]. The decline in SWdif by 2.44 W⋅m−2 has also been observed in Germany from the 1960s to the late 1990s. The most likely causes of increases in global irradiance are the long-term decrease in the number of aerosols and longer sunshine duration [116].
The observed decrease in SWdif is in line with the brightening period reported in many regions of the world, which implies less scattering due to the decrease of aerosols and/or cloud cover during this period [117]. In the observed trends in SWdif, there are some exceptions. For example, Stanhill [18] found a statistically significant increase in SWdif at Dublin airport station. There are also some places where positive trends of SWdif were observed, e.g., U.S. (1995–2005) [118] and India (1971–2005) [22].
The diffuse solar radiation study in Poland shows the spatial and temporal variability of trends, and from the early 1970s to the mid -1990s, the annual DI mean series showed a significant increase in Warsaw [119], Wrocław, the Upper Silesian Industrial Region, and the Rybnik Coal Area [120], while a decrease in SWdif was found at the beginning of the 1980s at Wrocław station [121]. Generally, the decrease of the scattering process intensity prevails and the reduction of the ecosystem production due to DI decrease should be observed on a global scale [14]. However, the reaction of peatlands still requires estimation at the global scale. There is also the question of the reaction of peatland net production to a substantial increase in diffuse radiation determined by stratospheric eruptions, e.g., Mount Pinatubo [122].
The applied ART model estimated total solar radiation in a very realistic way, while the estimation of diffuse radiation flux is underestimated. This was mainly determined by the assumption of cloud free conditions. The measured diffuse radiation was found to have higher values than the modeled one and it was the effect of cloud presence. Thus, the application of the ART model gave us the opportunity to estimate the diffuse radiation impact on the cloud free moments and allowed for a separate study of aerosol impact on the peatland CO2 uptake. EP model was parameterized for conditions when VPD values were lower than 20 hPa and it is a limitation of the presented methodology. However, this data selection was necessary to omit the most important non-radiative limiting factor of plant photosynthesis. However, the obtained results show the the aerosol observations [35] in the atmosphere (their lifetime, properties and long-range transport) are important for the peatland or other ecosystems’ CO2 uptake estimations.
The combination of the EP and ART models enabled the impact of aerosols on Rzecin peatland CO2 uptake to be deconvolved. This approach provides the linkage between the ecosystem production and optical properties of the atmosphere, and allows for the shift of the scale of the study by application of remotely sensed data. The impact of diffuse radiation is usually considered an important factor that determines the NEP of higher plant canopies. This has been the primary reason that research related to diffuse radiation impact on ecosystem production has focused on forest ecosystems [14,16,42,43,44,45,46,47,48]. This study suggests that shorter vegetation investigations should be carried out more intensively, as fewer studies have been conducted on shorter plant canopies [43,49,50]. The presented analyses enrich our knowledge about the impact of aerosol presence on central Europe peatland CO2 exchange, which provides the basis for further and deeper considerations in this context. This analysis is also interesting due to the future cloud behavior simulations. It is predicted that the occurrence of clouds in some regions of the world will decrease [123] or even that some of their types (such as marine stratocumulus) will disappear [124] along with an increase in the concentration of greenhouse gases in the atmosphere. Moreover, even if the impact of aerosols on the peatland carbon balance is transient, further work will be required to characterize and quantify the diffuse radiation impact on the CO2 exchange of these valuable ecosystems.

5. Conclusions

The complex character of the interaction between the ecosystems and atmospheric conditions required the application of models that provided the basis for the deconvolving of single factors, e.g., aerosol and/or cloud impact on ecosystem production. The study focused only on the impact of optical parameter changes, determined by the aerosol presence in the atmosphere, on peatland net CO2 uptake during cloudless conditions.
Presented research elucidates the interactions between the optical parameters of the atmosphere, (e.g., DI and AOT500) and peatland production. Moreover, it clearly indicates that the scattering radiation process determined by the presence of aerosol modifies the amount of absorbed CO2 from the air.
These findings indicate a non-negligible impact of the optical properties of the atmosphere on the peatland NEP, thus the scattering process should be taken into account during further mass and exchange study of sphagnum dominated peatlands. It also indicates that future changes of diffuse irradiance will modify the CO2 uptake of transitional peatland. The study reported here is ont a ‘local’ scale. However, it indicates that more work needs to be done regionally and globally to better understand the influence of direct and diffuse solar radiation, particularly on peatland ecosystems and the accumulation or emission of carbon for climate change studies, if these studies are to be robust and included in climate change models.

Author Contributions

B.H.C. and K.M.H. solely wrote the paper. B.H.C. initiated the paper’s concept and mostly designed the analysis strategy. He interpreted the results, as well as concluded on relations between the optical properties of the atmosphere and peatland net productivity. K.M.H. cooperated in designing the data analysis strategy, participated in data interpretation, made prevailing part of data analysis, literature background, and manuscript editorial work. M.S. analyzed the vegetation data. R.J. contributed with the AOT measurements and supported the ecosystem production analysis. K.M.M. provided the atmospheric radiation transfer model and supported the analysis of the model results. I.S.S. provided the analysis of the optical properties of the atmosphere. M.K. provided the analysis of long-term studies of global shortwave radiation presented in this paper and the supported manuscript edition. A.M. contributed to the AOT measurements and provided support to the manuscript edition and discussion regarding ecosystem production. D.S. provided manuscript content support. All authors performed the merit revision of this manuscript. All authors have read and agreed to the published version of the manuscript.

Funding

This research was funded by European Space Agency (ESA-ESTEC), grant number 4000119961/16/NL/FF/mg (Technical assistance for POlish radar and LIdar Mobile Observation System—POLIMOS) and National Science Centre of Poland, grant number UMO-2017/27/B/ST10/02228 (Carbon dioxide uptake potential of sphagnum peatlands in the context of atmospheric optical parameters and climate changes). The APC was co-financed within the framework of Ministry of Science and Higher Education programme as “Regional Initiative Excellence” in years 2019–2022, Project No. 005/RID/2018/19.

Acknowledgments

We acknowledge the support of the UK Field Spectroscopy Facility and NERC for the long-term loan of the CIMEL sun photometer to support the work of MacArthur.

Conflicts of Interest

The authors declare no conflict of interest.

References

  1. Stocker, T.F.; Qin, D.; Plattner, G.-K.; Tignor, M.; Allen, S.K.; Boschung, J.; Nauels, A.; Xia, Y.; Bex, V.; Midgley, P.M. IPCC 2013: Climate Change 2013: The Physical Science Basis. Contribution of Working Group I to the Fifth Assessment Report of the Intergovernmental Panel on Climate Change; Cambridge University Press: Cambridge, UK; New York, NY, USA, 2013; p. 1535. [Google Scholar] [CrossRef] [Green Version]
  2. Baldocchi, D.D.; Vogel, C.A.; Hall, B. Seasonal variation of carbon dioxide exchange rates above and below a boreal jack pine forest. Agric. For. Meteorol. 1997, 83, 147–170. [Google Scholar] [CrossRef]
  3. Chapin, F.S.; Woodwell, G.M.; Randerson, J.T.; Rastetter, E.B.; Lovett, G.M.; Baldocchi, D.D.; Clark, D.A.; Harmon, M.E.; Schimel, D.S.; Valentini, R.; et al. Reconciling carbon-cycle concepts, terminology, and methods. Ecosystems 2006, 9, 1041–1050. [Google Scholar] [CrossRef] [Green Version]
  4. Limpens, J.; Berendse, F.; Blodau, C.; Canadell, J.G.; Freeman, C.; Holden, J.; Roulet, N.; Rydin, H.; Schaepman-Strub, G. Peatlands and the carbon cycle: From local processes to global implications—A synthesis. Biogeosciences 2006, 5, 1475–1491. [Google Scholar] [CrossRef] [Green Version]
  5. Dise, N.B. Peatland response to global change. Science 2009, 326, 810–811. [Google Scholar] [CrossRef]
  6. Harenda, K.M.; Lamentowicz, M.; Samson, M.; Chojnicki, B.H. The Role of Peatlands and Their Carbon Storage Function in the Context of Climate Change. In Interdisciplinary Approaches for Sustainable Development Goals; GeoPlanet Earth and Planetary Sciences; Zielinski, T., Sagan, I., Surosz, W., Eds.; Springer: Heidelberg/Berlin, Germany, 2018; pp. 169–187. ISBN 978-3-319-71787-6. [Google Scholar]
  7. Gorham, E. Northern peatlands: Role in the carbon cycle and probably responses to climate warming. Ecol. Appl. 1991, 182–195. [Google Scholar] [CrossRef]
  8. Lappalainen, E. General review on world peatland and peat resources. In Global Peat Resources; Lappalainen, E., Ed.; International Peat Society: Jyväskylä, Finland, 1996; pp. 53–56. [Google Scholar]
  9. Page, S.E.; Rieley, J.O.; Banks, C.J. Global and regional importance of the tropical peatland carbon pool. Glob. Change Biol. 2011, 17, 798–818. [Google Scholar] [CrossRef] [Green Version]
  10. Rydin, H.; Jeglum, J.K. The Biology of Peatlands, 2nd ed.; Oxford University Press: Oxford, UK, 2013; ISBN 978-0-19-960300-8. [Google Scholar]
  11. Heiskanen, L.; Tuovinen, J.-P.; Räsänen, A.; Virtanen, T.; Juutinen, S.; Lohila, A.; Penttilä, T.; Linkosalmi, M.; Mikola, J.; Laurila, T.; et al. Carbon dioxide and methane exchange of a patterned subarctic fen during two contrasting growing seasons. Biogeosciences 2021, 18, 873–896. [Google Scholar] [CrossRef]
  12. Steffen, W.; Rockström, J.; Richardson, K.; Lenton, T.M.; Folke, C.; Liverman, D.; Summerhayes, C.P.; Barnosky, A.D.; Cornell, S.E.; Crucifix, M.; et al. Trajectories of the Earth System in the Anthropocene. Proc. Natl. Acad. Sci. USA 2018, 115, 8252–8259. [Google Scholar] [CrossRef] [PubMed] [Green Version]
  13. Sinclair, T.R.; Murphy, C.E.; Knoerr, K.R. Development and evaluation of simplified models for simulating canopy photosynthesis and transpiration. J. Appl. Ecol. 1976, 13, 813–829. [Google Scholar] [CrossRef]
  14. Mercado, L.M.; Bellouin, N.; Sitch, S.; Boucher, O.; Huntingford, C.; Wild, M.; Cox, P.M. Impact of changes in diffuse radiation on the global land carbon sink. Nature 2009, 458, 1014–1017. [Google Scholar] [CrossRef] [Green Version]
  15. Zhou, H.; Yue, X.; Lei, Y.; Zhang, T.; Tian, C.; Ma, Y.; Cao, Y. Responses of gross primary productivity to diffuse radiation at global FLUXNET sites. Atmos. Environ. 2021, 244, 117905. [Google Scholar] [CrossRef]
  16. Urban, O.; Klem, K.; Ač, A.; Havránková, K.; Holišová, P.; Navrátil, M.; Zitová, M.; Kozlová, K.; Pokorný, R.; Šprtová, M.; et al. Impact of clear and cloudy sky conditions on the vertical distribution of photosynthetic CO2 uptake within a spruce canopy. Funct. Ecol. 2012, 26, 46–55. [Google Scholar] [CrossRef]
  17. Harenda, K.; Piątyszek, M.; Chojnicki, B.H. Reed canopy transparency under different levels of diffuse radiation. Acta Agrophys. 2015, 22, 387–395. [Google Scholar]
  18. Stanhill, G. Long-term trends in, and spatial variation of solar irradiances in Ireland. Int. J. Climatol. 1998, 18, 1015–1030. [Google Scholar] [CrossRef]
  19. Russak, V. Changes in solar radiation and their influence on temperature trend in Estonia (1955–2007). J. Geophys. Res. 2009, 114, D00D01. [Google Scholar] [CrossRef]
  20. Abakumova, G.M.; Gorbarenko, E.V.; Nezval, E.I.; Shilovtseva, O.A. Fifty years of actinometrical measurements in Moscow. Int. J. Remote Sens. 2008, 29, 2629–2665. [Google Scholar] [CrossRef]
  21. Wild, M. Global dimming and brightening: A review. J. Geophys. Res. 2009, 114, D00D16. [Google Scholar] [CrossRef] [Green Version]
  22. Soni, V.K.; Pandithurai, G.; Pai, D.S. Evaluation of long-term changes of solar radiation in India. Int. J. Climatol. 2012, 32, 540–551. [Google Scholar] [CrossRef]
  23. Alpert, P.; Kishcha, P.; Kaufman, Y.J.; Schwarzbard, R. Global dimming or local dimming?: Effect of urbanization on sunlight availability. Geophys. Res. Lett. 2005, 32, 1–4. [Google Scholar] [CrossRef] [Green Version]
  24. Kleniewska, M.; Chojnicki, B.H.; Acosta, M. Long-term total solar radiation variability at the Polish Baltic coast in Kołobrzeg within the period 1964–2013. Meteorol. Hydrol. Water Manag. 2016, 4, 35–40. [Google Scholar] [CrossRef]
  25. Kleniewska, M.; Chojnicki, B.H. Long-term solar radiation variability in Warszawa within the period 1964–2013. Acta Geogr. Lodz. 2016, 104, 67–74. (In Polish) [Google Scholar]
  26. Liou, K.N. Light scattering by particulates in the atmosphere. In An Introduction to Atmospheric Radiation; Liou, K.N., Ed.; International Geophysics: Amsterdam, The Netherlands, 1980; Volume 26, pp. 122–175. ISBN 978-0-12-451450-8. [Google Scholar]
  27. Wang, D.; Stachlewska, I.S.; Song, X.; Heese, B.; Nemuc, A. Variability of the boundary layer over an urban continental site based on 10 years of active remote sensing observations in Warsaw. Remote Sens. 2020, 12, 340. [Google Scholar] [CrossRef] [Green Version]
  28. Stachlewska, I.S.; Zawadzka, O.; Engelmann, R. Effect of heat wave conditions on aerosol optical properties derived from satellite and ground-based remote sensing over Poland. Remote Sens. 2017, 9, 1199. [Google Scholar] [CrossRef] [Green Version]
  29. Stachlewska, I.S.; Samson, M.; Zawadzka, O.; Harenda, K.M.; Janicka, L.; Poczta, P.; Szczepanik, D.; Heese, B.; Wang, D.; Borek, K.; et al. Modification of local urban aerosol properties by long-range transport of biomass burning aerosol. Remote Sens. 2018, 10, 412. [Google Scholar] [CrossRef] [Green Version]
  30. Kaufman, Y.J.; Tanré, D.; Boucher, O. A satellite view of aerosols in the climate system. Nature 2002, 419, 215–223. [Google Scholar] [CrossRef]
  31. Dieudonné, E.; Chazette, P.; Marnas, F.; Totems, J.; Shang, X. Raman Lidar Observations of Aerosol Optical Properties in 11 Cities from France to Siberia. Remote Sens. 2017, 9, 978. [Google Scholar] [CrossRef] [Green Version]
  32. Zawadzka-Manko, O.; Stachlewska, I.S.; Markowicz, K.M. Near-Real-Time Application of SEVIRI Aerosol Optical Depth Algorithm. Remote Sens. 2020, 12, 1481. [Google Scholar] [CrossRef]
  33. Justus, C.G.; Paris, M.V. A model for solar spectral irradiance and radiance at the bottom and top of a cloudless atmosphere. J. Clim. Appl. Meteorol. 1985, 24, 193–205. [Google Scholar] [CrossRef] [Green Version]
  34. Zdunkowski, W.; Trautmann, T.; Bott, A. Radiation in the Atmosphere; Cambridge University Press: Cambridge, UK, 2007; 496p, ISBN 978-0-521-87107-5. [Google Scholar]
  35. Yu, X.; Zhu, B.; Fan, S.; Yin, Y.; Bu, X. Ground-based observation of aerosol optical properties in Lanzhou. China J. Environ. Sci. 2009, 21, 1519–1524. [Google Scholar] [CrossRef]
  36. Katsev, I.L.; Prikhach, A.S.; Zege, E.P.; Grudo, J.O.; Kokhanovsky, A.A. Speeding up the aerosol optical thickness retrieval using analytical solutions of radiative transfer theory. Atmos. Measur. Tech. 2010, 3, 1403–1422. [Google Scholar] [CrossRef]
  37. Smirnov, A.; Holben, B.N.; Eck, T.F.; Dubovik, O.; Slutsker, I. Cloud-screening and quality control algorithms for the AERONET database. Remote Sens. Environ. 2000, 73, 337–349. [Google Scholar] [CrossRef]
  38. Sinclair, T.R.; Shiraiwa, T.; Hammer, G.L. Variation in Crop Radiation-Use Efficiency with Increased Diffuse Radiation. Crop Ecol. Prod. Manag. 1992. [Google Scholar] [CrossRef]
  39. Sinclair, T.R.; Shiraiwa, T. Soybean Radiation-Use Efficiency as Influenced by Nonuniform Specific Leaf Nitrogen Distribution and Diffuse Radiation. Crop Physiol. Metab. 1993. [Google Scholar] [CrossRef]
  40. Healey, K.D.; Hammer, G.L.; Rickert, K.G.; Bange, M.P. Radiation use efficiency increases when the diffuse component of incident radiation is enhanced under shade. Aust. J. Agric. Res. 1998, 49, 665–672. [Google Scholar] [CrossRef]
  41. Moureaux, C.; Debacq, A.; Bodson, B.; Heinesch, B.; Aubinet, M. Annual net ecosystem carbon exchange by a sugar beet crop. Agric. For. Meteorol. 2006, 139, 25–39. [Google Scholar] [CrossRef]
  42. Hollinger, D.Y.; Kelliher, F.M.; Byers, J.N.; Hunt, J.E.; McSeveny, T.M.; Weir, P.L. Carbon dioxide exchange between an undisturbed old-growth temperate forest and the atmosphere. Ecology 1994, 75, 134–150. [Google Scholar] [CrossRef]
  43. Law, B.E.; Falge, E.; Gu, L.; Baldocchi, D.D.; Bakwin, P.; Berbigier, P.; Davis, K.; Dolman, A.J.; Falk, M.; Fuentes, J.D.; et al. Environmental controls over carbon dioxide and water vapor exchange of terrestrial vegetation. Agric. For. Meteorol. 2002, 113, 97–120. [Google Scholar] [CrossRef] [Green Version]
  44. Gu, L.; Baldocchi, D.D.; Wofsy, S.C.; Munger, J.W.; Michalsky, J.J.; Urbanski, S.P.; Boden, T.A. Response of deciduous forest to the Mont Pinatubo eruption: Enhanced photosynthesis. Science 2003, 299, 2035–2038. [Google Scholar] [CrossRef] [Green Version]
  45. Alton, P.B.; North, P.R.; Los, S.O. The impact of diffuse sunlight on canopy light-use efficiency, gross photosynthetic product and net ecosystem exchange in three forest biomes. Glob. Change Biol. 2007, 13, 776–787. [Google Scholar] [CrossRef]
  46. Knohl, A.; Baldocchi, D.D. Effects of diffuse radiation on canopy gas exchange processes in a forest ecosystem. J. Geophys. Res. 2008, 113, G02023. [Google Scholar] [CrossRef]
  47. Urban, O.; Janous, D.; Acosta, M.; Czerny, R.; Markova, I.; Navratil, M.; Pavelka, M.; Pokorny, R.; Sprtova, M.; Zhang, R.; et al. Ecophysiological controls over the net ecosystem exchange of mountain spruce stand. Comparison of the response in direct vs. diffuse solar radiation. Glob. Change Biol. 2007, 13, 157–168. [Google Scholar] [CrossRef]
  48. Dengel, S.; Grace, J. Carbon dioxide exchange and canopy conductance of two coniferus forests under various sky conditions. Oecologia 2010, 164, 797–808. [Google Scholar] [CrossRef] [PubMed]
  49. Sims, D.A.; Rahman, A.F.; Cordova, V.D.; Baldocchi, D.D.; Flanagan, L.B.; Goldstein, A.H.; Hollinger, D.Y.; Misson, L.; Monson, R.K.; Schmid, H.P.; et al. Midday values of gross CO2 flux and light use efficiency during satellite overpasses can be used to directly estimate eight-day mean flux. Agric. For. Meteorol. 2005, 131, 1–12. [Google Scholar] [CrossRef]
  50. Letts, M.G.; Lafleur, P.M.; Roulet, N.T. On the relationship between cloudiness and net ecosystem carbon dioxide exchange in a peatland ecosystem. Ecoscience 2005, 12, 53–59. [Google Scholar] [CrossRef]
  51. Goodrich, J.P.; Campbell, D.I.; Clearwater, M.J.; Rutledge, S.; Schipper, L.A. High vapor pressure deficit constrains GPP and the light response of NEE at a Southern Hemisphere bog. Agric. For. Meteorol. 2015, 203, 54–63. [Google Scholar] [CrossRef]
  52. Kross, A.; Seaquist, J.W.; Roulet, N.T. Light use efficiency of peatlands: Variability and suitability for modeling ecosystem production. Remote Sens. Environ. 2016, 183, 239–249. [Google Scholar] [CrossRef]
  53. Chojnicki, B.H.; Urbaniak, M.; Józefczyk, D.; Augustin, J.; Olejnik, J. Measurements of gas and heat fluxes at Rzecin wetland. In Wetlands: Monitoring, Monitoring, Modeling and Menagement; Okruszko, T., Maltby, E., Szatyłowicz, J., Świątek, D., Kotowski, W., Eds.; Taylor & Francis Group: London, UK, 2007; pp. 125–130. ISBN 978-0-415-40820-2. [Google Scholar]
  54. Wojterska, M.; Stachanowicz, W.; Melosik, I. Flora i roślinność torfowiska nad Jeziorem Rzecińskim koło Wronek. In Szata roślinna Wielkopolski i Pojezierza Południowo Pomorskiego; Wojterska, M., Ed.; Bogucki Wydawnictwo Naukowe: Poznan, Poland, 2001; pp. 211–219. ISBN 978-8-38-816380-7. [Google Scholar]
  55. Acosta, M.; Juszczak, R.; Chojnicki, B.; Pavelka, M.; Havránková, K.; Leśny, J.; Krupková, L.; Urbaniak, M.; Machačová, K.; Olejnik, J. CO2 fluxes from different vegetation communities on a peatland ecosystem. Wetlands 2017, 37, 423–435. [Google Scholar] [CrossRef]
  56. Bandopadhyay, S.; Rastogi, A.; Rascher, U.; Rademske, P.; Schickling, A.; Cogliati, S.; Julitta, T.; Mac Arthur, A.; Hueni, A.; Tomelleri, E.; et al. HyPlant-Derived Sun-Induced Fluorescence—A New Opportunity to Disentangle Complex Vegetation Signals from Diverse Vegetation Types. Remote Sens. 2019, 11, 1691. [Google Scholar] [CrossRef] [Green Version]
  57. Barabach, J. The history of Lake Rzecin, its surroundings drawn on maps as a background to palaeoecological reconstruction. Limnol. Rev. 2012, 12, 103–114. [Google Scholar] [CrossRef] [Green Version]
  58. Lamentowicz, M.; Mueller, M.; Gałka, M.; Barabach, J.; Mileca, K.; Goslar, T.; Binkowski, M. Reconstructing human impact on peatland development during the past 200 years in CE Europe through biotic proxies and X-ray tomography. Quat. Int. 2015, 357, 282–294. [Google Scholar] [CrossRef]
  59. Milecka, K.; Kowalewski, G.; Fiałkiewicz-Kozieł, B.; Gałka, M.; Lamentowicz, M.; Chojnicki, B.H.; Goslar, T.; Barabach, J. Hydrological changes in the Rzecin peatland (PuszczaNotecka, Poland) induced by anthropogenic factors: Implications for mire development and carbon sequestration. Holocene 2016, 1–14. [Google Scholar] [CrossRef]
  60. Romanowska, J. Analysis of the pH Spatial Variability of Peat at Rzecin Bog. Master’s Thesis, Poznan University of Life Sciences, Poznan, Poland, 2015. (In Polish). [Google Scholar]
  61. Farat, R. Climate Atlas of the Wielkopolska Region; Wydawnictwo IMGW: Warszawa, Poland, 2004. [Google Scholar]
  62. Baldocchi, D. Measuring fluxes of trace gases and energy between ecosystems and the atmosphere—The state and future of the eddy covariance method. Glob. Change Biol. 2014, 20, 3600–3609. [Google Scholar] [CrossRef]
  63. Schmid, H.P. Source areas for scalars and scalar fluxes. Bound. Layer Meteorol. 1994, 67, 293–318. [Google Scholar] [CrossRef]
  64. Liang, S.; Wang, J. Estimate of vegetation production of terrestrial ecosystem. Adv. Remote Sens. (Second Ed.) 2020, 581–620. [Google Scholar] [CrossRef]
  65. Dabberdt, W.F.; Lenschow, D.H.; Horst, T.W.; Zimmerman, P.R.; Oncley, S.P.; Delany, A.C. Atmosphere-surface exchange measurements. Science 1993, 260, 1472–1481. [Google Scholar] [CrossRef] [PubMed]
  66. Aubinet, M.; Vesala, T.; Papale, D. (Eds.) Eddy Covariance: A Practical Guide to Measurement and Data Analysis; Springer: Dordrecht, The Netherlands, 2012; p. 438. ISBN 978-94-007-2351-1. [Google Scholar]
  67. LI-COR. EddyPro5 Help and User’s Guide; LI-COR Inc.: Lincoln, NE, USA, 2014. [Google Scholar]
  68. Vickers, D.; Mahrt, L. Quality control and flux sampling problems for tower and aircraft data. J. Atm. Ocean. Tech. 1997, 14, 512–526. [Google Scholar] [CrossRef]
  69. Mauder, M.; Cuntz, M.; Drüe, C.; Graf, A.; Rebmann, C.; Schmid, H.P.; Schmidt, M.; Steinbrecher, R. A strategy for quality and uncertainty assessment of long-term eddy-covariance measurements. Agric. For. Meteorol. 2013, 169, 122–135. [Google Scholar] [CrossRef]
  70. Ibrom, A.; Dellwik, E.; Larsen, S.E.; Pilegaard, K. On the use of the Webb–Pearman–Leuning theory for closed-path eddy correlation measurements. Tellus B 2007, 59, 937–946. [Google Scholar] [CrossRef]
  71. Moncrieff, J.B.; Massheder, J.M.; de Bruin, H.; Ebers, J.; Friborg, T.; Heusinkveld, B.; Kabat, P.; Scott, S.; Soegaard, H.; Verhoef, A. A system to measure surface fluxes of momentum, sensible heat, water vapor and carbon dioxide. J. Hydrol. 1997, 188, 589–611. [Google Scholar] [CrossRef]
  72. Mauder, M.; Foken, T. Impact of post-field data processing on eddy covariance flux estimates and energy balance closure. Meteorol. Z. 2006, 15, 597–609. [Google Scholar] [CrossRef]
  73. Kljun, N.; Calanca, P.; Rotach, M.W.; Schmid, H.P. A simple parameterisation for flux footprint predictions. Bound. Layer Meteorol. 2004, 112, 503–523. [Google Scholar] [CrossRef]
  74. Holben, B.N.; Eck, T.F.; Slutsker, I.; Tanré, D.; Buis, J.P.; Setzer, A.; Vermote, E.; Reagan, J.A.; Kaufman, Y.J.; Nakajima, T.; et al. AERONET—A federated instrument network and data archive for aerosol characterization. Remote Sens. Environ. 1998, 66, 1–16. [Google Scholar] [CrossRef]
  75. AERONET, 2018. Aerosol Robotic Network. Available online: https://aeronet.gsfc.nasa.gov/ (accessed on 6 February 2018).
  76. Markowicz, K. Metody pomiaru optycznych właściwości aerozolu atmosferycznego. In Pyły Drobne w Atmosferze. Kompendium Wiedzy o Zanieczyszczeniu Powietrza Pyłem Zawieszonym w Polsce; Juda-Rezler, K., Toczko, B., Eds.; Biblioteka Monitoringu Środowiska: Warsaw, Poland, 2016; pp. 115–119. ISBN 978-83-61227-73-1. [Google Scholar]
  77. Wood, J.; Muneer, T.; Kubie, J. Evaluation of a New Photodiode Sensor for Measuring Global and Diffuse Irradiance, and Sunshine Duration. J. Sol. Energy Eng. 2003, 125, 1–6. [Google Scholar] [CrossRef] [Green Version]
  78. Hájek, M.; Hájková, P. Menyantho trifoliatae-Sphagnetum teretis Warén 1926. In Vegetace České Republiky. 3. Vodní a Mokřadní Vegetace [Vegetation of the Czech Republic 3. Aquatic and Wetland Vegetation]; Chytrý, M., Ed.; Academia: Praha, Czech Republic, 2011; pp. 657–660. [Google Scholar]
  79. Huemmrich, K.F.; Black, T.A.; Jarvis, P.G.; McCaughey, J.H.; Hall, F.G. High temporal resolution NDVI phenology from micrometeorological radiation sensors. J. Geophys. Res. 1999, 104, 27935–27944. [Google Scholar] [CrossRef]
  80. Wohlfahrt, G.; Pilloni, S.; Hörtnagl, L.; Hammerle, A. Estimating carbon dioxide fluxes from temperate mountain grasslands using broad-band vegetation indices. Biogeosciences 2010, 7, 683–694. [Google Scholar] [CrossRef] [PubMed] [Green Version]
  81. Chojnicki, B.H. Spectral estimation of wetland carbon dioxide exchange. Int. Agrophys. 2013, 27, 1–5. [Google Scholar] [CrossRef]
  82. Frolking, S.; Roulet, N.T.; Tuittila, E.; Bubier, J.L.; Quillet, A.; Talbot, J.; Richard, P.J.H. A new model of Holocene peatland net primary production, decomposition, water balance, and peat accumulation. Earth Syst. Dynam. 2010, 1, 1–21. [Google Scholar] [CrossRef] [Green Version]
  83. Wania, R.; Ross, I.; Prentice, I.C. Integrating peatlands and permafrost into a dynamic global vegetation model: 1. Evaluation and sensitivity of physical land surface processes. Global Biogeochem. Cycles 2009, 23, 1–19. [Google Scholar] [CrossRef] [Green Version]
  84. Wania, R.; Ross, I.; Prentice, I.C. Integrating peatlands and permafrost into a dynamic global vegetation model: 2. Evaluation and sensitivity of vegetation and carbon cycle processes. Global Biogeochem. Cycles 2009, 23, 1–15. [Google Scholar] [CrossRef] [Green Version]
  85. Wu, Y.; Verseghy, D.L.; Melton, J.R. Integrating peatlands into the coupled Canadian Land Surface Scheme (CLASS) v3.6 and the Canadian Terrestrial Ecosystem Model (CTEM) v2.0. Geosci. Model Dev. 2016, 9, 2639–2663. [Google Scholar] [CrossRef] [Green Version]
  86. Charbonnier, F.; Roupsard, O.; le Maire, G.; Guillemot, J.; Casanoves, F.; Lacointe, A.; Vaast, P.; Allinne, C.; Audebert, L.; Cambou, A.; et al. Increased light-use efficiency sustains Net Primary Productivity of shaded coffee plants in agroforestry system. Plant. Cell Environ. 2017, 40, 1–36. [Google Scholar] [CrossRef] [PubMed]
  87. Gu, L.; Baldocchi, D.; Verma, S.B.; Black, T.A.; Vesala, T.; Falge, E.M.; Dowty, P.R. Advantages of diffuse radiation for terrestrial ecosystem productivity. J. Geophys. Res. 2002, 107, 4050. [Google Scholar] [CrossRef] [Green Version]
  88. Myers, D.; Emery, K.; Gueymard, C. Revising and validating spectral irradiance reference standards for photovoltaic performance evaluation. Trans. ASME J. Solar Eng. 2004, 126, 567–574. [Google Scholar] [CrossRef]
  89. Box, E.O.; Holben, B.N.; Kalb, V. Accuracy of the AVHRR vegetation index as a predictor of biomass, primary productivity and net CO2 flux. Vegetatio 1989, 80, 71–89. [Google Scholar] [CrossRef]
  90. Markowicz, K.M.; Zawadzka, O.; Lisok, J.; Chilinski, M.T.; Xian, P. Impact of moderate absorbing aerosol on surface sensible, latent and net radiative fluxes during summer of 2015 over Central Europe. J. Aerosol Sci. 2020, 151, 105627. [Google Scholar] [CrossRef]
  91. Malinovic-Milicevic, S.; Mihailovic, D.T. The use of NEOPLANTA model for evaluating the UV index in the Vojvodina region (Serbia). Atmos. Res. 2011, 101, 621–630. [Google Scholar] [CrossRef]
  92. Tuzet, F.; Dumont, M.; Lafaysse, M.; Picard, G.; Arnaud, L.; Voisin, D.; Lejeune, Y.; Charrois, L.; Nabat, P.; Morin, S. A multilayer physically based snowpack model simulating direct and indirect radiative impacts of light-absorbing impurities in snow. Cryosphere 2017, 11, 2633–2653. [Google Scholar] [CrossRef] [Green Version]
  93. Brine, D.T.; Iqbal, M. Diffuse and global solar spectral irradiance under cloudless skies. Sol. Energy 1983, 30, 447–453. [Google Scholar] [CrossRef]
  94. McAdam, S.A.M.; Brodribb, T.J. The Evolution of Mechanisms Driving the Stomatal Response to Vapor Pressure Deficit. Plant Physiol. 2015, 167, 833–843. [Google Scholar] [CrossRef] [Green Version]
  95. Angelocci, L.R.; Marin, F.R.; de Oliveira, R.F.; Righi, E.Z. Transpiration, leaf diffusive conductance, and atmospheric water demand relationship in an irrigated acid lime orchard. Braz. J. Plant Physiol. 2004, 16. [Google Scholar] [CrossRef]
  96. McAdam, S.A.M.; Sussmilch, F.A.; Brodribb, T.J. Stomatal responses to vapour pressure deficit are regulated by high speed gene expression in angiosperms. Plant Cell Environ. 2015, 39, 485–491. [Google Scholar] [CrossRef]
  97. Willmott, C.J.; Matsuura, K. Advantages of the mean absolute error (MAE) over the root mean square error (RMSE) in assessing average model performance. Clim. Res. 2005, 30, 79–82. [Google Scholar] [CrossRef]
  98. Altman, D.G.; Bland, J.M. Standard deviations and standard errors. BMJ Br. Med. J. 2005, 331, 903. [Google Scholar] [CrossRef] [Green Version]
  99. R Core Team. R: A Language and Environment for Statistical Computing; R Foundation for Statistical Computing: Vienna, Austria, 2019; Available online: https://www.R-project.org/ (accessed on 20 April 2021).
  100. Misson, L.; Lunden, M.; McKay, M.; Goldstein, A.H. Atmospheric aerosol light scattering and surface wetness influence the diurnal pattern of net ecosystem exchange in a semi-arid ponderosa pine plantation. Agric. For. Meteorol. 2005, 129, 69–83. [Google Scholar] [CrossRef]
  101. Schaffer, B.; Andersen, P.C. Handbook of Environmental Physiology of Fruit Crops; CRC Press: Boca Raton, FL, USA, 1994; ISBN 0849301793/9780849301797. [Google Scholar]
  102. Cernusak, L.A.; Goldsmith, G.R.; Arend, M.; Siegwolf, R.T.W. Effect of Vapor Pressure Deficit on Gas Exchange in Wild-Type and Abscisic Acid-Insensitive Plants. Plant Physiol. 2019. [Google Scholar] [CrossRef] [Green Version]
  103. Roderick, M.L.; Farquhar, G.D.; Berry, S.L.; Noble, I.R. On the direct effect of clouds and atmospheric particles on the productivity and structure of vegetation. Oceologia 2001, 129, 21–30. [Google Scholar] [CrossRef] [PubMed]
  104. Kanniah, K.D.; Beringer, J.; North, P.; Hutley, L. Control of atmospheric particles on diffuse radiation and terrestrial plant productivity: A review. Prog. Phys. Geogr. Earth Environ. 2012, 36, 209–237. [Google Scholar] [CrossRef]
  105. Steiner, A.L.; Chameides, W.L. Aerosol-induced thermal effects increase modelled terrestrial photosynthesis and transpiration. Tellus B Chem. Phys. Meteorol. 2005, 57, 404–411. [Google Scholar] [CrossRef]
  106. Park, S.-B.; Knohl, A.; Lucas-Moffat, A.M.; Migliavacca, M.; Gerbig, C.; Vesala, T.; Peltola, O.; Mammarella, I.; Kolle, O.; Lavrič, J.V.; et al. Strong radiative effect induced by clouds and smoke on forest net ecosystem productivity in central Siberia. Agric. For. Meteorol. 2018, 250, 376–387. [Google Scholar] [CrossRef]
  107. Fu, Y.L.; Yu, G.R.; Sun, X.M.; Li, Y.N.; Wen, X.F.; Zhang, L.M.; Li, Z.Q.; Zhao, L.; Hao, Y.B. Depression of net ecosystem CO2 exchange in semi-arid Leymuschinensis steppe and alpine shrub. Agric. For. Meteorol. 2006, 137, 234–244. [Google Scholar] [CrossRef]
  108. Kobayashi, H.; Matsunaga, T.; Hoyano, A. Net primary production in Southeast Asia following a largereduction in Photosynthetically Active Radiation owing to smoke. Geophys. Res. Lett. 2005, 32, L02403. [Google Scholar] [CrossRef]
  109. Greenwald, R.; Bergin, M.H.; Xu, G.; Cohan, D.; Hoogenboom, G.; Chameides, W.L. The influence of aerosols on crop production: A study using the CERES cropmodel. Agric. Syst. 2006, 89, 390–413. [Google Scholar] [CrossRef]
  110. Oliveira, P.H.F.; Artaxo, P.; Pires, C.; De Lucca, S.; Procopio, A.; Holben, B.; Schafer, J.; Cardoso, L.F.; Wofsy, S.C.; Rocha, H.R. The effects of biomass burning aerosols and clouds on the CO2 flux in Amazonia. Tellus B 2007, 59, 338–349. [Google Scholar] [CrossRef]
  111. Ezhova, E.; Ylivinkka, I.; Kuusk, J.; Komsaare, K.; Vana, M.; Krasnova, A.; Noe, S.; Arshinov, M.; Belan, B.; Park, S.-B.; et al. Direct effect of aerosols on solar radiation and gross primary production in boreal and hemiboreal forests. Atmos. Chem. Phys. 2018, 18, 17863–17881. [Google Scholar] [CrossRef] [Green Version]
  112. Kobayashi, H.; Iwabuchi, H. A coupled 1-Datmopshere and 3-D canopy radiative transfer model for canopy reflectance, light environment, and photosynthesis simulation in a heterogeneous landscape. Remote Sens. Environ. 2008, 112, 173–185. [Google Scholar] [CrossRef]
  113. Baldocchi, D.; Falge, E.; Gu, L.; Olson, R.; Hollinger, D.; Running, S.; Anthoni, P.; Bernhofer, C.; Davis, K.; Evans, R.; et al. FLUXNET: A new tool to study the temporal and spatial variability of ecosystem-scale carbon dioxide, water vapor, and energy flux densities. Bull. Amer. Meteor. Soc. 2001, 82, 2415–2434. [Google Scholar] [CrossRef]
  114. Ohmura, A.; Dutton, E.G.; Forgan, B.; Frohlich, C.; Gilgen, H.; Hegner, H.; Heimo, A.; Konig-Langlo, G.; McArthur, B.; Muller, G.; et al. Baseline Surface Radiation Network (BSRN/WRMC), a new precision radiometry for climate research. Bull. Am. Meteorol. Soc. 1998, 79, 2115–2136. [Google Scholar] [CrossRef] [Green Version]
  115. Russak, V. Trends of solar radiation, cloudiness and atmospheric transparency during recent decades in Estonia. Tellus. B Chem. Phys. Meteorol. 1990, 42, 206–210. [Google Scholar] [CrossRef]
  116. Power, H.C. Trends in solar radiation over Germany and an assessment of the role of aerosols and sunshine duration. Theor. Appl. Climatol. 2003, 76, 47–63. [Google Scholar] [CrossRef]
  117. Sanchez–Lorenzo, A.; Calbo, J.; Wild, M. Global and diffuse solar radiation in Spain: Building a homogeneous dataset and assessing their trends. Glob. Planet. Change 2013, 100, 343–352. [Google Scholar] [CrossRef]
  118. Long, C.N.; Dutton, E.G.; Augustine, J.A.; Wiscombe, W.; Wild, M.; McFarlane, S.A.; Flynn, C.J. Significant decadal brightening of downwelling shortwave in the continental United States. J. Geophys. Res. 2009, 114, D00D06. [Google Scholar] [CrossRef]
  119. Bogdańska, B.; Podogrocki, J. The Variability of Global Solar Radiation in Poland during the Period 1961–1995; Research Materials Meteorology Institute of Meteorology and Water Management (IMGW): Warsaw, Poland, 2000; p. 43. (In Polish) [Google Scholar]
  120. Rojan, P. The Influence of Urbanization and Industrialization on Global Solar Radiation Structure. Urban Climate and Bioclimate; Lodz University: Łódź, Poland, 1995; pp. 111–115. (In Polish) [Google Scholar]
  121. Bryś, K. Dynamics of Net Radiation Balance of Grass Surface and Bare Soil; Wroclaw University of Environmental and Life Science: Wroclaw, Poland, 2013. (In Polish) [Google Scholar]
  122. Alados-Arboledas, L.; Olmo, F.J.; Ohrvil, H.O.; Teral, H.; Arak, M.; Teral, K. Evolution of solar radiative effects of Mount Pinatubo at ground level. Tellus. B Chem. Phys. Meteorol. 1997, 49, 190–198. [Google Scholar] [CrossRef] [Green Version]
  123. Norris, J.; Allen, R.; Evan, A.; Zelinka, M.D.; O’Dell, C.W.; Klein, S.A. Evidence for climate change in the satellite cloud record. Nature 2016, 536, 72–75. [Google Scholar] [CrossRef] [PubMed] [Green Version]
  124. Schneider, T.; Kaul, C.M.; Pressel, K.G. Possible climate transitions from breakup of stratocumulus decks under greenhouse warming. Nat. Geosci. 2019, 12, 163–167. [Google Scholar] [CrossRef] [Green Version]
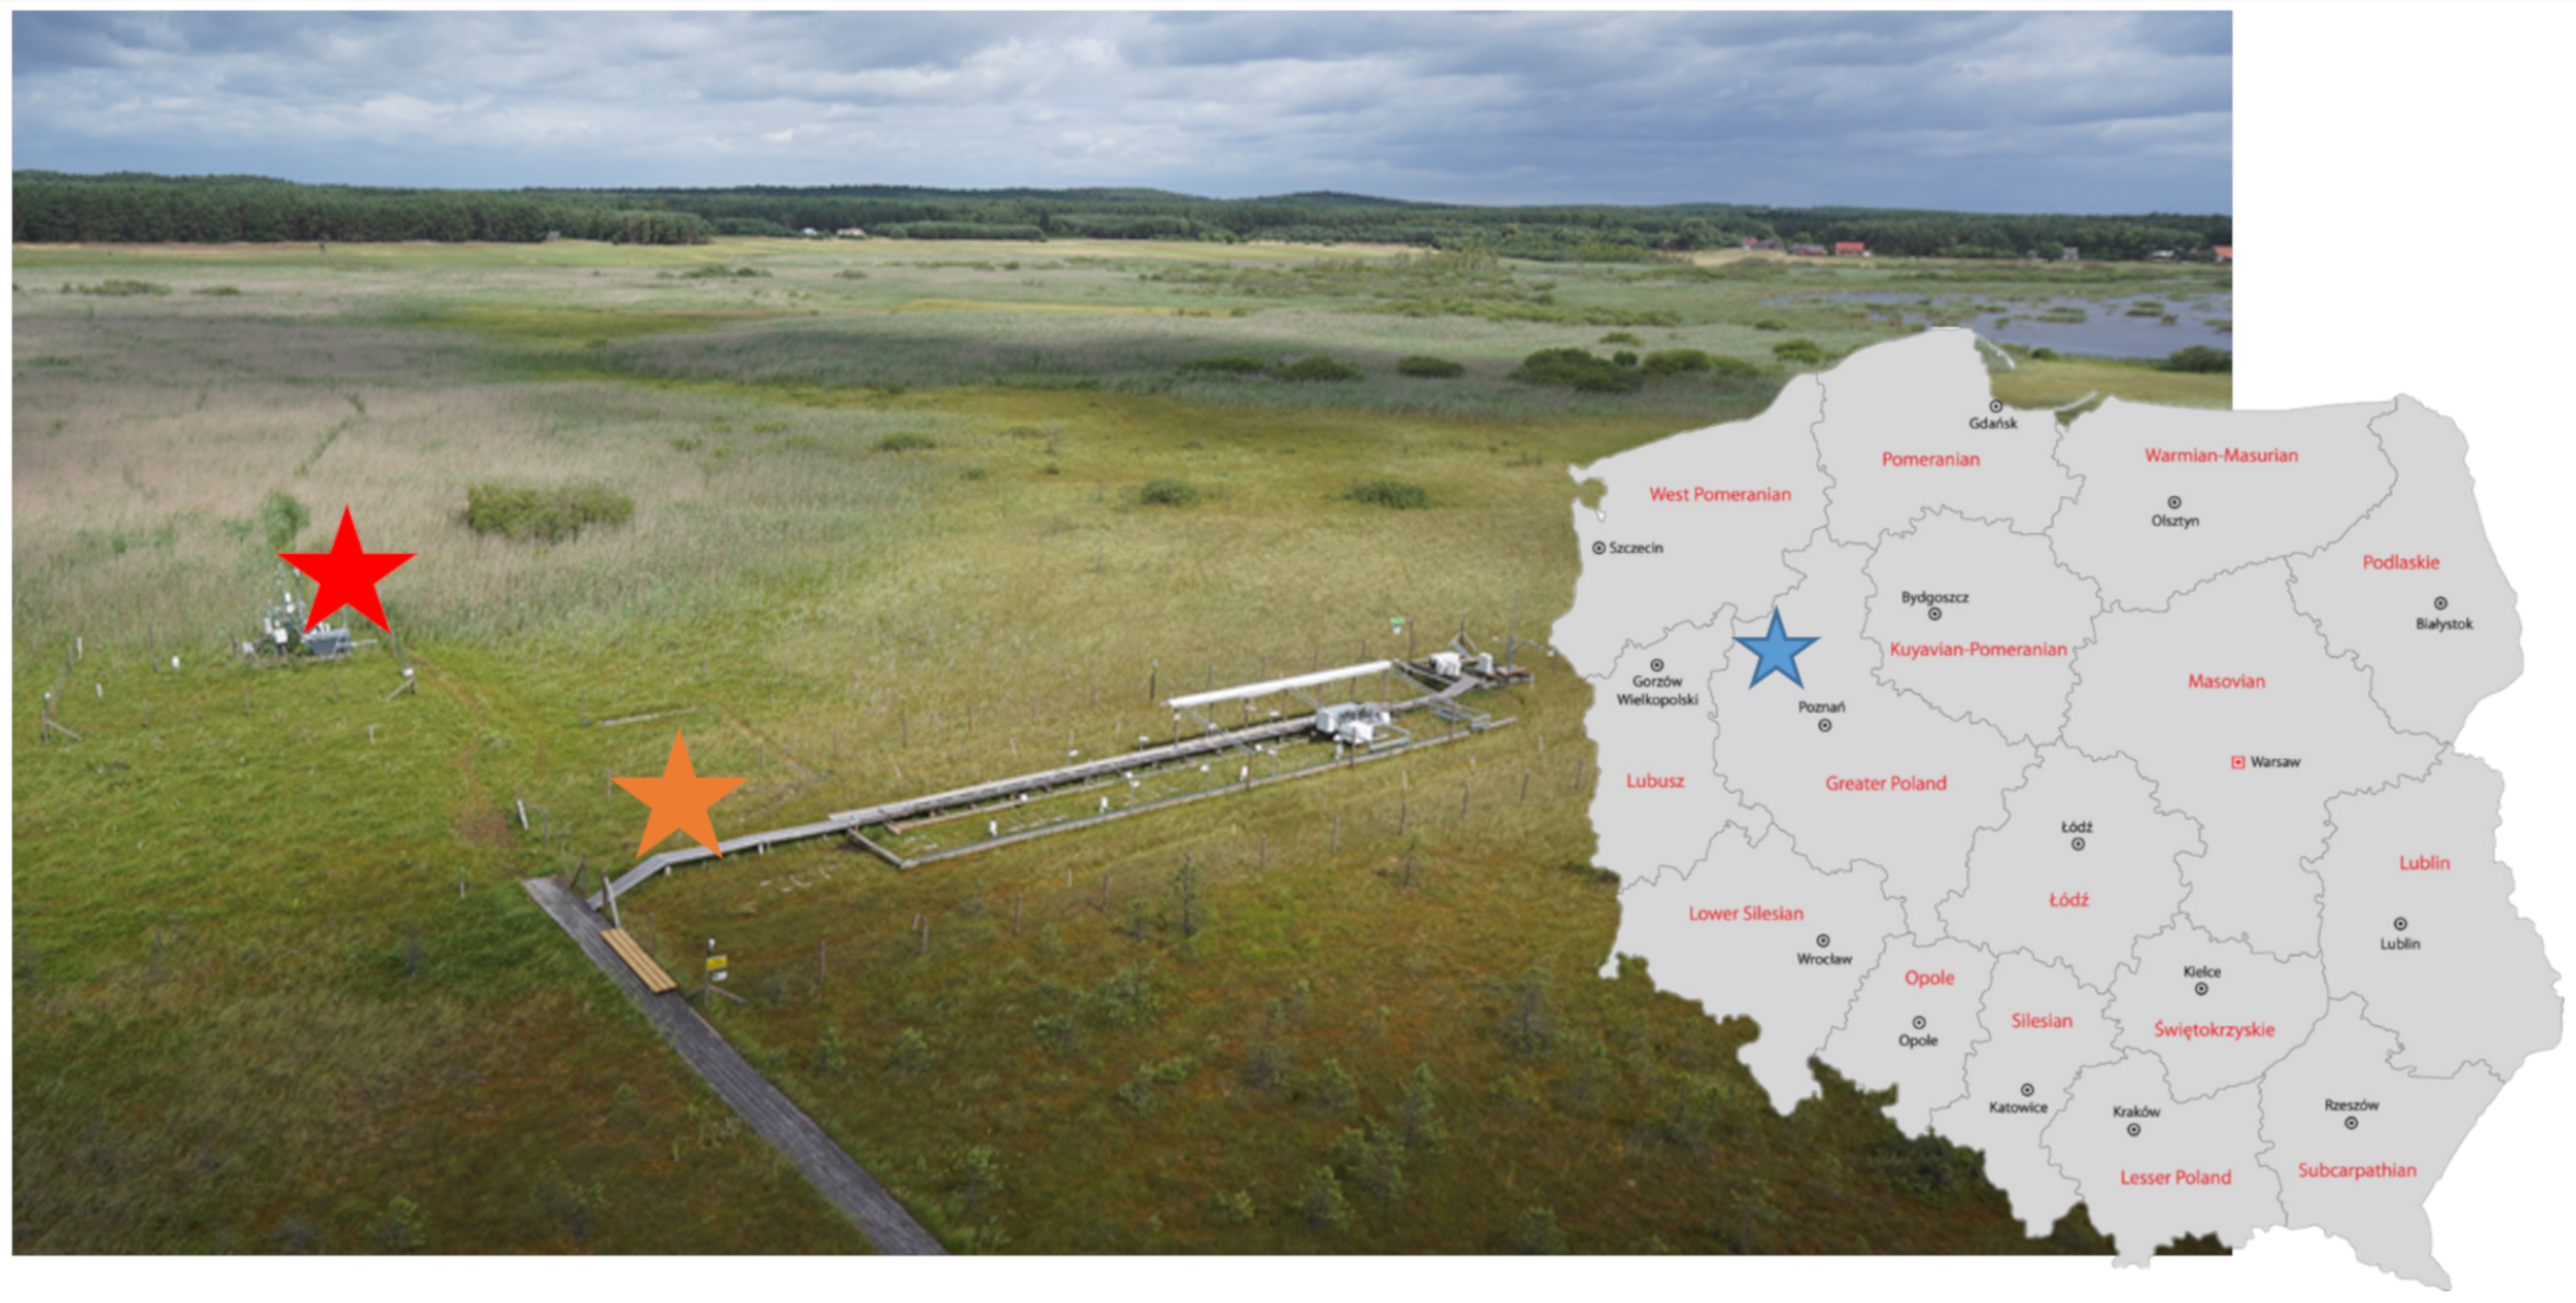
Figure 1. Location of the Rzecin peatland in Poland (blue star); eddy covariance tower (red star); sun radiometer tower (orange star).
Remotesensing 13 02124 g001
Figure 2. The calculation’s chart flow. AOT—aerosol optical thickness, SSA—single scattering albedo, g—asymmetry parameter, Ta—air temperature, It—total PPFD, If—diffuse PPFD, Ir—direct PPFD, NEP—net ecosystem production.
Remotesensing 13 02124 g002
Figure 3. The seasonal run of weekly populations of broad–band normalized difference vegetation index (NDVIb) collected at Rzecin peatland in 2016. The grey rectangle indicates the extracted period (weeks 24–38). Error bars indicate minimum and maximum values, the top of the boxes shows 25th percentile and the bottom 75th percentile, and horizontal line is median value.
Remotesensing 13 02124 g003
Figure 4. Mean diurnal pattern of the net ecosystem production (NEP) vs. total radiation flux density (SWin), during the period from 13 June to 18 September 2016. The mean hours of day (UTC + 1) are shown.
Remotesensing 13 02124 g004
Figure 5. Mean diurnal pattern of air temperature (Ta) (a), vapor pressure deficit (VPD) (b), diffusion index (DI) (c), net ecosystem production (NEP) (d) vs. total radiation flux density (SWin), during the period from 13 June to 18 September 2016. VPD > 20 hPa data was excluded. Whiskers indicate the standard deviation. The mean hours of day (UTC + 1) are shown.
Remotesensing 13 02124 g005
Figure 6. The half-hourly values of modeled (SWmod) vs. measured (SWin) solar irradiance.
Remotesensing 13 02124 g006
Figure 7. Net ecosystem production (NEP) vs. total photosynthetic photon flux density (It) of Rzecin peatland calculated for conditions of June 23rd, 2016 (175th day of year). There were three different values of DI applied: measured DI (asterixis), DI-0.1 (triangles), DI + 0.1 (circles).
Remotesensing 13 02124 g007
Figure 8. Net ecosystem production (NEP) vs. total photosynthetic photon flux density (It) of Rzecin peatland calculated for conditions on June 23rd, 2016 (DOY 175). There were three different values of AOT500 applied: 0.09 (black circle), 0.13 (grey circle), and 0.17 (white circle).
Remotesensing 13 02124 g008
Table 1. Ecosystem Production (EP) model parameters.
ParameterEstimateStandard Error
c111.450 ***2.581
c2−0.011 *0.005
αf0.333 **0.117
αr0.0576 **0.020
βf23.686 ***2.006
βr27.550 ***2.262
*** statistical significance; * p < 0.05; ** p < 0.01; *** p < 0.001.
Table 2. Net ecosystem production (NEP) under different values of diffusion index (DI) and total photosynthetic photon flux density (It).
ItDINEP
(DI − 0.1)
NEP
(DI)
NEP
(DI + 0.1)
ΔNEP
(DI − 0.1) − DI
ΔNEP
(DI + 0.1) − DI
µmol·m−2·s−1[-]µmol·m−2·s−1µmol·m−2·s−1µmol·m−2·s−1%%
1720.560.821.612.29−49.042.3
2940.433.194.215.03−24.219.7
4300.354.926.096.99−19.314.8
5820.306.367.638.56−16.612.2
7480.267.488.859.80−15.410.8
9000.238.179.6310.61−15.210.2
10450.218.8710.3611.32−14.49.3
11760.209.4910.9811.92−13.68.6
13040.189.8311.3812.32−13.68.3
14160.1710.2111.7412.66−13.17.8
15130.1810.6912.1413.00−12.07.1
15940.1711.0112.4313.25−11.46.6
16550.1811.3412.6713.44−10.56.1
16970.1711.3412.7113.50−10.86.2
17190.1611.2612.7013.53−11.46.5
ΔNEP – the NEP relative change.
Table 3. Net ecosystem production (NEP) under different values of aerosol optical thickness at 500nm (AOT500) and total photosynthetic photon flux density (It).
AOT500 = 0.09AOT500 = 0.13AOT500 = 0.17AOT500
(0.09–0.13)
AOT500 (0.13–0.17)AOT500 (0.09–0.17)
ItNEPItNEPItNEPΔNEPΔNEPΔNEP
µmol·m−2·s−1µmol·m−2·s−1µmol·m−2·s−1%%%
74.94−5.4566.51−5.6760.31−5.79−3.9−2.1−5.9
220.390.71204.820.63191.930.60−11.8−5.4−17.8
358.763.46341.053.54325.643.622.22.34.4
507.715.42489.255.59472.735.753.02.75.7
662.257.00643.797.22626.957.423.12.65.6
817.938.17799.858.42783.138.632.92.55.3
968.709.10951.179.35934.819.582.72.35.0
1113.589.871096.6610.131080.7510.352.52.24.6
1247.6410.461231.3110.711215.8810.932.42.04.3
1369.1810.911353.3911.161338.4111.382.21.94.1
1476.5411.241461.2211.491446.6311.702.11.83.9
1566.6411.541551.7111.781537.4511.982.01.73.7
1640.7311.761626.0911.991612.0812.191.91.73.6
1695.8811.901681.4512.131667.6212.331.91.63.5
1730.5812.021716.2712.251702.5512.451.91.63.4
ΔNEP is the NEP relative change.
Publisher’s Note: MDPI stays neutral with regard to jurisdictional claims in published maps and institutional affiliations.