Article

Estimating the Parameters of Wind Turbulence from Spectra of Radial Velocity Measured by a Pulsed Doppler Lidar

by
Viktor A. Banakh
*,
Igor N. Smalikho
,
Andrey V. Falits
and
Artem M. Sherstobitov
V.E. Zuev Institute of Atmospheric Optics SB RAS, 634055 Tomsk, Russia
*
Author to whom correspondence should be addressed.
Remote Sens. 2021, 13(11), 2071; https://doi.org/10.3390/rs13112071
Submission received: 17 April 2021 / Revised: 18 May 2021 / Accepted: 21 May 2021 / Published: 24 May 2021
(This article belongs to the Section Atmospheric Remote Sensing)

Abstract

:
The strategy providing an estimation of both the mean velocity and the temporal and spatial spectra of radial velocity from data of the same pulse coherent Doppler lidar is proposed. Theoretical relations taking into account the averaging over the probing volume while estimating the spectra of fluctuations of the radial velocity measured by lidar are presented. The method of estimation of the turbulent energy dissipation rate and the variance of the vertical component of wind velocity vector from the spectra of radial velocity is carried out. The results of the comparative experiments are discussed and used in further studies of wind turbulence in the atmospheric boundary layer during the formation of low-level jets and propagation of internal gravity waves.

1. Introduction

Turbulence in the stably stratified atmosphere is a subject of study for many decades but still remains poorly understood despite numerous publications. At the stable stratification in the atmospheric boundary layer (ABL), low-level jets (LLJs) and internal gravity waves (IGWs) are formed, and turbulence is characterized by intermittence and not always obeys the Kolmogorov–Obukhov law.
The use of pulsed coherent Doppler lidars (PCDLs) allows obtaining the information about wind, turbulence, and IGWs in the whole ABL; see, for example, [1,2,3,4,5,6,7,8,9,10,11,12,13,14,15,16,17,18]. Different PCDL measurement strategies (geometries) and methods for estimation of wind [9], turbulence [1,2,3,4,5,6,7,8,10,11,13,14,15,18], and IGW parameters [12,16], from raw lidar data have been developed. In particular, the method of azimuthal structure function (ASF) for estimating the turbulence energy dissipation rate ε and the variance σ r 2 = < V r 2 > < V r > 2 of radial velocity V r from PCDL data obtained with conical scanning by a lidar probing beam around the vertical axis was proposed [14,18]. However, during IGWs, this method appears to provide highly overstated values of ε and σ r 2 . The modified ASF method was proposed in [19]. For the first time, it allowed obtaining unbiased estimates of the dissipation rate ε at heights of jets during IGW propagation. However, the following experiments have shown that this modified ASF method does not always give correct results.
In [7], a method was proposed for estimating the kinetic energy dissipation rate from temporal spectra of the vertical component of wind velocity vector measured by a vertically pointing Doppler lidar. This method was applied to examine variations of the dissipation rate in the atmospheric boundary layer [15]. However, when obtaining estimates of ε , the authors of [7,15] ignored the spatial averaging of the radial velocity along the probing beam axis, which can lead to significant underestimation of the dissipation rate.
This article proposes a strategy that allows us to determine both the wind velocity vector and the temporal and spatial (along the mean wind direction) spectra of turbulent fluctuations of the vertical component of the wind velocity vector from the measurement data of the same PCDL. Theoretical relations are presented that allow one, in contrast to [7,15], to take into account averaging over the probing volume when estimating the spectra of the radial velocity measured by the lidar. These relations are used to substantiate the method for estimation of the turbulence energy dissipation rate ε and the variance of the vertical component of wind velocity σ w 2 = σ r 2 from the spectra of the vertical wind velocity. An algorithm for calculating the relative error in estimating the dissipation rate by this method is described. The results of testing the method in atmospheric experiments using the StreamLine PCDL (Halo Photonics, Brockamin, Worcester, UK) [20] are presented. The results of the approbation of the method in studies of wind turbulence in the boundary layer of the atmosphere during the LLJ and IGW are discussed in this paper as well.
To address these questions, the paper is organized as follows. The measurement strategy and methods to estimate the mean wind velocity and spectra of radial velocity are described in Section 2. The theory of the estimation of the parameters of wind turbulence from the spectra of radial velocity is detailed in Section 3. An overview and the results of the comparison experiment are given in Section 4. The results of studies of wind turbulence in the atmospheric boundary layer during LLJ and IGW are discussed within Section 5. A summary and the conclusions are provided in Section 6. The technique of averaging the radial velocity over the probing volume is detailed in Appendix A. Algorithm for calculating the relative error in estimating the dissipation rate from spectra of radial velocity is described in Appendix B.

2. Measurement Strategy and Methodology to Estimate the Mean Wind Velocity Vector and Spectra of Vertical Velocity

To determine the wind velocity vector (time averaged) and the spectra of turbulent fluctuations of the vertical velocity from the data of a single scanning lidar, the following measurement strategy was used. First, one full scan around the vertical axis under an elevation angle φ = 60° during the time T scan = 1 min is performed (see Figure 1 of [18] illustrating scan geometry). Then, the beam is pointed vertically (elevation angle φ = 90°), and during the time T vert , the vertical probing is conducted. Then, the elevation angle is changed from 90° to 60°, and the procedure is repeated. The duration of one measurement cycle is T c = T scan + δ t + T vert + δ t , where δ t 10 s is the time needed to change the elevation angle φ . In the experiment, the time of vertical probing was T vert = 500 s. The time for measurement of the radial velocity Δ t is determined by the number of accumulated echo signals N a , which is set equal to 7500. Assuming a pulse repetition rate of StreamLine PCDL f p equal to 15 kHz (the main parameters of the StreamLine lidar are given in Table 1 of [12]), then Δ t = N a / f p = 0.5 s. Correspondingly, the number of measurements of the radial velocity was M 1 = T vert / Δ t = 1000 per time T vert , and M s = T scan / Δ t = 120 per one scan.
As a result, we obtained two arrays of estimates of the signal-to-noise ratio SNR ( m Δ t ; R k , φ scan , n ) and the radial velocity V L ( m Δ t ; R k , φ scan , n ) from measurements at the conical scanning and estimates of SNR ( m Δ t ; R k , φ vert , n ) and V L ( m Δ t ; R k , φ vert , n ) from measurements in the vertical direction. Here, m = 0 , 1 , 2 , , M s 1 ; m = 0 , 1 , 2 , , M 1 1 ; R k = R 0 + k Δ R is the distance from the lidar to the center of the probing volume; k = 0 , 1 , 2 , , K 1 ; Δ R is the range gate length; and n = 1 , 2 , 3 , is the number of cycles of duration T c . The azimuth resolution Δ θ = 360 ° / M s = 3°.
The sine-wave fitting method [9] was applied to find the horizontal wind velocity U 1 ( h k , n ) , wind direction angle θ V ( h k , n ) , and the velocity of vertical wind component V z ( h k , n ) averaged over the circle of the scanning cone base at the height h k = R k sin φ scan and over the time T scan from the V L ( m Δ t ; R k , φ scan , n ) arrays. The V L ( m Δ t ; R k , φ vert , n ) arrays were used to determine the vertical component of the wind velocity vector w and to estimate the temporal S ^ L ( f l ) and spatial S ˜ L ( κ l ) spectra of the vertical velocity, where f l and κ l = f l / U are the frequencies and wavenumbers [21], respectively, and U is the mean horizontal velocity at the height of spectra measurements.
To obtain estimates of wind turbulence parameters, data measured for half an hour are usually used [14,22]. At T vert = 500 s, the cycle duration is T c ≈ 10 min. Therefore, to estimate the spectral density of the vertical velocity measured by the lidar S ^ L ( f l ) , the data of three consecutive measurement cycles were used. Correspondingly, the mean velocity was estimated from four values of U 1 as U ( h k , n ) = ( 1 / 4 ) i = 0 3 U 1 ( h k , n 1 + i ) . The spectra S ^ L ( f l ) are estimated from the arrays of the radial velocity V L ( m Δ t ; R k , φ vert , n ) at heights h k = R k sin φ vert = R k , which differ from the heights of estimation of the mean velocity h k = R k sin φ scan . To find the mean velocity at the height of spectra estimation, the linear interpolation method was used.
Experimental temporal spectra of the radial (vertical) velocity S ^ L ( f l ) were calculated as
S ^ L ( f l ) = 1 3 i = 0 2 Δ t M 1 | m = 0 M 1 1 V L ( m Δ t ; R k , φ vert , n 1 + i ) exp ( 2 π j l m M 1 ) | 2
where f l = l Δ f ; l = 1 , 2 , 3 , , M 1 / 2 is the number of the spectral channel; Δ f = ( M 1 Δ t ) 1 = 0.002 Hz is the width of the spectral channel; 0.002 Hz f l 1 Hz, and j = 1 is the imaginary unit. Summation of spectral components over all the frequencies gives the estimate of the variance of radial velocity
σ ^ L 2 = 2 Δ f l = 1 M 1 / 2 S ^ L ( f l ) .
The Taylor hypothesis of frozen turbulence [21] allows us to pass from the temporal S ^ L ( f l ) to spatial S ˜ L ( κ l ) = U   S ^ L ( U κ l ) spectra, where κ l = l Δ κ , Δ κ = Δ f / U . Whence we find S ^ L ( f l ) = U 1 S ˜ L ( f l / U ) and σ ^ L 2 = 2 Δ κ l = 1 M 1 / 2 S ˜ L ( κ l ) .

3. Estimation of Wind Turbulence Parameters

To estimate parameters of wind turbulence from the spectra of radial velocity (Equation (1)), the theoretical expression is needed for the spectrum S L ( f l ) = < S ^ L ( f l ) > with allowance made for the averaging over the probing volume and the instrumental error of measurement of the radial velocity. According to [4,9], the unbiased lidar estimate of the radial velocity V L ( m Δ t ) can be represented as
V L ( m Δ t ) = V a ( m Δ t ) + V e ( m Δ t )
where
V a ( m Δ t ) = 1 Δ t Δ t / 2 Δ t / 2 d t + d z Q s ( z ) V r ( R k + z , ( m Δ t + t ) U )
is the radial velocity averaged over the probing volume with the longitudinal Δ z and the transverse Δ y = U Δ t sizes correspondingly; Q s ( z ) is the filtering (averaging) function; V r ( z , y ) is the radial velocity at the point with coordinates { z , y } ; V e ( m Δ t ) is the random instrumental error (caused mostly by the noise component of the Doppler spectrum), which is characterized by the following statistical properties: < V e > = < V a   V e > = 0 and < V e ( m Δ t ) V e ( m Δ t ) > = σ e 2 δ m m   σ e 2 = < V e 2 > .
Upon substitution of Equation (3) into Equation (1) and ensemble averaging with allowance made for the statistics of the instrumental error, for the theoretical spectrum, S L ( f l ) = < S ^ L ( f l ) > we obtain
S L ( f l ) = S a ( f l ) + S N
where
S a ( f l ) = Δ t M 1 < | m = 0 M 1 1 V a ( m Δ t ) exp ( 2 π j l m M 1 ) | 2 > ,
is the component of the spectrum depending on the wind turbulence, and
S N = Δ t σ e 2 ,
is the noise component (white noise) caused by the instrumental error of estimation of the radial velocity ( σ e 0 ).
On the assumption of isotropic turbulence with the integral scale L V , for S a ( f l ) at frequencies f l U / ( 2 L V ) corresponding to the inertial subrange, from Equations (4) and (6) we obtain
S a ( f l ) = + d κ z + d κ y S r ( κ z , κ y ) H ( κ z ) H ( κ y ) P ( f l U κ y ) ,
where
S r ( κ z , κ y ) = 0 , 0163   ε 2 / 3 ( κ z 2 + κ y 2 ) 4 / 3 [ 1 + 8 3 κ y 2 κ z 2 + κ y 2 ] ,
is the two-dimensional spatial spectrum of the radial velocity in the inertial range of turbulence (Kolmogorov–Obukhov spectrum) [23],
H ( κ z ) = | + d z Q s ( z ) exp ( 2 π j κ z z ) | 2 ,
is the spatial low pass filter transfer (averaging) function in longitudinal (vertical) direction,
H ( κ y ) = [ sin c ( π U Δ t κ y ) ] 2 ,
is the spatial low pass filter transfer (averaging) function in transverse (horizontal) direction, sin c ( x ) = sin ( x ) / x , and
P ( f l U κ y ) = Δ t M 1 1 cos [ 2 π Δ t ( f l U κ y ) M 1 ] 1 cos [ 2 π Δ t ( f l U κ y ) ] .
The known expression for H ( κ z ) is found in [9] for the case of estimating the radial velocity from the centroid of the Doppler spectrum. This method of estimation of the radial velocity requires high levels of SNR. In the StreamLine PCDL, the signal-to-noise ratio in the 50 MHz frequency bandwidth of the receiver usually does not exceed −10 dB because of the low laser pulse energy (14 μ J , see Table 1 in [12]). For this reason, the radial velocity in the StreamLine PCDL is estimated from the maximum rather than from the centroid of the Doppler spectrum. The expression for H ( κ z ) corresponding to the estimation of the radial velocity from the maximum of the Doppler spectrum is unknown. That is why we used the known Formula (A13) for H ( κ z ) from [9], which is given in Appendix A where the validity of such a substitution is discussed.
In addition to low-pass filtering, Equation (8) takes into account the aliasing effect, which is observed in the experiments when the spectrum is nonzero at frequencies higher than the Nyquist frequency f N = ( 2 Δ t ) 1 [24]. If the aliasing effect is neglected, the function P ( f l U κ y ) can be represented as
P ( f l U κ y ) = U 1 δ ( κ y f l / U ) ,
where δ ( x ) is the delta function. Upon the substitution of Equation (13) into Equation (8), we obtain the approximate equation for the spectrum with the neglected aliasing effect
S a ( 1 ) ( f l ) = 0 , 0326   ( ε U ) 2 / 3 f l 5 / 3 0 d ξ ( 1 + ξ 2 ) 4 / 3 [ 1 + ( 8 / 3 ) / ( 1 + ξ 2 ) ] H ( f l ξ / U ) [ sin c ( π Δ t f l ) ] 2 .
The aliasing effect may be taken into account using the following formula [24]:
S a ( f l ) = S a ( 1 ) ( f l ) + n = 1 N [ S a ( 1 ) ( 2 n f N f l ) + S a ( 1 ) ( 2 n f N + f l ) ] .
The calculations of S a ( f l ) by Equations (8), (9) and (12), and by Equations (14) and (15) demonstrate that already at N = 1 , the results coincide almost completely.

3.1. Impact of the Averaging and the Aliasing Effect on the Spectrum S a ( f l )

From Equations (8)–(12), it follows that the spectrum S a ( f l ) is a function of the dissipation rate of the turbulent kinetic energy ε , the mean wind velocity U , and the frequency f l , where ε is the sought parameter. S a ( f l ) is directly proportional to ε 2 / 3 . It allows us to introduce the fitting function of the two parameters: the frequency f l and the mean wind velocity U , as
G ( f l ) = S a ( f l ) / ε 2 / 3 .
Let us introduce as well the fitting function neglecting the aliasing effect
G 1 ( f l ) = S a ( 1 ) ( f l ) / ε 2 / 3 .
Based on Equation (A11), we obtain the fitting function neglecting both the averaging of the radial velocity over the probing volume and the aliasing effect
G K ( f l ) = 0.0974   U 2 / 3 f l 5 / 3 .
Equations (8)–(18) are valid in the inertial subrange of turbulence for the frequencies f l U / ( 2 L V ) . Let U = 10 m/s and L V = 100 m. Then, f l 0.05 Hz. Consider the functions G ( f l ) , G 1 ( f l ) , and G K ( f l ) within the frequency range 0.05 Hz f l 1 Hz.
Figure 1 exemplifies the fitting functions G K ( f l ) , G 1 ( f l ) , and G ( f l ) calculated by Equations (14)–(18) at different values of the mean wind velocity U . One can infer that the aliasing effect manifests itself mostly in the range 0.8–1 Hz (compare the red and green curves), where the decisive contribution to the spectrum S L ( f l ) measured by the lidar is often due to the noise component of the spectrum S N . Nevertheless, at the strong wind (and turbulence) and low level of noise ( S N < S a ( f l ) ), the consideration of the aliasing effect can be important in the range from 0.8 to 1 Hz for the correct determination of the instrumental error of estimation of the radial velocity σ e . It follows from Figure 1c,d that at wind velocities U exceeding 10 m/s, the difference between G K ( f l ) and G ( f l ) is small within the frequency range 0.05 Hz f l 0.2 Hz. If the dissipation rate ε is determined from the spectrum S L ( f l ) in this frequency range, then the use of G K ( f l ) , as in [7], may provide quite an acceptable result at strong wind.
Using the equation η = ( l G K ( f l ) / l G ( f l ) ) 3 / 2 , where the summation is performed over frequencies from 0.05 to 0.2 Hz, we calculate how many times the dissipation rate is underestimated when the effect of averaging the radial velocity over the probing volume is neglected. The results are given in Table 1.
As follows from Table 1, the estimates of the dissipation rate with the neglected averaging of the radial velocity over the probing volume at weak wind ( U = 1 m/s) turn out to be underestimated 14 times. With an increase in the mean wind velocity, the bias of estimate of the dissipation rate decreases. However, even at U = 10 m/s, it remains significant.

3.2. Estimation of the Dissipation Rate and the Variance of the Radial Velocity

According to [25], the dissipation rate ε can be found from the estimate of the spectrum of radial velocity S ^ L ( f l ) (Equation (1)) by the maximum likelihood method maximizing the function
Φ ( ε , S N ) = C 0 3 l = l 3 M 1 / 2 [ ln ( ε 2 / 3 G ( f l ) + S N ) + S ^ L ( f l ) ε 2 / 3 G ( f l ) + S N ] ,
where C 0 is a constant independent of ε and S N , Δ f   l 3 , = 0.05 Hz, l 3 = 25, and the theoretical spectrum, given by Equation (5), is represented using the fitting function (16). To find the dissipation rate ε and the instrumental error σ e = S N / Δ t (Equation (7)) based on Equation (19), the following iterative procedure is used. Assuming that in the frequency range from Δ f   l 1 = 0.8 Hz ( l 1 = 400) to Δ f   M 1 / 2 = 1 Hz ( M 1 / 2 = 500), the noise component dominates in the spectrum S ^ L ( f l ) , we find the estimate S N as
S ^ N ( 1 ) = 1 M 1 / 2 l 1 + 1 l = l 1 M 1 / 2 S ^ L ( f l ) .
Then, we obtain the estimate of the dissipation rate from the difference S ^ L ( f l ) S ^ N ( 1 ) in the frequency range from Δ f   l 3 = 0.05 Hz to Δ f   l 2 = 0.2 Hz ( l 2 = 100):
ε ^ ( 1 ) = [ 1 l 2 l 3 + 1 l = l 3 l 2 S ^ L ( f l ) S ^ N ( 1 ) G ( f l ) ] 3 / 2 .
At the second iteration, S N is estimated by the formula
S ^ N ( 2 ) = 1 M 1 / 2 l 1 + 1 l = l 1 M 1 / 2 [ S ^ L ( f l ) μ G ( f l ) ] ,
where μ = ( ε ^ ( 1 ) ) 2 / 3 . Having substituted S ^ N ( 2 ) into Equation (21) in place of S ^ N ( 1 ) , we find the estimate of the dissipation rate at the second iteration as
ε ^ ( 2 ) = [ 1 l 2 l 3 + 1 l = l 3 l 2 S ^ L ( f l ) S ^ N ( 2 ) G ( f l ) ] 3 / 2 .
Experience shows that one to two iterations are quite sufficient; subsequent iterations change the ε ^ value insignificantly, not more than by 3%. The error of such an estimation of the turbulence energy dissipation rate is calculated based on the algorithm presented in Appendix B.
With allowance for Equations (3)–(18), the obtained estimates of the variance σ ^ L 2 given by Equation (2), the dissipation rate ε ^ , and the noise component of the spectrum S ^ N allow us to estimate the variance of radial velocity σ ^ r 2 as
σ ^ r 2 = σ ^ L 2 S ^ N / Δ t + ε ^ 2 / 3 2 Δ f l = 1 M 1 / 2 [ G K ( f l ) G 1 ( f l ) ] .
At vertical probing, the estimate of the variance of radial velocity is the estimate of the variance of the vertical component of the wind velocity vector σ w 2 = < w 2 > < w > 2 . In contrast to the results obtained by other authors, Equation (24) takes into account the effect of averaging of the radial velocity over the probing volume on the estimate σ w 2 (third term). With the obtained estimates ε ^ and σ ^ r 2 , it is possible to calculate the integral scale of turbulence L V ( L w at vertical probing) by Equation (A12).

4. Testing the Method for Estimation of Wind Turbulence Parameters from Lidar Measurements of Vertical Velocity Spectra

Experiments on proving the method for estimation of wind turbulence parameters from lidar measurements of vertical velocity spectra were conducted from 28 June to 11 July 2020 at the territory of the Basic Experimental Observatory (BEO) of the Institute of Atmospheric Optics SB RAS in Tomsk, Russia (56°06′51″N, 85°06′03″E). The experiments involved along with the StreamLine PCDL (Halo Photonics, Brockamin, Worcester, UK), the AMK-03 sonic anemometers (Sibanalitpribor, Tomsk, Russia) installed at heights of 3, 10, and 42 m, and the MTP-5 temperature profiler (Atmospheric Technology, Dolgoprudny, Moscow, Russia). Data from the sonic anemometers were used to obtain wind and turbulence parameters in the bottom of the surface layer, while the temperature profiling data were used to determine the ABL stratification.
Lidar measurements were conducted according to the strategy described in Section 2 with the range gate length Δ R = 18 m. The processing of lidar data by the methodology described in Section 2 and Section 3, as well as Appendix A and Appendix B, yielded the height–temporal distributions of the mean wind velocity U ( h k , t n ) , direction angle of the mean wind θ V ( h k , t n ) , turbulent energy dissipation rate ε ( h k , t n ) , the variance of the vertical component of the wind velocity vector σ w 2 ( h k , t n ) , relative error of lidar estimation of the dissipation rate E ε ( h k , t n ) , signal-to-noise ratio S N ¯ R ( h k , t n ) , and instrumental error of estimation of the radial velocity σ e ( h k , t n ) , where the height h k = h 0 + k Δ h ; h 0 = 99 m; k = 0 , 1 , 2 , K 1 ; K = 29; Δ h = 18 m; h K 1 = 603 m, and time t n = t 0 + n T c ( T c 10 min at T vert = 500 s). The height–temporal distributions of the signal-to-noise ratio S N ¯ R ( h k , t n ) are the results of 30 min averaging of SNR ( m Δ t ; R k , φ vert , n ) arrays by the formula
S N ¯ R ( h k , t n ) = 1 3 n = 0 2 1 M 1 m = 0 M 1 1 SNR ( m Δ t ; R k , φ vert , n 1 + n ) .
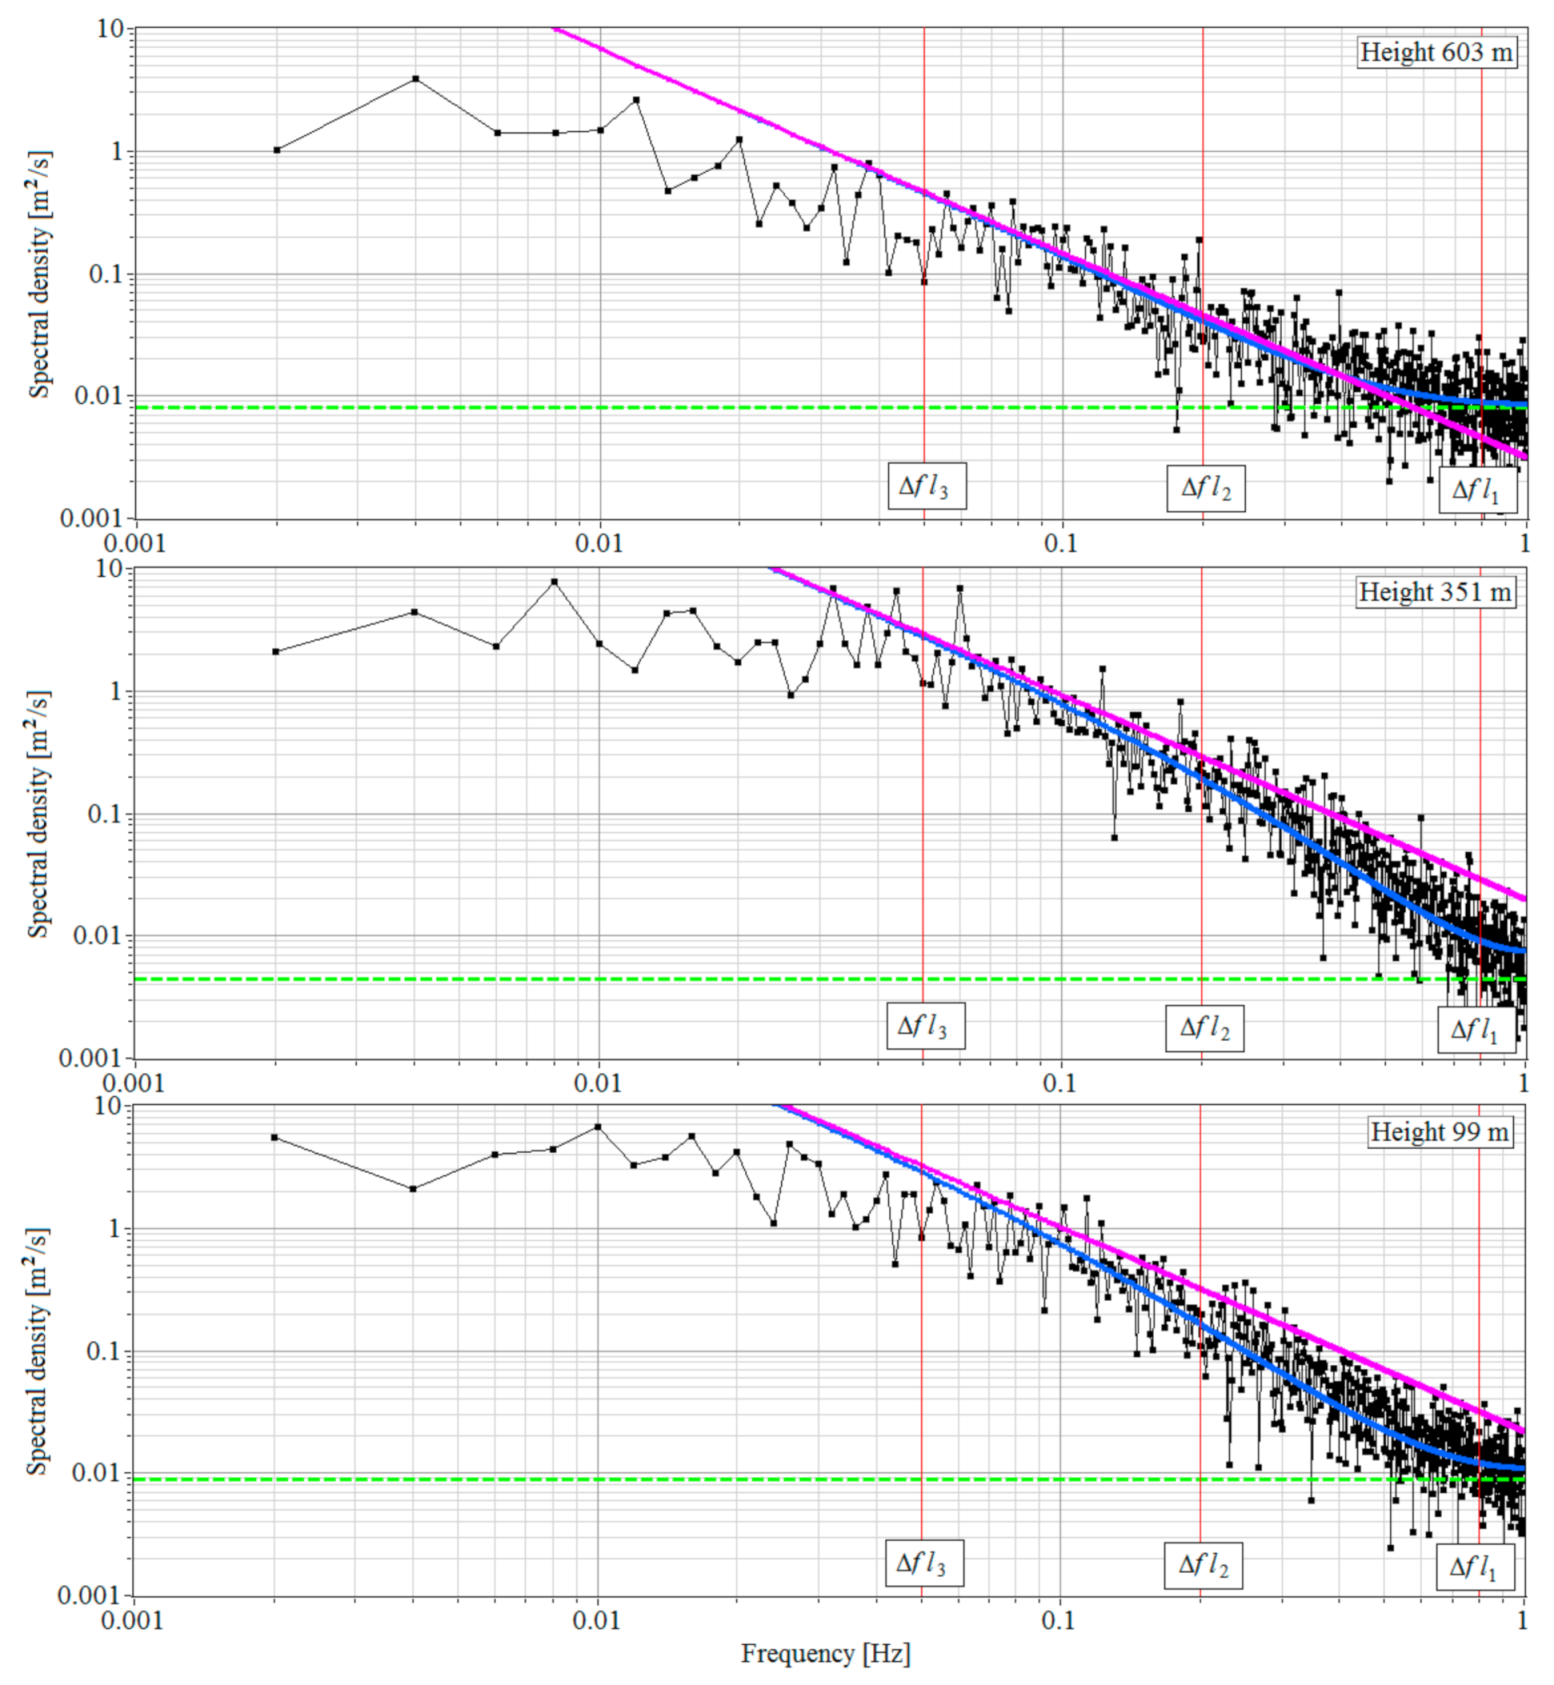
As an example, Figure 2 shows the temporal spectra of the radial velocity at different heights as obtained on 28 June 2020 when vertically upward probing. The vertical red lines show the frequency ranges, within which the noise spectral component S N at the first iteration (0.8 Hz f l 1 Hz) and the dissipation rate ε (0.05 Hz f l 0.2 Hz) are determined. Using the data on the mean wind velocity U in Figure 3, we can pass from the temporal spectra S ^ L ( f l ) to the spatial ones S ˜ L ( κ l ) = U   S ^ L ( U κ l ) .
Along with the experimental spectra, Figure 2 depicts spectra S L ( f l ) calculated by Equations (5), (14) and (15), and S K ( f l ) = ε 2 / 3 G K ( f l ) calculated by Equation (18) for the Kolmogorov–Obukhov turbulence spectrum with the use of experimental estimates of the noise spectral component S N , mean wind velocity U , and dissipation rate ε . The values of these parameters at the heights of determination of the experimental spectra can be found from the vertical profiles of U , ε , and σ e ( S N = Δ t σ e 2 ) in Figure 3. One can infer from Figure 2 that due to the spatial averaging, the experimental spectra in the frequency range 0.05 Hz f l 0.8 Hz have a smaller amplitude than the “−5/3” Kolmogorov–Obukhov spectra S K ( f l ) . The calculated spectra S L ( f l ) with allowance made for the spatial averaging over the probing volume well describe the experimental spectra.
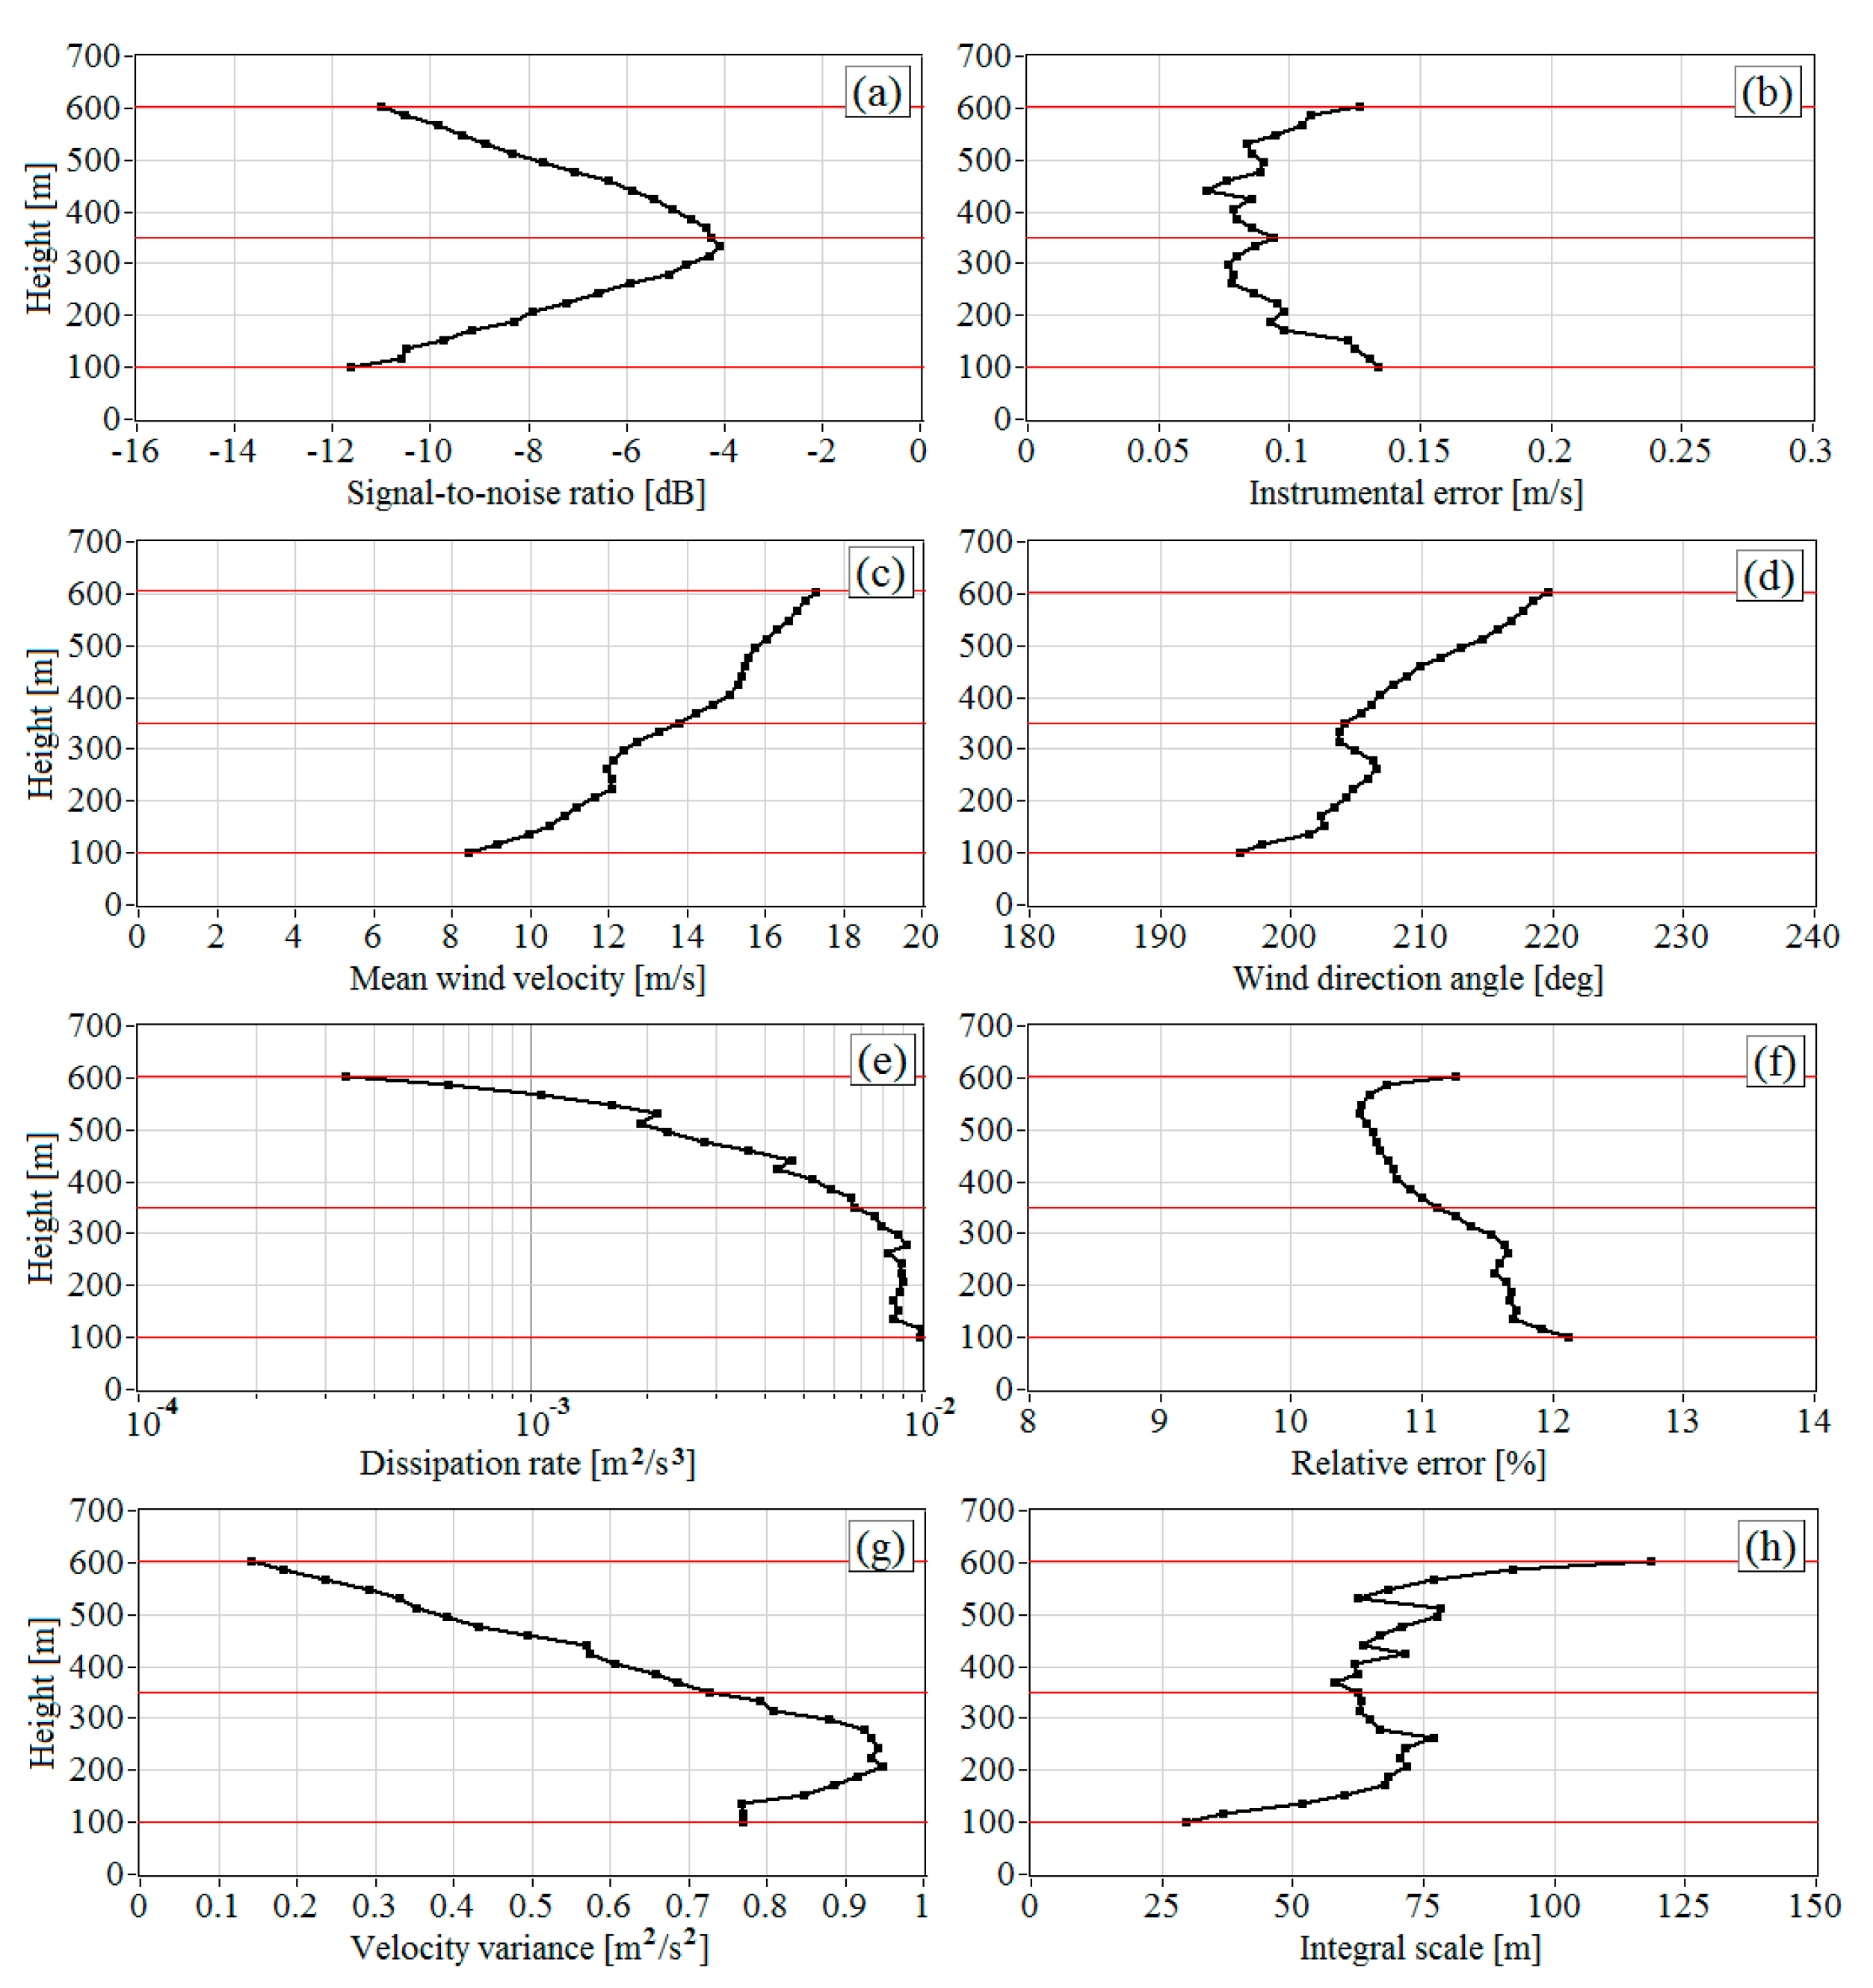
Figure 3 shows the vertical profiles of the signal-to-noise ratio S N ¯ R , instrumental error σ e , the mean velocity U , and direction angle θ V of the wind, the turbulent energy dissipation rate ε , the relative error of estimation of the dissipation rate E ε , the variance σ w 2 , and the longitudinal integral correlation scale L V of the vertical component of wind velocity vector as calculated from data of lidar measurements on 28 June 2020 from 08:42 to 09:12 LT. Red lines mark the heights for the spectra in Figure 2.
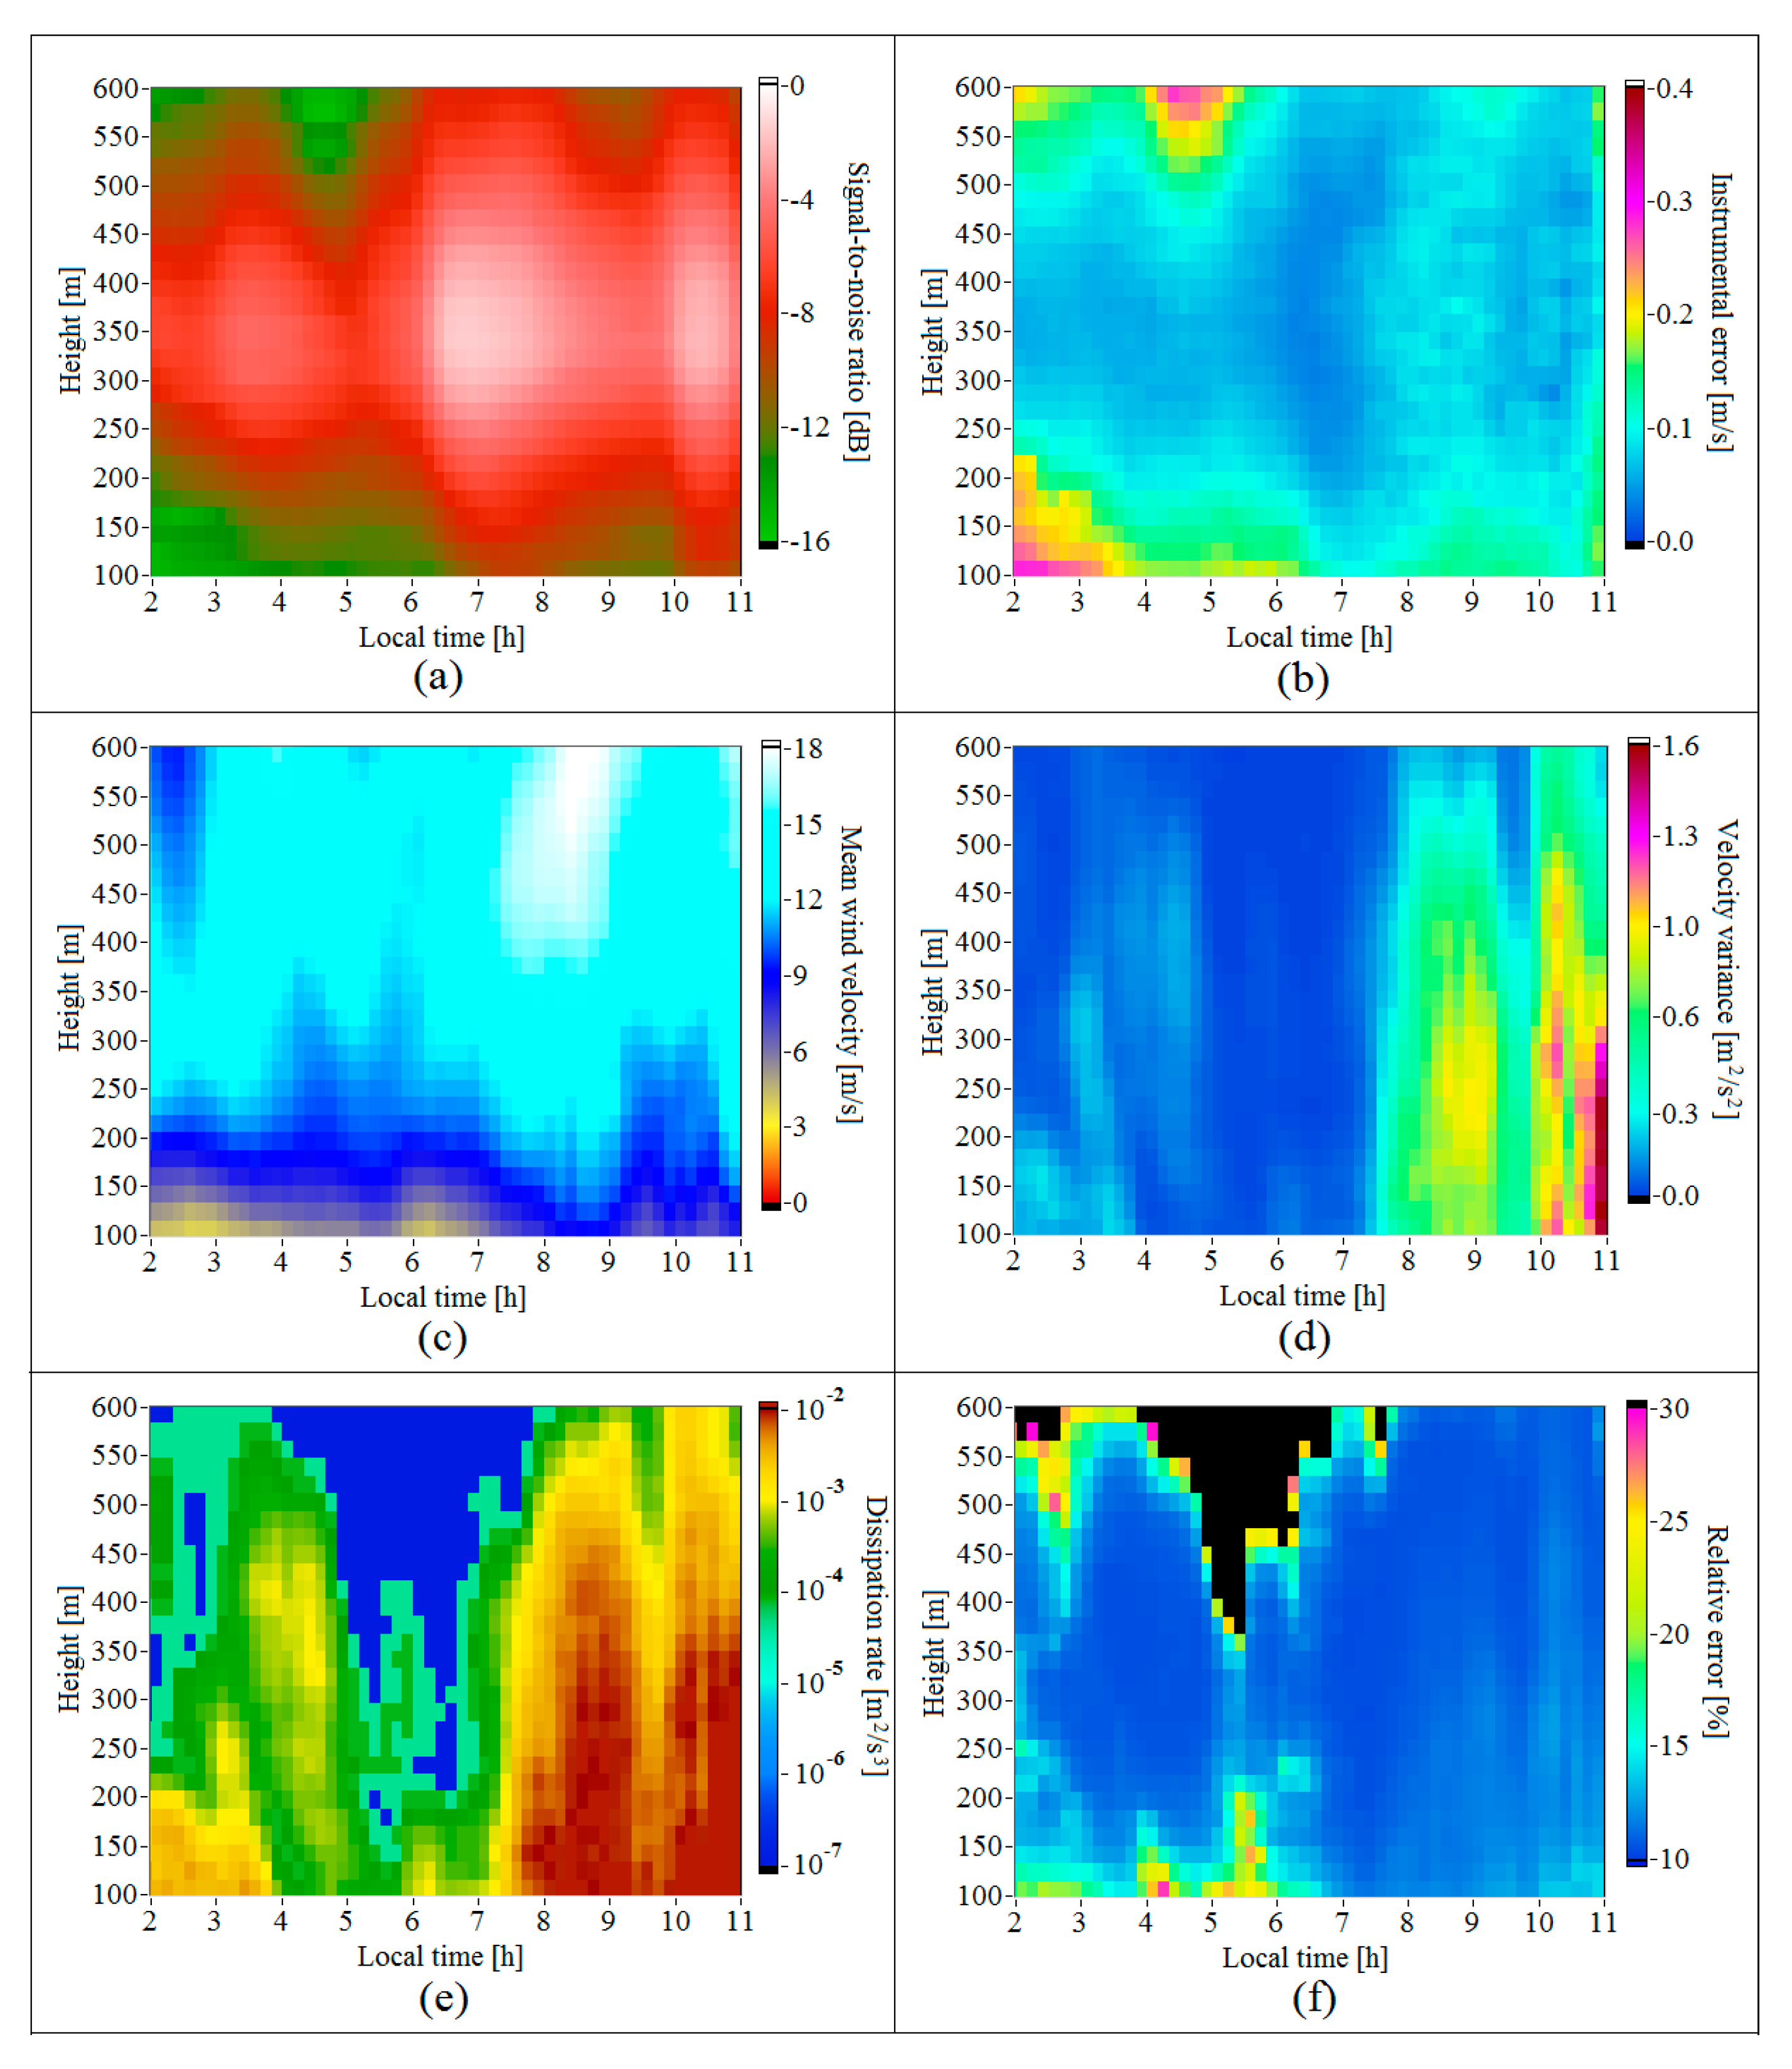
Figure 4 depicts the 2D distributions of the S N ¯ R ( h k , t n ) , σ e ( h k , t n ) , U ( h k , t n ) , σ w 2 ( h k , t n ) , ε ( h k , t n ) , and E ε ( h k , t n ) in height and time for the period from 02:00 to 11:00 LT on 28 June 2020. It can be seen from Figure 4e that on this night, despite the stable stratification, the turbulence was not extremely weak. The height of the turbulent mixing layer h mix determined from the condition ε ( h mix ) > 10−4 m2/s3 [26,27] exceeded 500 m from 03:00 to 05:00 and dropped below 150 m only in the short period from 05:30 to 06:00.
In Figure 4f, the zones where the relative error of lidar estimation of the dissipation rate E ε ( h k , t n ) exceeded 30% are colored in black. For only a small part of the dissipation rate estimates with such a high error, the instrumental error (Figure 4b) was also high. For the most part of the black zone in Figure 4f, the instrumental error ranged within 0.15 m/s > σ e ( h k , t n ) > 0.05 m/s. The main reason for estimating the dissipation rate with the error higher than 30% is extremely weak turbulence at this time, ε < < 10−6 m2/s3 (see Figure 4e).

Comparison with the Method of the Azimuthal Structure Function

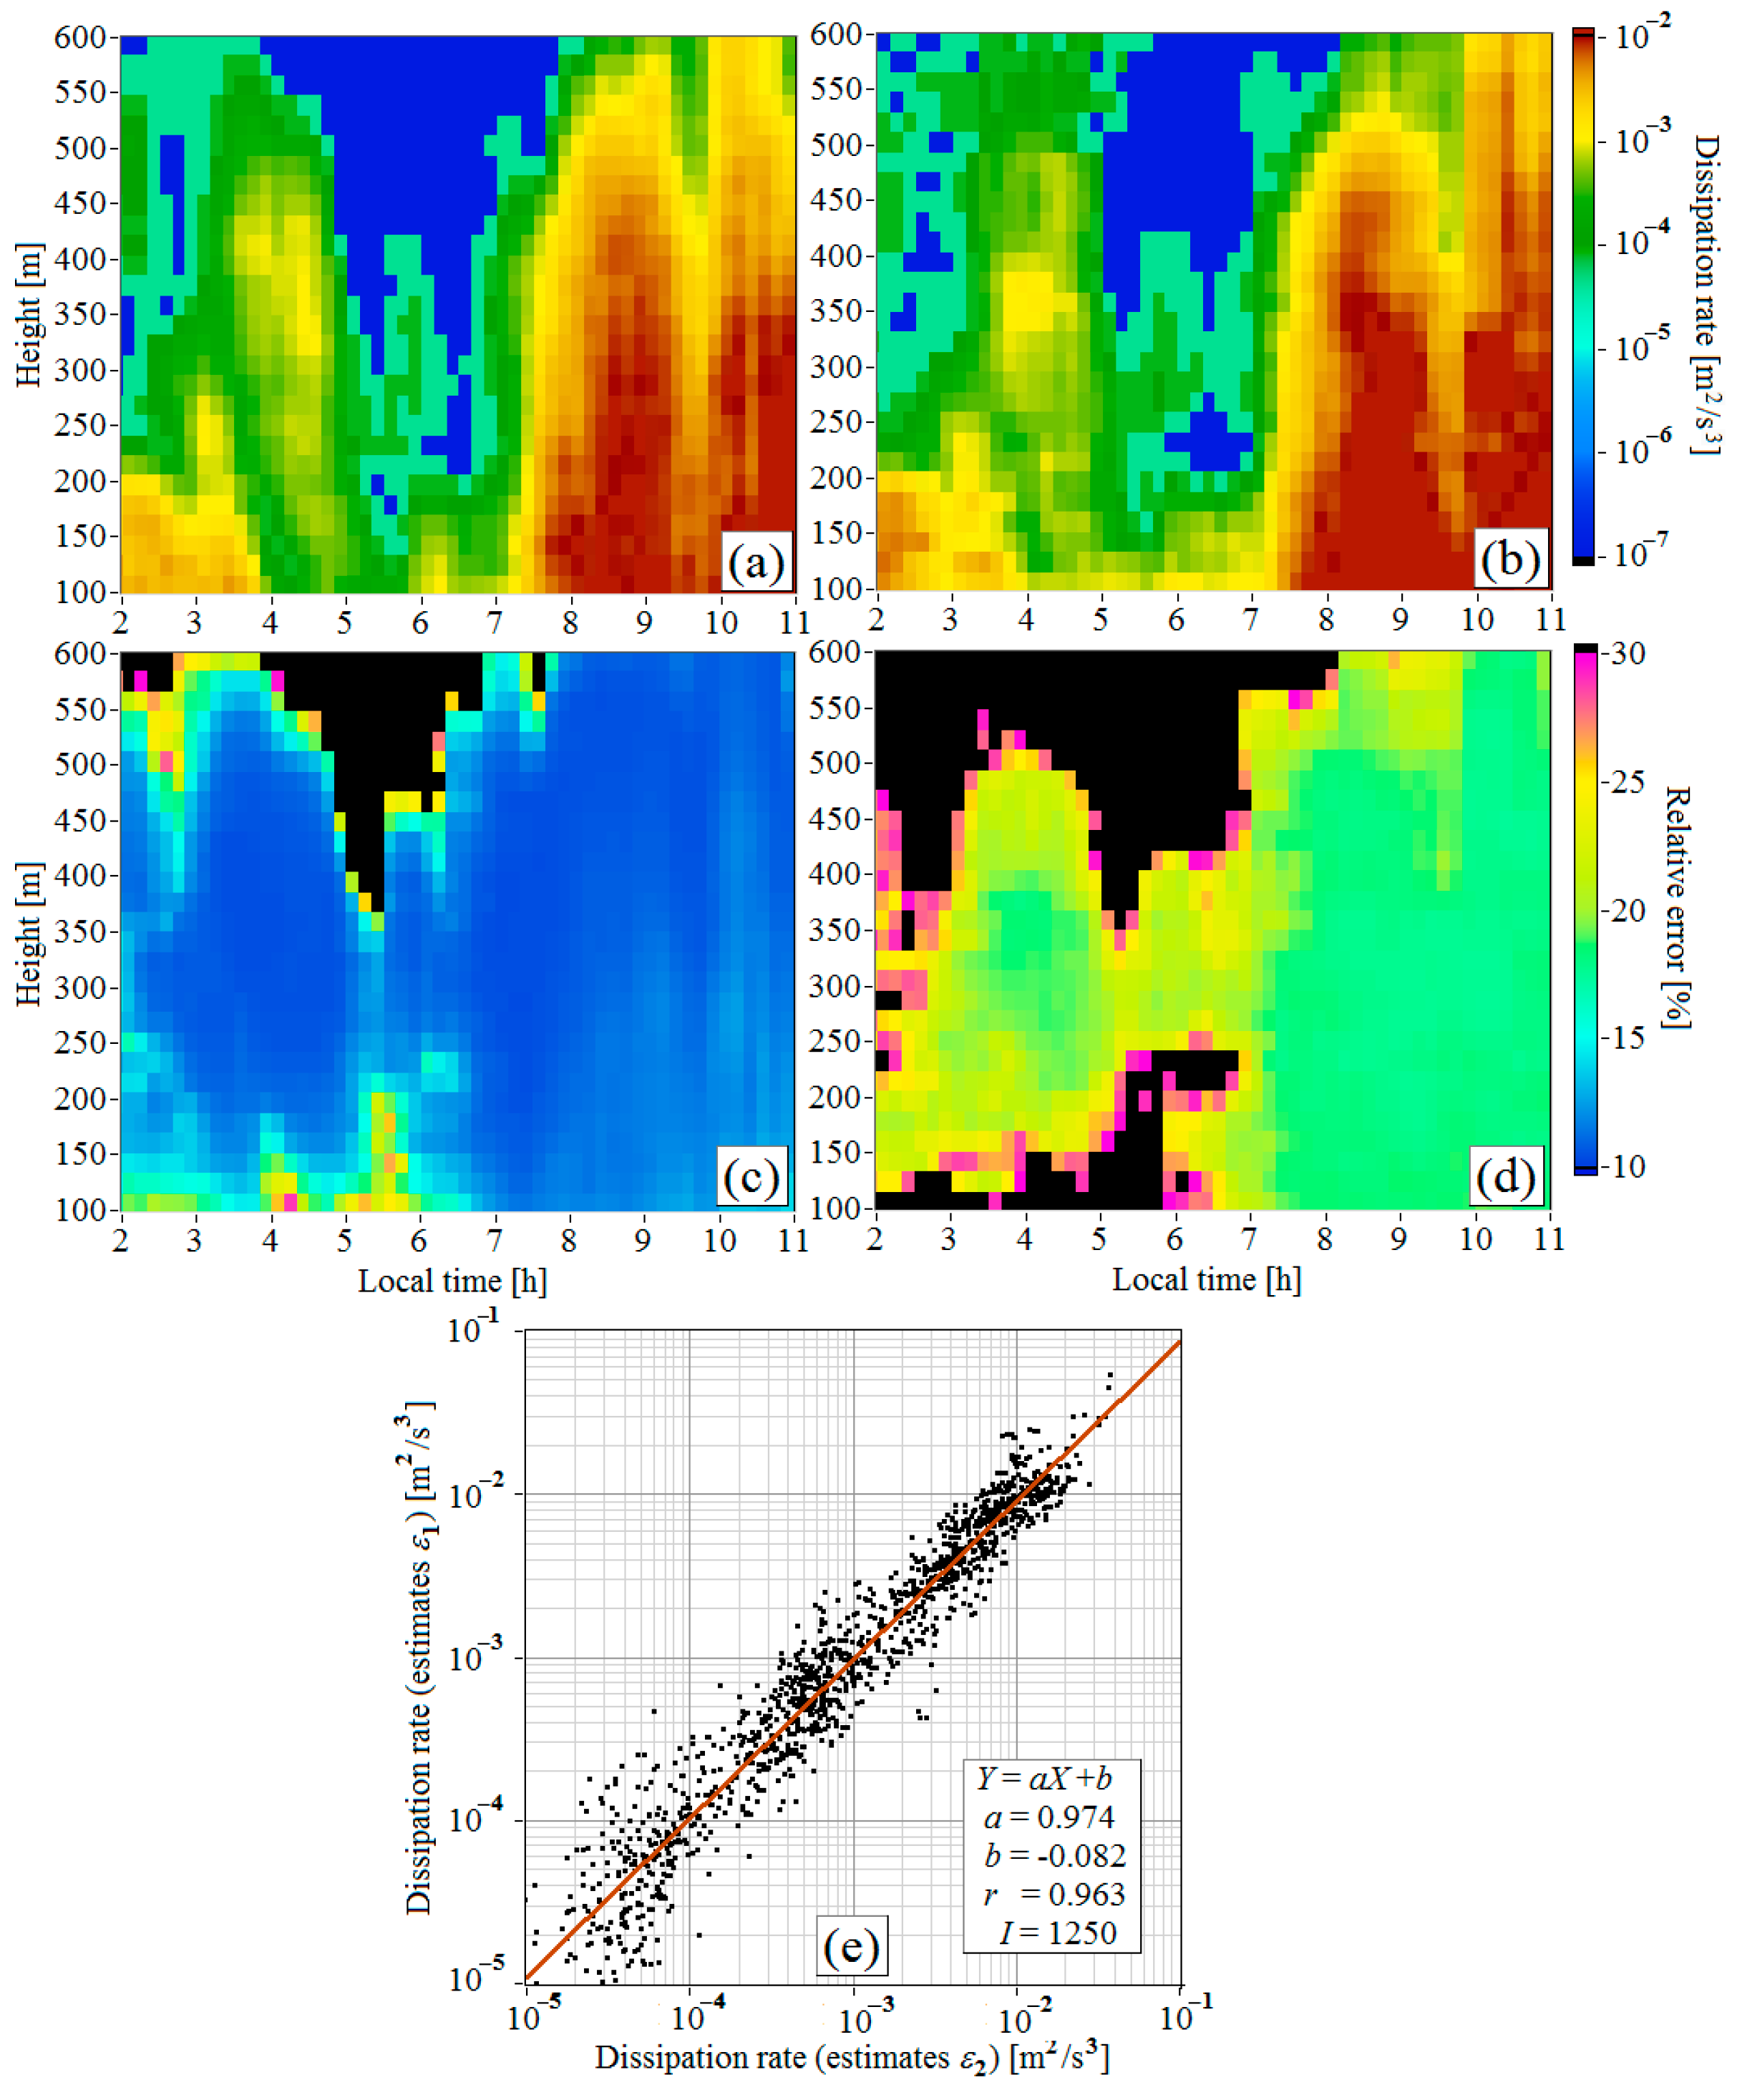
According to the data of Figure 4f, the fraction of the dissipation rate estimates with the relative error above 30% is less than 10% of the total number of estimates ε in Figure 4e. Nevertheless, to make sure that estimation of the turbulent energy dissipation rate ε from the lidar spectra of the vertical velocity is representative, we compared the results shown in Figure 4e with the lidar estimates of the dissipation rate obtained by the method of the azimuthal structure function [14]. For this purpose, we used the lidar data of the subarray V L ( m Δ t ; R k , φ scan , n ) obtained at the conical scanning to calculate the azimuthal structure function of the radial velocity.
Let ε 1 ( h k , t n ) be the dissipation rate estimates obtained from the spectra of vertical velocity and depicted in Figure 4e, while ε 2 ( h k , t n ) be the dissipation rate estimates found by the modified method of azimuthal structure function [18]. The method [14] and its modification [18] for obtaining the estimates ε 2 ( h k , t n ) were tested in comparative experiments with the sonic anemometer and were verified in many experimental field campaigns [19,27,28,29,30]. Thus, this method can be taken as a reference and used to prove the method for obtaining the estimates ε 1 ( h k , t n ) . The relative errors of estimation of the dissipation rate by these two methods are denoted, respectively, as E ε 1 ( h k , t n ) and E ε 2 ( h k , t n ) . The algorithm for calculation of E ε 1 ( h k , t n ) is described in Appendix B, while the algorithm for calculation of E ε 2 ( h k , t n ) can be found in [28]. The volume of raw lidar data used to obtain the estimates ε 1 ( h k , t n ) is much larger than that used for the estimates ε 2 ( h k , t n ) . Thus, we should expect that the error E ε 2 ( h k , t n ) is larger than E ε 1 ( h k , t n ) .
Figure 5a,c reproduces the distributions of ε 1 ( h k , t n ) and E ε 1 ( h k , t n ) from Figure 4, while Figure 5b,d depicts the similar distributions of the estimates ε 2 ( h k , t n ) obtained by the method [14,18] and their relative errors E ε 2 ( h k , t n ) . For quantitative comparison of ε 1 and ε 2 in Figure 5e, we used only the estimates whose errors E ε 1 and E ε 2 in each pair did not exceed 30%. There are 1250 such pairs in Figure 5e. From the data in Figure 5e, we find that the correlation coefficient r between lg ( ε 1 ) and lg ( ε 2 ) is 0.963, and the coefficients of linear regression are a = 0.974 and b = −0.082 ( Y = a X + b , where X = lg ( ε 2 ) and Y = lg ( ε 1 ) ). The red line in Figure 5e is 10 Y = 10 ( a X + b ) . The comparison of the estimates ε 1 and ε 2 obtained from lidar measurements in other measurement days gives similar results. This means that the estimate of the dissipation rate by the method described in Section 3 is nearly unbiased.

5. Lidar Measurements of Wind Turbulence Parameters in ABL during LLJ and IGW—Discussion

Figure 6 shows the height–temporal distributions U ( h k , t n ) , σ w 2 ( h k , t n ) , ε ( h k , t n ) and E ε ( h k , t n ) obtained during the formation of a low-level jet in the stable atmospheric boundary layer. The time series of the height of maximum h max ( t n ) in the distribution of the mean velocity is shown by the red curve in Figure 6a. This curve is also reproduced in the distributions of other parameters in Figure 6. It can be observed from Figure 6b,c that at heights h k h max ( t n ) , the wind turbulence becomes much weaker than that at heights h k < h max ( t n ) . If the height, above which the dissipation rate becomes less than 10−4 m2/s3 [26,27], is taken for the height of the turbulent mixing layer h mix ( t n ) , then h mix ( t n ) for the data shown in Figure 6c is, on average, 35 m below h max ( t n ) .
Figure 7 depicts, with an hour resolution, the vertical profiles of the mean wind velocity, variance of vertical velocity, dissipation rate, and relative error of estimation of the dissipation rate. These profiles are built from the data of 2D distributions of these parameters in Figure 6. The estimates of the dissipation rate with the relative error higher than 30% are excluded from the vertical profiles in Figure 7c. The profiles obtained in the period from 00:45 to 01:15 LT (red curves) stand out among the other vertical profiles in Figure 7. The mean wind at heights above 330 m is maximal at this time, while the turbulence strength first decreases with height, as can be seen from Figure 7b,c, and then increases. The dissipation rate takes the minimal value at the center of the jet. In the top part of LLJ, the dissipation rate increases with height and achieves a value of 10−4 m2/s3 at a height of 600 m, wherein the relative error of estimation of the dissipation rate does not exceed 16%.
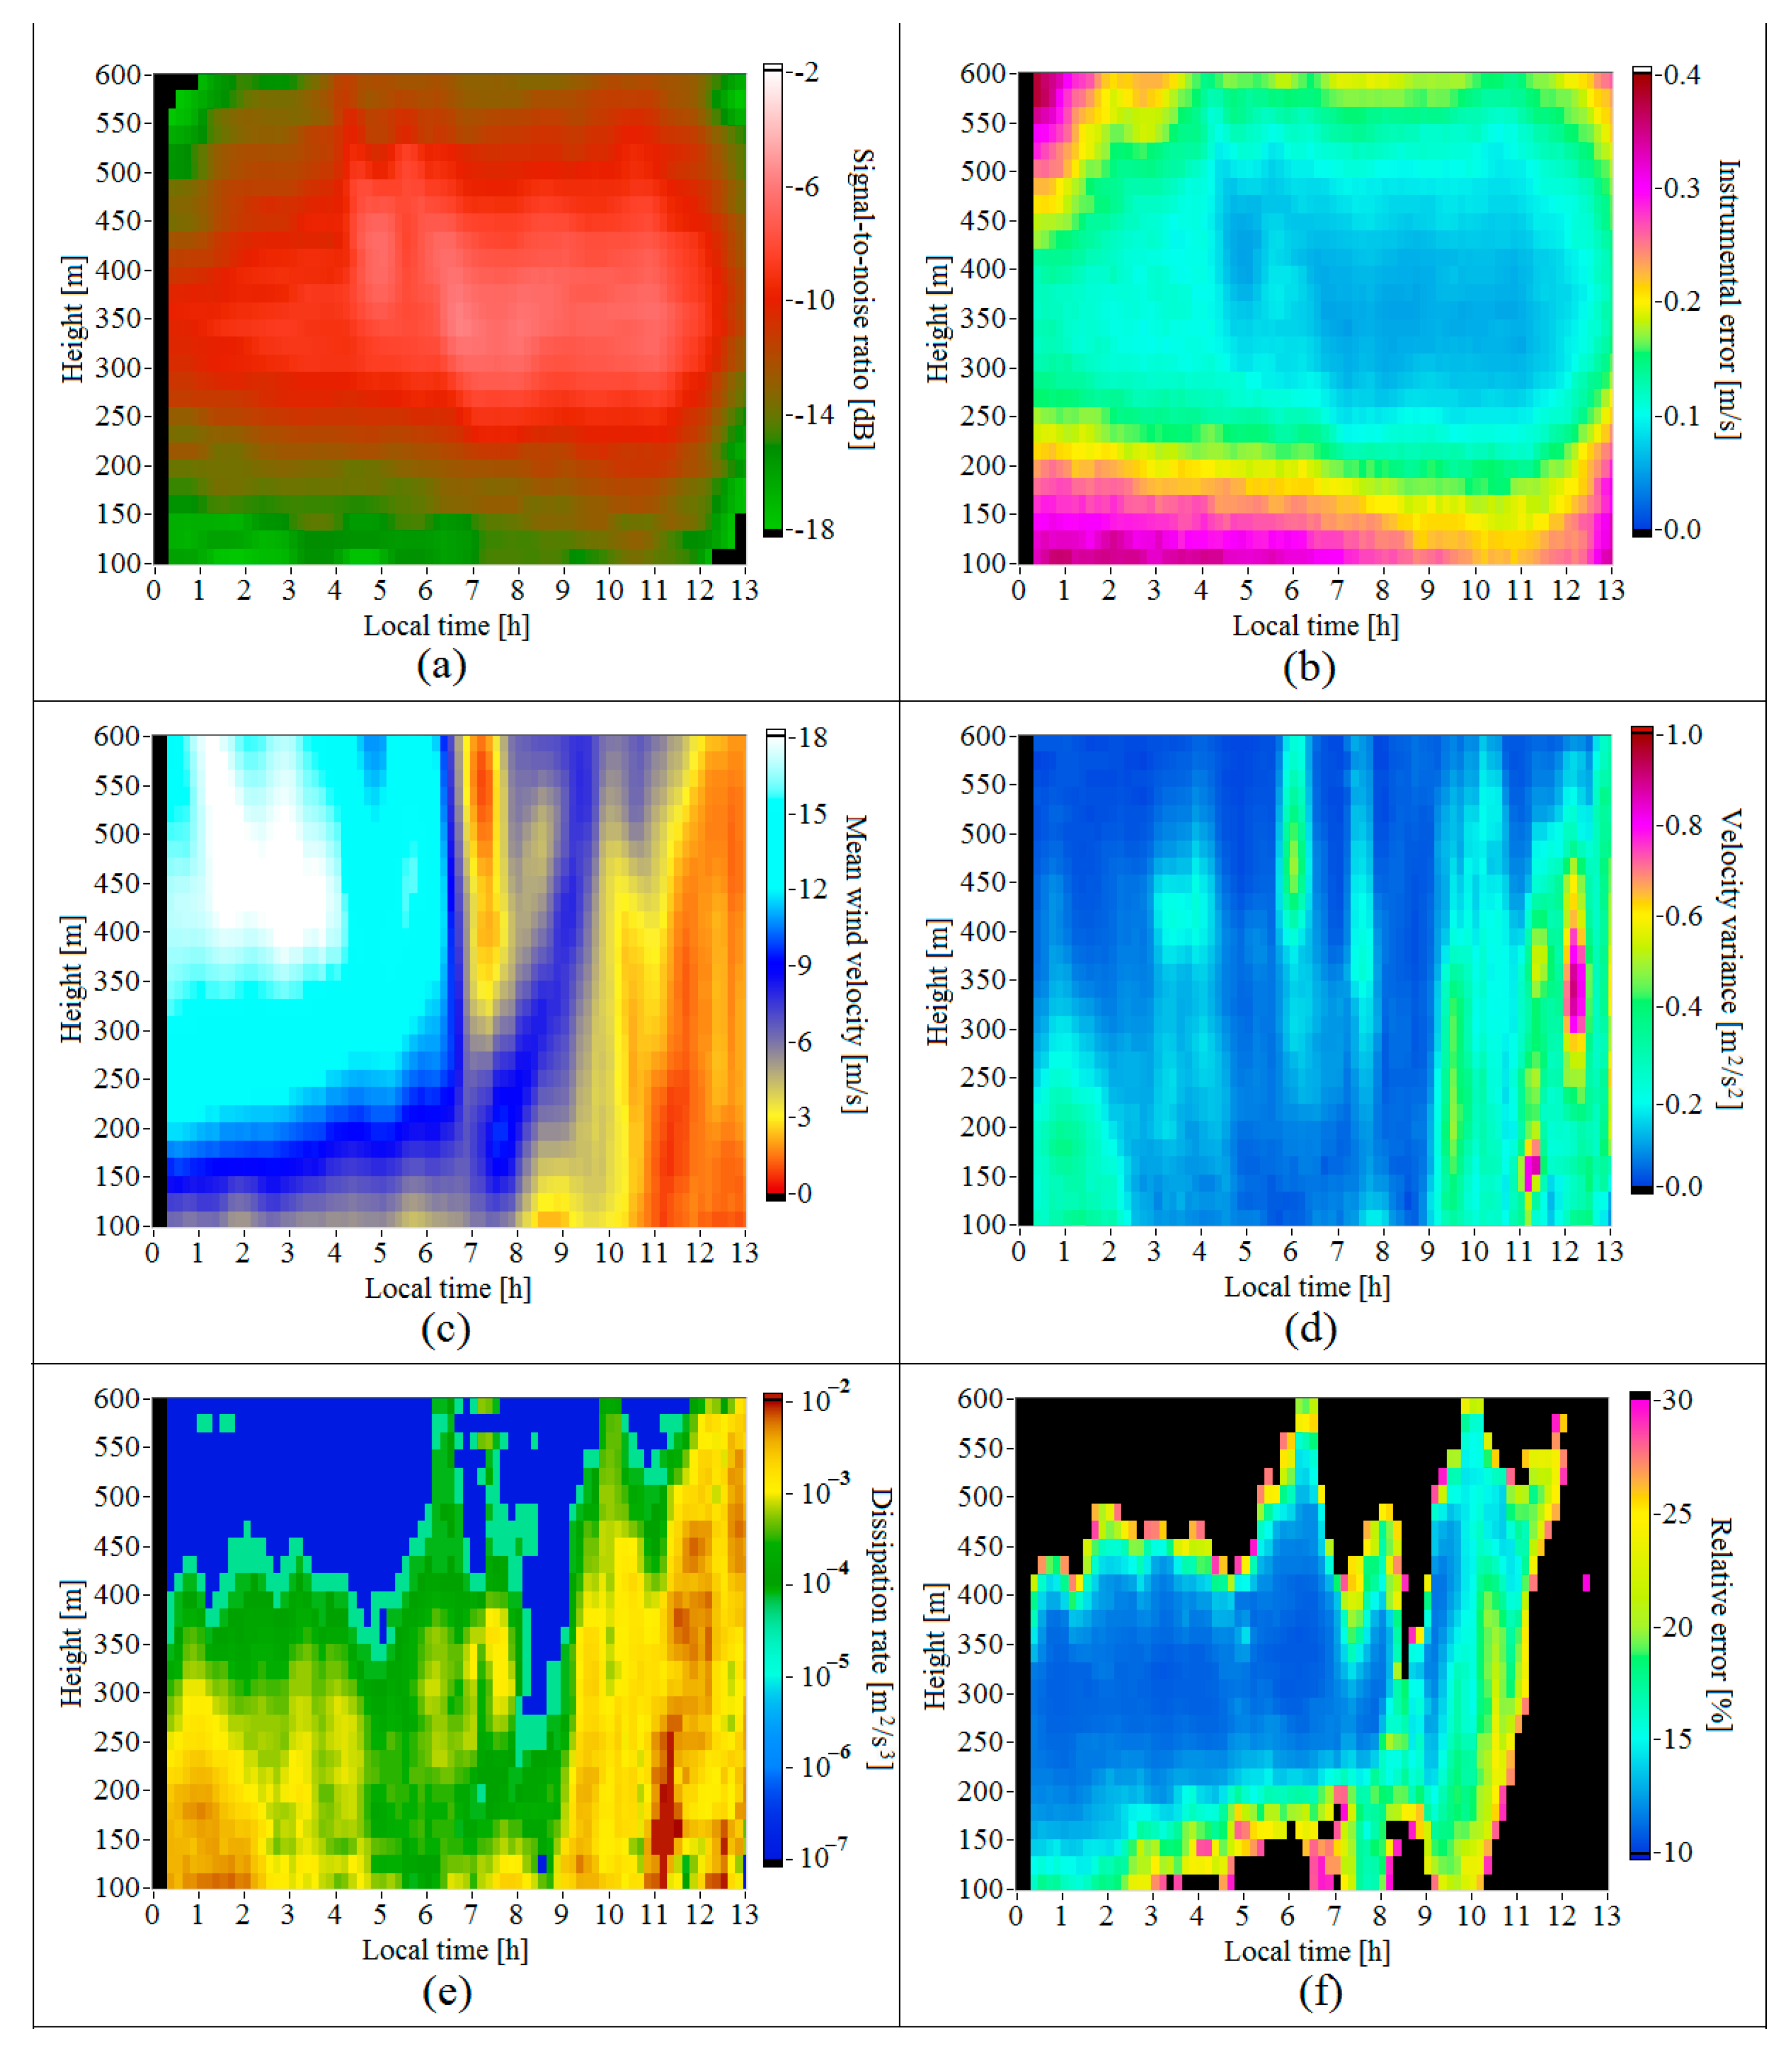
Figure 8 shows the height–temporal distributions SNR ( h k , t n ) , σ e ( h k , t n ) , U ( h k , t n ) , σ w 2 ( h k , t n ) , ε ( h k , t n ) , and E ε ( h k , t n ) obtained on 2 July 2020, in the period from 00:00 to 13:15 LT. The stratification in the lower 1 km ABL was stable all night from 00:00 to 08:00 LT. The low-level jet (Figure 8c) formed at this time was observed approximately till 06:30. In the center of the jet at heights of 400–450 m, the mean velocity sometimes achieved 20 m/s. After 06:30, the wind speed dropped sharply to 1–2 m/s. Figure 8d clearly demonstrates two zones where the variance σ w 2 ( h k , t n ) increases in the periods from 03:00 to 04:20 and from 05:40 to 06:20, which is associated with the IGW propagation at this time. The increase of σ w 2 ( h k , t n ) in the period from 07:00 to 08:00 is caused by the nonstationary process of transition from the nocturnal stable ABL to the daytime unstable one. At this time, the height of the turbulent mixing layer h mix determined from the equation ε ( h mix , t n ) = 10−4m2/s3 begins to decrease and, as can be seen from Figure 8f, descends down to heights of 150–200 m in the period from 8 a.m. to 9 a.m. Then, it increases sharply, within a few minutes, to 500 m and higher.

The Impact of IGW on the Spectra of the Radial Velocity

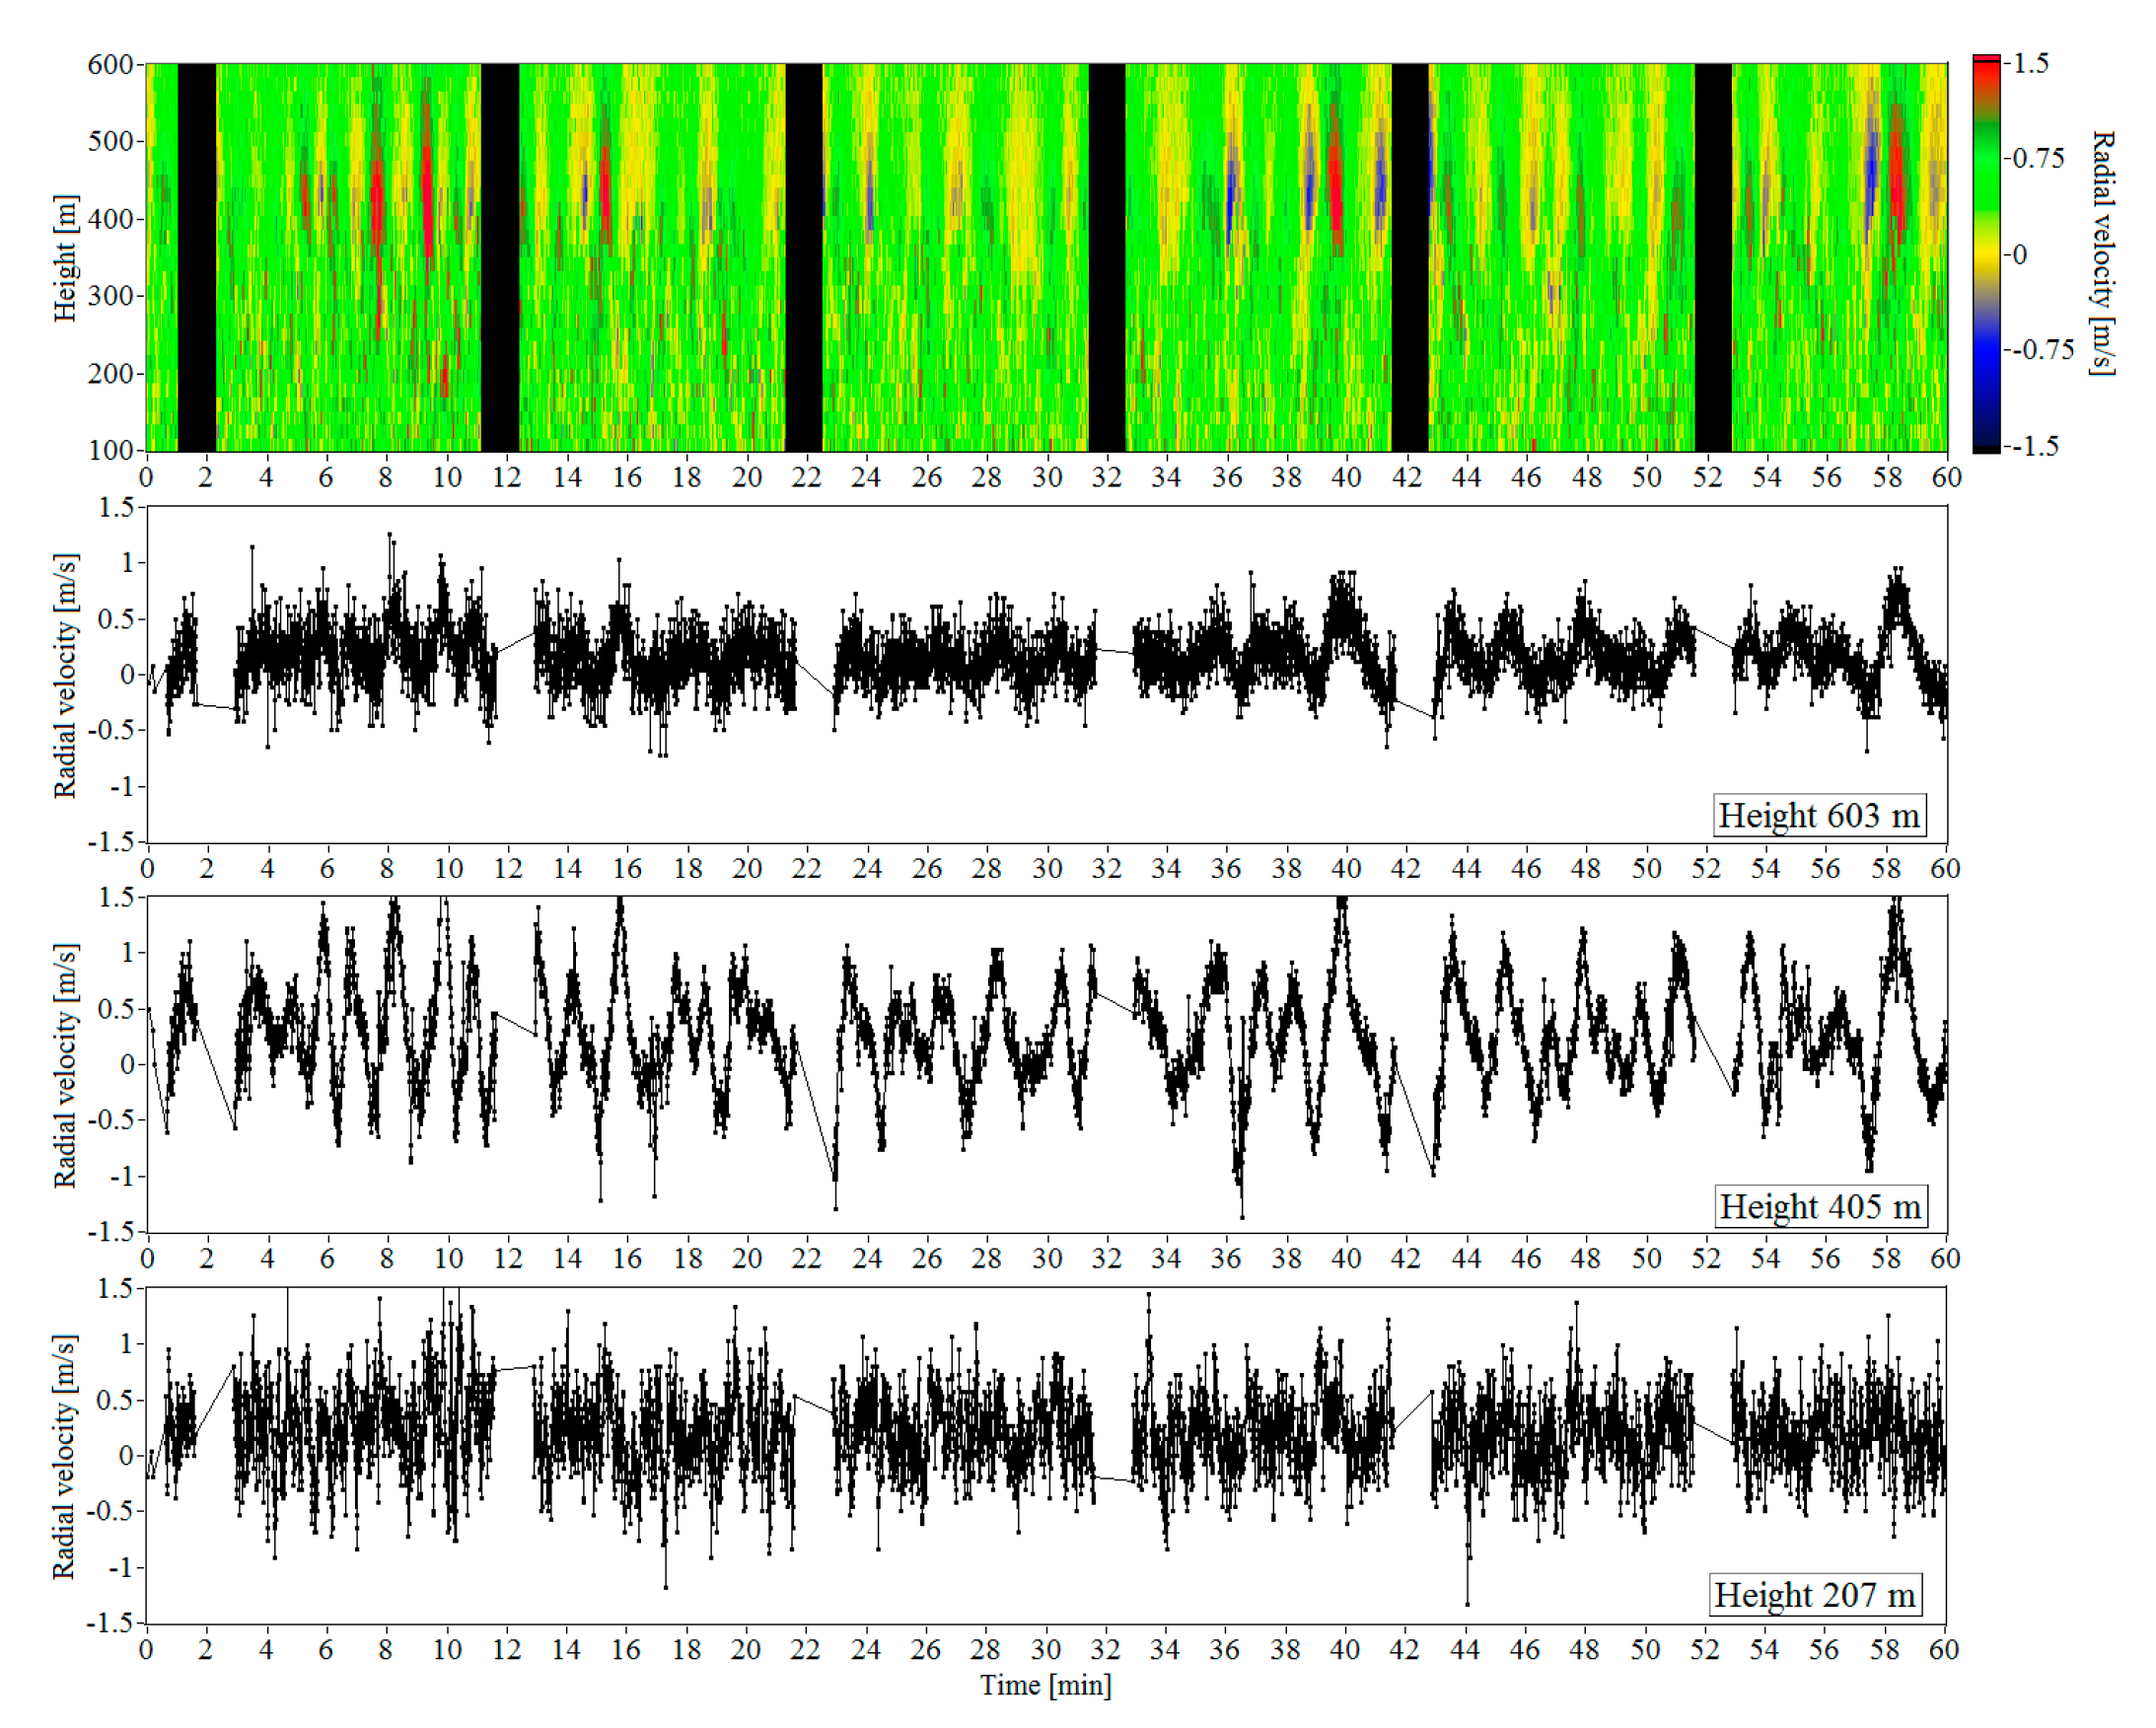
Figure 9 shows the height–temporal distribution of the vertical component of wind velocity as measured on 2 July 2020, for an hour starting from 03:00 LT with a discretization interval of 0.5 s. The height step was 18 m. The areas corresponding to measurement periods with conical scanning by the probing beam T scan = 1 min for determining horizontal components of the wind velocity vector are colored in black. One can infer that at heights from 350 to 550 m, the vertical velocity undergoes quasiharmonic oscillations caused by IGW. The time series of the vertical velocity shown in Figure 9 indicate that these oscillations have the maximal amplitude ~1 m/s at a height of 405 m. In the lower layer, variations of the vertical velocity are mostly caused by wind turbulence. At heights above 550 m, wind data are strongly noised.
From the data of 2D distribution in Figure 9, we obtained the spectra of turbulent fluctuations of the radial (vertical) velocity at six different heights. These spectra are marked in black in Figure 10. It can be seen that the spectral density of turbulent fluctuations in the frequency range from 0.005 to 0.02 Hz increases significantly starting from a height of 351 m due to velocity oscillations caused by IGW. With the use of smoothing and interpolation splines, we determined that the maximum of the spectrum falls on the frequency f v 0.01 Hz (oscillation period T v = 1 / f v 100 s). This frequency is much less than the lower boundary of the range 0.05 Hz f l 0.2 Hz (see red vertical lines in the figure), within which the turbulent energy dissipation rate is determined.
Along with the experimental spectra, Figure 10 depicts the spectra S L ( f l ) and S K ( f l ) calculated by Equations (5), (14), (15) and (18) correspondingly with the use of the experimental values of the noise spectral component S N , the mean wind velocity U , and the dissipation rate ε found from these measurements. At the heights of determining the spectra, the mean wind velocity (see Figure 8c and Figure 11a) exceeds 14 m/s. Therefore, the influence of spatial averaging of the radial velocity over the probing volume is small, and the spectra S L ( f l ) and S K ( f l ) differ only slightly in the frequency range 0.05 Hz f l 0.2 Hz when the effect of the noise component is still negligible (see plots in Figure 10 for heights of 315 m, 351 m, 387 m and 423 m).
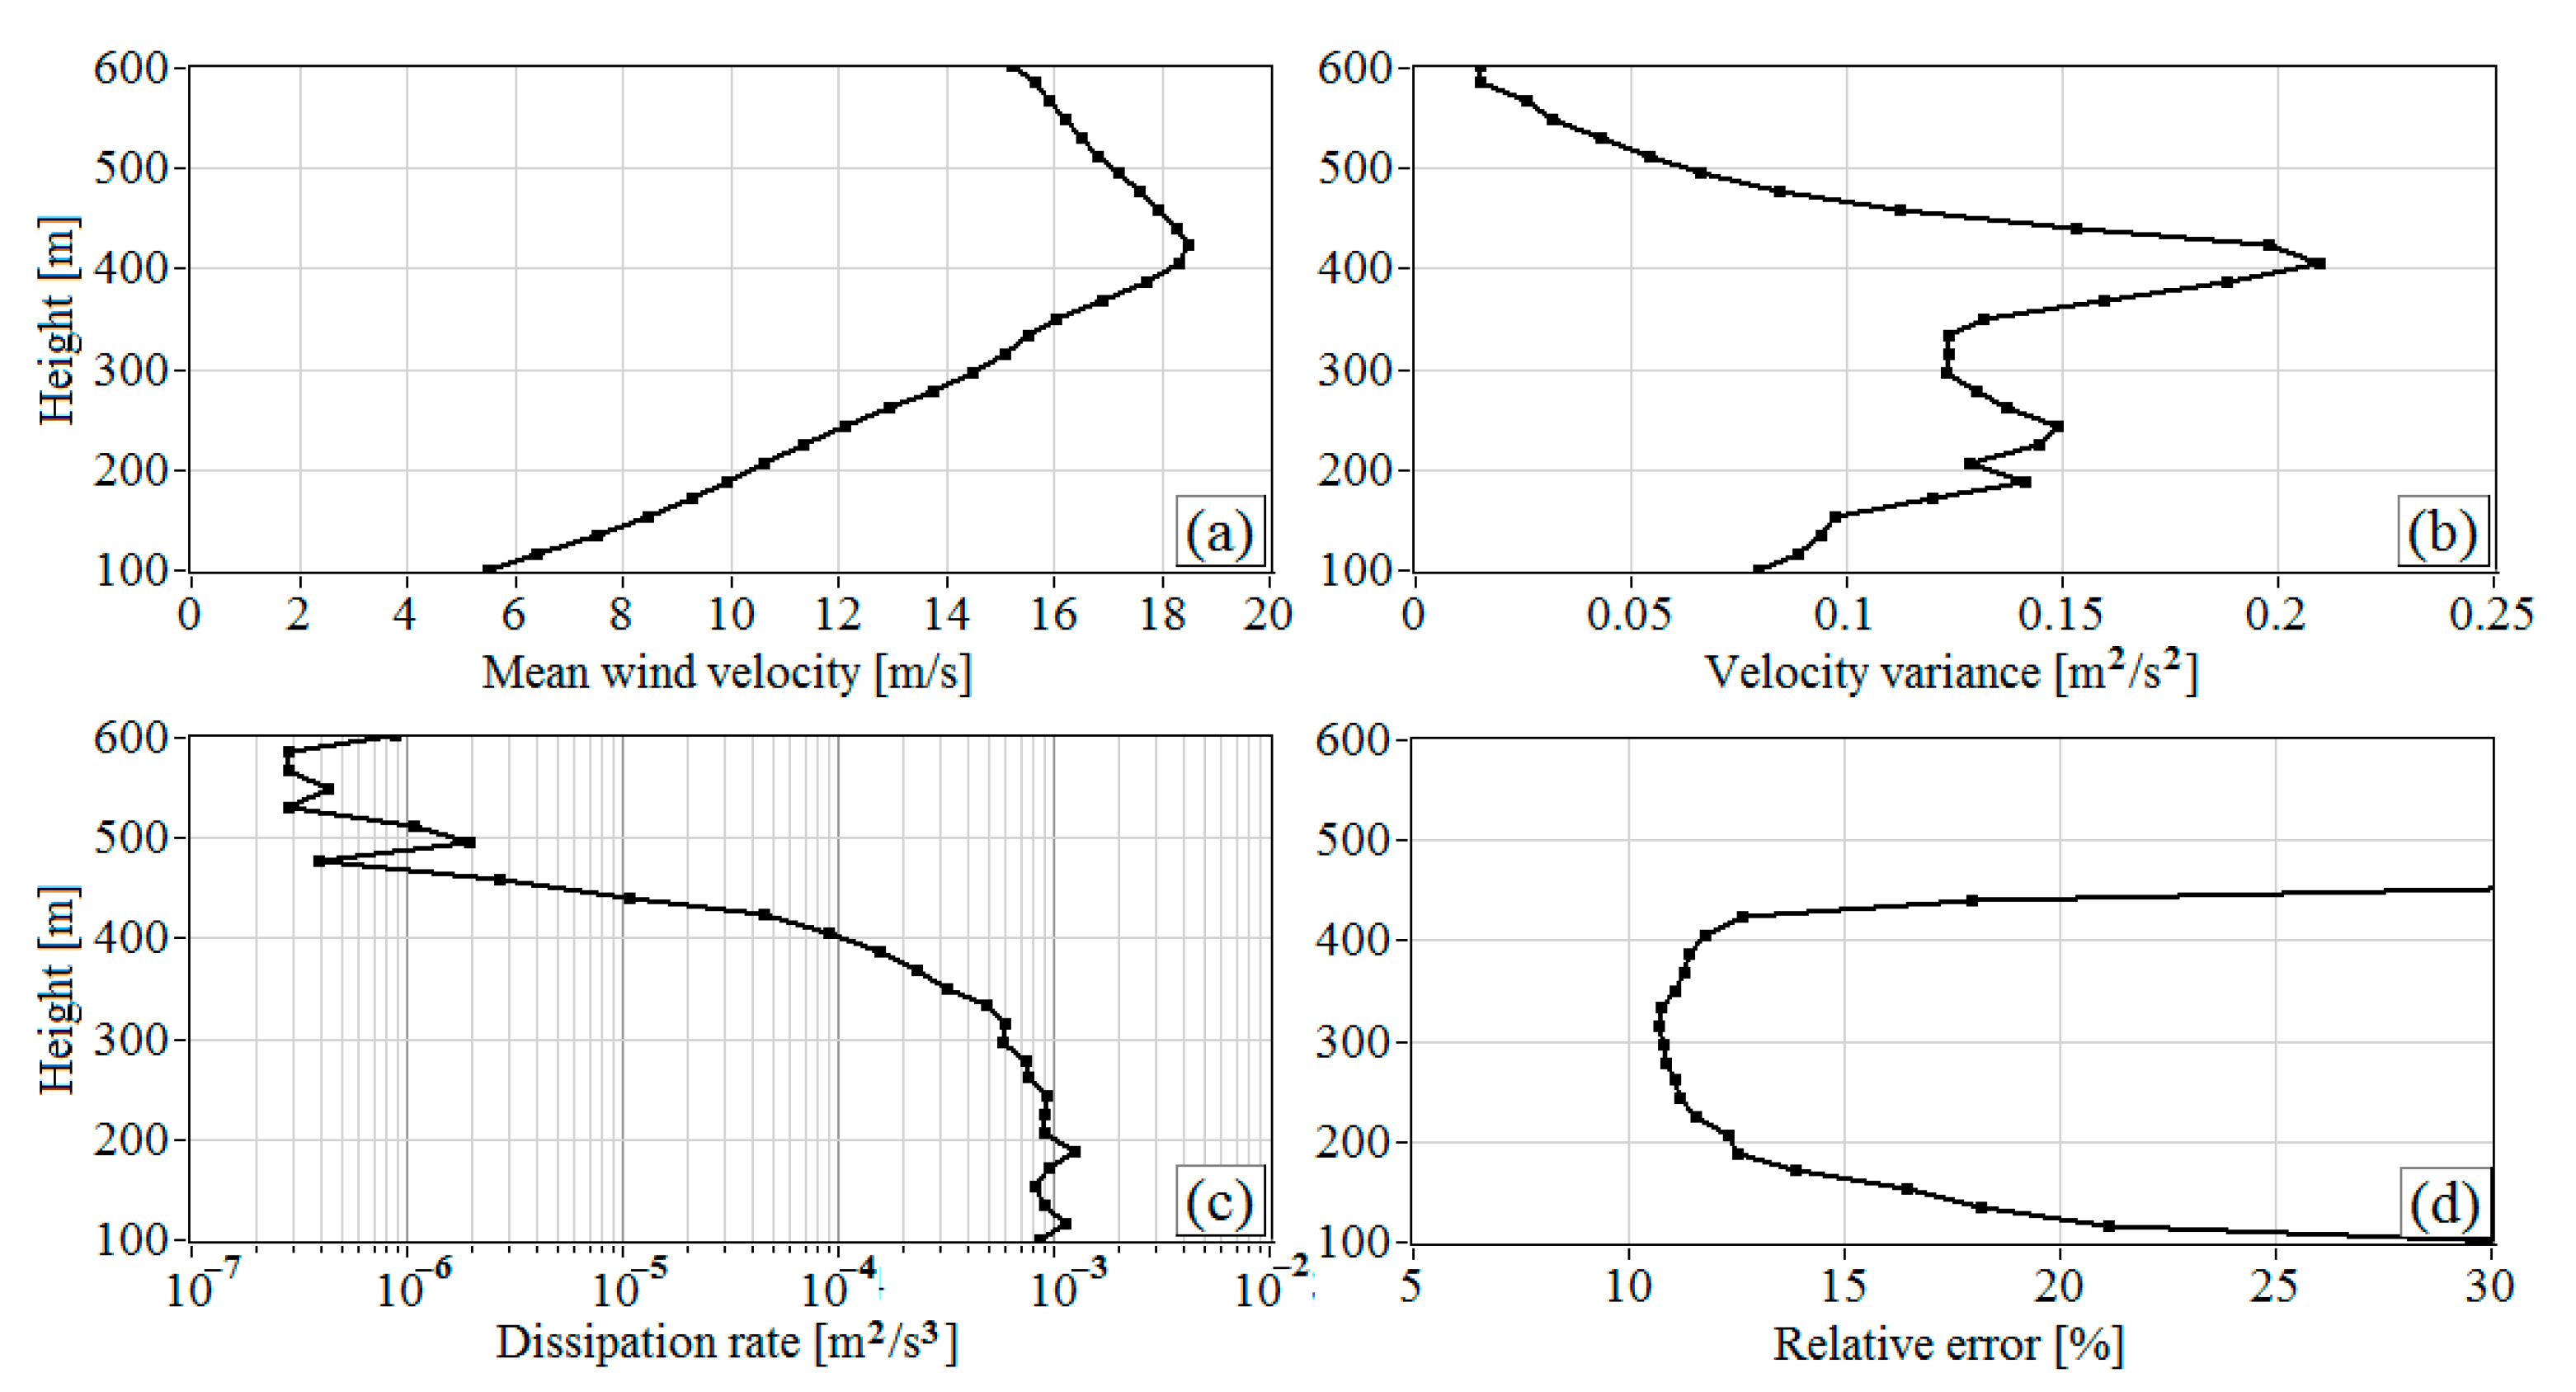
Figure 11 shows the vertical profiles of the mean wind velocity, variance of the vertical component of wind velocity vector, turbulence energy dissipation rate, and relative error of dissipation rate estimation obtained from the same lidar measurements as the spectra shown in Figure 10. One can observe from Figure 11a that the velocity is maximal at a height of about 400 m. The variance of vertical velocity (Figure 11b) first increases up to the height of the velocity maximum at the center of the jet and then decreases. The dissipation rate remains nearly constant up to a height of 300 m. Then, it begins to decrease and drops sharply by two orders of magnitude between 400 and 470 m in the top of the jet. Simultaneously, in accordance with Equation (A26), the estimation error ε also sharply increases. The increase of the variance σ w 2 is reasoned by the impact of IGW causing velocity oscillations, as stated above, with the frequency f v 0.01 Hz and considerable increase of the spectral amplitude in the frequency range 0.002 Hz f l 0.05 Hz (Figure 10). The variance is the integral of the spectrum (2) over the entire frequency range 0.002 Hz f l 1 Hz, and the presence of a peak in the spectrum at a frequency of 0.01 Hz leads to its increase. The dissipation rate is calculated from the spectra in the frequency range 0.05 Hz f l 0.2 Hz (see Figure 10), where the impact of the IGW is negligibly small, and there is no overestimation of ε .
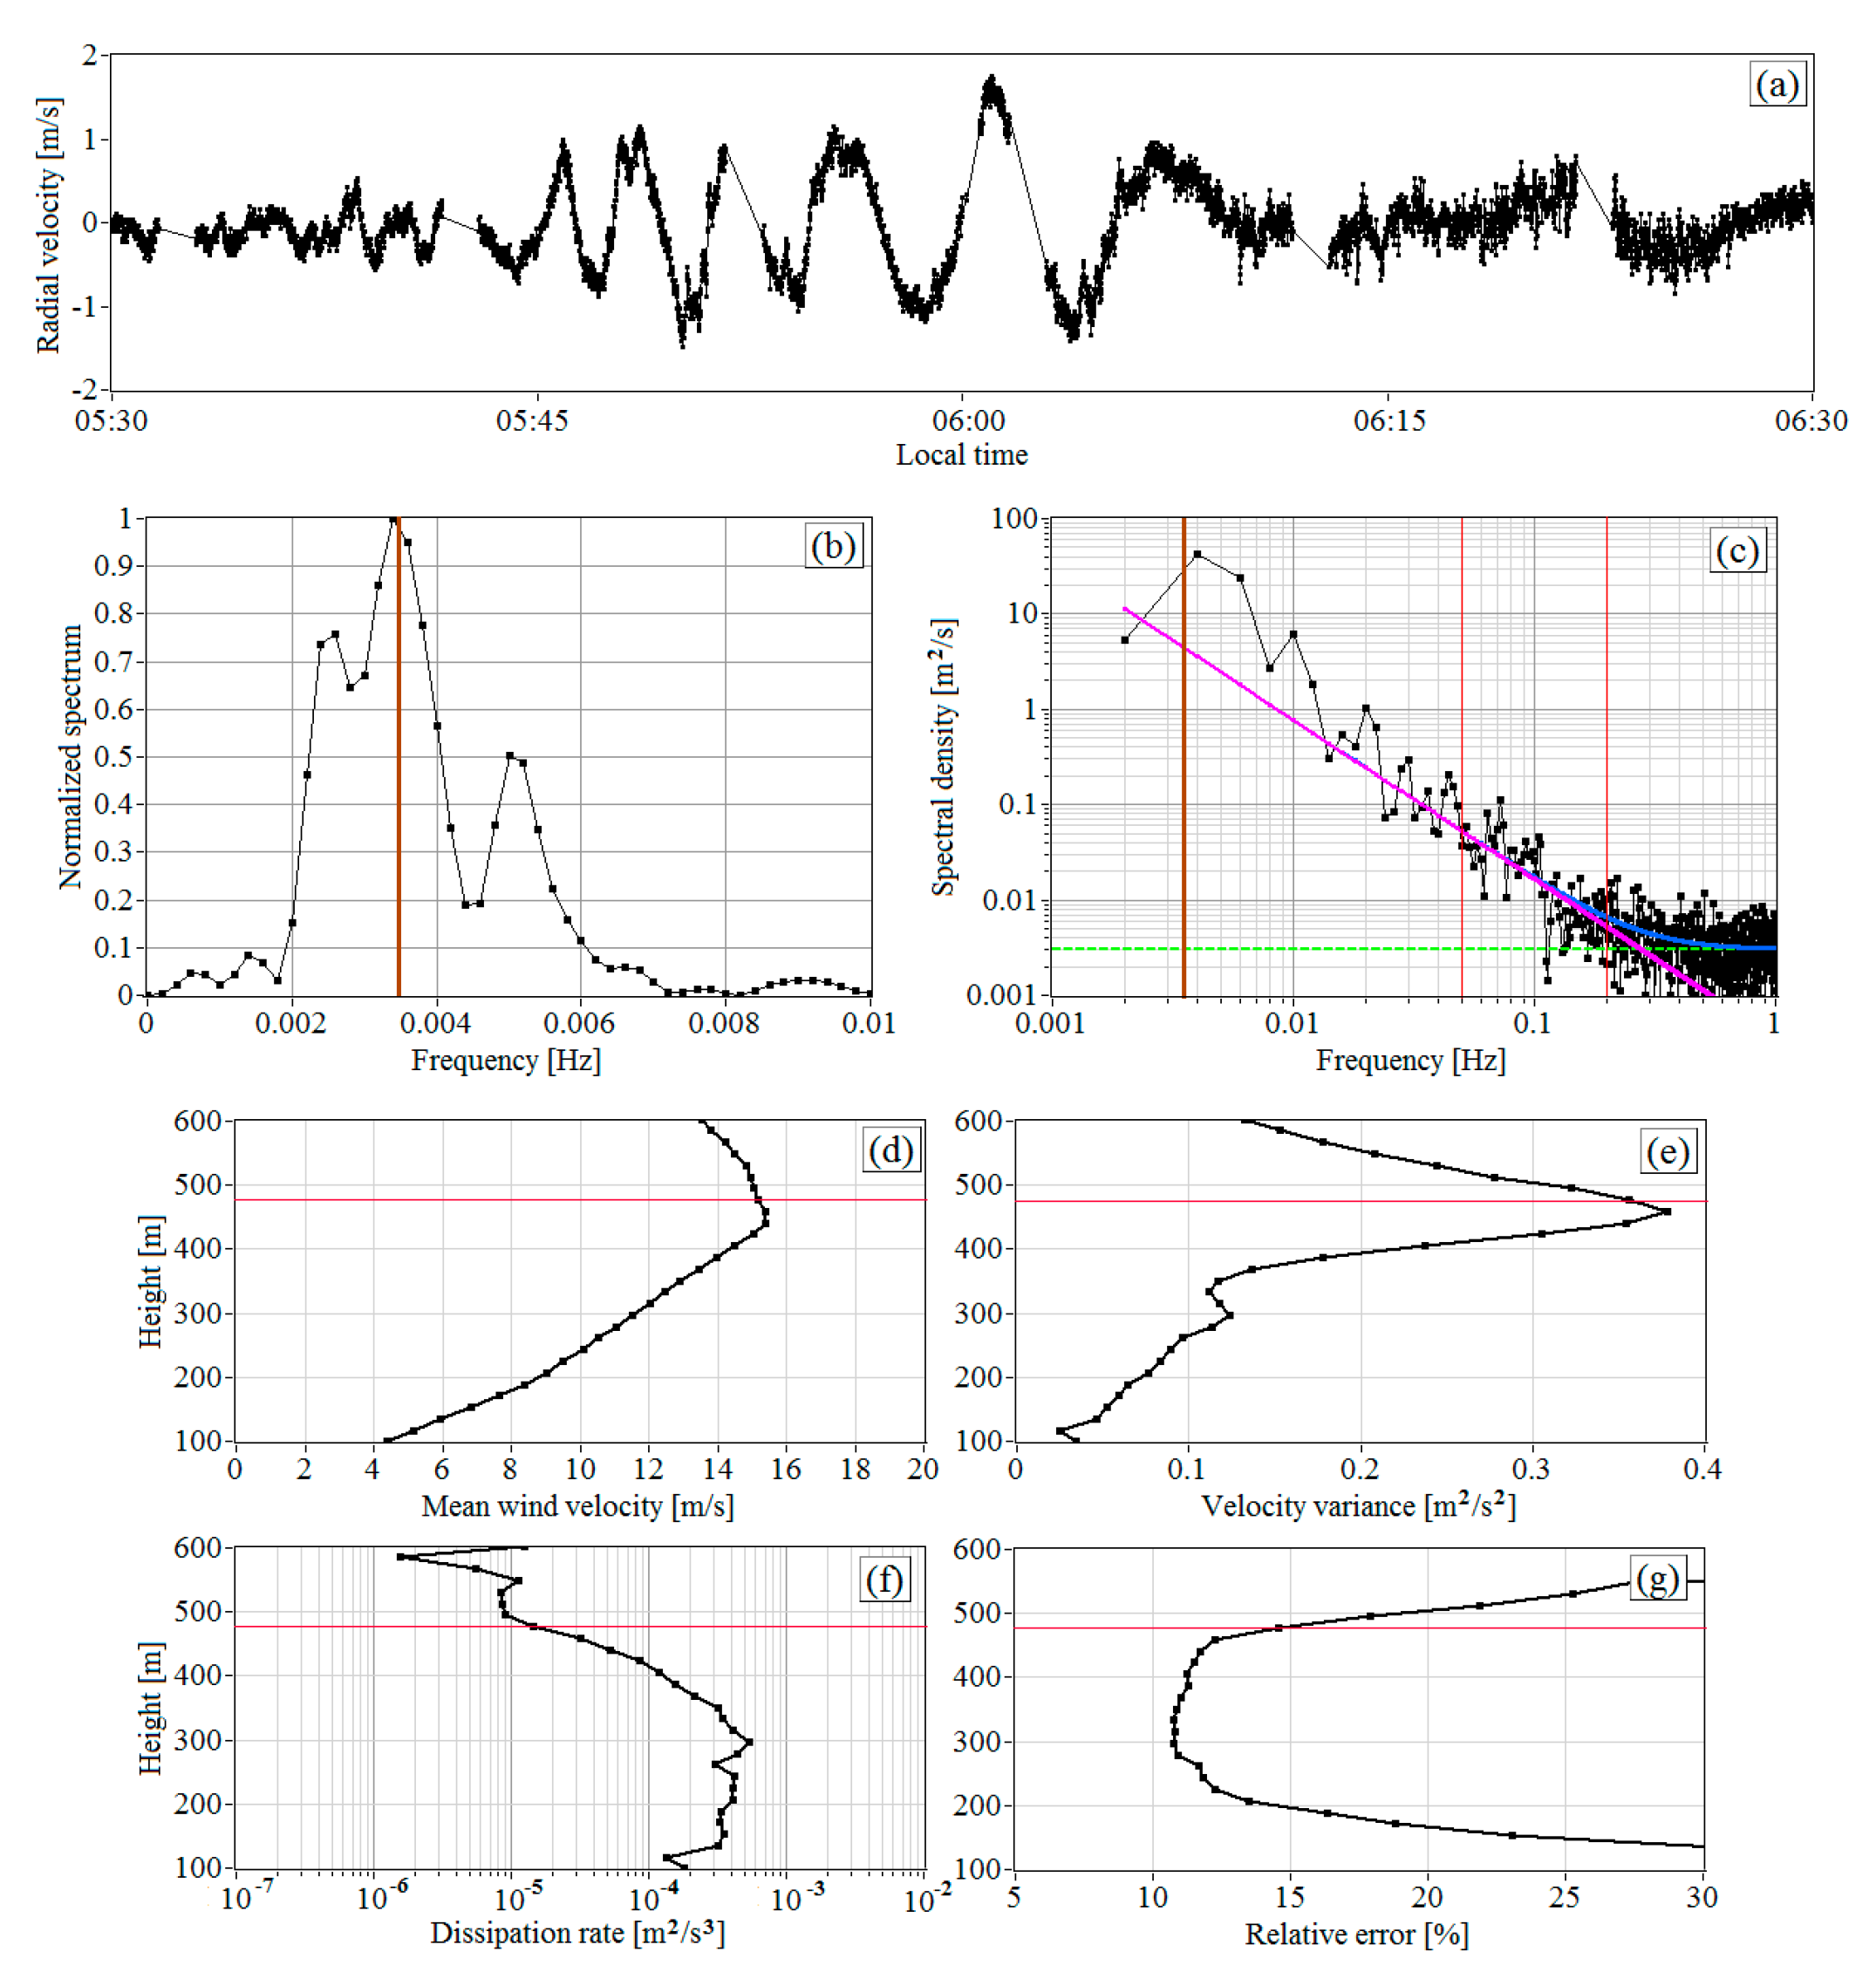
Figure 12 demonstrates another example of IGW observation early in the morning on this day. One can observe from Figure 12a how IGW appears starting from 05:30 LT. Then, the amplitude caused by IGW oscillations of the vertical wind component increases with time, achieving the value A z ~ 1.5 m/s, while the oscillation frequency f v , to the contrary, decreases. After about 06:10 LT, the quasiharmonic oscillations decrease with an increase of the amplitude of turbulent fluctuations of the vertical velocity. To calculate the spectrum of vertical velocity in the low-frequency range f l 0.01 Hz including the peak associated with IGW, we used the algorithm proposed in [12]. The results of the calculation of the spectrum normalized to the maximal values in this spectral range are shown in Figure 12b. From the spectrum peak location (brown vertical line), we found that the oscillation frequency f v is, on average, 0.0034 Hz. The period of oscillations is T v = 1 / f v 5 min. Figure 12c shows the experimental spectral density of turbulent fluctuations of the vertical velocity (black color) and its noise component S N (green dashed line) in the entire frequency range 0.001 Hz f l 1 Hz, as well as the results of calculation of the spectra S L ( f l ) and S K ( f l ) (blue and pink curves, respectively).
Figure 12d–g depict the vertical profiles U ( h k ) , σ w 2 ( h k ) , ε ( h k ) , and E ε ( h k ) calculated from the lidar data obtained in the period from 05:42 to 06:12 LT during IGW propagation in the layer of 300–600 m. The dissipation rate and the variance of vertical velocity were calculated from the experimental spectra which are similar to the spectrum in Figure 12c. We can infer from Figure 12d that the center of the jet in the vicinity of the maximum of the mean wind velocity is at a height of 450 m at this time. As in the case of IGW observed from 03:00 to 04:00 (Figure 11b), σ w 2 ( h k ) also first increases to the height of mean velocity maximum owing to the IGW impact and then decreases fast (Figure 12e). Since the turbulent energy dissipation rate at the jet center and above is small, at heights exceeding 400 m, the quasiharmonic oscillations of the vertical velocity, caused by IGW, rather than the wind turbulence contribute mainly to the variance σ w 2 . IGW does not affect the estimate of the dissipation rate (Figure 12f), since it is calculated from the spectral data in a much higher frequency range than the frequency of velocity oscillations caused by IGW.

6. Conclusions

The paper proposes a strategy that allows us to determine both the wind velocity vector and the temporal and spatial (along the mean wind direction) spectra of turbulent fluctuations of the vertical component of the wind velocity vector from the measurement data of the same PCDL. The proposed measurement strategy forms the basis of the method for estimating the turbulence energy dissipation rate and the variance of the vertical component of the wind velocity vector from the spectral density of turbulent fluctuations of the radial velocity measured by PCDL. For the first time, the spectral method takes into account the averaging of the radial velocity over the probing volume. It is shown that if the spatial averaging of the radial velocity is neglected, the lidar estimate of the dissipation rate is understated. The algorithm is built for calculating the error of lidar estimate of the turbulence energy dissipation rate from spectra of radial velocity.
The results of lidar estimation of the turbulent energy dissipation rate from the temporal spectra of the vertical component of wind velocity vector obtained at the vertical probing were compared with those obtained by the modified method of the azimuthal structure function of radial velocity calculated from measurements at the conical scanning around the vertical axis [14,18]. Method [14,18] was taken as a reference. The comparison has shown that both methods provide practically coinciding estimates of the dissipation rate with the correlation coefficient close to unity. This allows us to believe that the estimates of the dissipation rate from the spectra of turbulent fluctuations of the vertical velocity are unbiased.
The method for estimating wind turbulence parameters from vertical velocity spectra was used in the experiments with StreamLine PCDL (Halo Photonics, Brockamin, Worcester, United Kingdom) to study the atmospheric boundary layer during the formation of low-level jets and internal gravity waves with the measurement strategy proposed in this paper. During the experiment, several cases of IGW propagation were observed. Internal gravity waves caused oscillations of the vertical velocity with the amplitude up to 1.5 m and periods from 1.7 to 7 min. Velocity oscillations were observed in the approximately 200 m thick layer centered at the height of the maximum of mean wind velocity in LLJ. The duration of oscillations was from 30 min to 1 h.
The experimental results obtained indicate that in most cases, the turbulent energy dissipation rate in the bottom of LLJ takes values several orders of magnitude higher than those in the LLJ top, where it becomes extremely small. In some cases, the estimation of the dissipation rate at the top of LLJ becomes impossible because of the lacking inertial range of turbulence and the increasing the estimation error ε . However, sometimes, we observed that the turbulent energy dissipation rate and the wind velocity variance decrease with height, achieve a minimum at the LLJ center, and then increase to the values corresponding to the moderate strength of turbulence.
The frequency range for estimating the turbulent energy dissipation rate from experimental spectra was selected to fall within the inertial range of turbulence. The frequencies in this range far exceed the frequencies of vertical velocity oscillations caused by IGW. Owing to this fact, the obtained estimates ε are unbiased. During IGW, the dissipation rate in the LLJ center takes values ranging from 10−6 to 10−5 m2/s3. The same weak turbulence was observed during the IGW propagation and in our other experiments [19,27,28,29,30].
Since the time window T vert = 8.3 min, which was used for estimating the experimental spectra of radial velocity by Equation (1), exceeds the periods of the radial velocity oscillations, caused by IGW, the variance of the vertical component of the wind velocity vector appeared to be significantly overestimated. Under the IGW impact, the variance first increases up to the height of the maximum of mean velocity at the jet center and then decreases with height. Since the wind turbulence at the jet center and above is weak as a rule, at these heights, the quasiharmonic oscillations of the vertical velocity, caused by IGW, contribute mainly to the variance σ w 2 .

Author Contributions

Conceptualization, V.A.B.; methodology, V.A.B. and I.N.S.; software, I.N.S.; experiment, V.A.B. and A.V.F.; validation, I.N.S. and A.M.S.; investigation, V.A.B. and I.N.S.; writing—original draft preparation, V.A.B. and I.N.S.; writing—review and editing, V.A.B.; visualization, I.N.S.; supervision, V.A.B.; project administration, V.A.B.; funding acquisition, V.A.B. All authors have read and agreed to the published version of the manuscript.

Funding

The work was performed under the project of the Russian Science Foundation 19-17-00170. The use of the infrastructure of BEO and developing the algorithm for calculating the error of lidar estimate of the turbulence energy dissipation rate was supported by the Ministry of Science and Higher Education of the Russian Federation (V.E. Zuev Institute of Atmospheric Optics of Siberian Branch of the Russian Academy of Sciences).

Data Availability Statement

All the data presented in this study are available from the authors upon request.

Acknowledgments

The authors thank the reviewers for their efforts and time.

Conflicts of Interest

The authors declare no conflict of interest. The funders had no role in the design of the study; in the collection, analyses, or interpretation of data; in the writing of the manuscript, and in the decision to publish the results.

Appendix A. Consideration of the Spatial Averaging of the Radial Velocity

To prove that the known expression for the function H ( κ z ) [9] can be used to take into account the spatial averaging when estimating the radial velocity from the maximum of the Doppler spectrum, we used the numerical simulation. We compared the transverse spectra of the radial velocity estimated from the maximum of simulated Doppler spectra and the transverse spectra of the radial velocity averaged over the probing volume with the same averaging function, as in [9]. The simulation was performed in the following way.

Appendix A.1. Calculation of the Transverse Spectrum When Estimating the Radial Velocity from Maximum of the Doppler Spectra

Assume that the longitudinal size of the probing volume Δ z exceeds its transverse dimension Δ y ( Δ y = U Δ t at the vertical probing). Then, according to [9,31], the expression for the normalized correlation function of the useful component of the complex lidar signal C S ( l T s , z , y ) can be written as
C S ( l T s ; z , y ) = + d z A ( l , z )   ( 1 ) l exp [ 2 π j l B V 1 V r ( z + z , y ) ] ,
where l = 0 , 1 , 2 , , 6 ; T s = B 1 ; B = 50 MHz is the receiver frequency bandwidth; z is the distance from the lidar to the center of the probing volume; y = U t is the transverse coordinate; t is time;
A ( l , z ) = 1 7 l m = 0 6 l F ( z ( m 3 ) δ R ) F ( z ( m + l 3 ) δ R ) ,
δ R = c T s / 2 = 3 m; c is the speed of light;
F ( z ) = ( π Δ p ) 1 / 2 exp [ ( z / Δ p ) 2 / 2 ] ,
Δ p = c τ p / ( 4 ln 2 ) = 15.3 m; τ p = 170 ns is the pulse duration of the StreamLine lidar (see Table 1 in [12]); B V = λ / ( 2 T s ) = 37.5 m/s; λ = 1.5 µm is probing beam wavelength, and V r ( z , y ) is the 2D random distribution of the radial velocity over the plane { z , y } . Random realizations of V r ( z , y ) at the nodes of the 1024 × 1024 computational grid with 3 m cells were simulated with the use of the von Karman model for the two-dimensional spectrum of wind velocity S r ( κ z , κ y ) based on the algorithm described in [23].
The Doppler spectrum is calculated from C S ( l T s ; z , y ) with the Fast Fourier Transform (FFT) as [31]
S D ( f k ; z , y ) = Re { l = 0 6 ( 2 δ l ) ( 1 l / 7 ) C s ( l T s ; z , y ) exp ( 2 π j l k N ) } ,
where f k = k δ f is the frequency; k = 0 , 1 , 2 , , N is the spectral channel number; δ f = B / N is the spectral channel width, N = 1024 is the number of spectral channels, and δ l is the Kronecker delta ( δ 0 = 1 and δ l 0 = 0). In Equation (A4), we can pass from frequency to the velocity distribution: V k = k δ V B V / 2 ; δ V = B V / N = 0.03662 m/s. Estimated from the maximum of the Doppler spectrum (A4) radial velocity V max ( z , y ) is used to calculate the transverse spectrum of fluctuations of the radial velocity as
S max ( κ ) = + d r B max ( r ) exp ( 2 π j κ r ) ,
where
B max ( r ) = < V max ( z , y + r ) V max ( z , y ) > ,
is the transverse correlation function of velocity fluctuations V max = V max < V max > , and angular brackets denote the averaging over an ensemble of realizations.

Appendix A.2. Calculation of the Transverse Spectrum When Estimating the Radial Velocity from Centroid of the Doppler Spectra

When the radial velocity is estimated from the centroid of the Doppler spectrum, the velocity V a ( z , y ) , averaged along a lidar probing volume, is defined by the integral [9,32]
V a ( z , y ) = + d z Q s ( z ) V r ( z + z , y ) ,
where the filtering (averaging) function in the longitudinal direction is given by the expression
Q s ( z ) = 1 2 Δ R [ erf ( z + Δ R / 2 Δ p ) erf ( z Δ R / 2 Δ p ) ] .
In Equation (A8), erf ( x ) = ( 2 / π ) 0 x d ξ exp ( ξ 2 ) is the probability integral. In the case of StreamLine PCDL, the range gate length is Δ R = 6   δ R = 18 m, and the longitudinal size of the probing volume [9,33] is Δ z = Q s 1 ( 0 ) = Δ R / erf ( Δ R / ( 2 Δ p ) ) 30 m. The transverse spectra S a ( κ ) are calculated from the transverse correlation functions
B a ( r ) = < V a ( z , y + r ) V a ( z , y ) > ,
where V a = V a < V a > , by the integral
S a ( κ ) = + d r B a ( r ) exp ( 2 π j κ r ) .

Appendix A.3. Comparison of the Transverse Spectra

Formulae (A1), (A4), (A7) and (A8) are used, respectively, to calculate V max ( z , y ) and V a ( z , y ) as functions of the transverse coordinate y at fixed z from the simulated 2D random field of radial velocity V r ( z , y ) . Then, the transverse correlation functions B max ( r ) and B a ( r ) are calculated according to (A6) and (A9). The averaging was performed over ensembles including not less than 1000 independent realizations of V r ( z , y ) . After that, the transverse spectra S max ( κ ) and S a ( κ ) are calculated. For comparison, we also calculated the transverse spectra of the radial velocity without spatial and temporal averaging S r ( κ ) = + d r B r ( r ) exp ( 2 π j κ r ) , where B r ( r ) =   < V r ( z , y + r ) V r ( z , y ) > , V r = V r   < V r > . The simulation of V r was carried out with the use of the von Karman model (see Equation (17) in [23]).
Figure A1. Transverse spectra of the radial velocity S r ( κ ) (black curve), S max ( κ ) (green curve), and S a ( κ ) (red curve). The blue dashed curve is for the Kolmogorov–Obukhov “−5/3” spectrum.
Remotesensing 13 02071 g0a1
Figure A1 shows an example of the spectra S r ( κ ) , S max ( κ ) , and S a ( κ ) obtained in the numerical experiment with the following wind turbulence parameters given: variance of the radial velocity σ r 2 = 1 (m/s)2 and the integral scale of turbulence L V = 100 m. In addition, the transverse Kolmogorov–Obukhov “−5/3” spectrum [34,35]
S r ( κ ) = 4 3 0.073 C K ε 2 / 3 κ 5 / 3 ,
where C K = 2 is the Kolmogorov constant, is shown by the dashed curve. Whence for the von Karman model, we have [23]
L V = 0.6973 σ r 3 / ε .
It can be observed from Figure A1 that the spectra S max ( κ ) and S a ( κ ) completely coincide. This means that Equations (A7) and (A8) provide correct averaging of the radial velocity over the probing volume and can be used when estimating the wind turbulence parameters from the spectra of the radial velocity, defined, as in the StreamLine lidar, from the maximum of the Doppler spectra. With the averaging function (A8), the spatial low pass filter transfer function in the longitudinal direction H ( κ z ) has the form [9]
H ( κ z ) =   | + d z Q s ( z ) exp ( 2 π j κ z z ) | 2 = [ exp { ( π Δ p κ z ) 2 } sin c ( π Δ R κ z ) ] 2 ,
One can also infer from Figure A1 that at the frequencies κ 1 / ( 2 L V ) = 0.005 m−1 corresponding to the inertial range of turbulence, where the blue dashed curve and the black solid curve coincide, the averaging of the radial velocity along the probing volume significantly understates the spectral density. Thus, at the frequency κ = 0.1 m−1 the amplitude of the spectra S max ( κ ) and S a ( κ ) is sevenfold less than the amplitude of S r ( κ ) . This should necessarily be taken into account when estimating the dissipation rate ε from spectra of turbulent fluctuations of the velocity measured by the lidar.
We conducted similar numerical experiments at different values of σ r 2 (from 0.01 to 4 m2/s2) and L V (from 30 to 300 m). In all the cases, very close results were obtained for S max ( κ ) and S a ( κ ) . This confirms the validity of the use of Equation (A13) for consideration of the averaging of the radial velocity over the probing volume in Equation (8).

Appendix B. Algorithm for Calculating the Error of Lidar Estimate of the Turbulence Energy Dissipation Rate

Using Equations (1), (3), (20) or (22), and (21) or (23), we can represent the ratio of the lidar estimate ε ^ to the true value ε of the dissipation rate in the form
ε ^ ε = [ 1 + 1 l 2 l 3 + 1 l = l 3 l 2 S ^ a ( f l ) S a ( f l ) ] 3 / 2 ,
where S a ( f l ) = ε 2 / 3 G ( f l ) follows from Equation(16);
S ^ a ( f l ) = S ˜ a ( f l ) + 2 ( Δ t / M 1 ) Re { J a ( f l ) J e * ( f l ) } + S ^ N ( f l ) S ¯ N ,
S ˜ a ( f l ) = S ˜ a ( f l ) S a ( f l ) ,
S ˜ a ( f l ) = ( Δ t / M 1 ) | J a ( f l ) | 2 ,
J a ( f l ) = m = 0 M 1 1 V a ( m Δ t ) exp ( 2 π j   l m / M 1 ) ,
J e ( f l ) = m = 0 M 1 1 V e ( m Δ t ) exp ( 2 π j   l m / M 1 ) ,
S ^ N ( f l ) = S ^ N ( f l ) S N ,
S ^ N ( f l ) = ( Δ t / M 1 ) | J e ( f l ) | 2 ,
S ^ N = S ^ N S N ,
S ¯ N = 1 M 1 / 2 l 1 + 1 l = l 1 M 1 / 2 S ^ N ( f l ) .
To calculate the fitting function G ( f l ) (Equation (16)), the lidar estimate U ^ obtained with some error is taken as the mean wind velocity U . This error is mainly due to the limited number of scans used to estimate the mean velocity. Assuming that the second term in the square brackets in Equation (A14) is much less than unity and the condition | U ^ U | / U < < 1 is fulfilled, we obtain the approximate formula for ( ε ^ ε ) / ε
ε ^ ε ε = 3 2 1 l 2 l 3 + 1 l = l 3 l 2 S ^ a ( f l ) S a ( f l ) + U ^ U U ,
which is used for calculation of the relative error of lidar estimate of dissipation rate
E ε = < ( ε ^ / ε 1 ) 2 > × 100 % .
When deriving Equation (A24), we took into account that at not very weak wind ( U ^ > 3 m/s) G ( f l ) ~ U ^ 2 / 3 in the frequency range, within which the dissipation rate is estimated.
With allowance made for the statistical independence of the first and second terms in the right-hand side of Equation (A24), statistics of the instrumental error and independence of estimates of different spectral components of the S ^ N ( f l ) (Equation(1)), after ensemble averaging and rather cumbersome transformations, we obtain from Equation (A14)
E ε = { 9 / 4 ( l 2 l 3 + 1 ) K [ 1 + < β 2 > E + 2 < β > E + l 2 l 3 + 1 M 1 / 2 l 1 + 1 ( < β > E ) 2 ] + 2 σ U 2 L U U 2 L } 1 / 2 × 100 % .
In Equation (A26),
β = S N / [ ε 2 / 3 G ( f l ) ] ,
L = ( 2 π h / tg φ scan + U T scan ) K s ,
where K = 3; the averaging operator < > E means < F ( l ) > E = ( l 2 l 3 + 1 ) 1 l = l 3 l 2 F ( l ) ; σ U 2 is variance, and L U is the integral scale of longitudinal correlation of horizontal component of the wind velocity vector; h is the measurement height, and K s = 4 is the number of scans used to estimate the mean wind velocity U ^ . For the variance σ U 2 , we use the relation σ U 2 = 3 σ w 2 [22,34,35] and the estimate σ w 2 by Equation (24). The integral scale is taken as L U = h [22,34,35]. In the calculations by Equation (A26), the parameters U , ε , σ e 2 , and σ w 2 are replaced with their experimental estimates U ^ ( h k , t n ) , ε ^ ( h k , t n ) , σ ^ e 2 ( h k , t n ) and σ ^ w 2 ( h k , t n ) . This allows us to find E ε ( h k , t n ) for different heights h k and times t n = t 0 + n T c .
Analysis of Equation (A26) demonstrates that the larger the instrumental error σ e and the weaker wind turbulence (smaller ε ), the larger the relative error of estimation of the dissipation rate E ε . The value of E ε can also be affected by the accuracy of lidar estimation of the mean velocity U . Despite the spatial averaging over the circle of the cone base at the measurement height h k and the temporal averaging over time T scan K s , the error of lidar estimation of the mean velocity can be large at strong fluctuations of wind velocity and give the major contribution into E ε .
Equation (A26) is obtained under the assumption that the second term in the square brackets in Equation (A14) is much less than unity. This means that the relative error E ε calculated by Equation (A26) should not exceed at least 30%. Otherwise, the calculated error E ε is overestimated. At the very weak wind turbulence and strongly noised lidar data, the estimation of the dissipation rate based on Equation (19) may be impossible if the summation in Equation (21) gives a negative value since S ^ N ( 1 ) > S ^ L ( f l ) , wherein the probability of bad (false) lidar estimate of the radial velocity [9,36] can be nearly zero.

References

  1. Eberhard, W.L.; Cupp, R.E.; Healy, K.R. Doppler lidar measurement of profiles of turbulence and momentum flux. J. Atmos. Ocean. Technol. 1989, 6, 809–819. [Google Scholar] [CrossRef] [Green Version]
  2. Frehlich, R.G.; Hannon, S.M.; Henderson, S.W. Coherent Doppler lidar measurements of wind field statistics. Bound. Layer Meteorol. 1998, 86, 223–256. [Google Scholar] [CrossRef]
  3. Smalikho, I.; Köpp, F.; Rahm, S. Measurement of atmospheric turbulence by 2-μm Doppler lidar. J. Atmos. Ocean. Technol. 2005, 22, 1733–1747. [Google Scholar] [CrossRef]
  4. Frehlich, R.G.; Meillier, Y.; Jensen, M.L.; Balsley, B.; Sharman, R. Measurements of boundary layer profiles in urban environment. J. Appl. Meteorol. Climatol. 2006, 45, 821–837. [Google Scholar] [CrossRef]
  5. Banta, R.M.; Pichugina, Y.L.; Brewer, W.A. Turbulent velocity-variance profiles in the stable boundary layer generated by a nocturnal low-level jet. J. Atmos. Sci. 2006, 63, 2700–2719. [Google Scholar] [CrossRef] [Green Version]
  6. Banakh, V.A.; Smalikho, I.N.; Pichugina, Y.L.; Brewer, W.A. Representativeness of measurements of the dissipation rate of turbulence energy by scanning Doppler lidar. Atmos. Ocean. Opt. 2010, 23, 48–54. [Google Scholar] [CrossRef]
  7. O’Connor, E.J.; Illingworth, A.J.; Brooks, I.M.; Westbrook, C.D.; Hogan, R.J.; Davies, F.; Brooks, B.J. A method for estimating the kinetic energy dissipation rate from a vertically pointing Doppler lidar, and independent evaluation from balloon-borne in situ measurements. J. Atmos. Ocean. Technol. 2010, 27, 1652–1664. [Google Scholar] [CrossRef] [Green Version]
  8. Sathe, A.; Mann, J. A review of turbulence measurements using ground-based wind lidars. Atmos. Meas. Tech. 2013, 6, 3147–3167. [Google Scholar] [CrossRef] [Green Version]
  9. Banakh, V.A.; Smalikho, I.N. Coherent Doppler Wind Lidars in a Turbulent Atmosphere; Artech House: Boston, MA, USA; London, UK, 2013; p. 248. ISBN 978-1-60807-667-3. [Google Scholar]
  10. Sathe, A.; Mann, J.; Vasiljevic, N.; Lea, G. A six-beam method to measure turbulence statistics using ground-based wind lidars. Atmos. Meas. Tech. Discuss. 2014, 7, 10327–10359. [Google Scholar] [CrossRef] [Green Version]
  11. Newman, J.F.; Klein, P.M.; Wharton, S.; Sathe, A.; Bonin, T.A.; Chilson, P.B.; Muschinski, A. Evaluation of three lidar scanning strategies for turbulence measurements. Atmos. Meas. Tech. 2016, 9, 1993–2013. [Google Scholar] [CrossRef] [Green Version]
  12. Banakh, V.A.; Smalikho, I.N. Lidar observations of atmospheric internal waves in the boundary layer of atmosphere on the coast of Lake Baikal. Atmos. Meas. Tech. 2016, 9, 5239–5248. [Google Scholar] [CrossRef] [Green Version]
  13. Bonin, T.A.; Choukulkar, A.; Brewer, W.A.; Sandberg, S.P.; Weickmann, A.M.; Pichugina, Y.; Banta, R.M.; Oncley, S.P.; Wolfe, D.E. Evaluation of turbulence measurement techniques from a single doppler lidar. Atmos. Meas. Tech. 2017, 10, 3021–3039. [Google Scholar] [CrossRef] [Green Version]
  14. Smalikho, I.N.; Banakh, V.A. Measurements of wind turbulence parameters by a conically scanning coherent Doppler lidar in the atmospheric boundary layer. Atmos. Meas. Tech. 2017, 10, 4191–4208. [Google Scholar] [CrossRef] [Green Version]
  15. Bodini, N.; Lundquist, J.K.; Newsom, R.K. Estimation of turbulence dissipation rate and its variability from sonic anemometer and wind Doppler lidar during the XPIA field campaign. Atmos. Meas. Tech. 2018, 11, 4291–4308. [Google Scholar] [CrossRef] [Green Version]
  16. Jia, M.; Yuan, J.; Yuan, J.; Wang, C.; Wang, C.; Xia, H.; Xia, H.; Wu, Y.; Zhao, L.; Wei, T.; et al. Long-lived high-frequency gravity waves in the atmospheric boundary layer: Observations and simulations. Atmos. Chem. Phys. 2019, 19, 15431–15446. [Google Scholar] [CrossRef] [Green Version]
  17. Yuan, J.; Xia, H.; Wei, T.; Wang, L.; Yue, B.; Wu, Y. Identifying cloud, precipitation, windshear, and turbulence by deep analysis of power spectrum of coherent Doppler wind lidar. Opt. Express 2020, 28, 37406–37418. [Google Scholar] [CrossRef] [PubMed]
  18. Smalikho, I.N.; Banakh, V.A. Effect of wind transport of turbulent inhomogeneities on estimation of the turbulence energy dissipation rate from measurements by a conically scanning coherent Doppler lidar. Remote Sens. 2020, 12, 2802. [Google Scholar] [CrossRef]
  19. Banakh, V.A.; Smalikho, I.N. Lidar Studies of wind turbulence in the stable atmospheric boundary layer. Remote Sens. 2018, 10, 1219. [Google Scholar] [CrossRef] [Green Version]
  20. Pearson, G.; Davies, F.; Collier, C. An analysis of performance of the UFAM Pulsed Doppler lidar for the observing the boundary layer. J. Atmos. Ocean. Technol. 2009, 26, 240–250. [Google Scholar] [CrossRef]
  21. Taylor, G.I. The spectrum of turbulence. Proc. R. Soc. Lond. Ser. A Math. Phys. Sci. 1938, 164, 476–490. [Google Scholar] [CrossRef] [Green Version]
  22. Byzova, N.L.; Ivanov, V.N.; Garger, E.K. Turbulence in Atmospheric Boundary Layer; Gidrometeoizdat: Leningrad, Russia, 1989. [Google Scholar]
  23. Smalikho, I.N.; Banakh, V.A. Accuracy of estimation of the turbulent energy dissipation rate from wind measurements with a conically scanning pulsed coherent Doppler lidar. Part I. Algorithm of data processing. Atmos. Ocean. Opt. 2013, 26, 404–410. [Google Scholar] [CrossRef]
  24. Vinnichenko, N.K.; Pinus, N.Z.; Shmeter, R.M.; Shur, G.N. Turbulence in the Free Atmosphere; Gidrometeoizdat: Leningrad, Russia, 1976. [Google Scholar]
  25. Smalikho, I.N. Accuracy of the turbulent energy dissipation rate estimation from the temporal spectrum of wind velocity fluctuations. Atmos. Ocean. Opt. 1997, 10, 559–563. [Google Scholar]
  26. Vakkari, V.; O’Connor, E.J.; Nisantzi, A.; Mamouri, R.E.; Hadjimitsis, D.G. Low-level mixing height detection in coastal locations with a scanning Doppler lidar. Atmos. Meas. Tech. 2015, 8, 1875–1885. [Google Scholar] [CrossRef] [Green Version]
  27. Banakh, V.A.; Smalikho, I.N.; Falits, A.V. Estimation of the height of the turbulent mixing layer from data of Doppler lidar measurements using conical scanning by a probe beam. Atmos. Meas. Tech. 2021, 14, 1511–1524. [Google Scholar] [CrossRef]
  28. Banakh, V.A.; Smalikho, I.N.; Falits, A.V. Estimation of the turbulence energy dissipation rate in the atmospheric boundary layer from measurements of the radial wind velocity by micropulse coherent Doppler lidar. Opt. Express 2017, 25, 22679–22692. [Google Scholar] [CrossRef] [PubMed]
  29. Banakh, V.A.; Smalikho, I.N. Lidar estimates of the anisotropy of wind turbulence in a stable atmospheric boundary layer. Remote Sens. 2019, 11, 2115. [Google Scholar] [CrossRef] [Green Version]
  30. Banakh, V.A.; Smalikho, I.N.; Falits, A.V. Wind-Temperature regime and wind turbulence in a stable boundary layer of the atmosphere: Case study. Remote Sens. 2020, 12, 955. [Google Scholar] [CrossRef] [Green Version]
  31. Banakh, V.A.; Brewer, W.A.; Pichugina, Y.L.; Smalikho, I.N. Measurements of wind velocity and direction with coherent Doppler lidar in conditions of a weak echo signal. Atmos. Ocean. Opt. 2010, 23, 381–388. [Google Scholar] [CrossRef]
  32. Frehlich, R.G. Effect of wind turbulence on coherent Doppler lidar performance. J. Atmos. Ocean. Technol. 1997, 14, 54–75. [Google Scholar] [CrossRef]
  33. Smalikho, I.N.; Banakh, V.A.; Holzäpfel, F.; Rahm, S. Method of radial velocities for the estimation of aircraft wake vortex parameters from data measured by coherent Doppler lidar. Opt. Express 2015, 23, A1194–A1207. [Google Scholar] [CrossRef] [Green Version]
  34. Monin, A.S.; Yaglom, A.M. Statistical Fluid Mechanics, Volume II: Mechanics of Turbulence; M.I.T. Press: Cambridge, MA, USA, 1971. [Google Scholar]
  35. Lumley, J.L.; Panofsky, H.A. The Structure of Atmospheric Turbulence; Interscience Publishers: New York, NY, USA, 1964. [Google Scholar]
  36. Frehlich, R.G.; Yadlowsky, M.J. Performance of mean-frequency estimators for Doppler radar and lidar. J. Atmos. Ocean. Technol. 1994, 11, 1217–1230. [Google Scholar] [CrossRef] [Green Version]
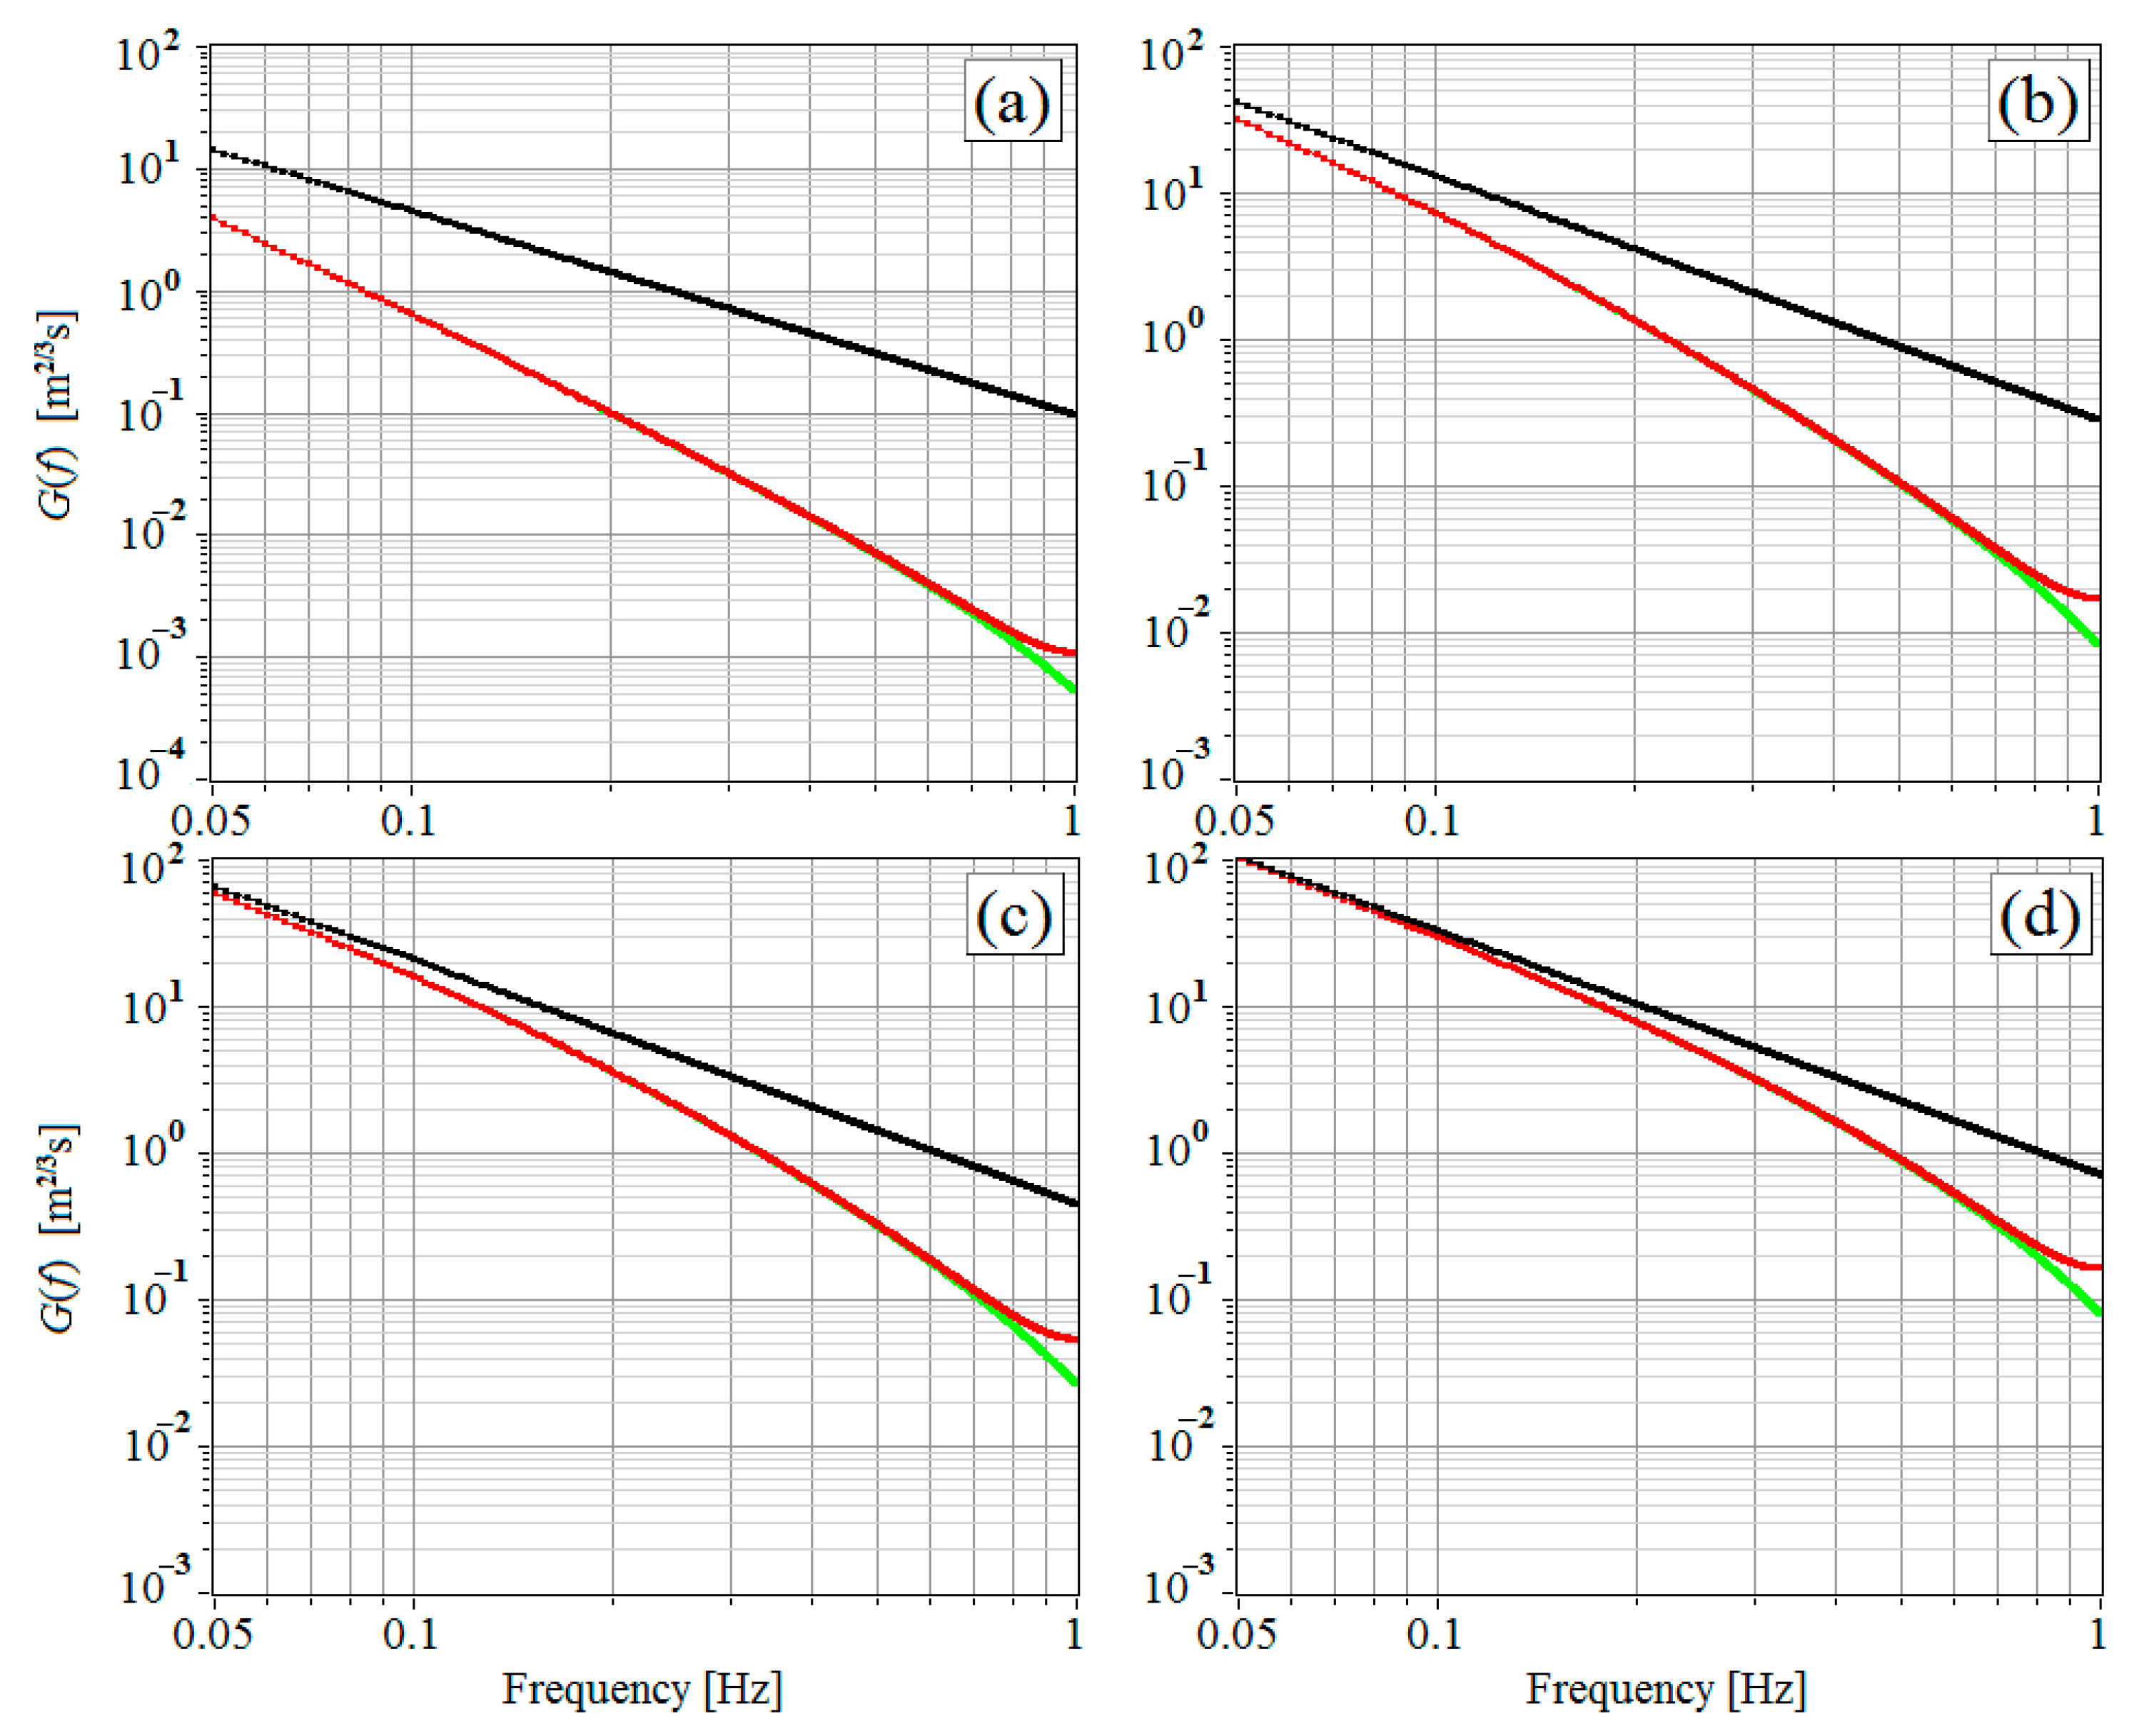
Figure 1. Fitting functions G K ( f l ) (black curves), G 1 ( f l ) (green curves), and G ( f l ) (red curves) at the mean wind velocity U = 1 m/s (a), 5 m/s (b), 10 m/s (c), and 20 m/s (d).
Remotesensing 13 02071 g001
Figure 2. Experimental spectral density of the radial velocity at heights of 99 m, 351 m, and 603 m (black curves) and the noise component S N (green dashed line). Measurements from 08:42 to 09:12 local time (UTC/GMT+7) on 28 June 2020. The blue and pink curves are for calculated spectra S L ( f l ) and S K ( f l ) , respectively.
Remotesensing 13 02071 g002
Figure 3. Vertical profiles of S N ¯ R (a), σ e (b), U (c), θ V (d), ε (e), E ε (f), σ w 2 (g), and L V (h) obtained from lidar measurements from 08:42 to 09:12 LT on 28 June 2020.
Remotesensing 13 02071 g003
Figure 4. Height–temporal distributions of the signal-to-noise ratio (a), instrumental error of estimation of the radial velocity (b), mean wind velocity (c), variance of the vertical component of wind velocity vector (d), turbulent energy dissipation rate (e), and relative error of lidar estimation of the dissipation rate (f) as determined from data on 28 June 2020.
Remotesensing 13 02071 g004
Figure 5. Height–temporal distributions of ε 1 ( h k , t n ) (a), ε 2 ( h k , t n ) (b), E ε 1 ( h k , t n ) (c), and E ε 2 ( h k , t n ) (d); comparison of lidar estimates of the dissipation rate ε 1 and ε 2 (e). Data obtained on 28 June 2020.
Remotesensing 13 02071 g005
Figure 6. Height–temporal distributions of the mean wind velocity (a), variance of the vertical component of the wind velocity vector (b), turbulent energy dissipation rate (c), and relative error of lidar estimation of the dissipation rate (d) starting from 21:45 LT on 10 July 2020. The red curve shows the time series of the height of the maximum of mean velocity.
Remotesensing 13 02071 g006
Figure 7. Vertical profiles of the mean wind velocity (a), variance of the vertical component of the wind velocity vector (b), turbulent energy dissipation rate (c), and relative error of lidar estimation of the dissipation rate (d) at 00:00 (black curves), 01:00 (red curves), 02:00 (green curves), and 03:00 LT (blue curves) on 11 July 2020. Data are taken from Figure 6.
Remotesensing 13 02071 g007
Figure 8. Height–temporal distributions of the signal-to-noise ratio (a), instrumental error of estimation of the radial velocity (b), mean wind velocity (c), variance of the vertical component of wind velocity vector (d), turbulent energy dissipation rate (e), and relative error of lidar estimation of the dissipation rate (f). Data obtained on 2 July 2020.
Remotesensing 13 02071 g008
Figure 9. Height–temporal distribution and time series of the radial velocity at heights of 207, 405, and 603 m as obtained from measurements with the vertically pointing lidar for an hour starting from 03:00 LT on 2 July 2020.
Remotesensing 13 02071 g009
Figure 10. Experimental spectral densities of vertical velocity (black curves) and noise component S N (green dashed lines) at different heights as calculated from data of the 2D distribution in Figure 9. Measurements from 03:02 to 03:33 LT on 2 July 2020. Blue and pink curves are for the results of calculation of, respectively S L ( f l ) and S K ( f l ) .
Remotesensing 13 02071 g010
Figure 11. Vertical profiles of the mean wind velocity (a), variance of the vertical component of wind velocity vector (b), turbulent energy dissipation rate (c), and relative error of lidar estimation of the dissipation rate (d) as calculated from data of the 2D distribution in Figure 9. Measurements from 03:02 to 03:33 LT on 2 July 2020.
Remotesensing 13 02071 g011
Figure 12. Time series (a), normalized spectrum in the low-frequency range (b), and spectral density of fluctuations (c) of the radial velocity at a height of 477 m; vertical profiles of the mean wind velocity (d), variance of the vertical component of the wind velocity vector (e), turbulent energy dissipation rate (f), and relative error of lidar estimation of the dissipation rate (g). Red lines in plots (dg) mark height 477 m. Measurements from 05:42 to 06:12 LT on 2 July 2020.
Remotesensing 13 02071 g012
Table 1. Ratio of the estimates of the turbulence energy dissipation rate obtained with and without regard for the averaging of the radial velocity over the probing volume.
U [m/s] 151020
η 14.12.21.451.16
Publisher’s Note: MDPI stays neutral with regard to jurisdictional claims in published maps and institutional affiliations.