
Response of Landscape Evolution to Human Disturbances in the Coastal Wetlands in Northern Jiangsu Province, China


Abstract
1. Introduction
2. Data and Methods
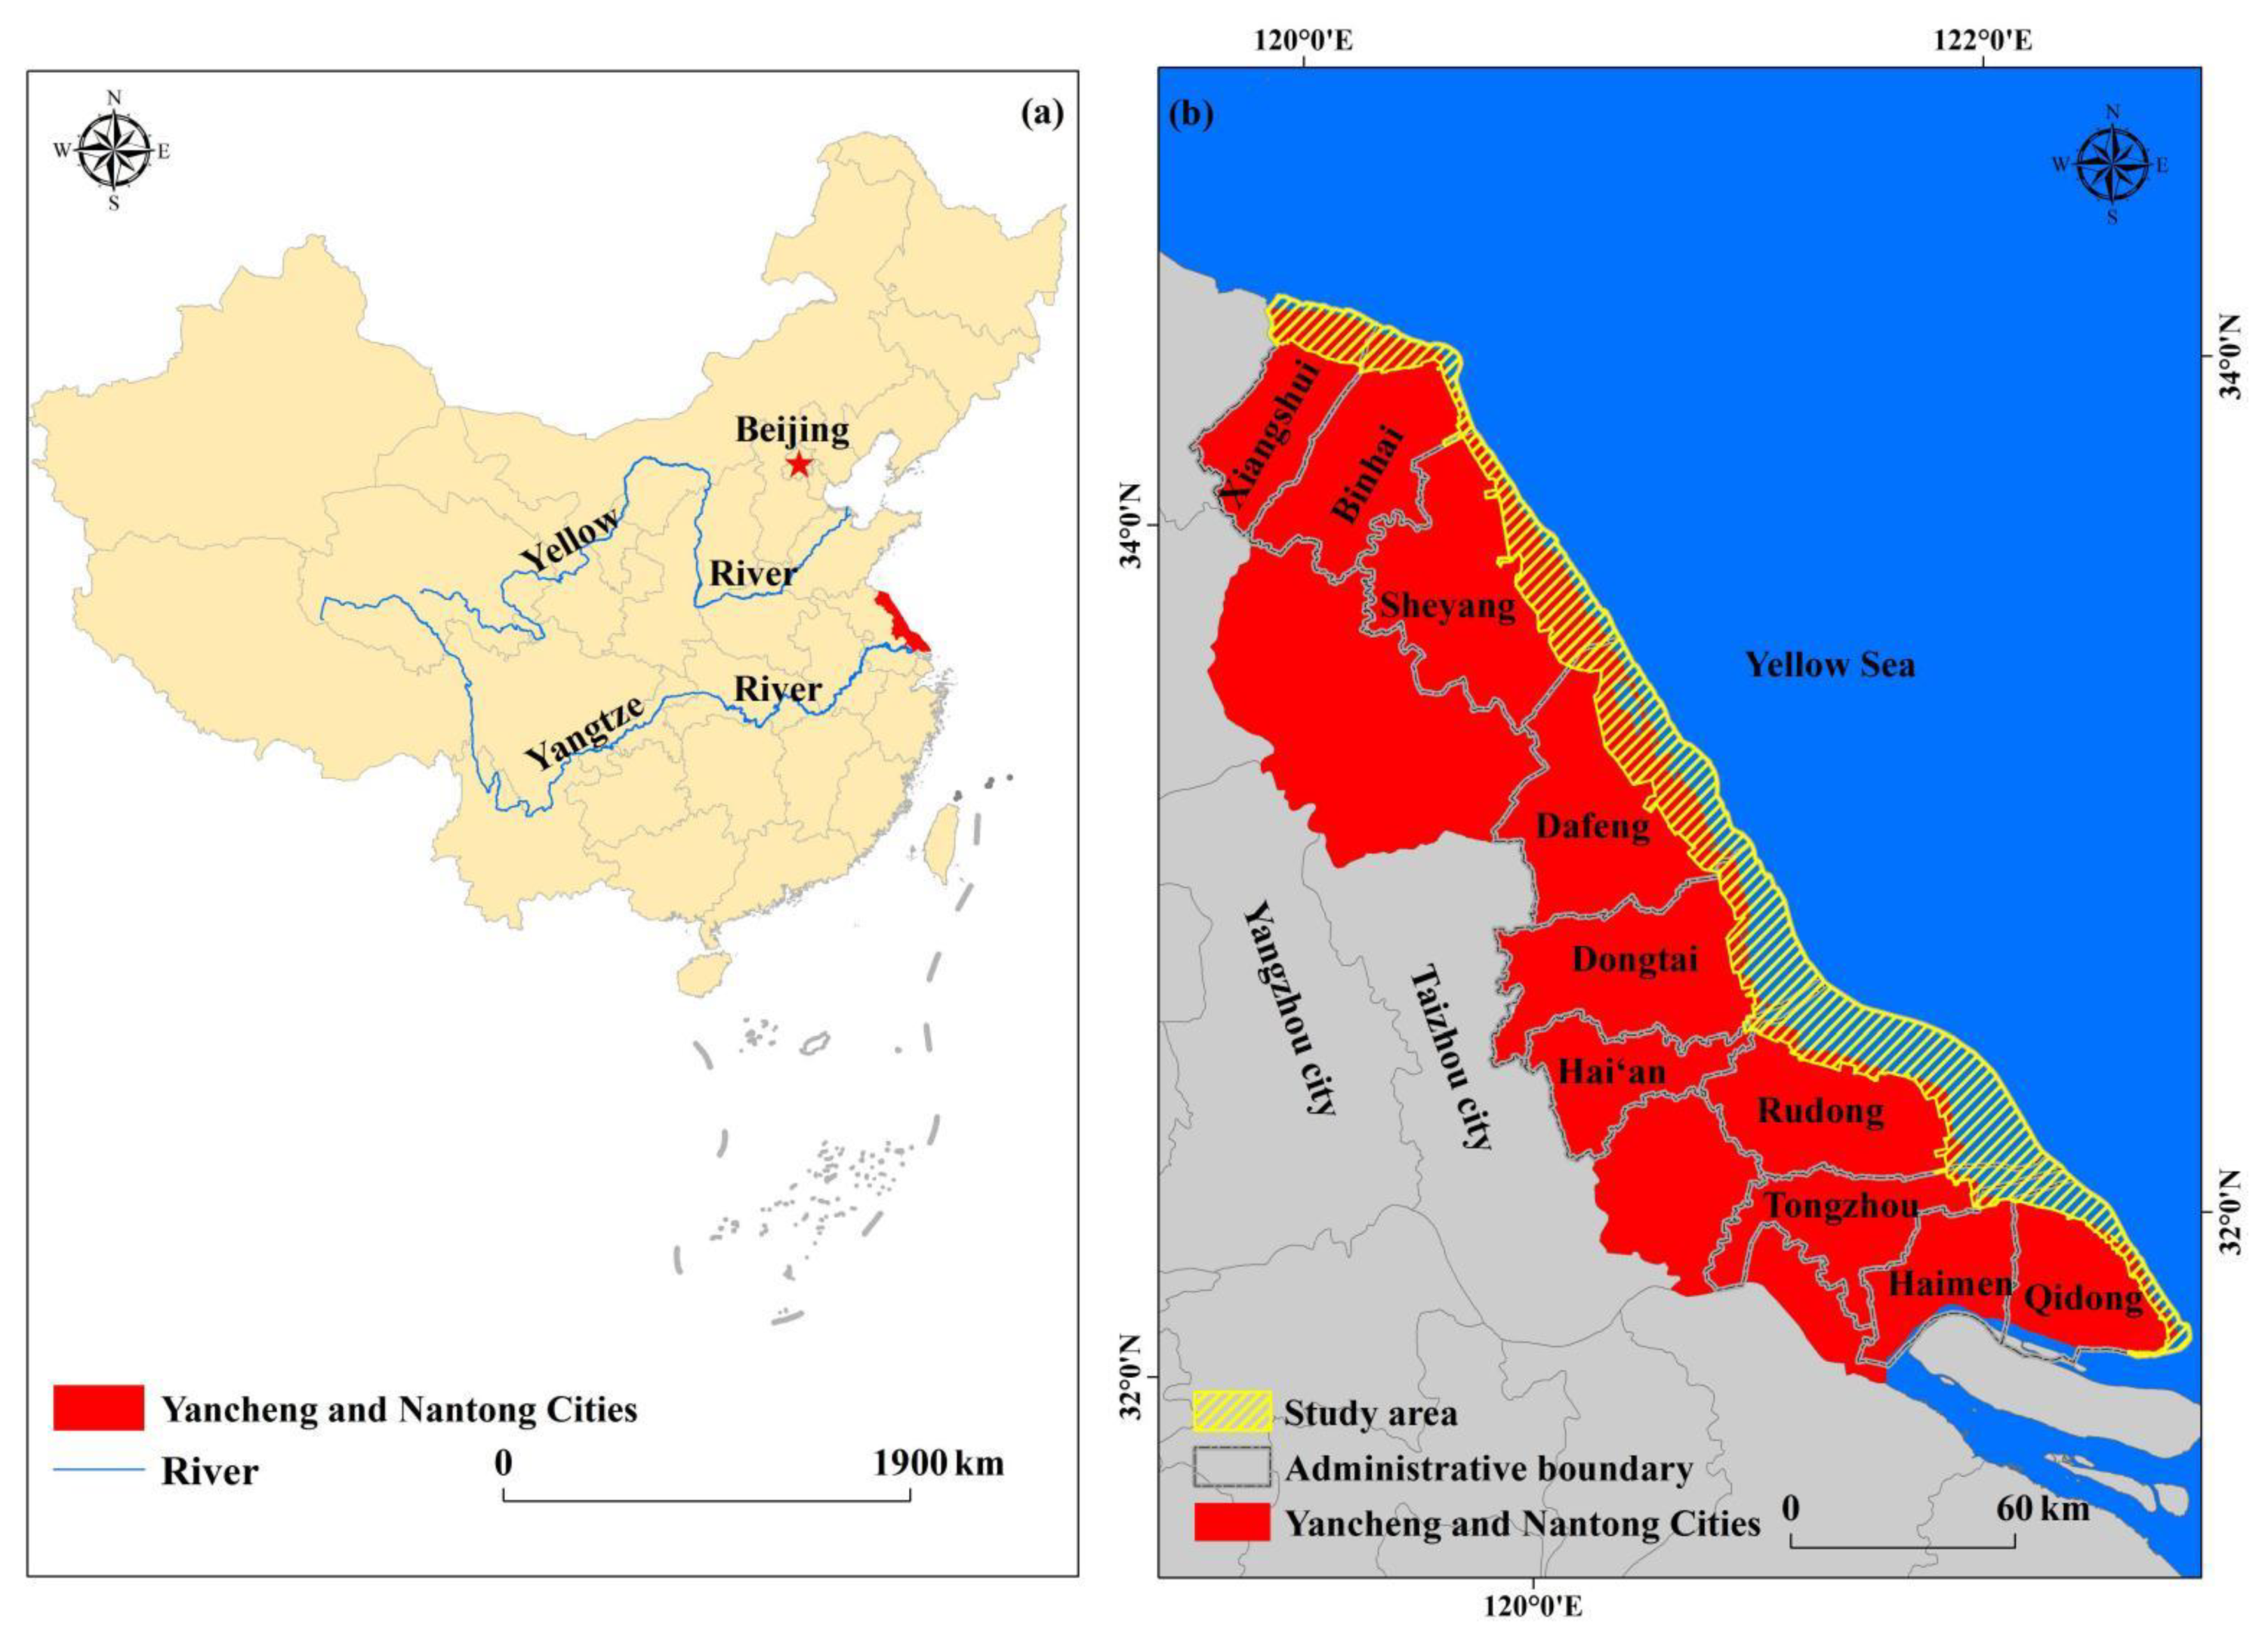
2.1. Study Area
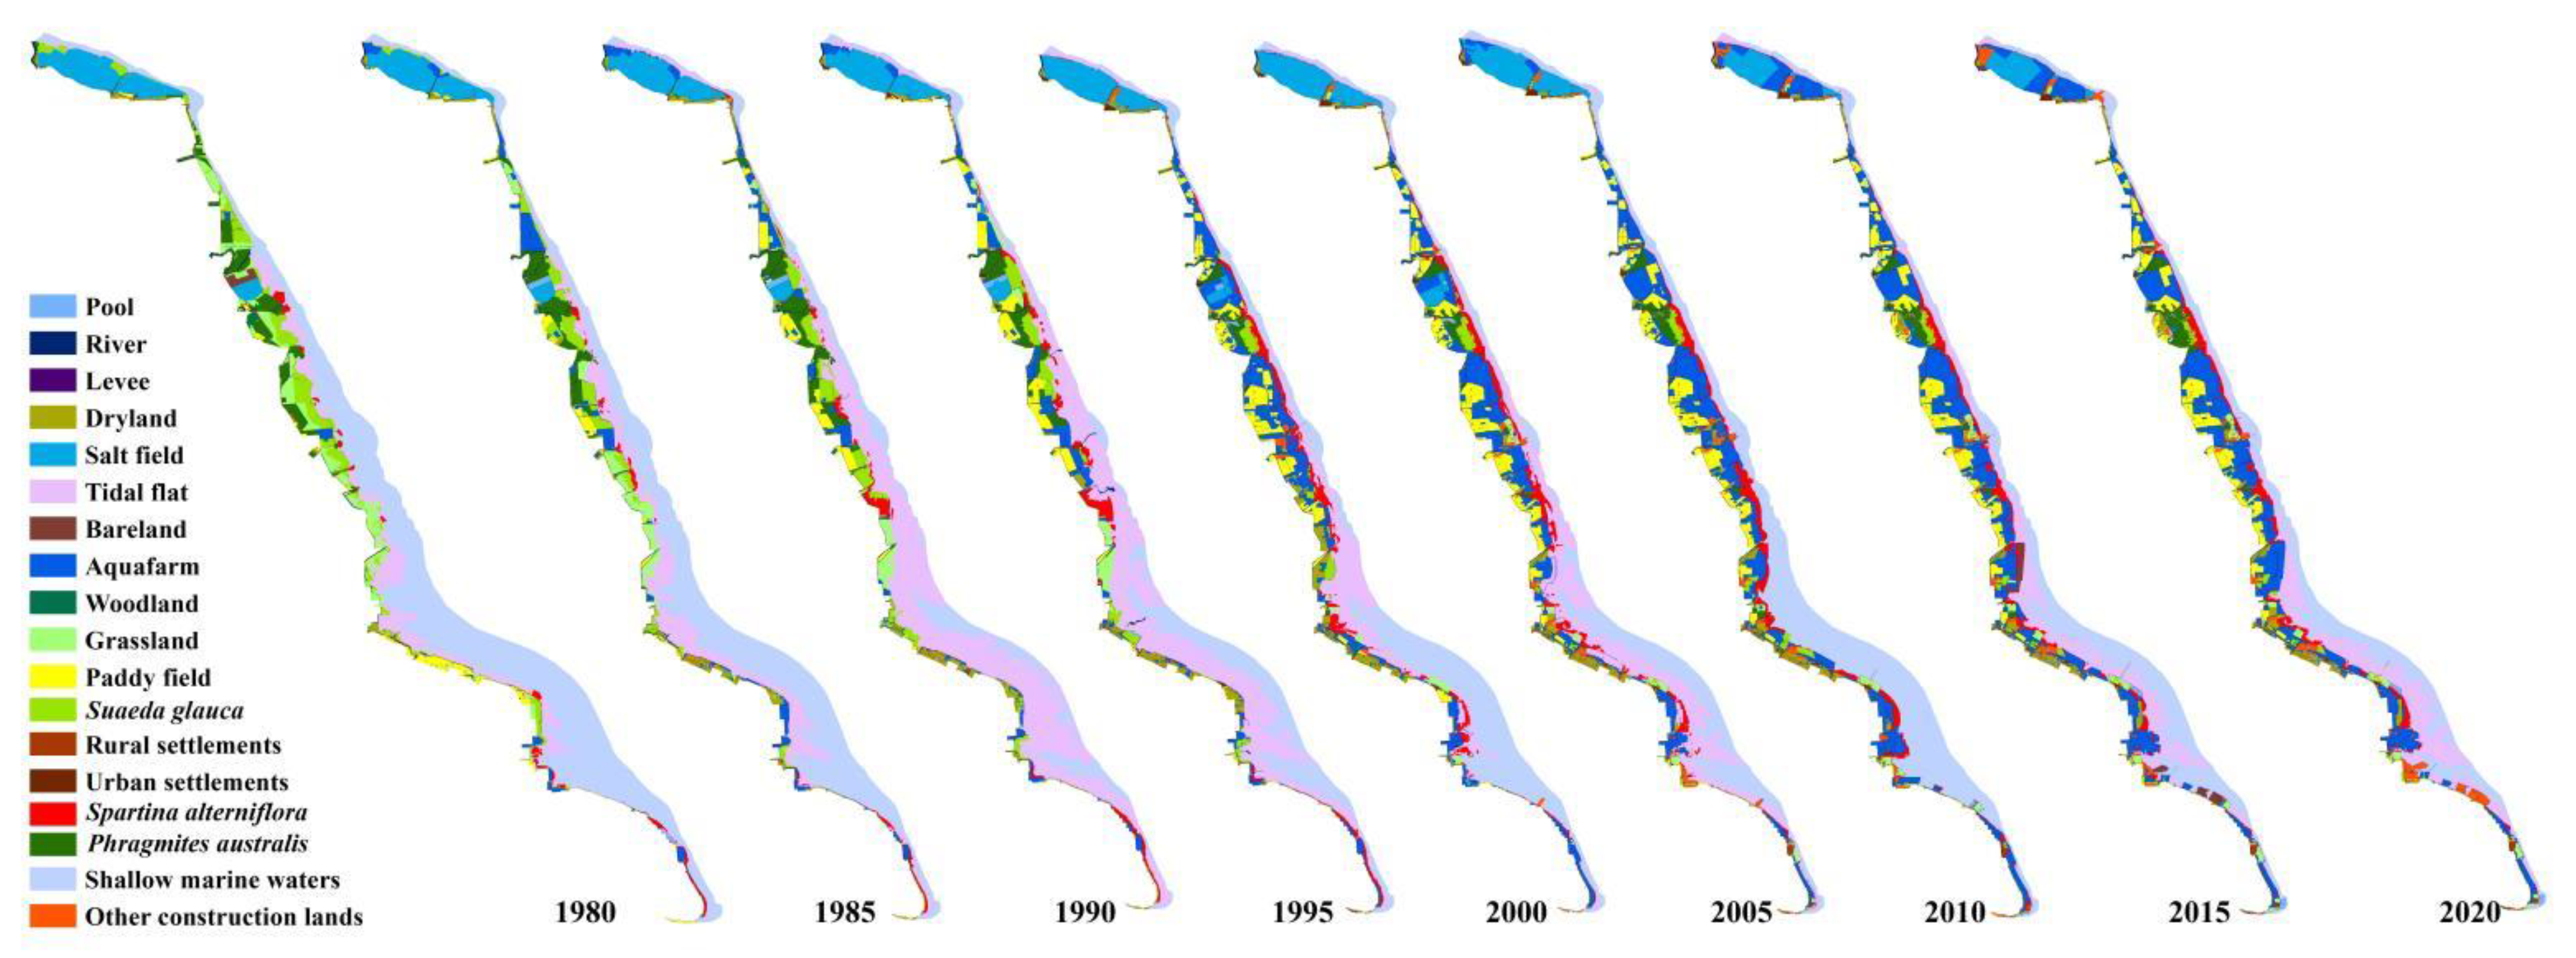
2.2. Landscape Data
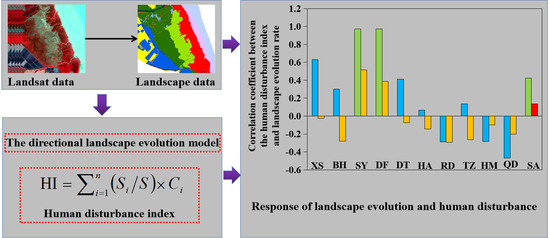
2.3. Landscape Evolution Evaluation Method
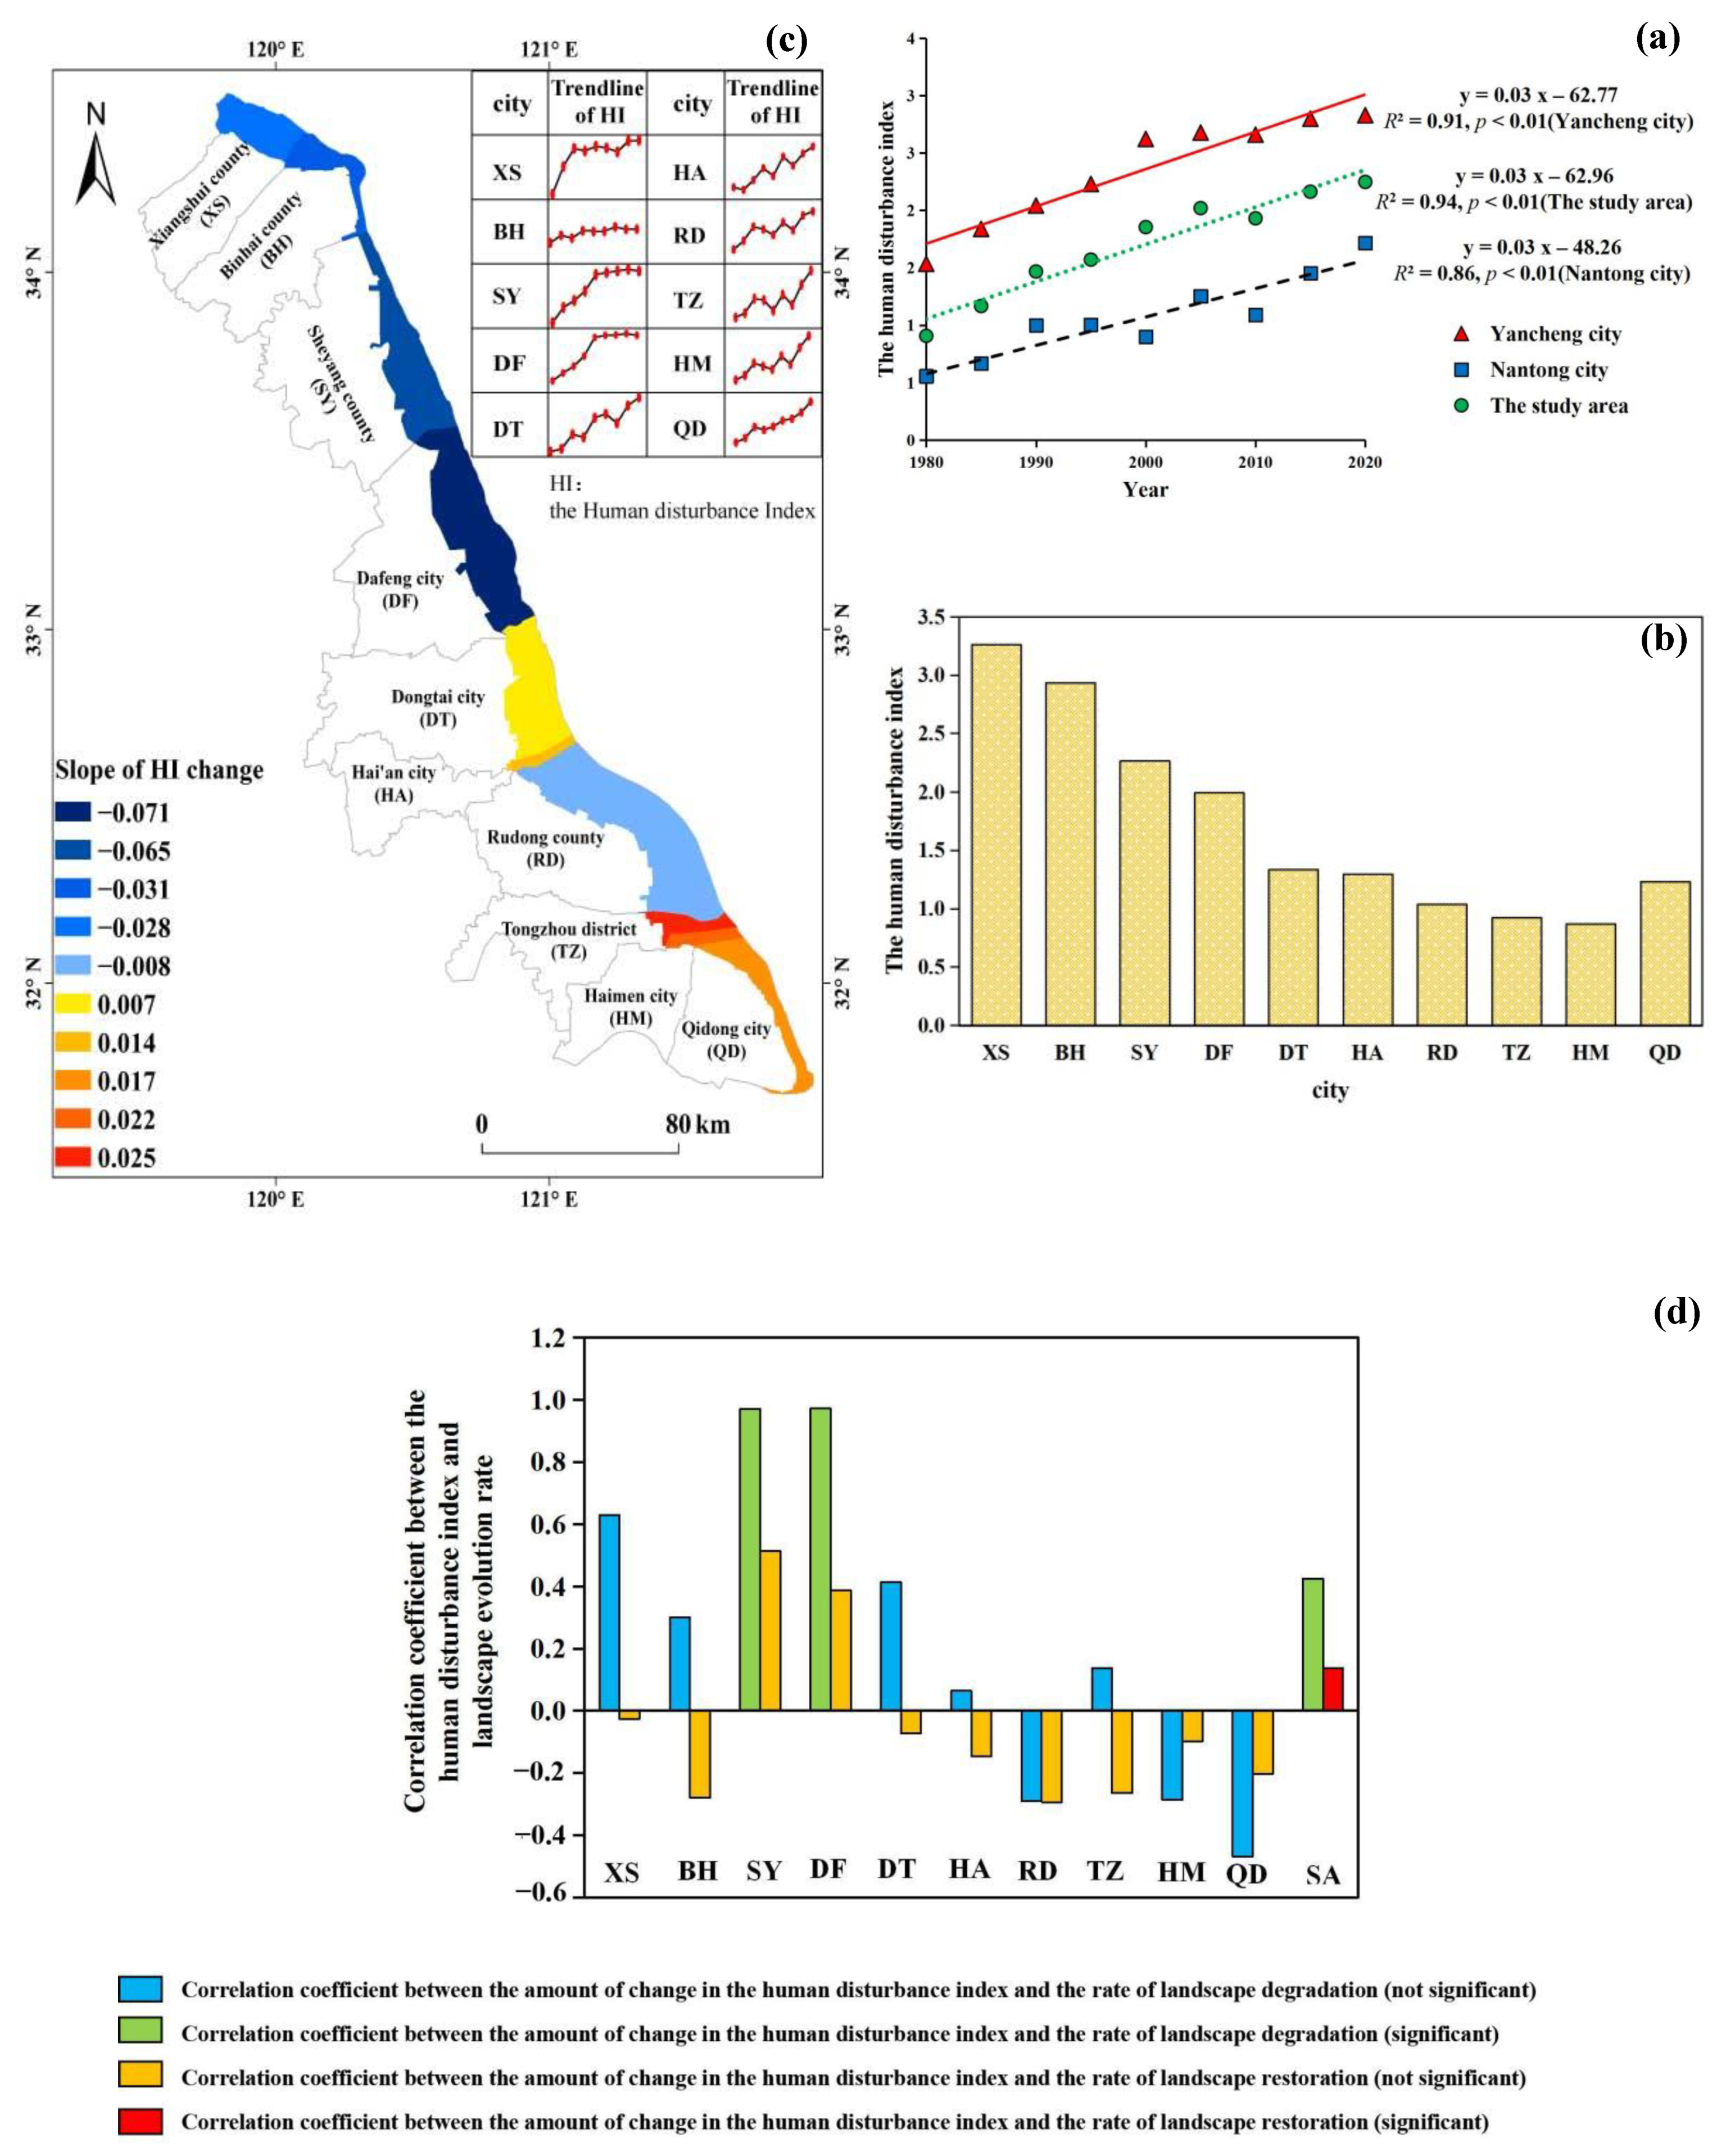
2.4. Human Disturbance Index
2.5. Statistical Analysis
2.6. Landscape Indices
- (1)
- Area-MN is commonly used for landscape fragmentation evaluation. Smaller Area-MN values represent a more fragmented landscape:where is the total area of patches (km2) and is the number of patches.
- (2)
- AI is used to characterize the degree of aggregation and non-randomness. Larger AI values represent higher landscape aggregation and better connectivity:where is the total number of patch types; is the number of nodes between pixels of patch type based on the single-fold method; is the area ratio of the landscape comprised of patch type .
3. Results
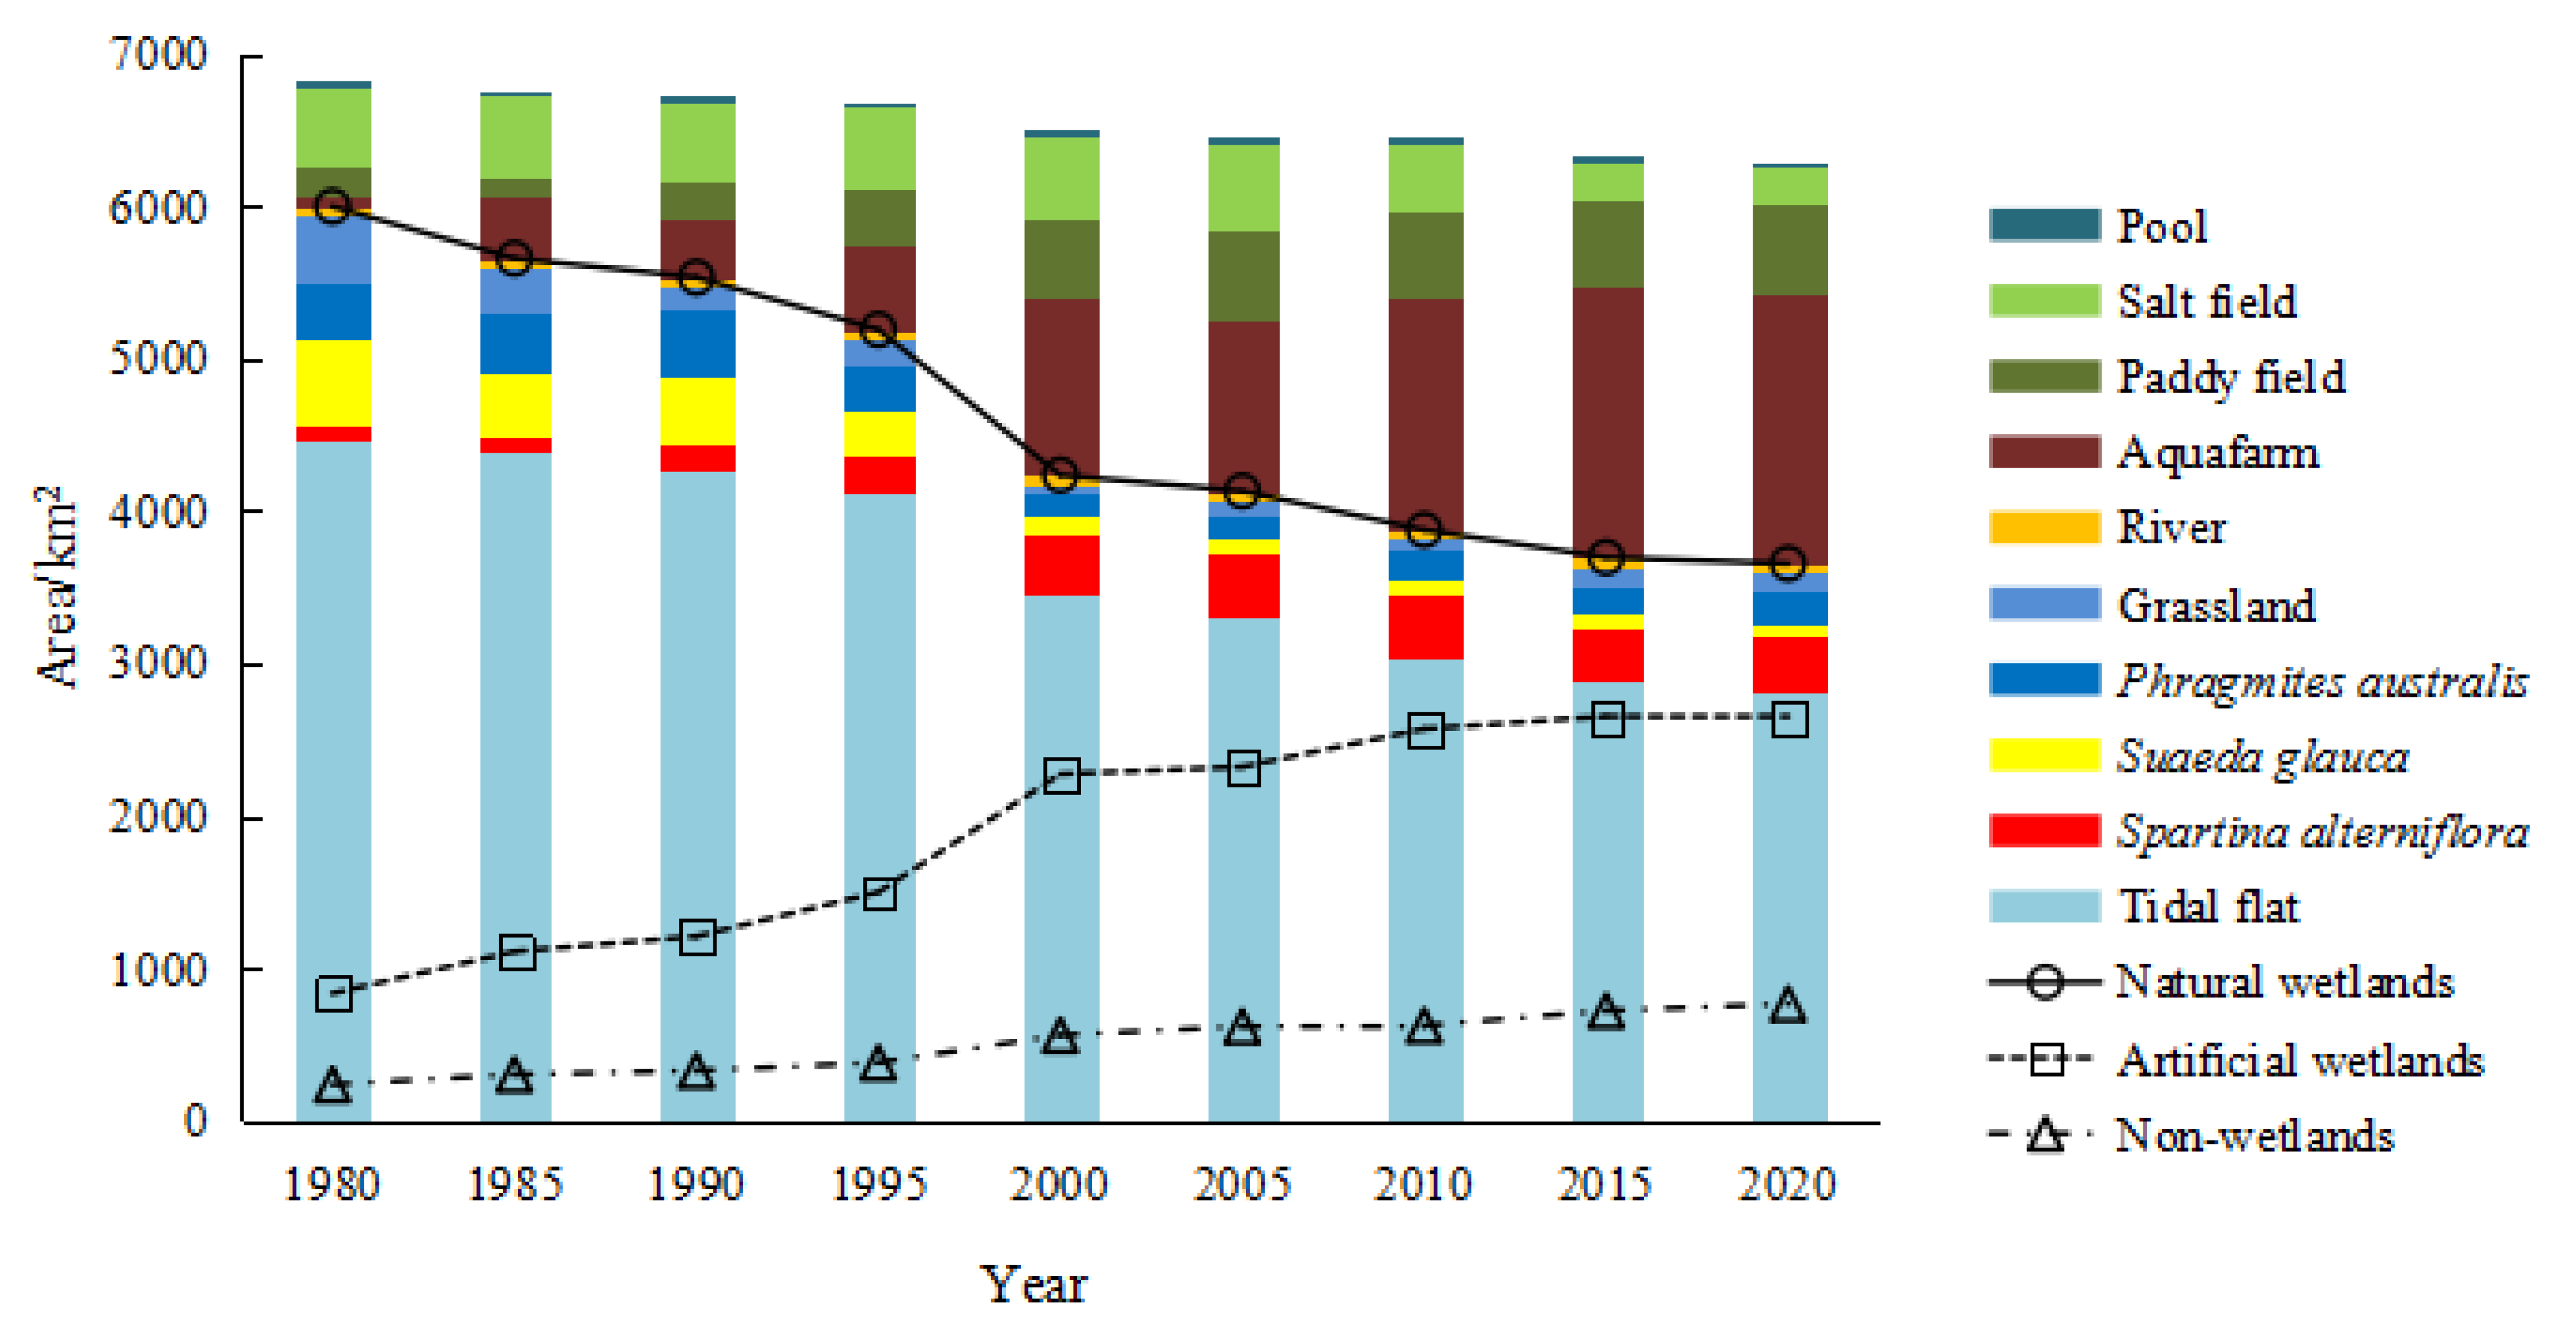
3.1. Analysis of Area Change
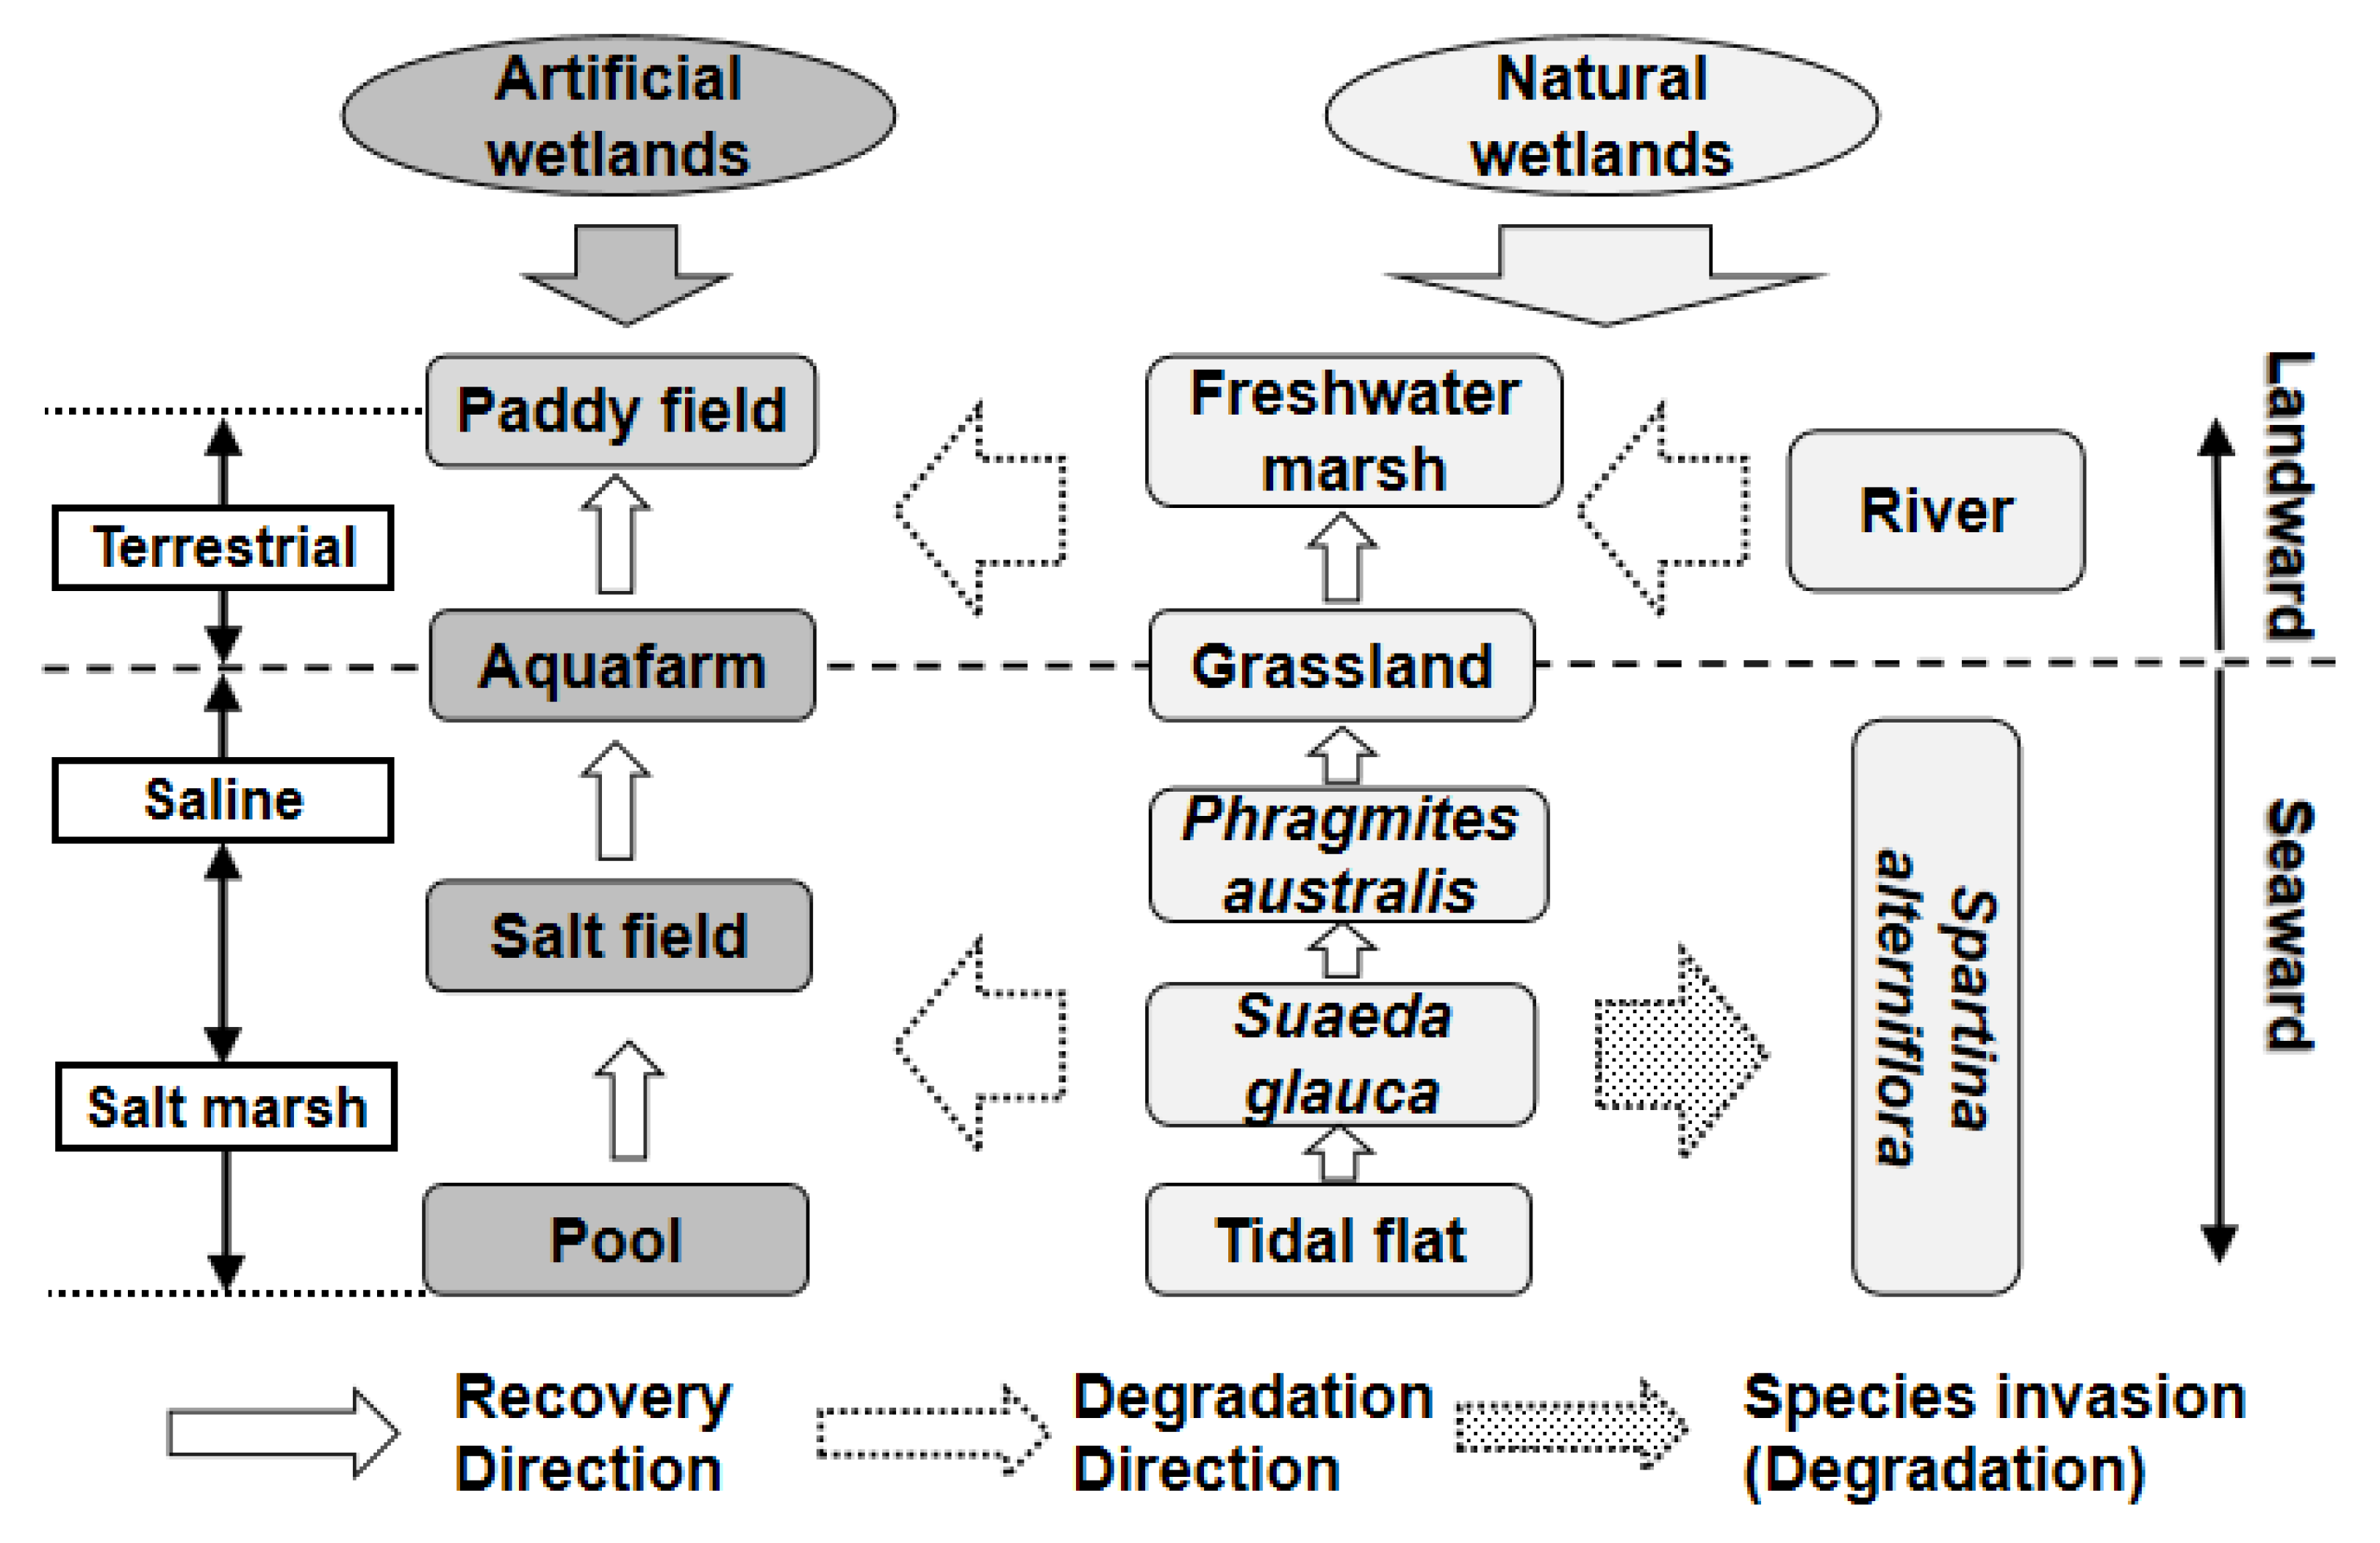
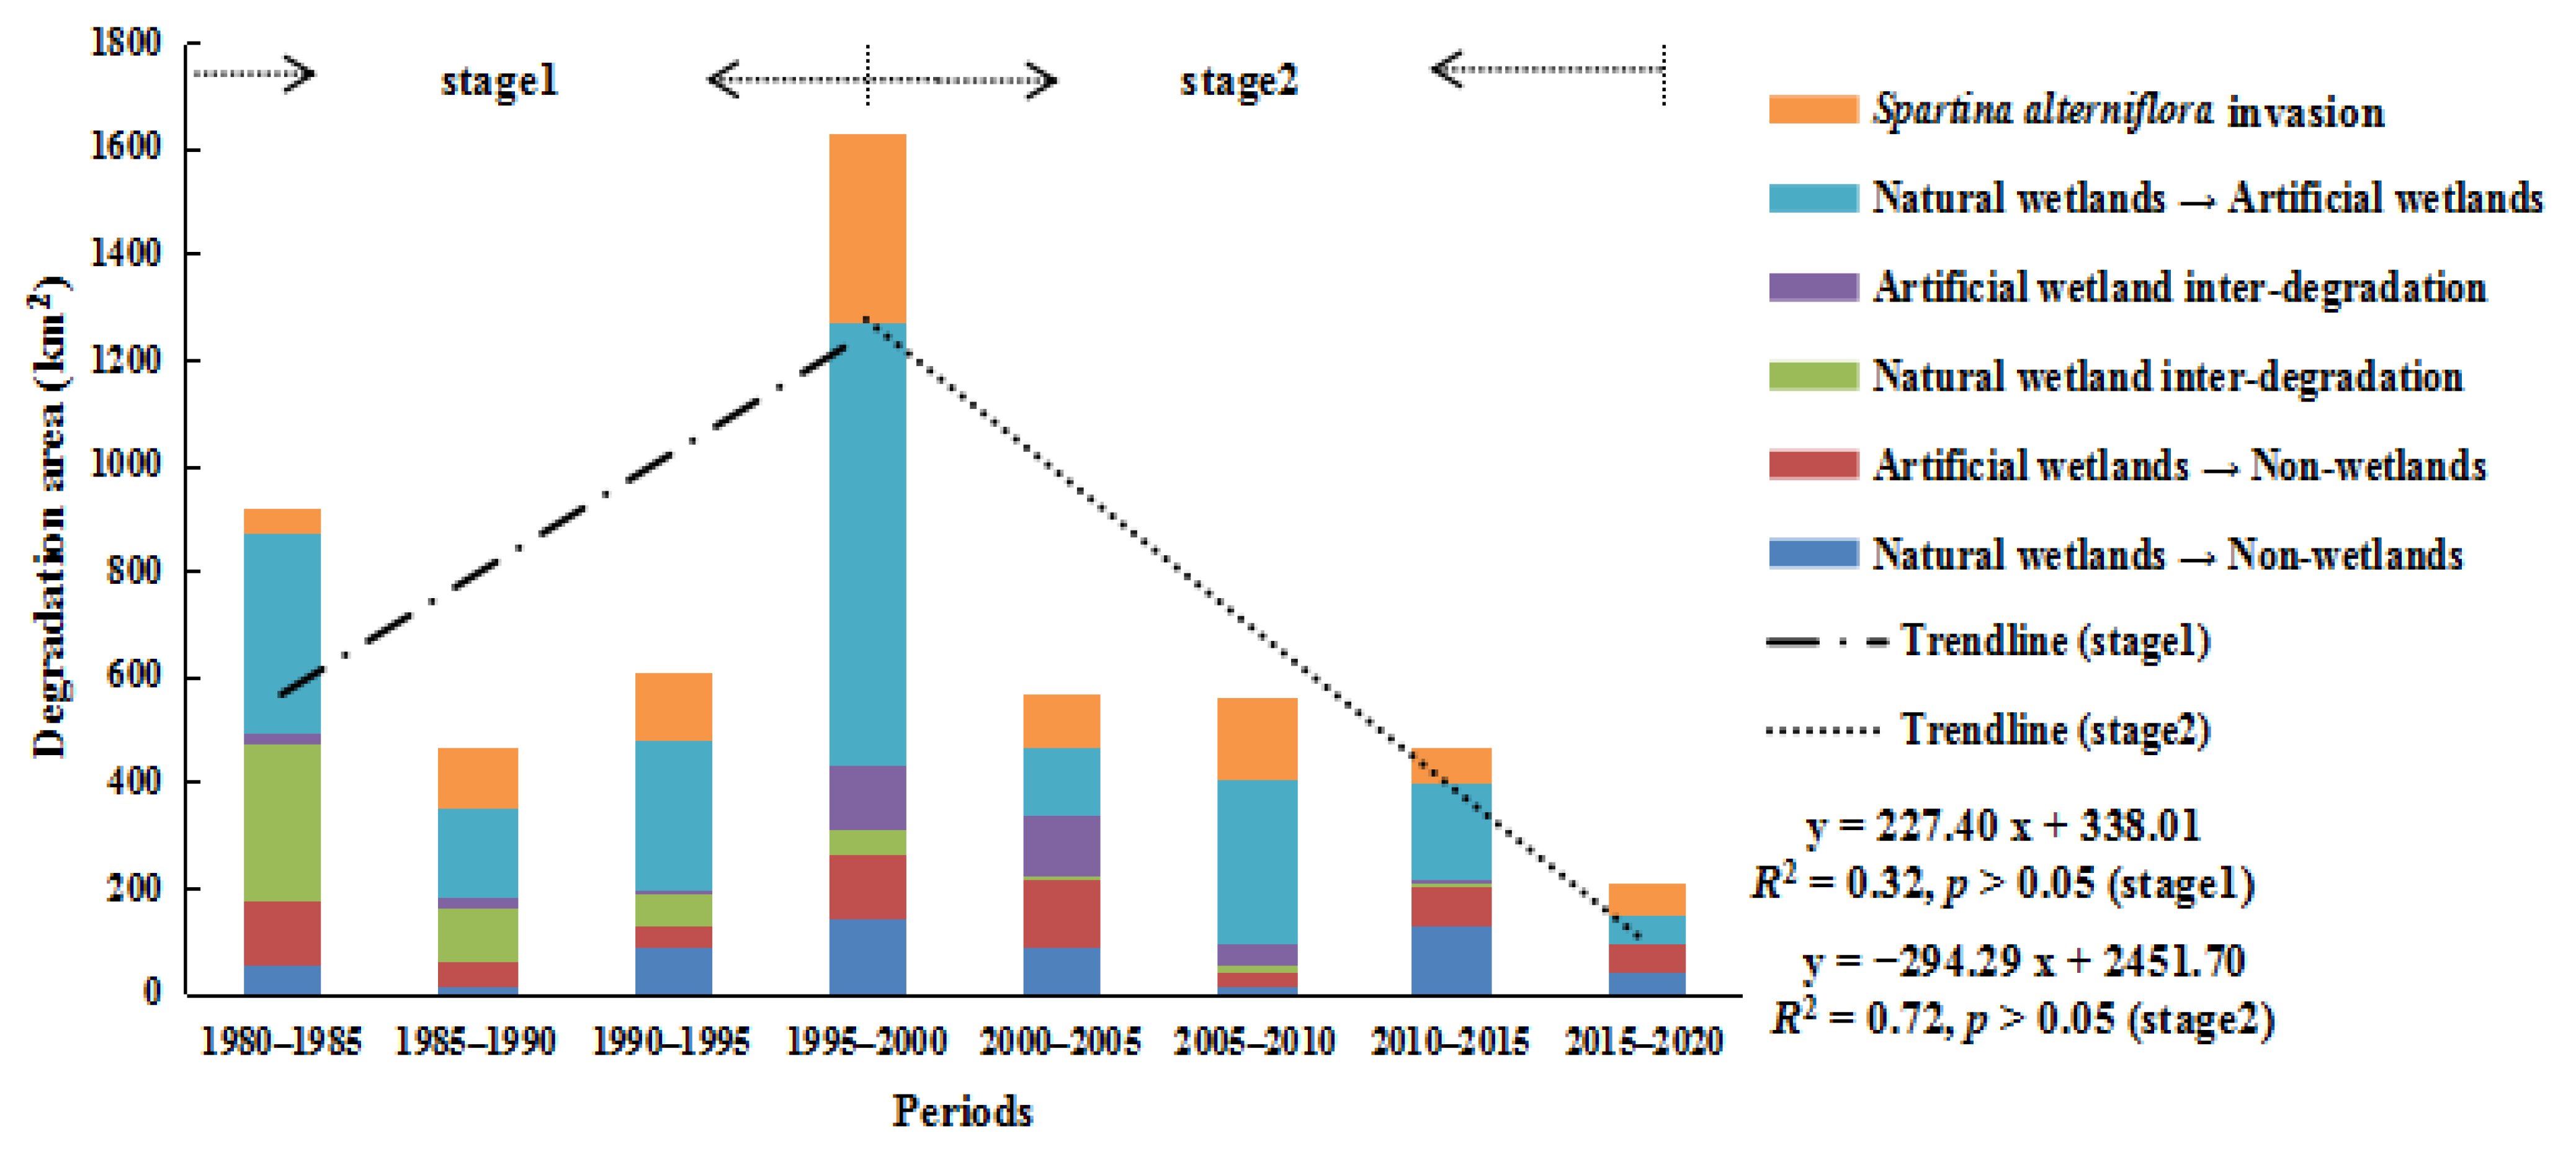
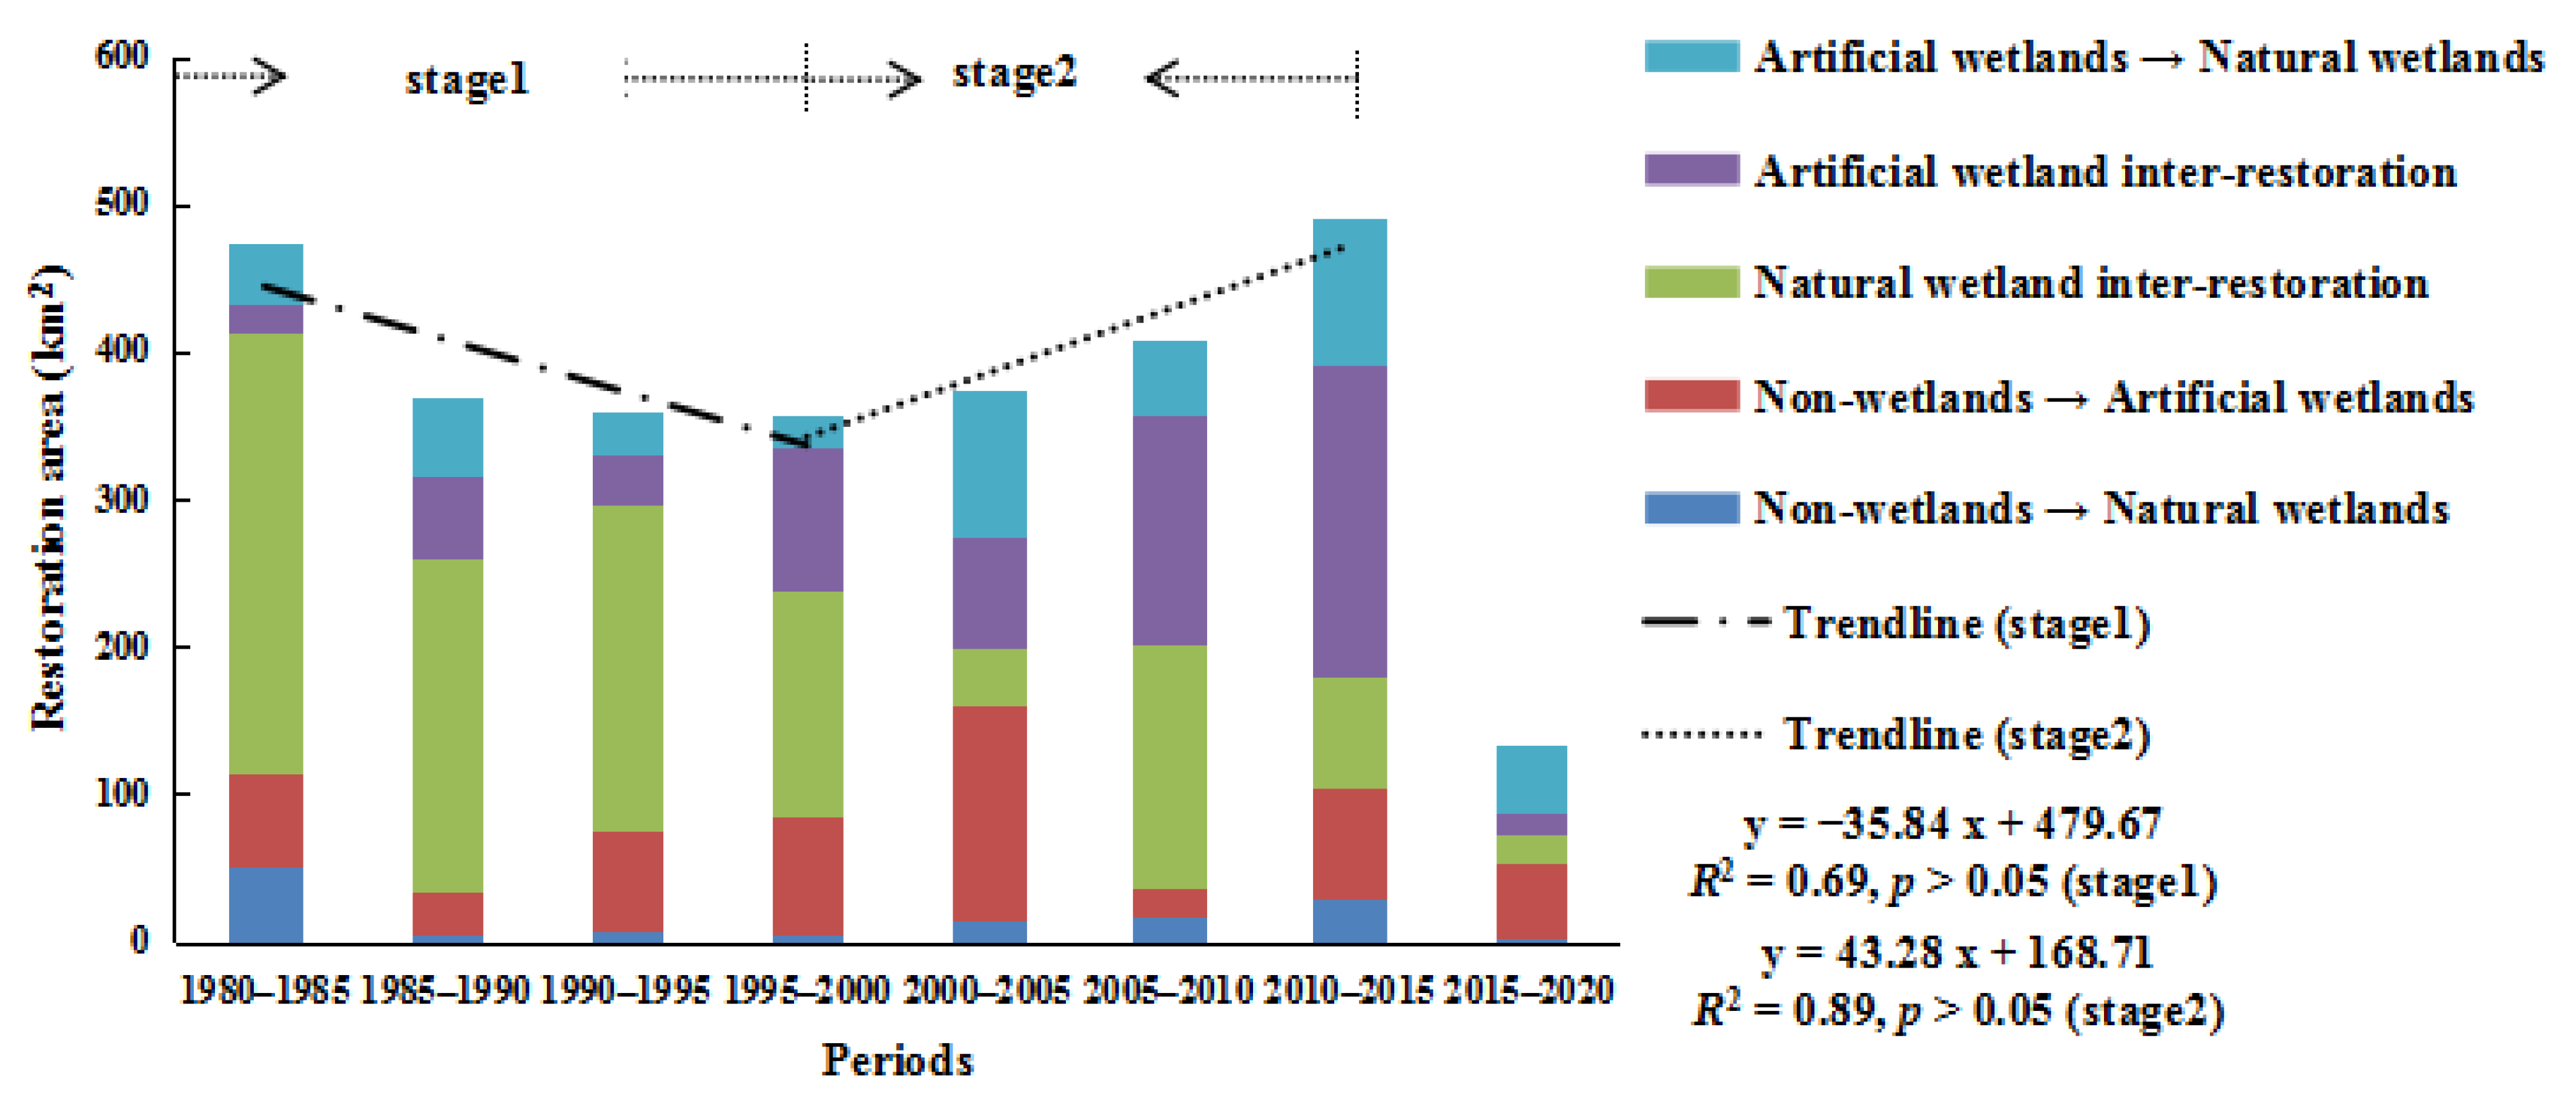
3.2. Analysis of the Landscape Evolution Process
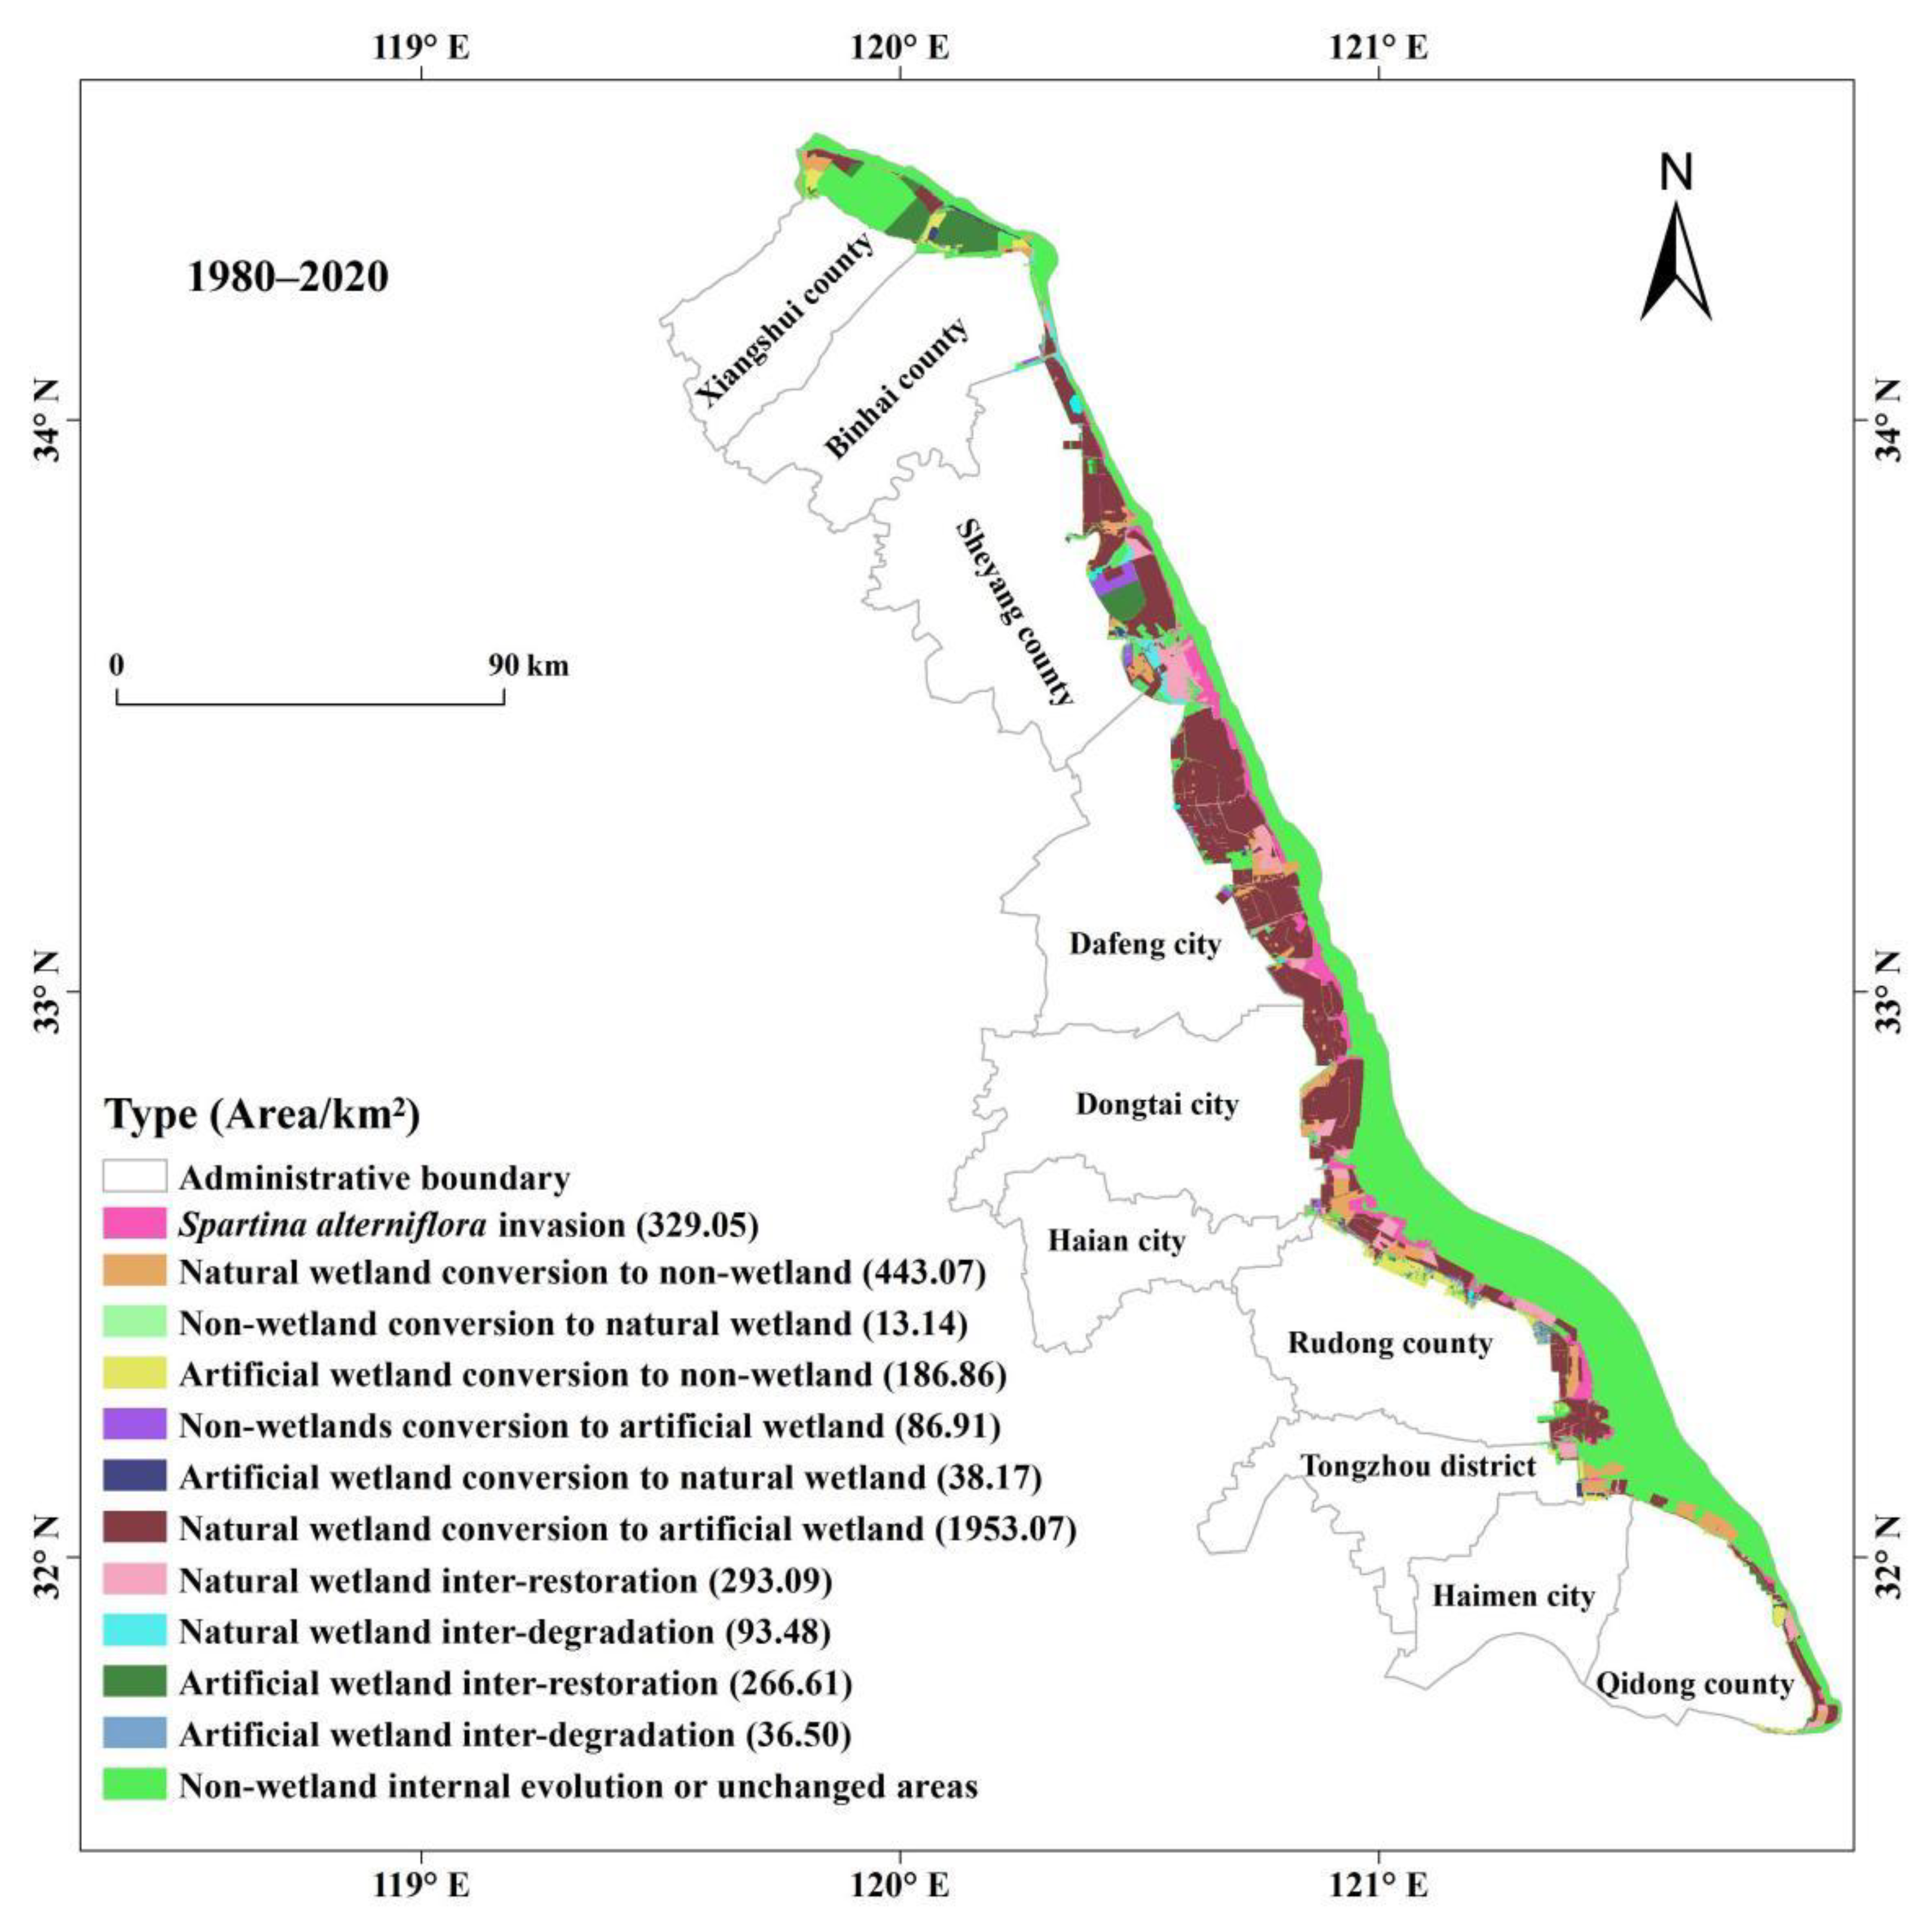
3.3. Spatial–Temporal Characteristics in Landscape Evolution
3.4. Correlation Analysis of the Human Disturbance Index and the Rate of Landscape Evolution
4. Discussion
4.1. Human Distribution, Natural Change, and Landscape Evolution
4.2. Reliability of the Landscape Evolution Analysis Method
4.3. Uncertainty of the Human Disturbance Index
5. Conclusions
Author Contributions
Funding
Data Availability Statement
Acknowledgments
Conflicts of Interest
References
- Forman, R.T.T. Some general principles of landscape and regional ecology. Landsc. Ecol. 1995, 10, 133–142. [Google Scholar] [CrossRef]
- Cui, L.L.; Li, G.S.; Ouyang, N.L.; Mu, F.Y.; Zhang, Y.T.; Huang, X.Y. Analyzing coastal wetland degradation and its key restoration technologies in the coastal area of Jiangsu, China. Wetlands 2018, 38, 525–537. [Google Scholar] [CrossRef]
- Gundersen, G.; Corbett, D.R.; Long, A.; Martinez, M.; Ardón, M. Long-term sediment, carbon, and nitrogen accumulation rates in coastal wetlands impacted by sea level rise. Estuaries Coasts 2021, 8, 1–17. [Google Scholar]
- Osland, M.J.; Enwright, N.M.; Day, R.H.; Gabler, C.A.; Stagg, C.L.; Grace, J.B. Beyond just sea-level rise: Considering macroclimatic drivers within coastal wetland vulnerability assessments to climate change. Glob. Chang. Biol. 2016, 22, 1–11. [Google Scholar] [CrossRef]
- Li, H.Y.; Man, W.D.; Li, X.Y.; Ren, C.Y.; Wang, Z.M.; Li, L.; Jia, M.M. Remote sensing investigation of anthropogenic land cover expansion in the low-elevation coastal zone of Liaoning Province, China. Ocean. Coast. Manag. 2017, 148, 245–259. [Google Scholar] [CrossRef]
- Meng, W.Q.; Feagin, R.A.; Hu, B.B.; He, M.X.; Li, H.Y. The spatial distribution of blue carbon in the coastal wetlands of China. Estuar. Coast. Shelf Sci. 2019, 222, 13–20. [Google Scholar] [CrossRef]
- Bian, H.L.; Li, W.; Li, Y.Z.; Ren, B.; Niu, Y.D.; Zeng, Z.Q. Driving forces of changes in China’s wetland area from the first (1999–2001) to second (2009–2011) National Inventory of Wetland Resources. Glob. Ecol. Conserv. 2019, 21, e00867. [Google Scholar] [CrossRef]
- Walz, U.; Stein, C. Indicators of hemeroby for the monitoring of landscapes in Germany. J. Nat. Conserv. 2014, 22, 279–289. [Google Scholar] [CrossRef]
- Roth, D.; Moreno-Sanchez, R.; Torres-Rojo, J.M.; Moreno-Sanchez, F. Estimation of human induced disturbance of the environment associated with 2002, 2008 and 2013 land use/cover patterns in Mexico. Appl. Geogr. 2016, 66, 22–34. [Google Scholar] [CrossRef]
- Liu, J.P.; Dong, C.Y.; Sheng, L.X.; Liu, Y. Landscape pattern change of marsh and its response to human disturbance in the small Sanjiang Plain, 1955–2010. Sci. Geogr. Sin. 2016, 36, 879–887. [Google Scholar]
- Zhou, Y.K.; Ning, L.X.; Bai, X.L. Spatial and temporal changes of human disturbances and their effects on landscape patterns in the Jiangsu coastal zone, China. Ecol. Indic. 2018, 93, 111–122. [Google Scholar] [CrossRef]
- Camilleri, S.; De Gigli, M.; Stecchi, F.; Pérez-Hurtado, A. Land use and land cover change analysis in predominantly man-made coastal wetlands: Towards a methodological framework. Wetl. Ecol. Manag. 2017, 25, 23–43. [Google Scholar] [CrossRef]
- Cheng, M.; Zhang, L.Y.; Ouyang, Z.Y. Landscape patterns of coastal wetlands in Hebei province in 2000, 2005 and 2010 and their changes. Wetl. Sci. 2017, 15, 824–828. [Google Scholar]
- Lü, L.T.; Zhang, J.; Peng, Q.Z.; Ren, F.P.; Jiang, Y. Landscape pattern analysis and prediction in the Dongjiang River Basin. Acta Ecol. Sin. 2019, 39, 6850–6859. [Google Scholar]
- Zhou, H.H.; Du, J.; Nan, Y.; Song, K.S.; Zhao, B.Y.; Xiang, X.Y. Landscape patterns of coastal wetlands in pearl river delta and their changes for 5 periods since 1980. Wetl. Sci. 2019, 17, 559–566. [Google Scholar]
- Riitters, K.H.; O’Neill, R.V.; Hunsaker, C.T.; Wickham, J.D.; Yankee, D.H.; Timmins, S.P.; Jones, K.B.; Jackson, B.L. A factor analysis of landscape pattern and structure metrics. Landsc. Ecol. 1995, 10, 23–39. [Google Scholar] [CrossRef]
- Wu, J.G. The key research topics in landscape ecology. Acta Ecol. Sin. 2004, 24, 2074–2076. [Google Scholar]
- Cui, L.L.; Li, G.S.; Liao, H.J.; Ouyang, N.L.; Zhang, Y. Integrated approach based on a regional habitat succession model to assess wetland landscape ecological degradation. Wetlands 2015, 35, 281–289. [Google Scholar] [CrossRef]
- Müller, F.; Nielsen, S.N. Ecosystems as subjects of self-organising processes. In Handbook of Ecosystem Theories and Management; Joergensen, S.E., Müller, F., Eds.; Lewis Publishers: Boca Raton, FL, USA, 2000; pp. 177–194. [Google Scholar]
- Stanton, D.E.; Armesto, J.J.; Hedin, L.O. Ecosystem properties self-organize in response to a directional fog-vegetation interaction. Ecology 2016, 95, 1203–1212. [Google Scholar] [CrossRef]
- Bossel, H. Ecological orientors: Emergence of basic orientors in evolutionary self-organization. In Eco Targets, Goal Functions and Orientors; Müller, F., Leupelt, M., Eds.; Springer: Berlin/Heidelberg, Germany; New York, NY, USA, 1998; pp. 19–33. [Google Scholar]
- Müller, F.; Joergensen, S.E. Ecological orientors—A path to environmental applications of ecosystem theories. In Handbook of Ecosystem Theories and Management; Joergensen, S.E., Müller, F., Eds.; Lewis Publishers: Boca Raton, FL, USA, 2000; pp. 561–576. [Google Scholar]
- Müller, F.; Schrautzer, J.; Reiche, E.W.; Rinker, A. Ecosystem based indicators in retrogressive successions of an agricultural landscape. Ecol. Indic. 2006, 6, 63–82. [Google Scholar] [CrossRef]
- Wellmann, T.; Haase, D.; Knapp, S.; Salbach, C.; Selsam, P.; Laush, A. Urban land use intensity assessment: The potential of spatio-temporal spectral traits with remote sensing. Ecol. Indic. 2018, 85, 190–203. [Google Scholar] [CrossRef]
- Jalas, J. Hemerobe und hemerochore pflanzenarten Ein terminologischer Reformversuch. Acta Soc. Fauna Flora Fenn 1955, 72, 1–15. [Google Scholar]
- Fu, B.J.; Hu, C.X.; Chen, L.D.; Honnay, O.; Gulinck, H. Evaluating change in agricultural landscape pattern between 1980 and 2000 in the Loess hilly region of Ansai County, China. Agric. Ecosyst. Environ. 2006, 114, 387–396. [Google Scholar] [CrossRef]
- Sukopp, H. Der Einfluss des Menschen auf die vegetation. Vegetatio 1969, 17, 360–371. [Google Scholar] [CrossRef]
- Li, M.; Kruchi, N.; Yang, J. Hemeroby—A method to assess the naturalness of vegetation. Prog. Geogr. 2002, 21, 450–458. [Google Scholar]
- Chen, A.L.; Zhu, B.Q.; Chen, L.D.; Wu, Y.H.; Sun, R.H. Dynamic changes of landscape pattern and eco-disturbance degree in Shuangtai estuary wetland of Liaoning Province, China. Chin. J. Appl. Ecol. 2010, 21, 1120–1128. [Google Scholar]
- Lü, J.X.; Jiang, W.G.; Wang, W.J.; Liu, Y.H.; Deng, Y.; Wang, X.Y. Wetland landscape evolution and its relation to human disturbance in Xiong’an New Area based on the moving window method. Remote Sens. Land Resour. 2019, 31, 140–148. [Google Scholar]
- Liu, J.P.; Gao, J.; Dong, C.Y. Regional differentiation and factors influencing changes in swamps in the Sanjiang Plain from 1954 to 2015. Acta Ecol. Sin. 2019, 39, 4821–4831. [Google Scholar]
- Liao, H.J.; Li, G.S.; Cui, L.L.; Ouyang, N.L.; Zhang, Y.; Wang, S.H. Study on evolution features and spatial distribution patterns of coastal wetlands in north Jiangsu Province, China. Wetlands 2014, 34, 877–891. [Google Scholar] [CrossRef]
- Wang, G.B.; Xu, C.L.; Huang, R. Research on driving forces of reclamation dynamics and land use change in coastal areas of Jiangsu Province. J. Hohai Univ. Nat. Sci. 2020, 48, 163–170. [Google Scholar]
- O’Neill, R.V.; Hunsaker, C.T.; Timmins, S.P.; Jackson, B.L.; Jones, K.B.; Riitters, K.H.; Wickham, J.D. Scale problems in reporting landscape pattern at the regional scale. Landsc. Ecol. 1996, 11, 169–180. [Google Scholar] [CrossRef]
- Huang, Y.X.; Yin, X.Q.; Ye, G.F.; Lin, J.M.; Huang, R.; Wang, N.; Wang, L.; Sun, Y. Spatio-temporal variation of landscape heterogeneity under influence of human activities in Xiamen City of China in recent decade. Chin. Geogr. Sci. 2013, 23, 227–236. [Google Scholar] [CrossRef]
- Chen, P.; Fu, S.F.; Wen, C.X.; Wu, H.Y.; Song, Z.X. Assessment of impact on coastal wetland of Xiamen Bay and response of landscape pattern from human disturbance from 1989 to 2010. J. Appl. Oceanogr. 2014, 33, 167–174. [Google Scholar]
- Xu, N.Y.; Sun, S.Q.; Xue, D.Y.; Guo, L. Ecosystem service value and its spatial response to human interference on the basis of terrain gradient in Gannan region, China. Acta Ecol. Sin. 2019, 39, 97–107. [Google Scholar]
- Wang, M.; Fu, J.; Wu, Z.; Pang, Z. Spatiotemporal Variation of NDVI in the Vegetation Growing Season in the Source Region of the Yellow River, China. ISPRS Int. J. Geo Inf. 2020, 9, 282. [Google Scholar] [CrossRef]
- Li, H.L.; Peng, J.; Liu, Y.X.; Hu, Y.N. Urbanization impact on landscape patterns in Beijing City, China: A spatial heterogeneity perspective. Ecol. Indic. 2017, 82, 50–60. [Google Scholar] [CrossRef]
- Ning, J.; Liu, J.Y.; Zhao, G.S. Spatio-temporal characteristics of disturbance of land use change on major ecosystem function zones in China. Chin. Geogr. Sci. 2015, 25, 523–536. [Google Scholar] [CrossRef]
- Diwediga, B.Q.; Wala, K.; Folega, F.; Dourma, M.; Woegan, Y.A.; Akpagana, K.; Le, Q.B. Biophysical and anthropogenous determinants of landscape patterns and degradation of plant communities in Mo Hilly Basin (Togo). Ecol. Eng. 2015, 85, 132–143. [Google Scholar] [CrossRef]
- Zhang, Z.; Song, X.C.; Qiu, Y.; Ji, Q.X. Research on the development and utilization of coastal mudflat resources in Jiangsu province, China. Ocean Dev. Manag. 2015, 3, 45–49. [Google Scholar]
- Zhang, X.X.; Yan, C.Q.; Xu, P.; Dai, Y.X.; Yan, W.B.; Ding, X.R.; Zhu, C.X.; Mei, D.D. Historical evolution of tidal flat reclamation in the Jiangsu coastal areas. Acta Geogr. Sin. 2013, 68, 1549–1558. [Google Scholar]
- Tang, Z.D. Characteristics of coastal siltation length and tidal flats reclamation potential in Jiangsu Province, China. Ocean Dev. Manag. 1991, 4, 19–25. [Google Scholar]
- Zhang, Y.; Li, W.H.; Sun, G.; King, J.S. Coastal wetland resilience to climate variability: A hydrologic perspective. J. Hydrol. 2019, 568, 275–284. [Google Scholar] [CrossRef]
- Burkett, V.; Kusler, J. Climate change: Potential impacts and interactions in wetlands of the United states. J. Am. Water Resour. Assoc. 2000, 36, 313–320. [Google Scholar] [CrossRef]
- Shi, Y.F.; Zhu, J.W.; Xie, Z.R.; Ji, Z.X.; Jiang, Z.X.; Yang, G.S. Predicting the impact of sea level rise in the Yangtze River Delta and adjacent areas and countermeasures for prevention and control. Sci. China Ser. D 2000, 30, 225–232. [Google Scholar]
- Liu, H.Y.; Zhou, Y.; Guo, Z.R.; Dai, L.J.; Wang, G.; Li, Y.F. A conceptual ecological model for large-scale salt marsh restoration: A case study of Yancheng. Chin. J. Ecol. 2021, 40, 278–291. [Google Scholar]
- Zhang, H.B.; Liu, H.Y.; Li, Y.F.; Tan, Q.M.; Hou, M.H. The studying of key ecological factors and threshold of landscape evolution in Yancheng Coastal wetland. Acta Ecol. Sin. 2013, 33, 6975–6983. [Google Scholar] [CrossRef]
- Jiang, P.H.; Cheng, L.; Li, M.C.; Zhao, R.F.; Huang, Q.H. Analysis of landscape fragmentation processes and driving forces in wetlands in arid areas: A case study of the middle reaches of the Heihe River, China. Ecol. Indic. 2014, 46, 240–252. [Google Scholar] [CrossRef]
- Das, A.; Basu, T. Assessment of peri-urban wetland ecological degradation through importance-performance analysis (IPA): A study on Chatra Wetland, India. Ecol. Indic. 2020, 114, 106274. [Google Scholar] [CrossRef]
- Wang, Z.M.; Song, K.S.; Ma, W.H.; Ren, C.Y.; Zhang, B.; Liu, D.W.; Chen, J.M.; Song, C.C. Loss and fragmentation of marshes in the Sanjiang Plain, Northeast China, 1954–2005. Wetlands 2011, 31, 945–954. [Google Scholar] [CrossRef]
- Li, W.L.; Xue, P.F.; Liu, C.L.; Yan, H.P.; Zhu, G.F.; Cao, Y.P. Monitoring and landscape dynamic analysis of alpine wetland area based on multiple algorithms: A case study of Zoige Plateau. Sensors 2020, 20, 7315. [Google Scholar] [CrossRef] [PubMed]
- Che, T.; Li, C.; Luo, Y.J. Changes in landscape pattern of built-up land and its driving factors during urban sprawl. Acta Ecol. Sin. 2020, 40, 3283–3294. [Google Scholar]


| Disturbance Coefficient | Landscape Class |
|---|---|
| 0 | Shallow marine waters and Spartina alterniflora |
| 1 | Tidal flats, Suaeda glauca, Phragmites australis, grassland, and rivers |
| 2 | Woodlands and barelands |
| 3 | Pools |
| 4 | Paddy fields, aquafarms, salt fields, and dryland |
| 5 | Urban settlements, rural settlements, levees, and other construction lands |
| Item | 1980 | 2020 | Area Change (km2) | Change Rate (km2/year) | |
|---|---|---|---|---|---|
| Natural wetlands | Area (km2) | 5999.99 | 3655.16 | −2344.83 | −58.62 |
| Percentage of total area of the region (%) | 84.89 | 51.71 | −33.18 | ||
| Percentage of total wetland area (%) | 87.80 | 57.99 | −29.81 | ||
| Artificial wetlands | Area (km2) | 833.33 | 2648.29 | 1814.96 | 45.37 |
| Percentage of total area of the region (%) | 11.79 | 37.47 | 25.68 | ||
| Percentage of total wetland area (%) | 12.20 | 42.01 | 29.81 | ||
| Wetlands (including Natural and Artificial wetlands) | Area (km2) | 6833.32 | 6303.45 | −529.87 | −13.25 |
| Percentage of total area of the region (%) | 96.68 | 89.18 | −7.50 | ||
| Total area of the region (km2) | 7068.22 | ||||
| Degradation Type | Degradation Area (km2) | Percentage of Total Degradation Area (%) | Restoration Type | Restoration Area (km2) | Percentage of Total Restoration Area (%) |
|---|---|---|---|---|---|
| Natural wetlands → non-wetlands | 443.07 | 14.56 | Non-wetlands → natural wetlands | 13.14 | 1.88 |
| Artificial wetlands → non-wetlands | 186.86 | 6.14 | Non-wetlands → artificial wetlands | 86.91 | 12.45 |
| Natural wetland inter-degradation | 93.48 | 3.07 | Natural wetland inter-restoration | 293.09 | 41.99 |
| Artificial wetland inter-degradation | 36.50 | 1.20 | Artificial wetland inter-restoration | 266.61 | 38.20 |
| Natural wetlands → artificial wetlands | 1953.07 | 64.20 | Artificial wetlands → natural wetlands | 38.17 | 5.47 |
| Spartina alterniflora invasion | 329.05 | 10.82 | Total restoration area | 697.92 | |
| Total degradation area | 3042.03 | Percentage of regional area (%) | 9.87 | ||
| Percentage of regional area (%) | 43.04 | Percentage of pre-existing wetland area (%) | 10.21 | ||
| Percentage of pre-existing wetland area (%) | 44.52 | Percentage of degradation area (%) | 22.94 | ||
| Region | 1980–1985 | 1985–1990 | 1990–1995 | 1995–2000 | 2000–2005 | 2005–2010 | 2010–2015 | 2015–2020 | Average | Trendline | Trend |
|---|---|---|---|---|---|---|---|---|---|---|---|
| Xiangshui county | 10.20 | 5.53 | 2.10 | 12.57 | 1.39 | 0.55 | 5.55 | 4.09 | 5.25 |  | Decrease with fluctuations |
| Binhai county | 11.30 | 5.42 | 3.66 | 9.61 | 1.62 | 2.17 | 0.97 | 2.79 | 4.69 |  | |
| Sheyang county | 52.39 | 23.53 | 27.14 | 60.99 | 17.44 | 16.16 | 13.97 | 6.33 | 27.25 |  | |
| Dafeng city | 54.10 | 37.56 | 58.21 | 132.59 | 27.92 | 22.09 | 10.98 | 2.47 | 43.24 |  | |
| Rudong county | 35.67 | 6.94 | 11.84 | 41.22 | 28.00 | 27.78 | 20.48 | 7.27 | 22.40 |  | |
| Dongtai city | 10.03 | 8.86 | 8.24 | 49.17 | 19.76 | 23.87 | 23.43 | 11.17 | 19.32 |  | Increase with fluctuations |
| Hai’an city | 0.12 | 1.02 | 2.71 | 4.83 | 4.07 | 1.85 | 1.77 | 1.64 | 2.25 |  | |
| Tongzhou district | 2.04 | 0.54 | 1.02 | 2.80 | 2.78 | 1.86 | 4.24 | 0.83 | 2.01 |  | |
| Haimen city | 1.61 | 0.67 | 0.49 | 1.57 | 2.94 | 3.96 | 0.68 | 2.57 | 1.81 |  | |
| Qidong city | 6.10 | 4.04 | 6.12 | 10.67 | 7.36 | 11.52 | 11.01 | 2.67 | 7.43 |  |
| Region | 1980–1985 | 1985–1990 | 1990–1995 | 1995–2000 | 2000–2005 | 2005–2010 | 2010–2015 | 2015–2020 | Average | Trendline | Trend |
|---|---|---|---|---|---|---|---|---|---|---|---|
| Sheyang county | 32.17 | 19.87 | 23.80 | 18.40 | 16.91 | 30.52 | 9.23 | 7.78 | 19.84 |  | Decrease with fluctuations |
| Dafeng city | 24.48 | 28.06 | 22.38 | 16.79 | 24.08 | 7.81 | 18.26 | 6.90 | 18.60 |  | |
| Hai’an city | 3.28 | 1.66 | 1.16 | 0.35 | 1.00 | 1.09 | 0.61 | 0.00 | 1.14 |  | |
| Rudong county | 11.38 | 10.12 | 7.11 | 17.82 | 3.36 | 14.03 | 13.74 | 0.00 | 9.70 |  | |
| Tongzhou district | 2.32 | 0.25 | 1.22 | 2.85 | 2.30 | 1.51 | 2.37 | 0.00 | 1.60 |  | |
| Dongtai city | 9.39 | 7.68 | 4.34 | 8.92 | 17.89 | 8.66 | 5.55 | 10.97 | 9.18 |  | Increase with fluctuations |
| Xiangshui county | 3.84 | 0.36 | 1.82 | 0.64 | 1.15 | 12.46 | 15.26 | 0.03 | 4.44 |  | |
| Binhai county | 4.81 | 4.84 | 7.02 | 2.56 | 4.11 | 0.79 | 23.11 | 0.52 | 5.97 |  | |
| Haimen city | 0.43 | 0.21 | 0.72 | 0.73 | 0.72 | 1.65 | 2.13 | 0.00 | 0.82 |  | |
| Qidong city | 2.52 | 0.93 | 2.48 | 2.31 | 3.09 | 2.93 | 7.69 | 0.61 | 2.82 |  |
| Type | Yancheng City | Nantong City | Study Area | |||
|---|---|---|---|---|---|---|
| Degradation Area | Restoration Area | Degradation Area | Restoration Area | Degradation Area | Restoration Area | |
| Change amount of Area-MN | −0.12 | −0.09 | −0.30 | −0.14 | −0.14 | −0.08 |
| Change amount of AI | −0.60 ** | −0.28 | 0.01 | 0.00 | −0.27 * | −0.04 |
Publisher’s Note: MDPI stays neutral with regard to jurisdictional claims in published maps and institutional affiliations. |
© 2021 by the authors. Licensee MDPI, Basel, Switzerland. This article is an open access article distributed under the terms and conditions of the Creative Commons Attribution (CC BY) license (https://creativecommons.org/licenses/by/4.0/).
Share and Cite
Cui, L.; Li, G.; Chen, Y.; Li, L. Response of Landscape Evolution to Human Disturbances in the Coastal Wetlands in Northern Jiangsu Province, China. Remote Sens. 2021, 13, 2030. https://doi.org/10.3390/rs13112030
Cui L, Li G, Chen Y, Li L. Response of Landscape Evolution to Human Disturbances in the Coastal Wetlands in Northern Jiangsu Province, China. Remote Sensing. 2021; 13(11):2030. https://doi.org/10.3390/rs13112030
Chicago/Turabian StyleCui, Linlin, Guosheng Li, Yanhui Chen, and Lijuan Li. 2021. "Response of Landscape Evolution to Human Disturbances in the Coastal Wetlands in Northern Jiangsu Province, China" Remote Sensing 13, no. 11: 2030. https://doi.org/10.3390/rs13112030
APA StyleCui, L., Li, G., Chen, Y., & Li, L. (2021). Response of Landscape Evolution to Human Disturbances in the Coastal Wetlands in Northern Jiangsu Province, China. Remote Sensing, 13(11), 2030. https://doi.org/10.3390/rs13112030