Article

Analysing the Impact of Climate Change on Hydrological Ecosystem Services in Laguna del Sauce (Uruguay) Using the SWAT Model and Remote Sensing Data

by
Celina Aznarez
1,2,*,
Patricia Jimeno-Sáez
3,
Adrián López-Ballesteros
3,
Juan Pablo Pacheco
4,5,6 and
Javier Senent-Aparicio
3
1
Basque Centre for Climate Change (BC3), Scientific Park UPV/EHU, Barrio Sarriena s/n, 48940 Leioa, Spain
2
Institute of Environmental Science and Technology (ICTA), Campus de la UAB, Universitat Autónoma de Barcelona (UAB), Carrer de les Columnes s/n, 08193 Cerdanyola del Vallès, Spain
3
Department of Civil Engineering, Campus de los Jerónimos s/n, Catholic University of San Antonio, 30107 Guadalupe, Spain
4
Department of Ecology and Environmental Management, CURE—University of the Republic, Maldonado 20000, Uruguay
5
Department of Bioscience, Aarhus University, 8600 Silkeborg, Denmark
6
Sino-Danish Centre for Education and Research (SDC), Beijing 100049, China
*
Author to whom correspondence should be addressed.
Remote Sens. 2021, 13(10), 2014; https://doi.org/10.3390/rs13102014
Submission received: 26 February 2021 / Revised: 25 April 2021 / Accepted: 17 May 2021 / Published: 20 May 2021

Abstract

:
Assessing how climate change will affect hydrological ecosystem services (HES) provision is necessary for long-term planning and requires local comprehensive climate information. In this study, we used SWAT to evaluate the impacts on four HES, natural hazard protection, erosion control regulation and water supply and flow regulation for the Laguna del Sauce catchment in Uruguay. We used downscaled CMIP-5 global climate models for Representative Concentration Pathways (RCP) 2.6, 4.5 and 8.5 projections. We calibrated and validated our SWAT model for the periods 2005–2009 and 2010–2013 based on remote sensed ET data. Monthly NSE and R2 values for calibration and validation were 0.74, 0.64 and 0.79, 0.84, respectively. Our results suggest that climate change will likely negatively affect the water resources of the Laguna del Sauce catchment, especially in the RCP 8.5 scenario. In all RCP scenarios, the catchment is likely to experience a wetting trend, higher temperatures, seasonality shifts and an increase in extreme precipitation events, particularly in frequency and magnitude. This will likely affect water quality provision through runoff and sediment yield inputs, reducing the erosion control HES and likely aggravating eutrophication. Although the amount of water will increase, changes to the hydrological cycle might jeopardize the stability of freshwater supplies and HES on which many people in the south-eastern region of Uruguay depend. Despite streamflow monitoring capacities need to be enhanced to reduce the uncertainty of model results, our findings provide valuable insights for water resources planning in the study area. Hence, water management and monitoring capacities need to be enhanced to reduce the potential negative climate change impacts on HES. The methodological approach presented here, based on satellite ET data can be replicated and adapted to any other place in the world since we employed open-access software and remote sensing data for all the phases of hydrological modelling and HES provision assessment.

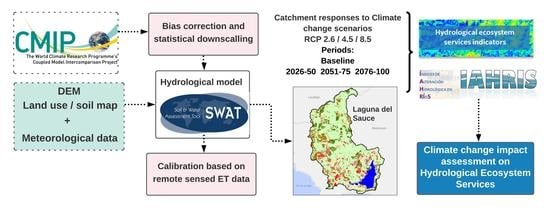
Graphical Abstract

1. Introduction

Freshwater ecosystems are sensitive to landscape anthropogenic changes due to intensification in land use, anthropisation and increased demand for ecosystem services [1,2,3]. These stressors have accelerated in the last 50 years, driven by economic development and population growth and impact the ecosystem structure and function, therefore weakening its capacity to maintain ecosystem services flows [4,5]. Hydrological ecosystem services (HES) are the beneficial effects on people produced by the influence of the earth’s ecosystem on freshwater, and they can be grouped into the following: improvement of extractive water supply and in-stream water supply, natural hazard mitigation, water-related cultural services provision and water-related supporting services [6]. At a global scale, the impacts of human activities on ecosystems have diminished by 60% of the ecosystem services provision capacity [7]. These threats are expected to increase during the next decades, due to the increase in greenhouse gas emissions leading to climate change and alterations in ecosystem hydrology, which impact the availability of global water resources [8,9].
Particularly for sustainable use of water resources, HES modelling is becoming an increasingly valuable tool [10], due to the environmental problems and risks associated with their degradation [11]. Changes in local weather conditions such as rainfall or temperature affect hydrological cycle features [7], influencing many other processes including the HES production. Climate change is expected to shift the amount and timing of water movement through the landscape, altering the dynamics of nutrients and sediment transportation [12]. As water moves through a landscape, its hydrological attributes are directly affected, improving or degrading the supply of hydrological services and ecosystem processes [6]. Within ecosystems, eco-hydrological processes can have competitive impacts on the same attribute or simultaneously have both positive and negative effects on different features of a specific HES. Such complex feedback and trade-offs between services and beneficiaries can be elucidated from the ecosystem services framework [13]. Therefore, understanding how climate change affects lakes and HES supply is essential for new adaptive management strategies. Scenario analyses are highly useful for evaluating possible futures and are widely used as research and decision-making tools in environmental studies [12,14,15].
Hydrological models are increasingly important to assist water management strategies through the assessment and quantification of the landscape processes that regulate the water balance components, linked to the production and distribution of HES [16,17]. Among these is the Soil and Water Assessment Tool (SWAT) [18], used to forecast the impact of land management on water, sediment and agricultural pollutants yield in ungauged basins [19,20]. The SWAT has the potential to simulate how CO2 concentration, rainfall, temperature and humidity could influence plant growth, evapotranspiration, snow and runoff generation, as well as to assess the effects of climate change on freshwater ecosystems [9,21,22]. Furthermore, hydrological models are frequently used in combination with climate scenarios generated from GCMs to predict climate change effects on water resources [23]. Despite the growing relevance of the ecosystem services framework and the potential of modelling tools such as the SWAT [24], HES analyses that involve SWAT modelling are still very limited. In 2016 HES analyses concentrated in 1.5% of SWAT publications and only 0.4% of publications within the ecosystem services topic [11]. Furthermore, the same study highlighted that there are regions such as South America where its application is under-represented, with only 5% of publications in the SWAT Literature Database for Peer-Reviewed Journals [11].
In a context where resources to improve the provision of multiple HES are still scarce, modelling tools such as SWAT are helpful to underpin adaptation planning strategies by understanding the potential responses of HES to climate drivers [25,26]. In Uruguay, monitoring capabilities are still scarce, and this approach can contribute to enhancing the capabilities for the management and conservation of water resources in ungauged basins. Laguna del Sauce is the second-largest drinking water source in Uruguay, supplying 95% of the population in the Maldonado region, where a tourism influx during the summer doubles the local drinking water demand. Recently, this shallow lake has experienced an increased recurrence of cyanobacteria—events that have affected the purification process and restricted recreational use, generating great repercussions at the public opinion level [27,28]. Moreover, the Laguna del Sauce catchment is experiencing a land-use intensification trend, which along with climate change has the potential to aggravate the current problems associated with Laguna del Sauce as well as alter its hydrological performance. Even though there are studies on the biological processes of the Laguna del Sauce catchment, no studies have developed response scenarios to climate change to anticipate and respond to the potential impact of HES provision. These studies would be key to inform regional watershed management, land-use policies and restoration strategies since it is a eutrophic system. Assessing how climate change will impact ecosystem services provision is necessary for long-term planning since impacts and vulnerability are local-scale issues requiring comprehensive climate information [29]. This study aimed to characterise potential climate change impacts on water resources in Maldonado, Uruguay, through the perspective of ecosystem services, particularly by providing a first estimation of the overall response of freshwater HES to climate change impacts on the hydrology of the Laguna del Sauce catchment. In order to contribute to new research avenues on data-scarce regions, like our study case, we also aimed to explore the applicability of remote sensing for ungauged basins. This work demonstrates how evapotranspiration data from remote sensing can be successfully used in the calibration of distributed hydrological models, which will open up many possibilities in South American countries where hydrological information is scarce, improving the accuracy of hydrological simulations.

2. Study Area

Laguna del Sauce (34°43′S, 55°13′W) is a subtropical shallow lake (max depth 5 m) located in Maldonado in the south-eastern region of Uruguay (Figure 1). It is an interconnected system of three shallow lakes—Laguna del Sauce (4045 ha), Laguna de los Cisnes (205 ha) and Laguna del Potrero (411 ha)—and was originally a coastal lagoon until 1947 when it was dammed for military purposes [27,30]. Due to its outflow dam, Laguna del Sauce connects unidirectionally with the Atlantic Ocean through Potrero stream and has no seawater intrusions [30,31]. The catchment extends over an area of 722 km2 with its main tributaries, from the Pan de Azúcar river in the northwest to Sauce in the northeast (Figure 1). The lake volume is 152.5 mm3, and the average water input to the lake is 285.4 mm3/year [27,30]. The Laguna del Sauce catchment has average temperatures around 12–21 degrees, a mean yearly rainfall of 1084 mm for the 1981–2019 period, and a mean elevation of 99 m. Rainfall tends to be concentrated during winter (July, August and September), although it is highly variable from one year to the next. Among the wide variety of HES provided by Laguna del Sauce, the drinking water supply is the main service. It is the second-largest drinking water source in Uruguay, supplying more than 95% of the permanent population of 160,000 people and more than 400,000 people during summer [30,32]. It is the only freshwater ecosystem in Uruguay defined by the national water code (decree 253/79) with classification 1, which establishes drinking water supply as its principal use.
Laguna del Sauce is a eutrophic ecosystem, with high nutrient concentrations and recurrent blooms of cyanobacteria, particularly during warm seasons (November to March) [31]. Cyanobacteria blooms have been recorded from 1960 to the present with increasing recurrence and persistence over time, which implies an important health threat due to their toxicity potential and the main use of this ecosystem as a tap water supply [30]. These cyanobacterial blooms caused disruptions in the water supply in 2015, despite institutional efforts on biomonitoring and purification [28]. These blooms also affect various productive and recreational activities in the area and compromise the availability of different ecosystem services [30]. Two main factors are identified as convergent factors that explain the accelerated eutrophication and cyanobacterial blooms: first, the damming of the lake to maintain its water level in 1947, increasing the residence time of the water, and second, an accelerated increase in the nutrient inputs from the basin due to the intensification of agricultural-livestock and urban uses in the last 150 years. These two combined factors have rapidly increased the nutrient internal loading in Laguna del Sauce, sustaining high biomasses of algae and cyanobacteria [30,31,33,34].
Laguna del Sauce catchment cover is predominantly grassland (47.6%) and native forest (16.9%) [30], while livestock farming on natural and regenerated pastures is the main land-use. Forest activity represents 12.9% of the catchment, mainly represented by Eucalyptus spp. for the paper and energy industry [34,36] with a forestry priority that occupies 48.4% of the catchment, of which 29.7% is currently forested. Agriculture had a sustained expansion over time, corresponding mainly to soybean, wheat and sorghum which ranged from 1171 ha in 2008 to 8216 ha in 2015 and represent 11.6% of the catchment area [36] (Figure 1). Urban areas occupy 4.4% of the catchment, with sustained urban growth in the region for the last 60 years [32].

3. Materials and Methods

To assess the potential impact of climate change on the aquatic resources of the Laguna del Sauce catchment and its associated HES, we simulated the hydrological cycle under different climatic scenarios (Representative Concentration Pathways RCP 2.6, 4.5 and 8.5, IPCC, 2013). To meet the aims, we (1) modelled the current hydrological cycle of the catchment based on climatic data, (2) calibrated and validated the model based on satellite-derived ET data, demonstrating the use of remote sensing data to assess calibration and validation of hydrological models in watersheds where there is lack of observed streamflow data, (3) downscaled climate scenarios based on GCM models available for RCP 2.6, 4.5 and 8.5 as well as historical data and its inclusion in the hydrological model, and (4) downscaled the climate scenarios and inclusion in the hydrological model to evaluate the climate change impact on the Laguna del Sauce catchment and the associated HES supply.

3.1. SWAT Model Implementation

The Soil and Water Assessment Tool (SWAT) [18] is a continuous-time model and simulator of volume and water quality that is spatially distributed on a daily basis, so it can be used for evaluating HES provision [37]. SWAT simulations include major catchment components: meteorology, hydrology, soil type, land use, crop structure and agricultural management. In the SWAT, the basin is split into multiple sub-basins, which are further divided into unique land use/soil characteristics called hydrological response units (HRUs). Each HRU produces a quantity of runoff that is directed to calculate the total runoff. The water balance equation used in the SWAT model is as follows:
SW t = SW O + ( R day Q surf E α W seep Q gw )
where SWt is the final soil water content (mm), SWO is the initial soil water content (mm), Rday is the precipitation, Qsurf is the surface runoff, Eα is the evapotranspiration, Wseep is the percolation and Qgw is the amount of return flow (in millimeters on a daily basis). The catchment division into HRUs allows the model to show differences in ET for various land uses and soils, using the Priestley-Taylor (1972), Penman-Monteith [38] or Hargreaves (1975) methods. We performed the Hargreaves method because it provides reference evapotranspiration (ETo) estimates when measured meteorological data is scarce and only requires maximum, minimum and average surface air temperature [39,40].
The SWAT requires weather data input, digital elevation models (DEM), soils and land use. We defined the topographical contours for the Laguna del Sauce catchment based on the 30 m grid resolution DEM Shuttle Radar Topography Mission (SRTM 2008) converted to WGS 84 UTM 21 S. Comparing the land use map of 2000 [41] with that of 2015 [35], no significant variations in land use can be detected. The biggest change in land use between 2000 and 2015 was a 7.5% reduction in the percentage of grassland, mainly due to an increase in crops (4.3%), and, to a lesser extent, in forest (2.5%) and urban areas (0.7%). For this reason, Land use and land cover (LULC) were obtained from a 30 m resolution raster map (Figure 1) from the 2015 Land Cover Classification System (LCCS) for the Laguna del Sauce catchment [35] We obtained the soil map with the soil profile description, standardized soil texture and geology classes from the Harmonised World Soil Database (HWSD) [42]. We combined daily temperature data from the Climate Forecast System Reanalysis (CFSR) with daily precipitation from the Climate Hazards Group Infra-Red Precipitation (CHIRPS) with a resolution of approximately 38 km and 5 km [43], respectively. This combination of open-access weather data driving hydrological models in streamflow simulation provides highly accurate results [44,45,46]. Furthermore, CFSR data is available on the official SWAT website via ready-to-use meteorological data at http://globalweather.tamu.edu/ (accessed on 14 May 2020).

3.2. Model Setup, Calibration and Validation

We preprocessed the spatial information used in our study with the QSWAT plug-in module designed for the Quantum GIS software [47]. The Laguna del Sauce catchment was divided into 37 sub-basins and adapted by the SWAT2Lake plug-in module of the Quantum GIS [48] to exclude the lake area. Since there was no streamflow gauging station in the Laguna del Sauce catchment, we used open-access remote sensed data for daily ET data. We calibrated and validated our SWAT model to assess the correlation of the observed and simulated evapotranspiration (ET) data obtained from the Simplified Surface Energy Balance model (SSEBOP; USGS), similar to previous applications dealing with the assessment of the water cycle and land-atmospheric responses [49,50]. Details on the SSEBOP model are provided in [51,52]. We chose the period of 2005 to 2009 for calibration and of 2010 to 2013 for validation, using SSEBOP evapotranspiration records data to compare these records with the simulated data with a warm-up period of 4 years (2001–2004) to reduce uncertainty in the initial conditions. During the calibration, we subjected our model parameters to adjustments to obtain model results that correspond better to the measured data sets. Based on previous studies [53], we conducted manual calibration using a limited set of behavioral parameters identified for evapotranspiration processes, which were the curve number (CN2), the soil evaporation compensation factor (ESCO), and the plant uptake compensation factor (EPCO) (Table 1). We assessed our model performance during the calibration and validation periods by using statistical evaluation indices from [54]: the coefficient of determination (R2), and the Nash-Sutcliffe efficiency coefficient (NSE).

3.3. Climate Change Projections

Climate models are useful to analyse climate change impacts on the hydrologic cycle and freshwater ecosystems [55,56]. We considered the Representative Concentration Pathways (RCP 2.6, 4.5 and 8.5) scenarios for future climate projection by the IPCC based on the Coupled Model Intercomparison Project (CMIP5) [8]. These pathways were developed based on factors such as population growth, socio-economic development and greenhouse gas emissions [57,58]. We based our study on 2 of the CMIP5 Global Climate Models (GCMs) that best fit the observed climate and have already been used and tested for the elaboration of future regionalized climate scenarios for Uruguay [59]. These GCMs were produced by the Met Office Hadley Centre (HadGem2-ES) and the Canadian Centre for Climate Modelling and Analysis (CanESM2), among other international institutions. We selected the RCP 2.6, 4.5 and 8.5 scenarios: the RCP 2.6 indicates a mitigation scenario, leading to reduced greenhouse gas emissions over time, with a pick of radiative forcing pathway driving to 3.1 W/m2 by mid-century and a decline reaching 2.6 W/m2 by 2100 [59]. The RCP 4.5 indicates a stabilized forcing level by implementing a range of technologies and approaches to reduce greenhouse gas emissions to 4.5 Wm—2 before 2100, whereas the RCP 8.5 scenario involves very high greenhouse gas emissions, with an increasing radiative forcing pathway driving to 8.5 Wm—2 by 2100 [59]. These regionalized weather data of each GCM were separately inserted in SWAT. Then, the SWAT model assigned to each subbasin the weather data of the cell that is closest to the subbasin centroid. Based on daily rainfall, we projected minimum and maximum temperature GCM outputs for RCP 2.6, 4.5 and 8.5 scenarios in the near future (NF) (2026–2050), mid future (MF) (2051–2075) and far future (FF) (2076–2100) for the Laguna del Sauce catchment. We considered 25 years of data from historical simulation runs (1 January 1981 to 31 December 2005) as the baseline period. These temporal scenarios were selected based on the availability of CMIP-5 data for historical and future periods. Since spatial resolutions of GCMs are too coarse (~200 km) to assess local hydrological processes [60] and climate model data may contain systematic errors, we did not use such data directly in our simulations. Instead, we used statistical downscaling through the bias correction technique, increasing the accuracy of the downscaled data’s results before applying GCM projections to the calibrated SWAT [9,61]. All the data processing, statistical analysis and corrections were performed in R [62] and the “qmap” package [63]. A quantile mapping bias correction algorithm was used to adjust the distribution of the modelled data (HadGem2-ES and CanESM2) in order to match observed data (CFSR and CHIRPS).

3.4. Indicators for Ecosystem Services Assessment

We selected four hydrological HES according to their significance in the quality and quantity of water in the Laguna del Sauce catchment and data availability. We selected four HES, including natural hazard protection, erosion control regulation, water supply and flow regulation for the sub-basins (Table 2) [26,64]. We also analysed future data changes due to climate change effects on precipitation and temperature. To this, we assessed local climate change impacts based on future precipitation, evapotranspiration and temperature alterations. We evaluated the climate change impact on floods through daily streamflow extracted from SWAT outputs and the estimation of several parameters included in the Indicators of Hydrologic Alteration in RiverS (IAHRIS) software [65]. IAHRIS is a free software developed by the Centre for Public Works Studies and Experimentation (CEDEX), which determines the degree of streamflow alteration through a range of indicators. A more detailed IAHRIS software description is given in Section 3.4.2. To represent the HES of land coverage capacity to retain soil (erosion control), we analysed the sediment yield export, through the SWAT variable “SYLD,” which is the sediment yield transported from the sub-basin into the reach per year metric tons/ha [66,67]. In this study, we understood water supply services as those related to the infiltration, retention and storage of water in rivers, lakes and aquifers, while we understood regulation services as those implying the regulation of water flow on the ground surface to maintain the watershed conditions through evapotranspiration and infiltration [68,69]. We quantified water supply directly from SWAT outputs through the water yield value, which is the net amount of water (surface and ground waters) that leaves the sub-watershed and contributes to streamflow. Furthermore, to account for water regulation features, we quantified the green and blue water values. Here, we refer to green water as the amount of water available for evapotranspiration and transpiration held above the groundwater table and blue water as the surface water and groundwater in water bodies [70,71].

3.4.1. Estimation of Blue and Green Water Using SWAT Model

Water availability, including blue water (BW), green water flow (GWF) and green water storage (GWS), was estimated by the SWAT on the basis of the hydrological cycle simulation [73,74,75]. We calculated BW by combining water yield (WYLD) and deep aquifer recharge. The calculation of BW is formulated as follows:
BW = WYLD + DA_RCHG
where WYLD refers to the net amount of water (surface and ground waters) that leaves the sub-watershed and contributes to streamflow within the time step (mm) and DA_RCHG indicates the recharge of deep aquifers (mm).
In the case of the green water (GW) calculation model, the water is distributed into green water flow (GWF) and green water storage (GWS) [21]. The calculation of GW is expressed as follows:
GW = ET + SW
where green water is estimated as the sum of GWF as actual evapotranspiration (ET) and GWS as soil water content (SW), expressed in millimeters [74]. To estimate the percentage of precipitation that is transformed in ET, we used the green water coefficient (GWC) sensu [75], which is the equivalent of the evapotranspiration coefficient. The use of the GWC highlights the rate of transformation from precipitation to GWF. The equation is expressed as follows:
GWC = (P − BW) ÷ P
where GWC is the green water coefficient, P is precipitation and BW is blue water.

3.4.2. Description of Parameters from IAHRIS Used for Flood Analysis

We assessed the impact of climate change on floods in the Laguna del Sauce watershed by Indicators of Hydrologic Alteration in RiverS (IAHRIS) software version 2.2. IAHRIS is an open-access software program [76] that includes 24 Indicators of Hydrological Alteration (IHA) that can determine the degree of alteration between historical flow data and future flow data series. First, 25 parameters are calculated using historical and future streamflow data, and then IHA are obtained based on parameter comparison [55]. These IHA are related to the usual, maximum extreme (floods) and minimum extreme (droughts) values. We assessed the impact of floods on ecosystem services based on the parameters shown in Table 3. To consider all the significant aspects related to the ecological processes of the riverine ecosystems, we classified the parameters in terms of magnitude and frequency, variability, duration and seasonality. The magnitude and frequency of floods were analysed using not only the annual maximum daily flow (MMDF) but also the effective discharge (ED), connectivity flow (CF) and flushing flow (FlF). ED is related to the mobilization and transport of sediment materials being responsible for the geomorphology of the riverbed, and it is calculated through the following equation:
ED = MMDF × (0.7 + 0.6 × CV_MMDF)
where MMDF is the average of yearly maximum daily flow and CV_MMDF is the coefficient of variation of yearly maximum daily flow.
The CF makes the maintenance of the lateral floodplain connectivity possible and guarantees an adequate humidity condition for the different stages of the biota. The CF must be higher than the ED to exceed the riverbed and access the floodplain. IAHRIS estimates the CF as the flow corresponding to twice the return period of the ED in the study period. FlF is defined as a 5% exceedance percentile. Variability depends on the coefficient of variation of the maximum and flushing flows, and duration is defined as the maximum number of consecutive days registering flows above 5%. Finally, flood seasonality is assessed for each month by calculation of the average number of days with a percentile above 5%. A more detailed description of the calculation parameters used can be found in [76,77].

4. Results and Discussion

4.1. Calibration and Validation

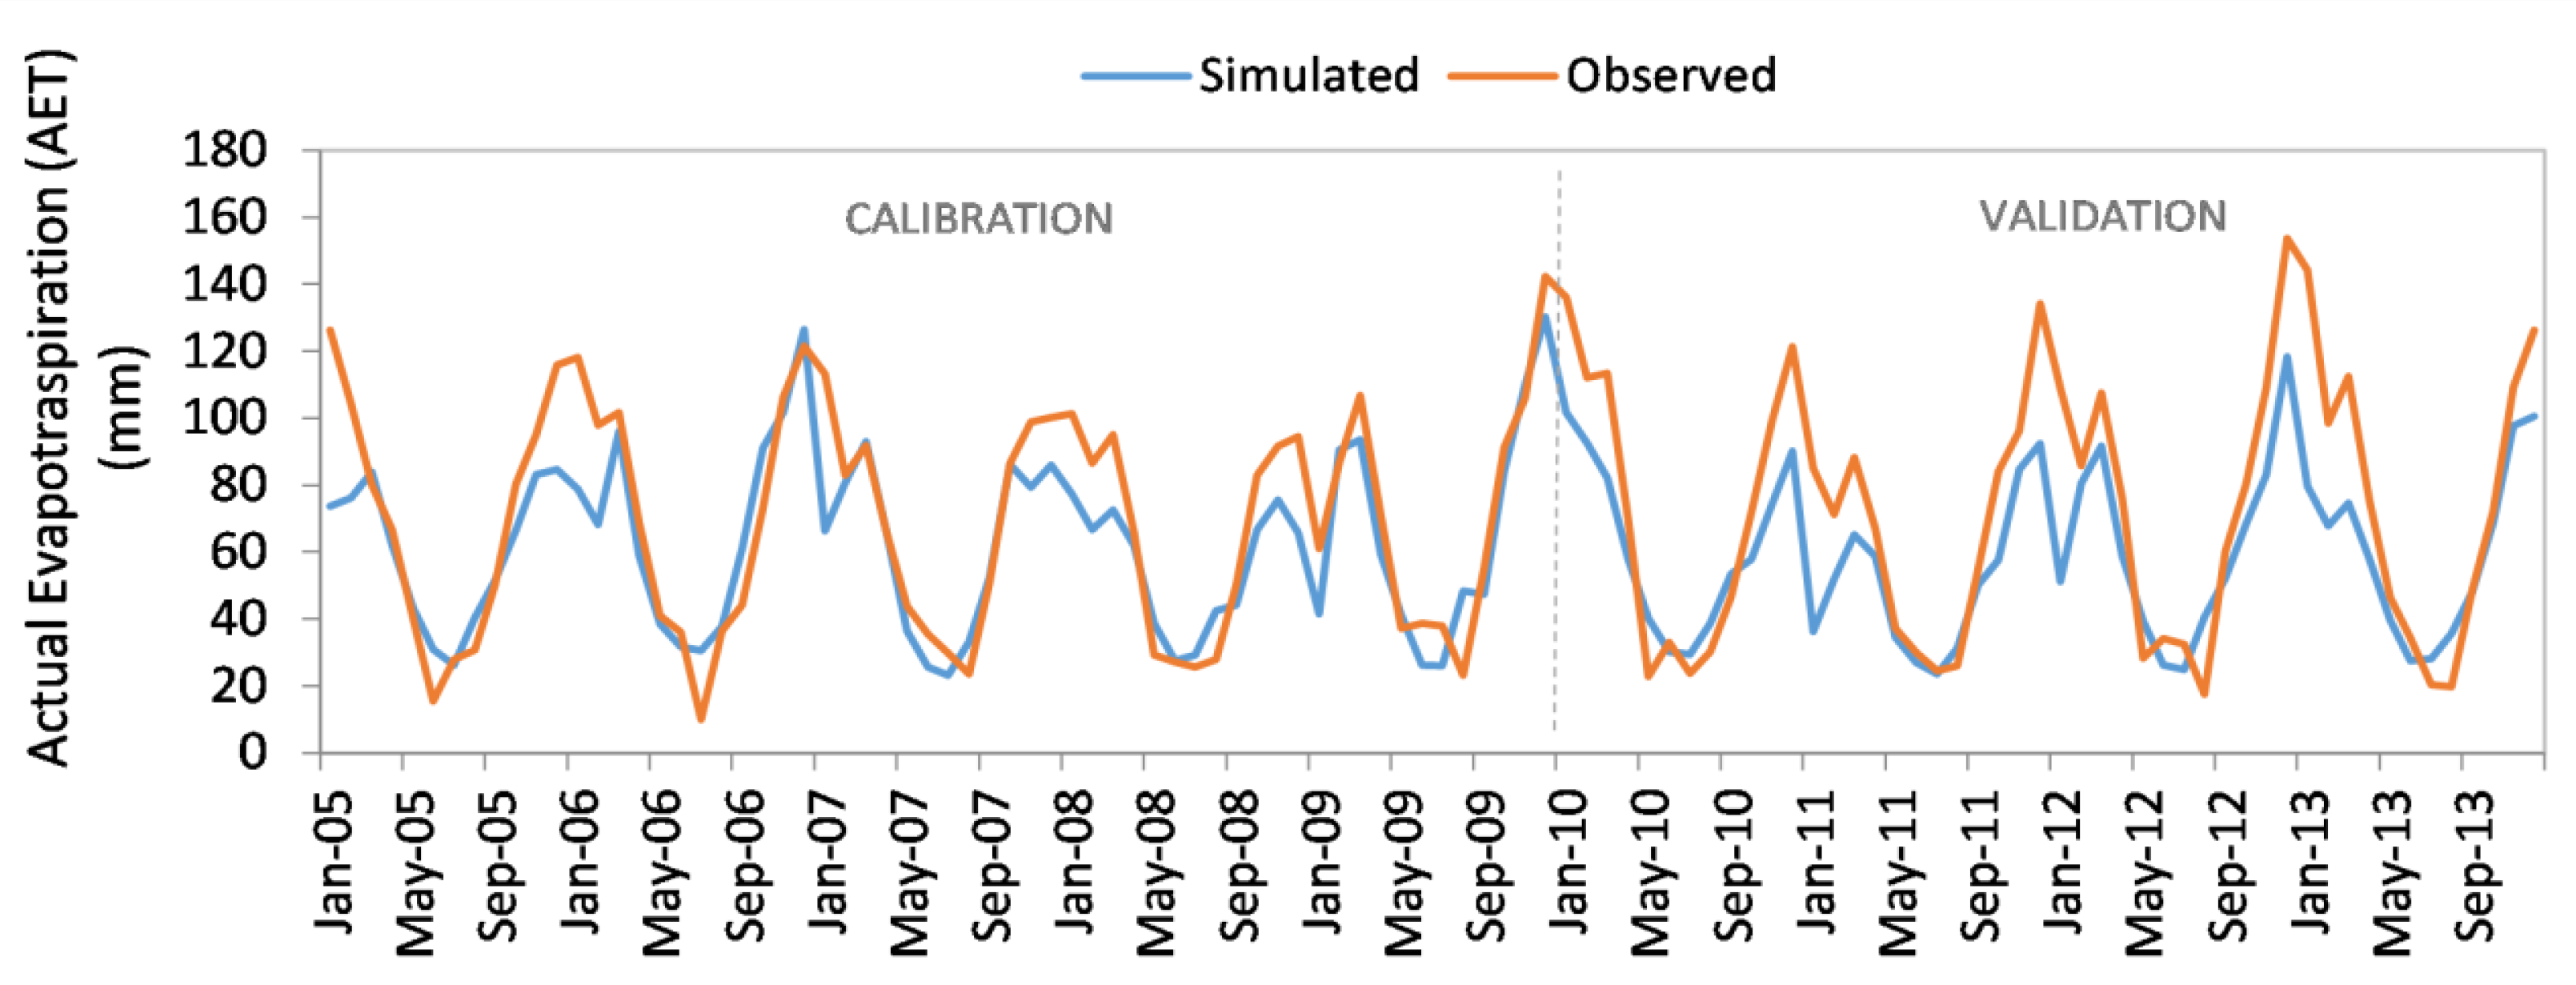
Calibration and validation of the SWAT model is usually performed by using streamflow data. However, in recent years, several works have been published [78,79,80] that show that by calibrating only with satellite evapotranspiration data, it is possible to obtain reasonable streamflow estimates at ungauged catchments. Using remote-sensed data from ET, our SWAT model was calibrated from 2005 to 2009 and validated from 2010 to 2013. We reduced the CN2 parameter values by 10% and replaced the ESCO by 0.8 and the EPCO by 0.95. Running our model with these specified optimal values was consistent with previous studies in similar climatic conditions and thus allowed us to evaluate the performance of our model [81]. After the calibration and validation, we analysed the results statistically to evaluate the performance of the hydrological simulation (Figure 2). Monthly NSE and R2 values for calibration and validation were 0.74, 0.64 and 0.79, 0.84, respectively. These values are similar to other hydrological models that have used satellite-derived AET data for calibration and validation, as we followed the same performance ratings used on previous contributions [82,83,84,85]. Overall, the statistical indices for the calibration and validation results showed a high correlation between the monthly observed and simulated ET. Hence, our results support the utility of remote-sensed data from ET for modelling data-scarce regions and ungauged basins. Given the calculated statistical indices, our model performance can be categorized as satisfactory in agreement with Awan and Ismaeel (2014) criteria [53], where the authors calibrated the SWAT model at the monthly scale with only actual evapotranspiration data, considering that the model performance was satisfactory if R2 is greater than 0.6 and NSE is greater than 0.5. Furthermore, our model simulation estimated an average contribution to the lake of around 270 mm3/year, coinciding with previous models of annual inflows to Laguna del Sauce [27]. AET represents a large fraction of total precipitation (68%) which is consistent with the results reported by the Government of Uruguay in its National Water Plan [86] for the hydrological region of the Río de la Plata and its Maritime Front, where 71% of total precipitation is lost as actual evapotranspiration.
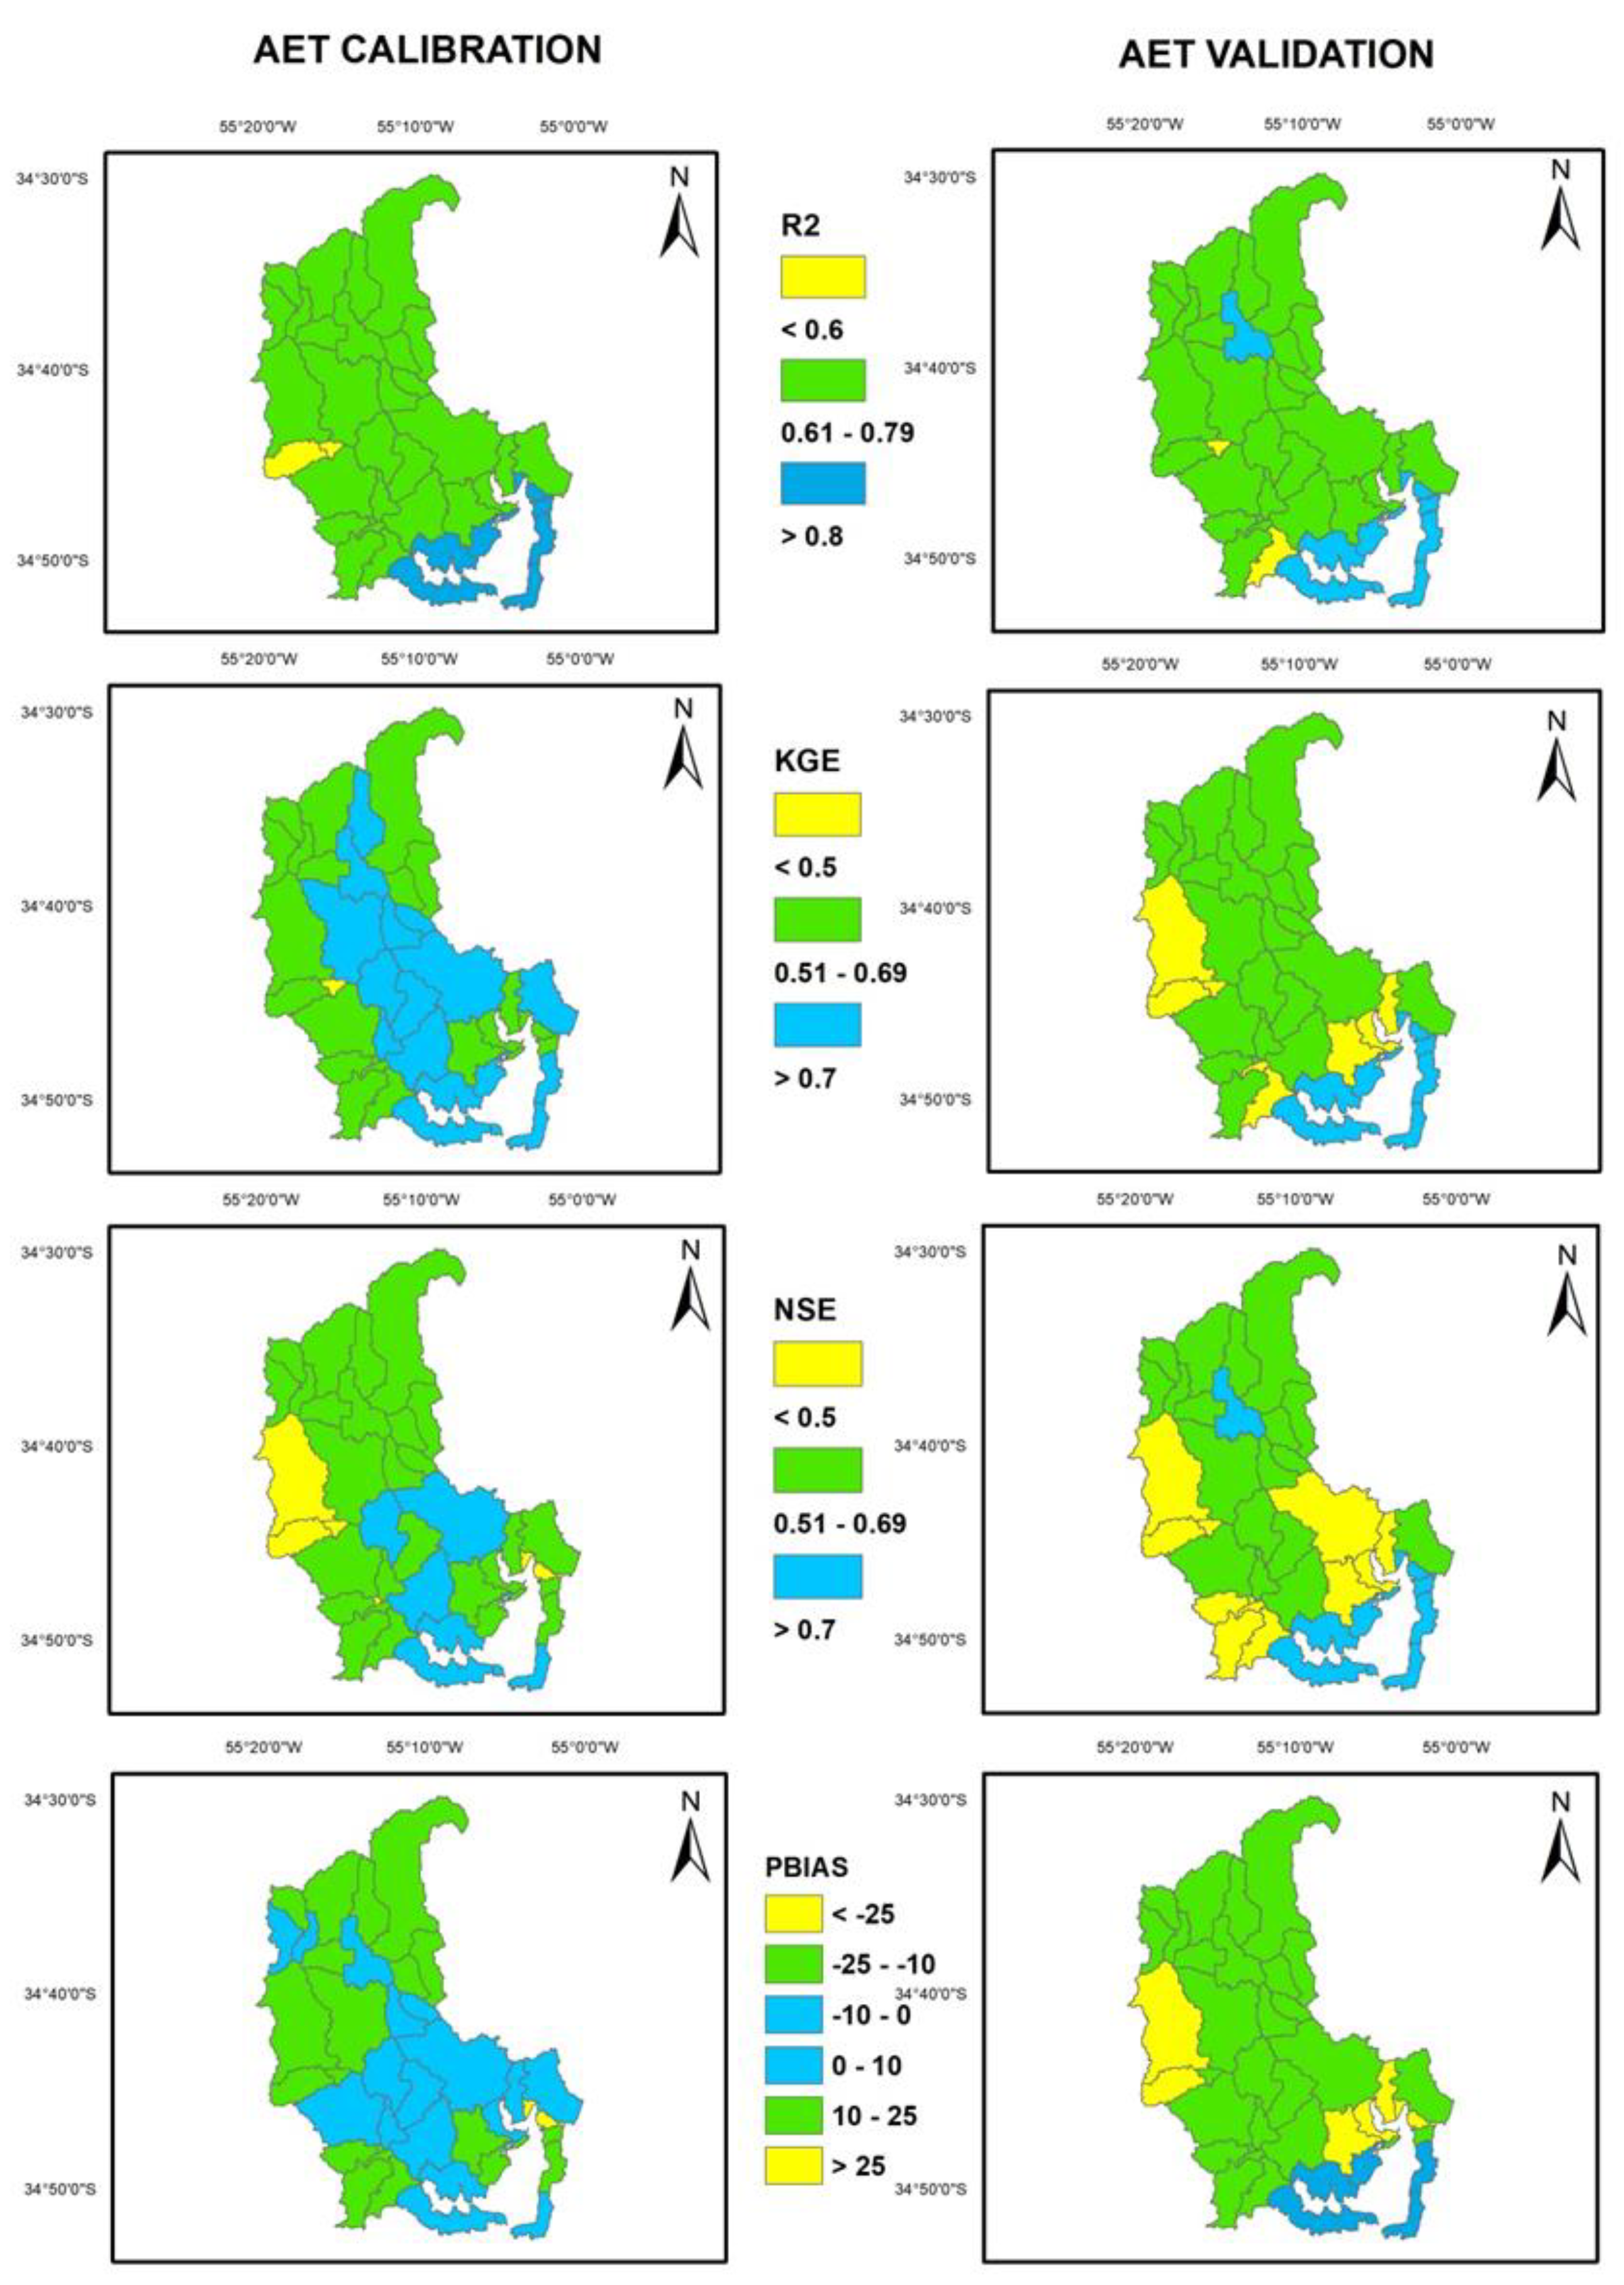
As can be seen in Figure 3, although the calibration has been carried out on a basin scale, the results on the sub-basin scale are also generally acceptable.

4.2. Climate Change Impacts on Rainfall and Temperature

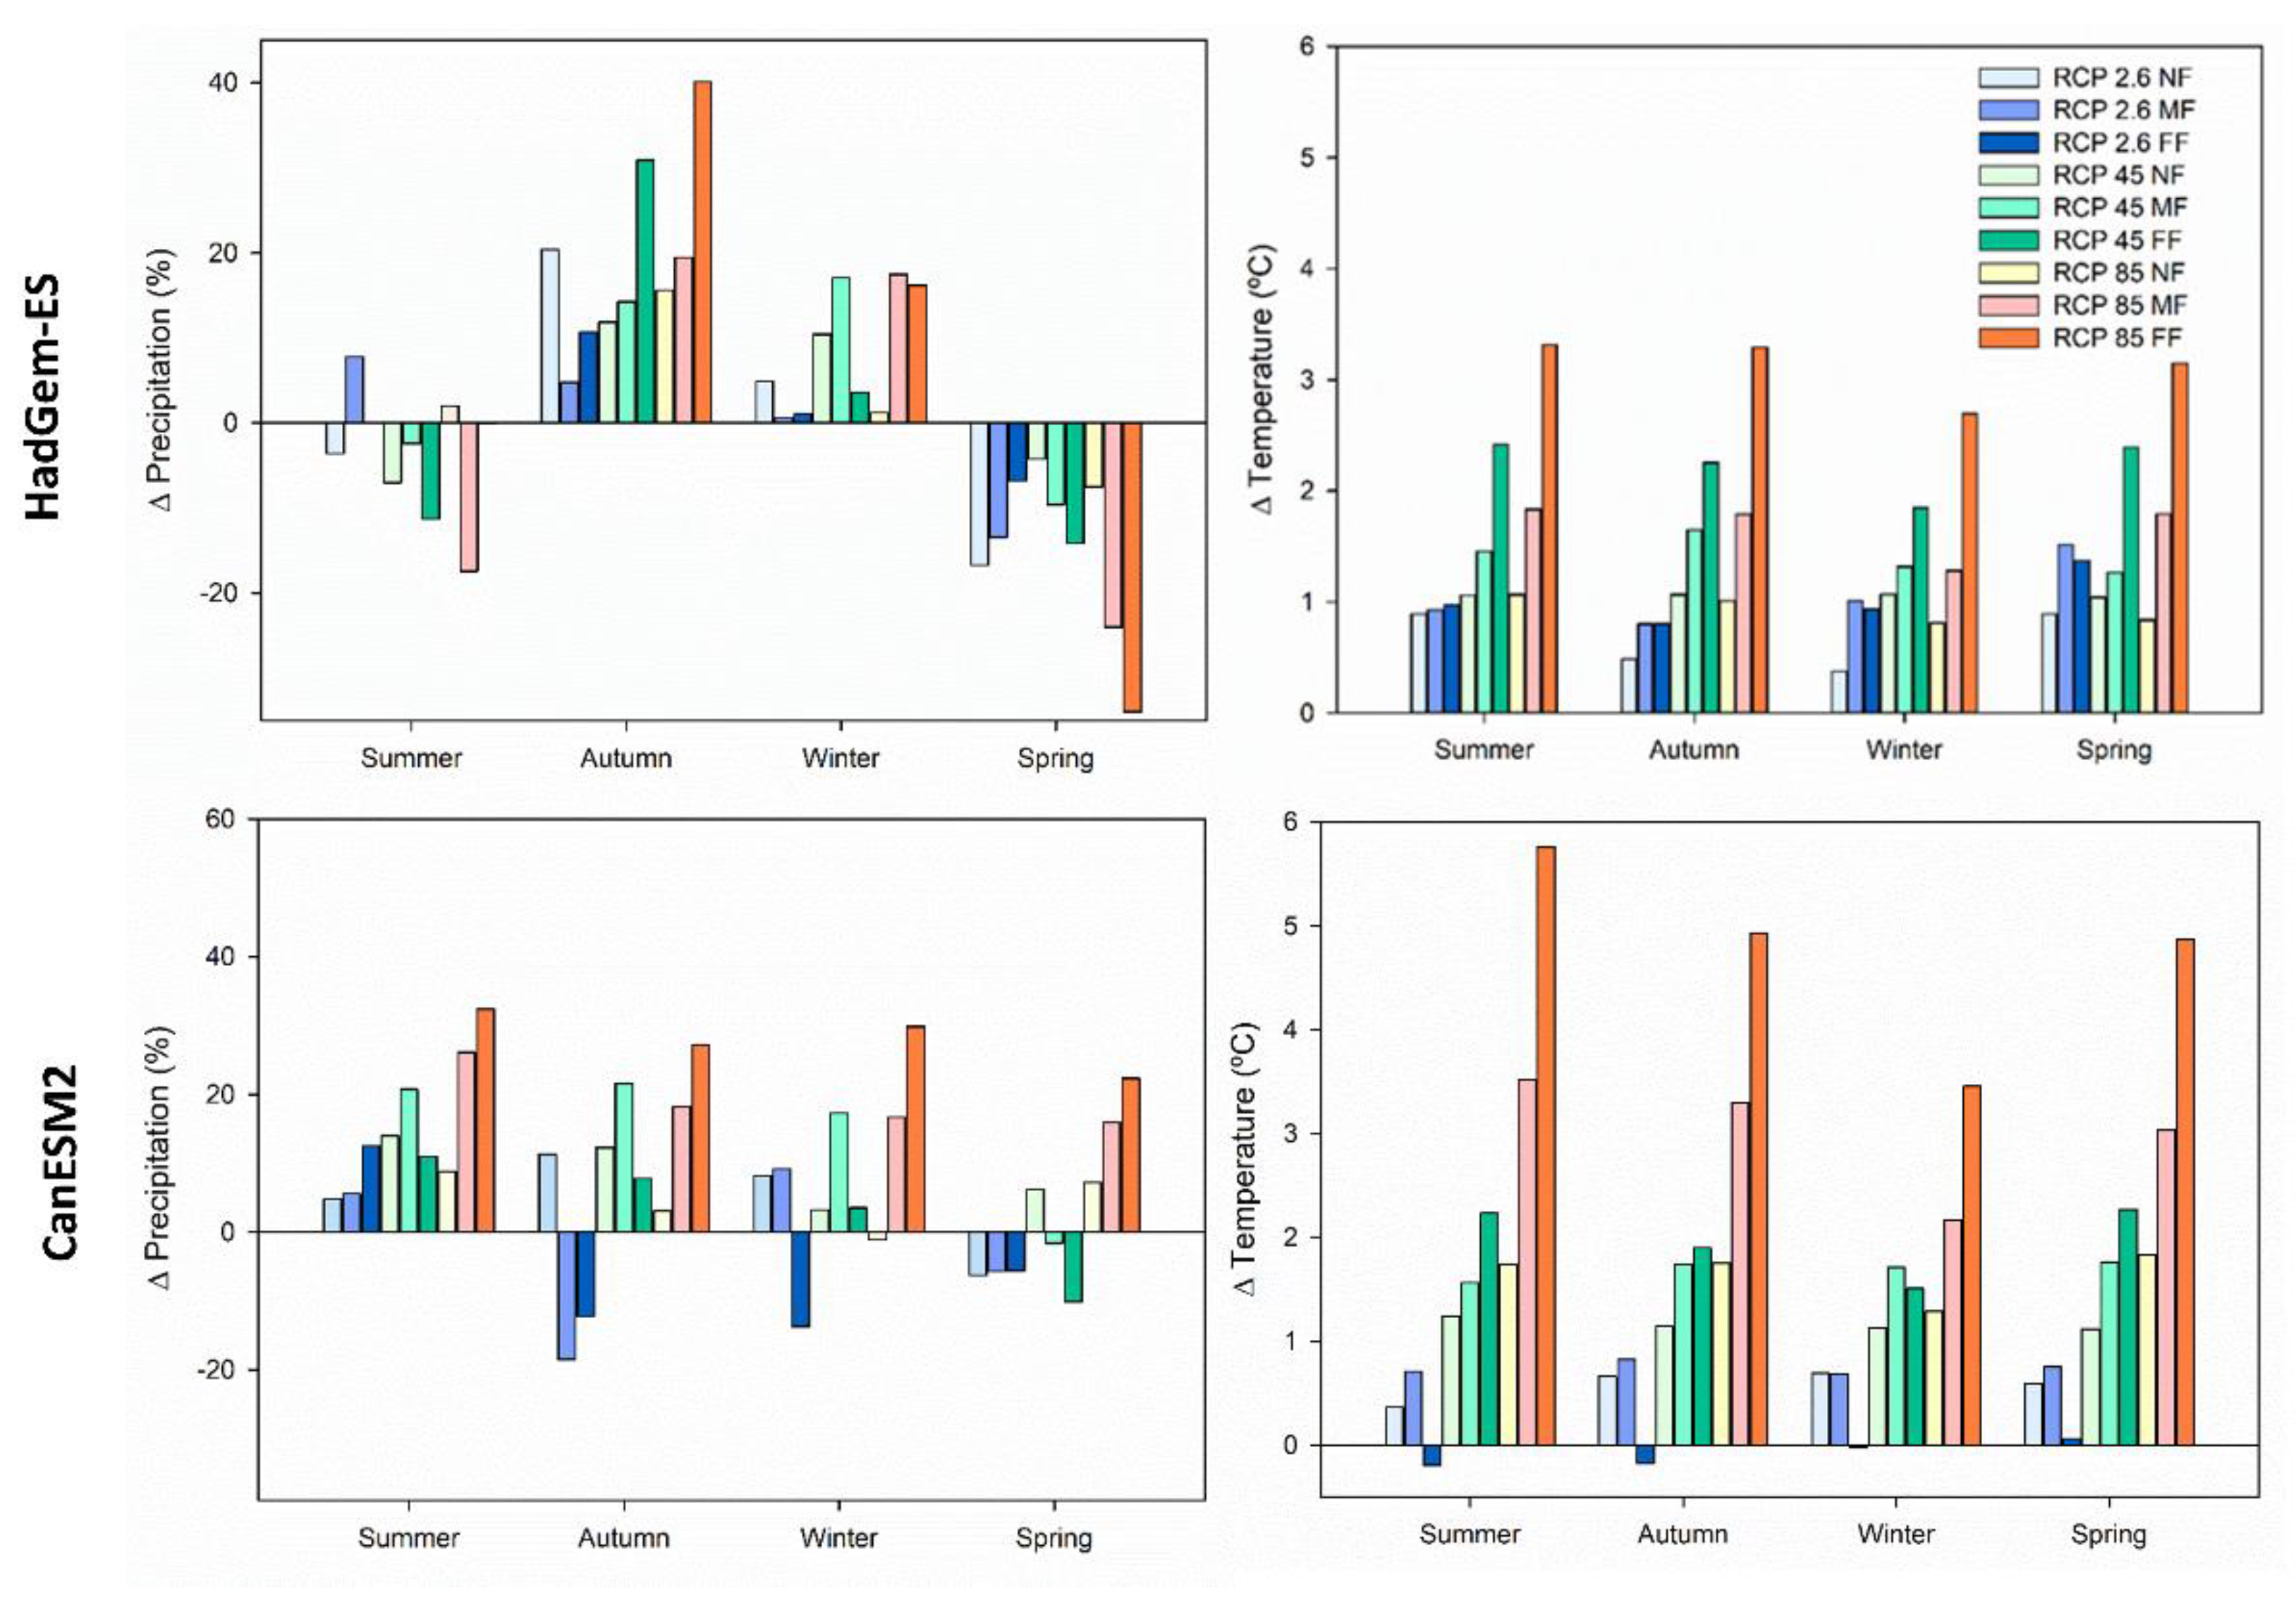
Here, temperature, evapotranspiration and future alteration values of precipitation (Table 4 and Figure 4) are described for the following periods: the NF (2026–2050), the MF (2051–2075) and the FF (2076–2100). We also compared the anomaly to the baseline period 1981–2005 under RCP 2.6, 4.5 and 8.5 scenarios (Table 4). All scenarios and periods corresponded to a projected decrease in precipitation during spring (Figure 4). Additionally, for summer, the CanESM2 model predicted more precipitation, and the HadGem2-ES model less precipitation. In addition, HadGem2-ES projected a marked increase in seasonal precipitation during the autumn and winter months. The CanESM2 model predictions showed more precipitation in the winter and summer months for all RCP and the overall analysed periods. Based on the CanESM2 and HadGem2-ES models, the Laguna del Sauce catchment is projected to experience a wetting trend except for in spring, where we can see a marked decrease in precipitation. This is consistent with previous findings that predicted increased rainfall in Uruguay [29,87] for 2030 and 2050 under RCP 2.6, 4.5 and 8.5 [58].
Our simulation projected higher temperatures for all the future scenarios and periods with moderate variations for RCP 2.6 scenarios and particularly high temperatures for RCP 4.5 (FF) and 8.5 (MF-FF) (Figure 4), coinciding with previously projected trends for Uruguay [29,58,87]. The forecasted warming based on the annual average of both climate models used for the RCP 4.5 scenario shows an increasing trend across the considered periods, with extreme values of +1.98 °C for the RCP 4.5–FF (CanESM2) and +2.23 °C for the RCP 4.5–FF (HadGem2-ES). These variations are accentuated in the spring and summer seasons, particularly for the CanESM2 model and RCP 8.5. The warming trend based on the annual average of the models used for the RCP 8.5 scenario shows a marked increasing trend across the considered periods, with extreme values of +4.75°C for the RCP 8.5–FF (CanESM2) and + 3.12 °C for the RCP 8.5–FF (HadGem2-ES). This warming trend might seriously impact the livestock sector, which is of great economic importance at the national scale [88,89] and comprises the main use for land in our study area. By affecting the quantity and quality of livestock feed as well as inducing heat stress, warming might reduce milk production and thus affect animal life cycles [88], implying drastic changes in the production system [29,89].
Climate warming and changes in precipitation promote shifts in habitats and seasonality, affecting the adaptation capacity of freshwater species and altering food webs and ecosystem functions [90,91,92]. This is predicted to increase nutrients loading in freshwaters, which in combination with warming may promote harmful cyanobacterial blooms [93,94,95,96]. Since our predictions indicate higher precipitation, it can favour the runoff and drag of nutrients and sediments from the catchment to the Laguna del Sauce ecosystem. The combined effect of increased nutrients and global warming increases the potential for macrophytes and phytoplankton. However, higher rainfall also reduces the lake residence time and the flushing of potential phytoplankton blooms. Moreover, rising precipitation, temperature and intensification of land use, especially for agricultural purposes, increase the potential for cyanobacterial blooms [95,96]. Even though the effects of both eutrophication and climate change on the blooms of harmful cyanobacteria are complex to understand, authors have suggested that climate change could increase the magnitude and occurrence of these events [92,94,96]. Therefore, our predictions regarding the climate regulation in our study area due to the effect of climatic change may affect critically the provision of local ecosystem services, such as drinkable water and food production systems.

4.3. Effects on Hydrological Ecosystem Services

4.3.1. Water Regulation and Supply

We quantified the effects of climate change on water budget distribution for each simulated period, aggregating our results for each sub-watershed, and the variation of the effects from the baseline is expressed in a percentage for the entire catchment (Table 5). The total annual water yield volume for RCP 2.6 based on the ensemble of both models increased by 11.2% but decreased by 5% NF and 1.9% FF. Whereas, the total annual water yield volume for RCP 4.5 based on the ensemble of both models increased by 9.28% for the NF and 14.64% for the MF from the baseline. Yet the projected water yield for the FF period showed a decrease of 6.88% compared to that for the MF period. For NF-RCP 8.5, we predicted an increase compared to the baseline of 3.10% less than the same period in the RCP 4.5 scenario. The water yield increased with precipitation, and the extreme value (342.98 mm) appeared under FF-RCP 8.5. However, the NF and FF, respectively, had projected increases of 19.96% and 30.92% on water yield. Such projected water yields may likely enhance drinking water provision. Precipitation has an especially strong influence on water yield, as we can relate it to the local climate change impact analysis. We also found differences between the forecasting of the CanESM2 and HadGem2-ES climate models, and such differences generate uncertainties in the interpretation of the potential effects driving water yield projections.
Our results indicate that increased precipitation and evaporation under warming scenarios are likely to increase BW and GWF in the Laguna del Sauce catchment for the 2026–2100 period (Table 5). Whereas high temperature can increase GWF, this indicator seems to particularly increase along with precipitation [97]. However, BW will increase more than GW, and thus a downward trend of GWC is observed. This trend is explainable because foliage returns part of the precipitation, which returns to the atmosphere by evaporation. Yet these results must be considered carefully, as the afforestation in the Laguna del Sauce catchment is mainly composed of Eucalyptus spp., which has a great water demand and soil acidification impact. This afforestation increases GWF and reduces the refill of aquifers (BW). Our results suggest a negative impact of afforestation on hydrological cycles increased by the consolidated forest production model for Uruguay. As 48.4% of the catchment is categorized as forestry priority, of which 29.7% is currently forested [37], increasing afforestation in the catchment would likely decrease the amount of water to reach the lake; at the same time, acidification would affect water quality, increasing the release of nutrients from soils. Even though the construction of LULC scenarios under climate change is beyond the scope of this paper, it is an issue that needs to be addressed in the future.
As expected, increased precipitation leads to an increase in water yield, which can cause an increase in the flood hazard of the watershed due to increased rainfall intensity and extreme storm events (see Section 4.3.3.). However, the variation of annual groundwater recharge is very limited as most fraction of high intensity precipitation will be partitioned off as surface runoff rather recharge. From a seasonal perspective, most scenarios show an increase in recharge in autumn and winter, which contrasts with a recharge decrease in spring. There is no clear trend in summer (Figure 5). These variations have a similar pattern to the seasonal variations of precipitation shown in Figure 4.

4.3.2. Soil Erosion Control

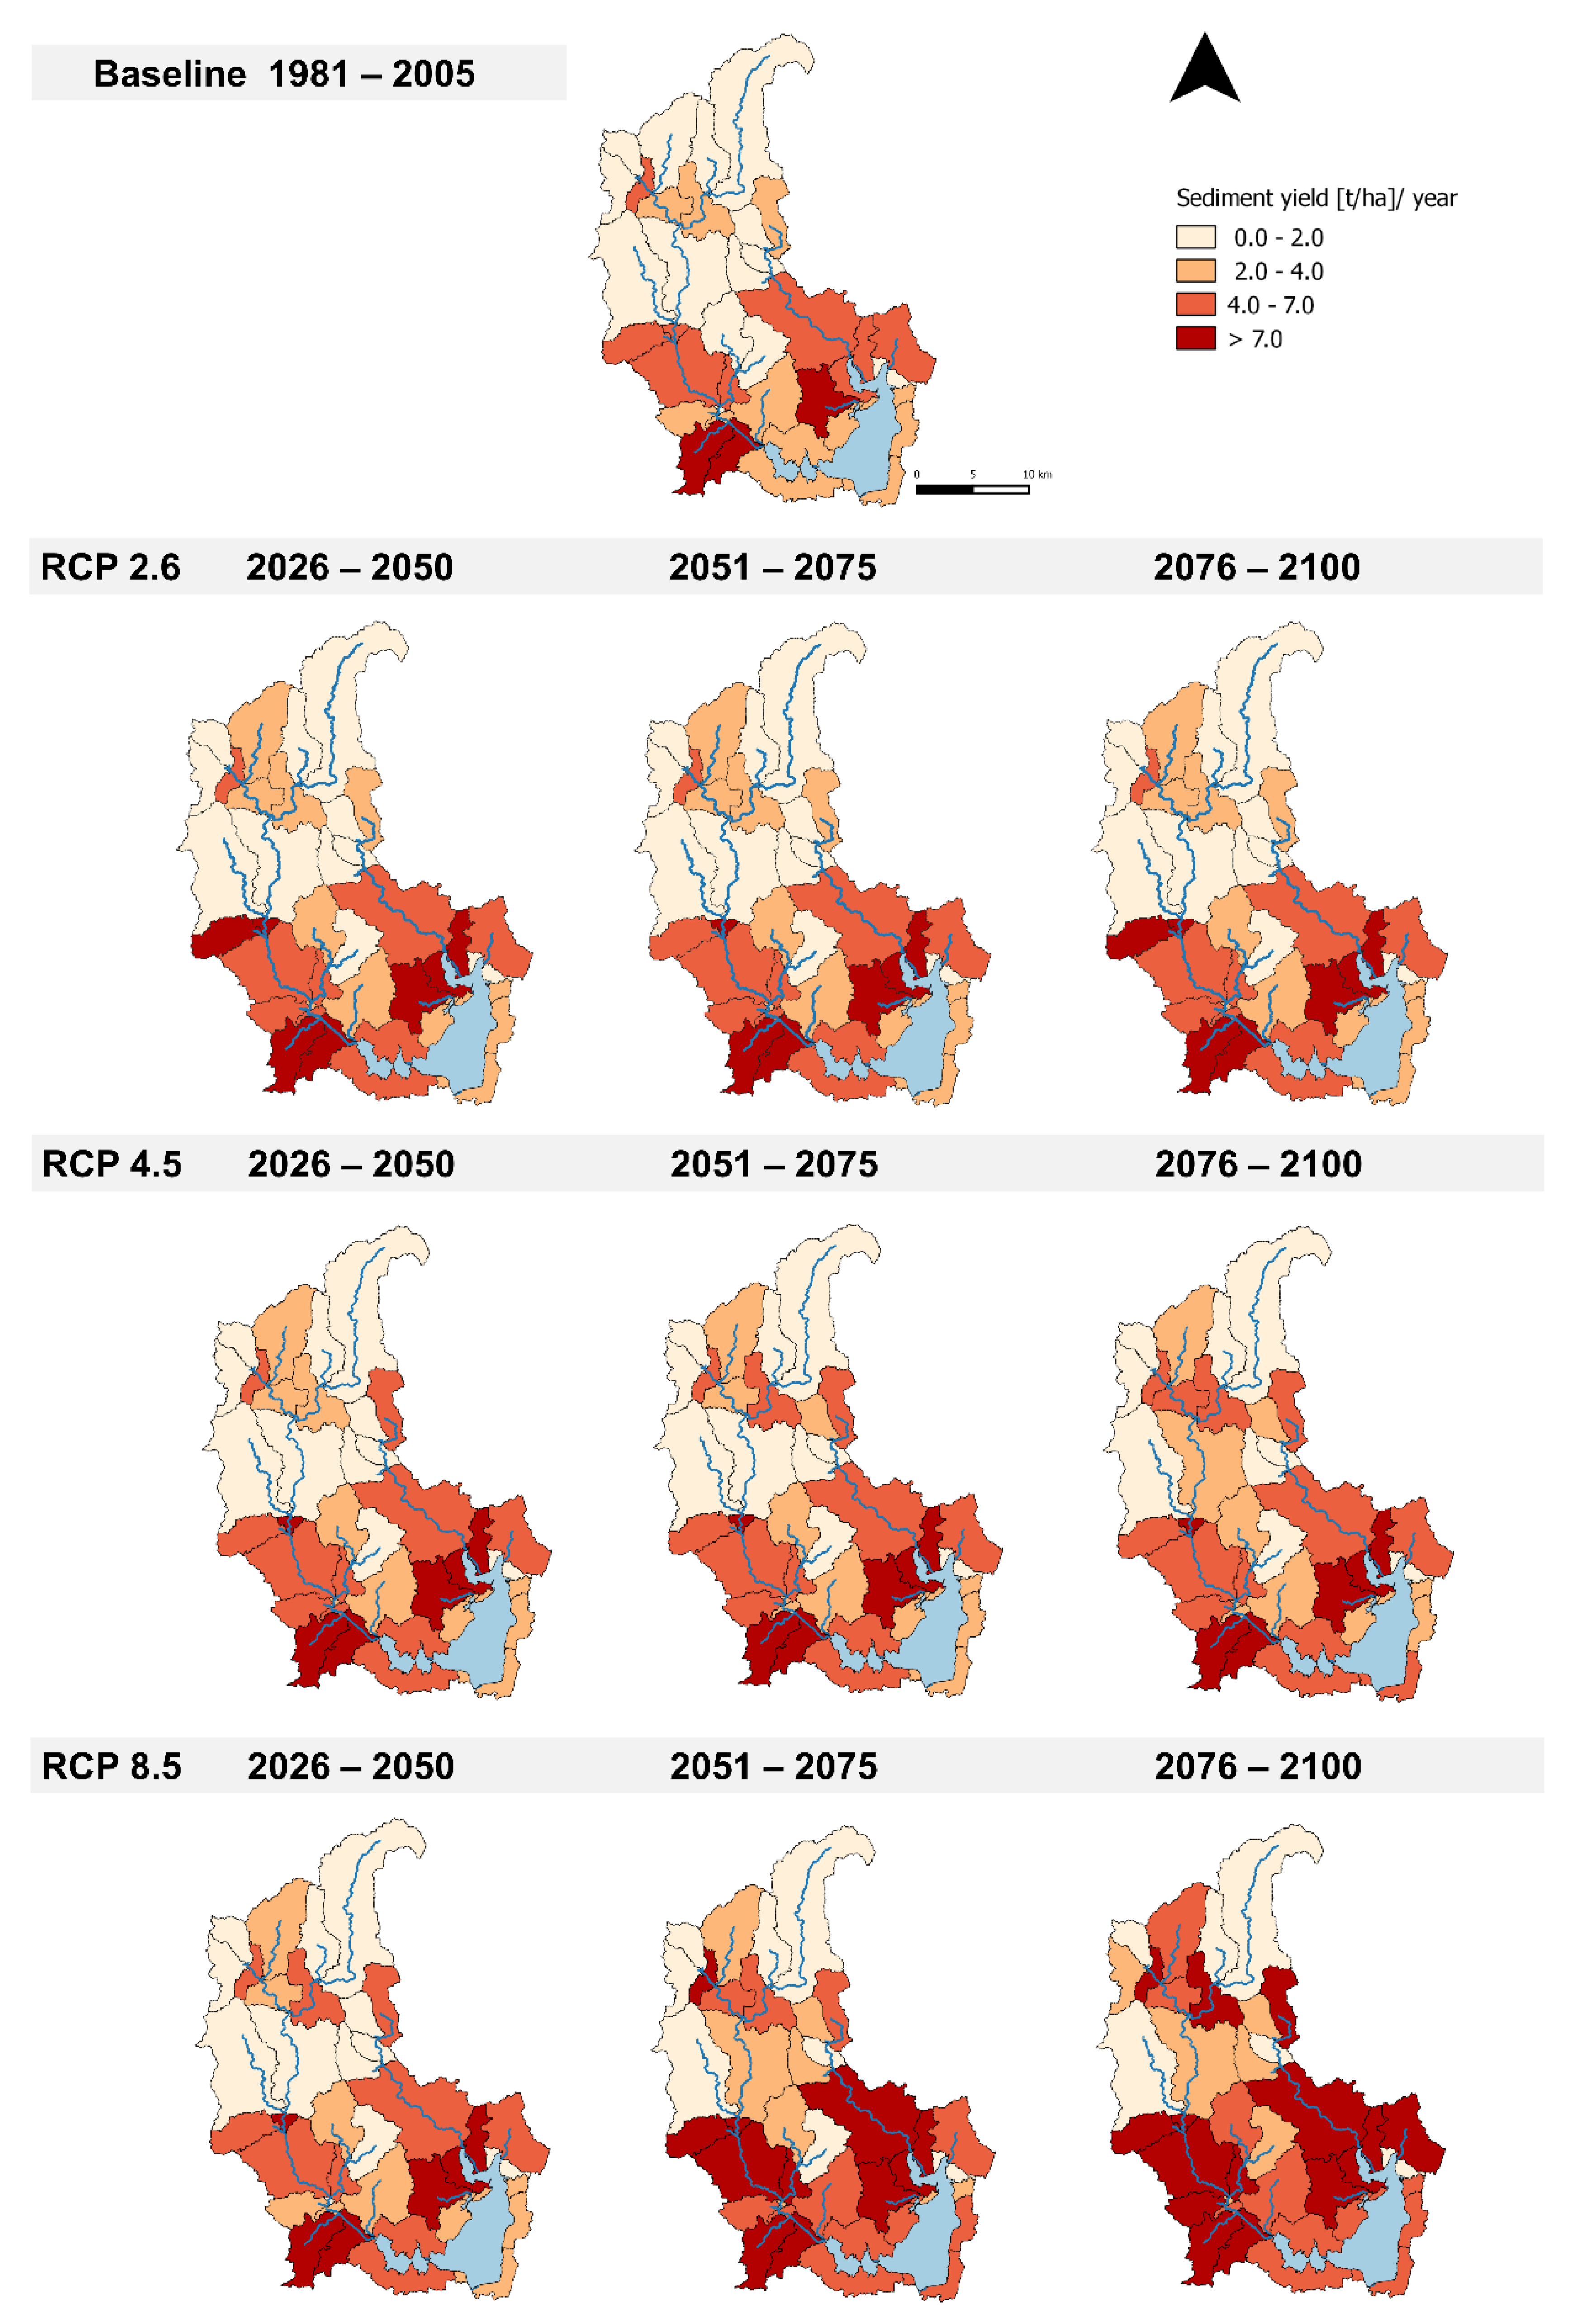
For each model and RCP for each sub-basin, we accounted for the variation of the sediment yield from the baseline (Figure 6). Both GCMs present similar outputs on sediment yield, so the results in Figure 6 are presented as an ensemble. The sediment yield mapping at the sub-basin level indicates which areas have a low or high contribution to the regulation of erosion and thus can be prioritized for preservation and mitigation efforts.
Variations in sediment yield may owe to factors such as slope, management practices, proximity to streams and lack of downstream retention [98]. Here, sediment yield increased in response to forest plantation, agricultural and urban land uses (Figure 1 and Figure 4), which might increase sediments and nutrients inputs to the lake. We observed an increase in sediment yield in the sub-basins surrounding the main tributary rivers of Laguna del Sauce: Arroyo Pan de Azúcar and Arroyo Sauce. The vulnerability in these areas will likely become more evident and could result in reductions in HES supply. The areas that present a greater variation in future scenarios have an erosion estimation as high or higher than 7 t ha−1, which is more than the tolerable loss defined for Uruguay [99], implying that such areas are contributing “hotspots” to the sediment budget. Increases in sediment yield, such as that observed in the Laguna del Sauce catchment, negatively affect water quality, increasing turbidity and eutrophication [100,101]. These results may result in synergy with our local climate change predictions, particularly during winter (Figure 4), since the increase in extreme rainfall events is associated with an increase in sediment transport throughout the catchment.
Since areas with sediment yield greater than 7 t ha−1 will increase over time, considerable growth in the sediment budget towards water bodies is also implied. Areas where native vegetation together with grassland predominates under the current land-use (Figure 1) are the ones contributing the least to the sediment budget. Erosion control by grasslands is strongly coupled with water regulation and supply [102,103]. This should be carefully considered, as the conversion of grassland and native forest to cropland and afforestation could generate a significant increase in soil erosion and soil loss. Therefore, grasslands and native forest land cover need to be maintained and preserved to prevent erosion. However, those making efforts on such preservation should contemplate the trade-offs associated with overgrazing by livestock production, which restricts the soil erosion control service provided by these ecosystems [104,105,106]. Furthermore, other risks associated with this activity should be considered, such as the direct access of watering livestock to water bodies and courses and the accessibility of riparian areas, which contributes to native forest deterioration and reduces HES provision for soil erosion control.

4.3.3. Natural Hazard Mitigation

The IAHRIS results indicate that, regarding floods, the hydrologic shift will be mainly produced in terms of magnitude and duration. Under the RCP 8.5 scenario, both GCMs predict an important increment in the magnitude and frequency of floods, especially for the FlF, where MMDF, ED and CF would experience increases of up to 40% (Table 6). These results are consistent with previous climate change scenarios for South America that predicted increases in extreme droughts and rainfalls (IPCC, 2007), affecting hydrological regimes [107,108,109]. These changes mean higher erosion and transport capacity and new morphological results in the search for the balance of the system. The usual values of floods (FlF) would also increase from 8.80 to 10.46 and from 11.89 to 13.51 in the CanESM2 and HadGem2-ES models, respectively. The maintenance of the FlF is one of the key factors of the HES provision because, as they are small avenues, they only can drag the finest materials. This factor, together with the flood’s high frequency (several times a year), guarantees adequate substrate conditions for spawning and reproduction and the sustainability of the riverbed. RCP 4.5 does not present a clear trend, since variations in the magnitude of floods are lower than in the RCP 8.5 results. It can be noted from HadGem2-ES that there would be a reduction in the variability of floods, while CanESM2 does not present such a clear trend. Overall, both models agree on an increment in the duration of the floods, especially in 2070–2099, when CD_Q5 would have more than 10 consecutive days in a year with a percentile above 5%, which could result in loss of the river rapids [107] and an increase in the mortality rate of the most sensitive plant species due to anoxia stress if the flooding period increases [108]. The massive decomposition of sensitive plants may cause an additional supply of nutrients [109], aggravating eutrophication.
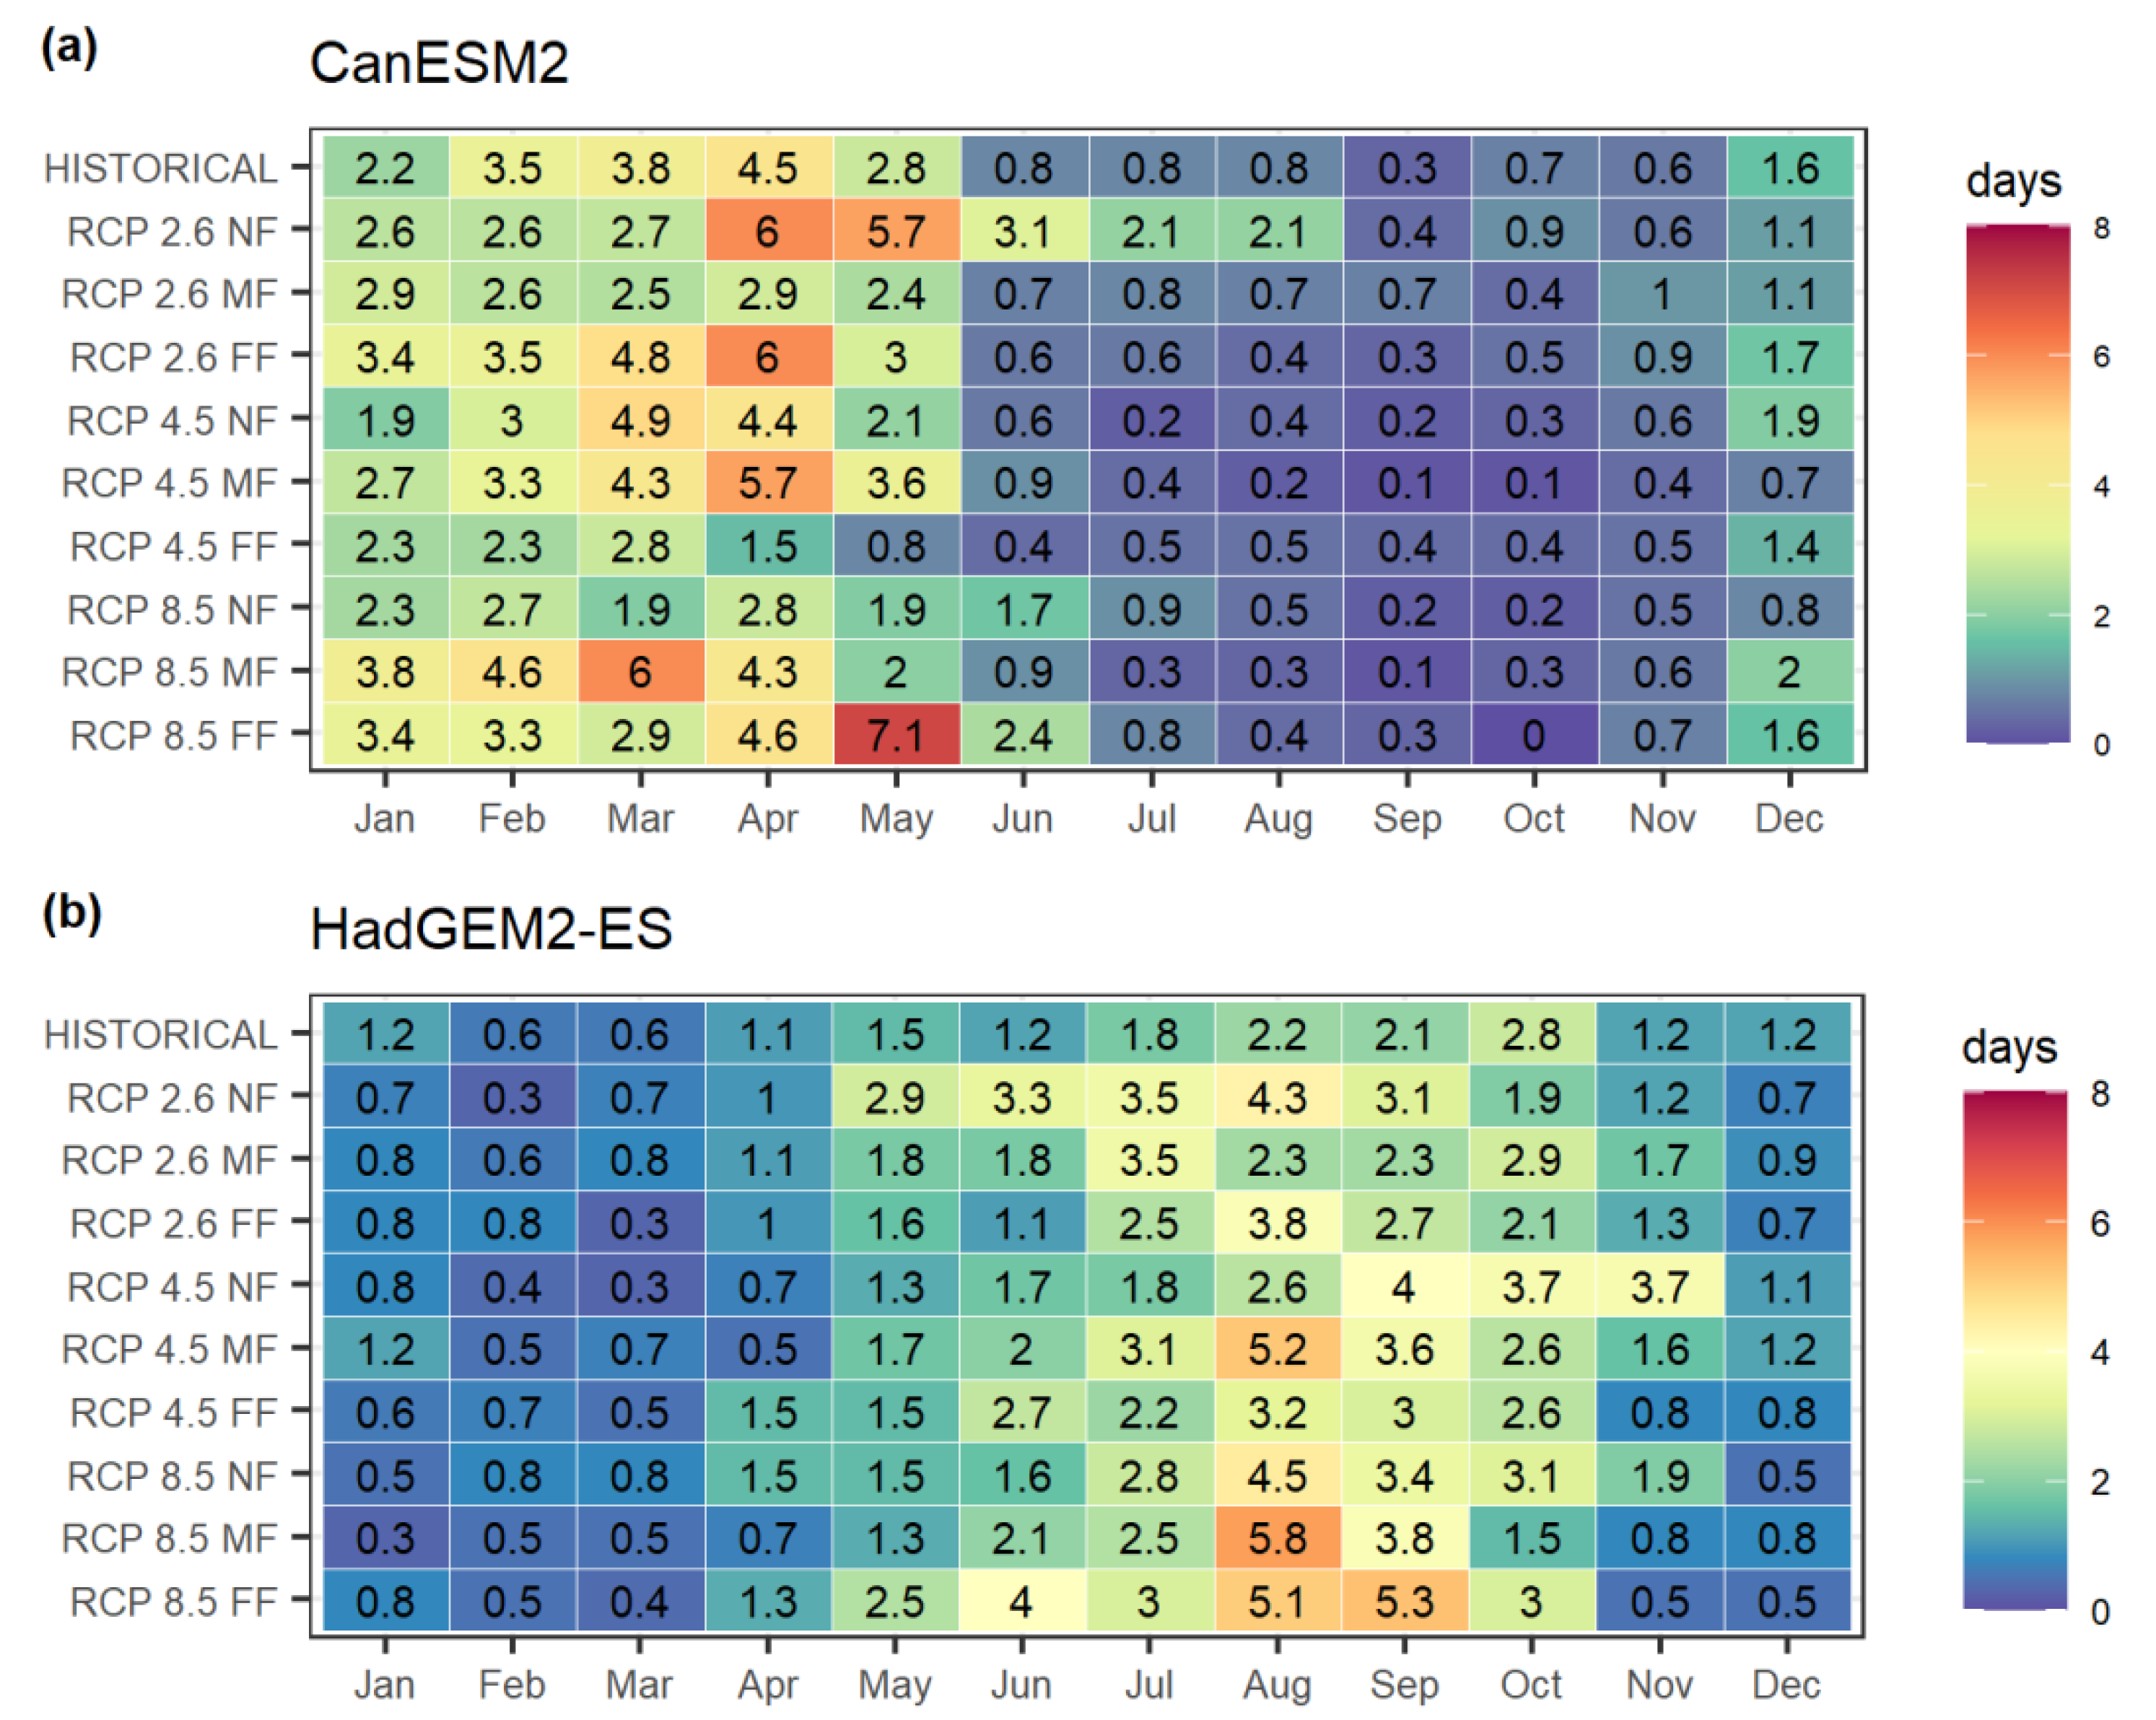
Related to the seasonality of floods, it can be noted from the heat maps included in Figure 7 that there will be some changes in the seasonal patterns of flooded days that appear on average each month due to climate change. These changes will be particularly significant during the wettest periods in 2070–2099 under the RCP 8.5 scenario, in which we were able to find changes in the CanESM2 model from 2.8 to 7.1 days in May or changes in the HadGem2-ES model from around 2 to more than 5 days in August and September. These increases imply the persistence of extreme conditions which may not be adapted to our species and could lead to the practical disappearance of the necessary synchrony between the phenology of many species and environmental variables associated with circulating flows (i.e., velocities, content in dissolved oxygen, turbidity, temperature). In this way, the life cycles of many native species would be altered, and these changes could enhance the intrusion of foreign species with a level of environmental demand that is much less restricted.

4.4. Limitations of the Study and Future Improvements

Even though spatially explicit models are a cost-effective way to quantify and map the supply of ecosystem services, their application has some limitations. These limitations are mainly related to the quality and reliability of the input data used as well as to the simplifications on which the models are based [67,110,111]. In describing complex dynamics, it is necessary to incorporate some level of simplification to account for ecological functioning processes. Consequently, processes and indicators need to be approximated. Since our model was based on a low number of input parameters, its sensitivity to these factors could be high, particularly because we modelled an ungauged catchment and most of our data was obtained from national and international inventories, as no field data was available for our model requirements. The use of evapotranspiration satellite data posed a few constraints regarding the proposed approach to perform an automatic model calibration, which led us to perform it manually. Despite these limitations, SWAT predictions based on satellite data for calibration and validation gave reasonable indications about the impact change on HES provision. Both SSEBOP and CHIRPS satellite-based data proved accurate to model hydrological dynamics in the region and therefore to cope with data-scarce limitations. However, we want to highlight the importance of strengthening on-site monitoring capabilities, which would make it possible to pinpoint more accurate modelling. Furthermore, access to high-quality local data coverage would allow analysis that could account for complex problems, such as modelling the input nutrient process within the catchment and its role in the eutrophication process, which is a major global challenge associated with climate change.
In this study, we did not consider land-use change scenarios on the provision of HES for the climate change scenarios that we evaluated. Incorporating land-use change scenarios was beyond the scope of this work. However, we consider that such should be taken into account and studied in the future, as it can have serious implications. An example is the case of afforestation, a productive activity that affects water resources by interacting with its main processes: evaporation, erosion, infiltration and runoff. In this sense, our work can be used as a baseline for future works considering these aspects. One further challenge of HES assessment is the definition of indicators based on SWAT model outputs. Simulated variables are good indicators to account for biophysical processes relevant to ecosystem service quantification. Yet the metrics and modelling approach we adopted to account for ecosystem services do not integrate other relevant dimensions beyond the scope of this paper, such as social and cultural data about local beneficiaries’ values and preferences. However, the integration of such information in SWAT-based biophysical assessment could be key to informing policy making and water resource management.

5. Conclusions

This work illustrates the application of the SWAT to model HES supply in the Laguna del Sauce catchment (SE Uruguay) to assess how climate change impacts patterns. Our SWAT model proved to be accurate for modelling climate change impacts on multiple HES indicators in this study. The calibration approach based on satellite ET data from the SSEBOP model proved to be efficient in the Uruguayan case study, which offers a new technique to scale satellite-derived data. It was also the case in the use of CHIRPS data, which had an adequate performance in our case study. Overall, the modelling approach employed in this study provides a basis for further studies worldwide about water management alternatives and their potential to mitigate climate change risks.
Climate change will have mostly negative impacts on the water resources of the Laguna del Sauce catchment, especially in the more extreme scenario (RCP 8.5). In all scenarios, the catchment will experience a wetting trend with a shift in seasonality and an increase in precipitation extreme events, particularly in frequency and magnitude. Even though the amount of water will increase, changes to the hydrological cycle will jeopardize the stability of freshwater supplies and HES on which many people in the region depend. Hence, identifying HES hot spots and where they are likely to be affected is important to underpin decisions on the prioritization of key provider areas, which would inform managers to optimize limited financial resources in critical regions.

Author Contributions

Conceptualization, methodology, data curation and formal analysis, investigation, writing original draft, visualization, C.A.; conceptualization, methodology, data analysis, visualization, writing—review and editing, P.J.-S.; conceptualization, methodology, writing—review and editing, A.L.-B.; conceptualization, methodology, investigation, visualization, writing—review and editing, J.P.P.; conceptualization, methodology, investigation, data analysis, writing—review and editing, supervision, J.S.-A. All authors have read and agreed to the published version of the manuscript.

Funding

This work has received funding from the European Union’s Horizon 2020 research and innovation programme within the framework of the project SMARTLAGOON under grant agreement No. 101017861. This study was also supported by the State Research Agency of Spain through the excellence certification María de Maeztu (Ref. MDM-2017-0714). Celina Aznarez was supported by the Doctoral INPhINIT–INCOMING program, fellowship code (LCF/BQ/DI20/11780004), from “la Caixa” Foundation (ID 100010434). Javier Senent-Aparicio was supported by the training grant (21201/EE/19) awarded by the Séneca Foundation in the framework of the Jimenez de la Espada Mobility, Cooperation and Internationalization Program. Adrián López-Ballesteros was supported by the Spanish Ministerio de Educación, Cultura y Deporte with an FPU grant (FPU17/00923). Juan Pablo Pacheco was supported by the Sino-Danish Center–Aarhus University, the University of the Chinese Academy of Sciences and the University of the Republic, Uruguay.

Institutional Review Board Statement

Not applicable.

Informed Consent Statement

Not applicable.

Data Availability Statement

Publicly available datasets were analyzed in this study. This data can be found here: CMIP 5: https://www.wcrp-climate.org/wgcm-cmip/wgcm-cmip5 (accessed on 24 April 2021). SIT-MVOTMA 2000. Land Cover Classification System. Available online: http://sit.mvotma.gub.uy/shp/LCCSuy2000.zip (accessed on 24 April 2021). SIT-MVOTMA 2015. Land Cover Classification System. Available online: http://sit.mvotma.gub.uy/shp/LCCSuy2015.zip (accessed on 24 April 2021). SWAT website via ready-to-use meteorological data at http://globalweather.tamu.edu/ (accessed on 14 May 2020).

Acknowledgments

The authors acknowledge Paper Check Proofreading and Editing Services for proofreading the manuscript.

Conflicts of Interest

The authors declare no conflict of interest.

References

  1. Liu, J.; Kattel, G.; Arp, H.P.H.; Yang, H. Towards threshold-based management of freshwater ecosystems in the context of climate change. Ecol. Model. 2015, 318, 265–274. [Google Scholar] [CrossRef] [Green Version]
  2. Díazo, S.; Settele, J.; Brondízio, E.; Ngo, H.T.; Guèze, M.; Agard, J.; Arneth, A.; Balvanera, P.; Brauman, K.; Butchart, S. Summary for Policymakers of the Global Assessment Report on Biodiversity and Ecosystem Services; Intergovernmental Science-Policy Platform on Biodiversity and Ecosystem Services (IPBES): Paris, France, 2019. [Google Scholar]
  3. Ávila-García, D.; Morató, J.; Pérez-Maussán, A.I.; Santillán-Carvantes, P.; Alvarado, J.; Comín, F.A. Impacts of alternative land-use policies on water ecosystem services in the Río Grande de Comitán-Lagos de Montebello watershed, Mexico. Ecosyst. Serv. 2020, 45, 101179. [Google Scholar] [CrossRef]
  4. MEA. Millennium ecosystem assessment. In Ecosystems and Human Well-Being: Synthesis; Island Press: Washington, DC, USA, 2005; ISBN 1-56973-597-2. [Google Scholar]
  5. Ostrom, E. A general framework for analyzing sustainability of social-ecological systems. Science 2009, 325, 419–422. [Google Scholar] [CrossRef] [PubMed]
  6. Brauman, K.A.; Daily, G.C.; Duarte, T.K.E.; Mooney, H.A. The nature and value of ecosystem services: An overview highlighting hydrologic services. Ann. Rev. Environ. Res. 2007, 32, 67–98. [Google Scholar] [CrossRef]
  7. Fan, M.; Shibata, H.; Wang, Q. Optimal conservation planning of multiple hydrological ecosystem services under land use and climate changes in Teshio river watershed, northernmost of Japan. Ecol. Indic. 2016, 62, 1–13. [Google Scholar] [CrossRef]
  8. Stocker, T.F.; Qin, D.; Plattner, G.K.; Tignor, M.M.; Allen, S.K.; Boschung, J.; Nauels, A.; Xia, Y.; Bex, V.; Midgley, P.M.; et al. Climate Change 2013: The Physical Science Basis. Contribution of Working Group I to the Fifth Assessment Report of IPCC the Intergovernmental Panel on Climate Change; Cambridge University Press: Cambridge, UK, 2014. [Google Scholar] [CrossRef] [Green Version]
  9. Senent-Aparicio, J.; Pérez-Sánchez, J.; Carrillo-García, J.; Soto, J. Using SWAT and Fuzzy TOPSIS to Assess the Impact of Climate Change in the Headwaters of the Segura River Basin (SE Spain). Water 2017, 9, 149. [Google Scholar] [CrossRef] [Green Version]
  10. Hack, J. Application of payments for hydrological ecosystem services to solve problems of fit and interplay in integrated water resources management. Water Inter. 2015, 40, 929–948. [Google Scholar] [CrossRef]
  11. Francesconi, W.; Srinivasan, R.; Pérez-Miñana, E.; Willcock, S.P.; Quintero, M. Using the Soil and Water Assessment Tool (SWAT) to model ecosystem services: A systematic review. J. Hydrol. 2016, 535, 625–636. [Google Scholar] [CrossRef]
  12. Hoyer, R.; Chang, H. Assessment of freshwater ecosystem services in the Tualatin and Yamhill basins under climate change and urbanization. Appl. Geogr. 2014, 53, 402–416. [Google Scholar] [CrossRef]
  13. Bennett, E.M.; Peterson, G.D.; Gordon, L.J. Understanding relationships among multiple ecosystem services. Ecol. Lett. 2009, 12, 1394–1404. [Google Scholar] [CrossRef] [PubMed]
  14. Peterson, G.D.; Cumming, G.S.; Carpenter, S.R. Scenario planning: A tool for conservation in an uncertain world. Cons. Biol. 2003, 17, 358–366. [Google Scholar] [CrossRef] [Green Version]
  15. Thompson, J.R.; Wiek, A.; Swanson, F.J.; Carpenter, S.R.; Fresco, N.; Hollingsworth, T.; Spies, T.A.; Foster, D.R. Scenario studies as a synthetic and integrative research activity for long-term ecological research. BioScience 2012, 62, 367–376. [Google Scholar] [CrossRef] [Green Version]
  16. Lüke, A.; Hack, J. Modelling Hydrological Ecosystem Services–A state of the art model comparison. Hydrol. Earth Syst. Sci. Dis. 2017, 1–29. [Google Scholar] [CrossRef]
  17. Ochoa, V.; Urbina-Cardona, N. Tools for spatially modeling ecosystem services: Publication trends, conceptual reflections and future challenges. Ecosyst. Serv. 2017, 26, 155–169. [Google Scholar] [CrossRef]
  18. Arnold, J.G.; Srinivasan, R.; Muttiah, R.S.; Williams, J. RLarge area hydrologic modeling and assessment part I: Model development 1. JAWRA 1998, 34, 73–89. [Google Scholar] [CrossRef]
  19. Ficklin, D.L.; Luo, Y.; Luedeling, E.; Zhang, M. Climate change sensitivity assessment of a highly agricultural watershed using SWAT. J. Hydrol. 2009, 374, 16–29. [Google Scholar] [CrossRef]
  20. Romagnoli, M.; Portapila, M.; Rigalli, A.; Maydana, G.; Burgués, M.; García, C.M. Assessment of the SWAT model to simulate a watershed with limited available data in the Pampas region, Argentina. Sci. Total Environ. 2017, 596, 437–450. [Google Scholar] [CrossRef] [Green Version]
  21. Schuol, J.; Abbaspour, K.C.; Srinivasan, R.; Yang, H. Estimation of freshwater availability in the West African sub-continent using the SWAT hydrologic model. J. Hydrol. 2008, 352, 30–49. [Google Scholar] [CrossRef]
  22. Gassman, P.W.; Sadeghi, A.M.; Srinivasan, R. Applications of the SWAT model special section: Overview and insights. J. Environ. Qual. 2014, 43, 1–8. [Google Scholar] [CrossRef]
  23. Bracht-Flyr, B.; Istanbulluoglu, E.; Fritz, S. A hydro-climatological lake classification model and its evaluation using global data. J. Hydrol. 2013, 486, 376–383. [Google Scholar] [CrossRef] [Green Version]
  24. Vigerstol, K.L.; Aukema, J.E. A comparison of tools for modeling freshwater ecosystem services. J. Environ. Manag. 2011, 92, 2403–2409. [Google Scholar] [CrossRef]
  25. Dennedy-Frank, P.J.; Muenich, R.L.; Chaubey, I.; Ziv, G. Comparing two tools for ecosystem service assessments regarding water resources decisions. J. Environ. Manag. 2016, 177, 331–340. [Google Scholar] [CrossRef] [PubMed] [Green Version]
  26. Zarrineh, N.; Abbaspour, K.C.; Holzkämper, A. Integrated assessment of climate change impacts on multiple ecosystem services in Western Switzerland. Sci. Total Environ. 2020, 708, 135212. [Google Scholar] [CrossRef] [PubMed]
  27. Crisci, C.; Terra, R.; Pacheco, J.P.; Ghattas, B.; Bidegain, M.; Goyenola, G.; Mazzeo, N. Multi-model approach to predict phytoplankton biomass and composition dynamics in a eutrophic shallow lake governed by extreme meteorological events. Ecol. Model. 2017, 360, 80–93. [Google Scholar] [CrossRef]
  28. González-Madina, L.; Pacheco, J.P.; Mazzeo, N.; Levrini, P.; Clemente, J.M.; Lagomarsino, J.J.; Fosalba, C. Factores ambientales controladores del fitoplancton con énfasis en las cianobacterias potencialmente tóxicas en un lago somero utilizado como fuente de agua para potabilización: Laguna del Sauce, Maldonado, Uruguay. Innotec 2017, 13, 26–35. [Google Scholar] [CrossRef] [Green Version]
  29. Reyer, C.P.; Adams, S.; Albrecht, T.; Baarsch, F.; Boit, A.; Trujillo, N.C.; Cartsburg, M.; Coumou, D.; Eden, A.; Fernandes, E.; et al. Climate change impacts in Latin America and the Caribbean and their implications for development. Reg. Environ. Chang. 2017, 17, 1601–1621. [Google Scholar] [CrossRef]
  30. Steffen, M.; Inda, H. (Eds.) Bases Técnicas para el Manejo Integrado de Laguna del Sauce y Cuenca Asociada; Universidad de la República y South American Institute for Resilience and Sustainability Studies: Montevideo, Uruguay, 2010; ISBN 978-9974-0-06942. [Google Scholar]
  31. González-Madina, L.; Pacheco, J.P.; Yema, L.; de Tezanos, P.; Levrini, P.; Clemente, J.; Goyenola, G. Drivers of cyanobacteria dominance, composition and nitrogen fixing behavior in a shallow lake with alternative regimes in time and space, Laguna del Sauce (Maldonado, Uruguay). Hydrobiologia 2019, 829, 61–76. [Google Scholar] [CrossRef]
  32. INE. Censo Poblacional del Instituto Nacional de Estadística. Available online: http://www.ine.gub.uy/web/guest/censos-2011 (accessed on 24 May 2020).
  33. Pacheco, J.P.; González-Madina, L.; Clemente, J.M.; Mazzeo, N. Análisis Cualitativo y Cuantitativo del Fitoplancton de la Laguna del Sauce Maldonado—Uruguay; Project Report; OSE, UGD: Montevideo, Uruguay, 2016. [Google Scholar]
  34. Achkar, M.; Domínguez, A.; Pesce, F. Principales transformaciones territoriales en el Uruguay rural contemporáneo. Pampa Rev. Inter. Estud. Territ. 2006, 2, 219–242. [Google Scholar] [CrossRef] [Green Version]
  35. SIT-MVOTMA 2015. Land Cover Classification System. Available online: http://sit.mvotma.gub.uy/shp/LCCSuy2015.zip (accessed on 24 April 2021).
  36. Taveira, G.; Bianchi, P.; Díaz, I.; Inda, H. Cuáles son los principales usos del suelo actuales y tendencias en la cuenca de Laguna del Sauce? In Aportes Para la Rehabilitación de la Laguna del Sauce y el Ordenamiento Territorial de su Cuenca; Bianchi, P., Taveira, G., Inday, H., Steffen, M., Eds.; South American Resilience and Sustainability Institute (SARAS): Maldonado, Uruguay, 2018. [Google Scholar]
  37. Neitsch, S.L. Soil and Water Assessment Tool; User’s Manual Version 2005; Springer: Berlin, Germany, 2005; p. 476. [Google Scholar]
  38. Monteith, J.L. Evaporation and environment. In Symposia of the Society for Experimental Biology; Cambridge University Press (CUP): Cambridge, UK, 1965; Volume 19, pp. 205–234. [Google Scholar]
  39. Hargreaves, G.H.; Allen, R.G. History and evaluation of Hargreaves evapotranspiration equation. J. Irrig. Drain. Eng. 2003, 129, 53–63. [Google Scholar] [CrossRef]
  40. Jung, C.G.; Lee, D.R.; Moon, J.W. Comparison of the Penman-Monteith method and regional calibration of the Hargreaves equation for actual evapotranspiration using SWAT-simulated results in the Seolma-cheon basin, South Korea. Hydrol. Sci. J. 2016, 61, 793–800. [Google Scholar] [CrossRef]
  41. SIT-MVOTMA 2000. Land Cover Classification System. Available online: http://sit.mvotma.gub.uy/shp/LCCSuy2000.zip (accessed on 24 April 2021).
  42. FAO-ISRIC. Guidelines for Profile Description, 3rd ed.; Food and Agriculture Organization of the United Nations (FAO): Rome, Italy, 1990. [Google Scholar]
  43. Dhanesh, Y.; Bindhu, V.M.; Senent-Aparicio, J.; Brighenti, T.M.; Ayana, E.; Smitha, P.S.; Fei, C.; Srinivasan, R. A comparative evaluation of the performance of CHIRPS and CFSR data for different climate zones using the SWAT model. Remote Sens. 2020, 12, 3088. [Google Scholar] [CrossRef]
  44. Bayissa, Y.; Tadesse, T.; Demisse, G.; Shiferaw, A. Evaluation of satellite-based rainfall estimates and application to monitor meteorological drought for the Upper Blue Nile Basin, Ethiopia. Remote Sens. 2017, 9, 669. [Google Scholar] [CrossRef] [Green Version]
  45. Duan, Z.; Tuo, Y.; Liu, J.; Gao, H.; Song, X.; Zhang, Z.; Mekonnen, D.F. Hydrological evaluation of open-access precipitation and air temperature datasets using SWAT in a poorly gauged basin in Ethiopia. J. Hydrol. 2019, 569, 612–626. [Google Scholar] [CrossRef] [Green Version]
  46. Dile, Y.T.; Karlberg, L.; Daggupati, P.; Srinivasan, R.; Wiberg, D.; Rockström, J. Assessing the implications of water harvesting intensification on upstream-downstream ecosystem services: A case study in the Lake Tana basin. Sci. Total Environ. 2016, 542, 22–35. [Google Scholar] [CrossRef]
  47. Molina-Navarro, E.; Nielsen, A.; Trolle, D. A QGIS plugin to tailor SWAT watershed delineations to lake and reservoir waterbodies. Environ. Model Softw. 2018, 108, 67–71. [Google Scholar] [CrossRef]
  48. Yin, L.; Wang, X.; Feng, X.; Fu, B.; Chen, Y. A Comparison of SSEBop Model-Based Evapotranspiration with Eight Evapotranspiration Products in the Yellow River Basin, China. Remote Sens. 2020, 12, 2528. [Google Scholar] [CrossRef]
  49. Dile, Y.T.; Ayana, E.K.; Worqlul, A.W.; Xie, H.; Srinivasan, R.; Lefore, N.; You, L.; Clarke, N. Evaluating satellite-based evapotranspiration estimates for hydrological applications in data-scarce regions: A case in Ethiopia. Sci. Total Environ. 2020, 140702. [Google Scholar] [CrossRef]
  50. Senay, G.B.; Bohms, S.; Singh, R.K.; Gowda, P.H.; Velpuri, N.M.; Alemu, H.; Verdin, J.P. Operational evapotranspiration mapping using remote sensing and weather datasets: A new parameterization for the SSEB approach. JAWRA 2013, 49, 577–591. [Google Scholar] [CrossRef] [Green Version]
  51. Senay, G.B. Satellite psychometric formulation of the Operational Simplified Surface Energy Balance (SSEBop) model for quantifying and mapping evapotranspiration. App. Eng. Agric. 2018, 34, 555–566. [Google Scholar] [CrossRef] [Green Version]
  52. da Silva, R.M.; Dantas, J.C.; Beltrão, J.D.A.; Santos, C.A. Hydrological simulation in a tropical humid basin in the Cerrado biome using the SWAT model. Hydrol. Res. 2018, 49, 908–923. [Google Scholar] [CrossRef]
  53. Awan, U.K.; Ismaeel, A. A new technique to map groundwater recharge in irrigated areas using a SWAT model under changing climate. J. Hydrol. 2014, 519, 1368–1382. [Google Scholar] [CrossRef]
  54. López-Ballesteros, A.; Senent-Aparicio, J.; Martínez, C.; Pérez-Sánchez, J. Assessment of future hydrologic alteration due to climate change in the Aracthos River basin (NW Greece). Sci. Total Environ. 2020, 139299. [Google Scholar] [CrossRef] [PubMed]
  55. Tamm, O.; Maasikamäe, S.; Padari, A.; Tamm, T. Modelling the effects of land use and climate change on the water resources in the eastern Baltic Sea region using the SWAT model. Catena 2018, 167, 78–89. [Google Scholar] [CrossRef]
  56. McGuire, A.D.; Sitch, S.; Clein, J.S.; Dargaville, R.; Esser, G.; Foley, J.; Heimann, M.; Joos, F.; Kaplan, J.; Kicklighter, D.W.; et al. Carbon balance of the terrestrial biosphere in the twentieth century: Analyses of CO2, climate and land use effects with four process-based ecosystem models. Glob. Biogeochem. Cycles 2001, 15, 183–206. [Google Scholar] [CrossRef] [Green Version]
  57. Willems, P.; Vrac, M. Statistical precipitation downscaling for small-scale hydrological impact investigations of climate change. J. Hydrol. 2011, 402, 193–205. [Google Scholar] [CrossRef]
  58. Nagy, G.; Bidegain, M.; Verocai, J.; de los Santos, B. Escenarios climáticos futuros sobre Uruguay. In Basado en los Nuevos Escenarios Socioeconómicos RCP. Project Report PNUD URU/11/G31, Climate Change Division; MVOTMA: Montevideo, Uruguay, 2016. [Google Scholar]
  59. Van Vuuren, D.P.; Edmonds, J.; Kainuma, M.; Riahi, K.; Thomson, A.; Hibbard, K.; Hurtt, G.C.; Kram, T.; Krey, V.; Lamarque, J.F.; et al. The representative concentration pathways: An overview. Clim. Chang. 2011, 109, 5. [Google Scholar] [CrossRef]
  60. Nilawar, A.P.; Waikar, M.L. Impacts of climate change on streamflow and sediment concentration under RCP 4.5 and 8.5: A case study in Purna river basin, India. Sci. Total Environ. 2019, 650, 2685–2696. [Google Scholar] [CrossRef]
  61. Blanco-Gómez, P.; Jimeno-Sáez, P.; Senent-Aparicio, J.; Pérez-Sánchez, J. Impact of climate change on water balance components and droughts in the Guajoyo River basin (El Salvador). Water 2019, 11, 2360. [Google Scholar] [CrossRef] [Green Version]
  62. R Core Team. R: A Language and Environment for Statistical Computing; R Foundation for Statistical Computing: Vienna, Austria, 2019; Available online: https://www.R-project.org/ (accessed on 10 May 2020).
  63. Gudmundsson, L.; Bremnes, J.B.; Haugen, J.E.; Engen-Skaugen, T. Downscaling RCM precipitation to the station scale using statistical transformations–a comparison of methods. HEES 2012, 16, 3383–3390. [Google Scholar] [CrossRef] [Green Version]
  64. Schmalz, B.; Kruse, M.; Kiesel, J.; Müller, F.; Fohrer, N. Water-related ecosystem services in Western Siberian lowland basins—analysing and mapping spatial and seasonal effects on regulating services based on ecohydrological modelling results. Ecol. Indic. 2016, 71, 55–65. [Google Scholar] [CrossRef]
  65. Fernández-Yuste, J.; Martínez Santa-María, C.; Magdaleno, F. Application of indicators of hydrologic alterations in the designation of heavily modified water bodies in Spain. Environ. Sci. Policy 2012, 16, 31–43. [Google Scholar] [CrossRef]
  66. Neitsch, S.L.; Arnold, J.G.; Kiniry, J.R.; Williams, J.R. Soil and Water Assessment Tool Theoretical Documentation Version 2009; Texas Water Resources Institute: College Station, TX, USA, 2011. [Google Scholar]
  67. Gaglio, M.; Aschonitis, V.; Pieretti, L.; Santos, L.; Gissi, E.; Castaldelli, G.; Fano, E.A. Modelling past, present and future Ecosystem Services supply in a protected floodplain under land use and climate changes. Ecol. Model 2019, 403, 23–34. [Google Scholar] [CrossRef]
  68. De Groot, R.S.; Wilson, M.A.; Boumans, R.M. A typology for the classification, description and valuation of ecosystem functions, goods and services. Ecol. Econ. 2002, 41, 393–408. [Google Scholar] [CrossRef] [Green Version]
  69. Falkenmark, M.; Biswas, A.K. Further momentum to water issues: Comprehensive water problem assessment in the being. Ambio 1995, 24, 380–382. Available online: http://www.jstor.org/stable/4314372 (accessed on 25 February 2020).
  70. Kauffman, S.; Droogers, P.; Hunink, J.; Mwaniki, B.; Muchena, F.; Gicheru, P.; Gicheru, P.; Bindraban, P.; Onduru, D.; Cleveringa, R.; et al. Green Water Credits–exploring its potential to enhance ecosystem services by reducing soil erosion in the Upper Tana basin, Kenya. Int. J. Biod. Sci. Ecos. Serv. Manag. 2014, 10, 133–143. [Google Scholar] [CrossRef]
  71. Kandziora, M.; Burkhard, B.; Müller, F. Interactions of ecosystem properties, ecosystem integrity and ecosystem service indicators—A theoretical matrix exercise. Ecol. Indic. 2013, 28, 54–78. [Google Scholar] [CrossRef]
  72. Schmalz, B.; Kandziora, M.; Chetverikova, N.; Müller, F.; Fohrer, N. Water-Related Ecosystem Services–The Case Study of Regulating Ecosystem Services in the Kielstau Basin, Germany. In Ecosystem Services and River Basin Ecohydrology; Springer: Dordrecht, The Netherlands, 2015; pp. 215–232. [Google Scholar]
  73. Abbaspour, K.C.; Rouholahnejad, E.; Vaghefi, S.R.; Srinivasan, R.; Yang, H.; Kløve, B. A continental-scale hydrology and water quality model for Europe: Calibration and uncertainty of a high-resolution large-scale SWAT model. J. Hydrol. 2015, 524, 733–752. [Google Scholar] [CrossRef] [Green Version]
  74. Zhang, W.; Zha, X.; Li, J.; Liang, W.; Ma, Y.; Fan, D.; Li, S. Spatiotemporal change of blue water and green water resources in the headwater of Yellow River Basin, China. Water Res. Manag. 2014, 28, 4715–4732. [Google Scholar] [CrossRef]
  75. Xu, J. Effects of climate and land-use change on green-water variations in the Middle Yellow River, China. Hydrol. Sci. J. 2013, 58, 106–117. [Google Scholar] [CrossRef] [Green Version]
  76. Martínez, C.; Fernández, J.A. IAHRIS 2.2 Indicators of Hydrologic Alteration in Rivers: Methodological Reference Manual. 2010. Available online: http://ambiental.cedex.es/docs/IHARIS_v2.2.zip (accessed on 10 July 2020).
  77. Pérez-Sánchez, J.; Senent-Aparicio, J.; Martínez Santa-María, C.; López-Ballesteros, A. Assessment of Ecological and Hydro-Geomorphological Alterations under Climate Change Using SWAT and IAHRIS in the Eo River in Northern Spain. Water 2020, 12, 1745. [Google Scholar] [CrossRef]
  78. Kunnath-Poovakka, A.; Ryu, D.; Renzullo, L.J.; George, B. The efficacy of calibrating hydrologic model using remotely sensed evapotranspiration and soil moisture for streamflow prediction. J. Hydrol. 2016, 535, 509–524. [Google Scholar] [CrossRef]
  79. Parajuli, P.B.; Jayakody, P.; Ouyang, Y. Evaluation of Using Remote Sensing Evapotranspiration Data in SWAT. Water Resour. Manag. 2018, 32, 985–996. [Google Scholar] [CrossRef]
  80. Dembelé, M.; Ceperley, N.; Zwart, S.J.; Salvadore, E.; Mariethoz, G.; Schaefli, B. Potential of satellite and reanalysis evaporation datasets for hydrological modelling under various model calibration strategies. Adv. Water Resour. 2020, 143, 103667. [Google Scholar] [CrossRef]
  81. Havrylenko, S.B.; Bodoque, J.M.; Srinivasan, R.; Zucarelli, G.V.; Mercuri, P. Assessment of the soil water content in the Pampas region using SWAT. Catena 2016, 137, 298–309. [Google Scholar] [CrossRef]
  82. Djaman, K.; Tabari, H.; Baide, A.B.; Diop, L.; Futakuchi, K.; Irmak, S. Analysis, calibration, and validation of evapotranspiration model to predict grass reference evapotranspiration in Senegal River Delta. J. Hydrol. Reg. Stud. 2016, 8, 82–94. [Google Scholar] [CrossRef] [Green Version]
  83. López-López, P.; Sutanudjaja, E.H.; Schellekens, J.; Sterk, G.; Bierkens, M.F. Calibration of a large-scale hydrological model using satellite-based soil moisture and evapotranspiration products. HESS 2017, 21, 3125–3144. [Google Scholar] [CrossRef] [Green Version]
  84. Ha, L.T.; Bastiaanssen, W.G.; Van Griensven, A.; Van Dijk, A.I.; Senay, G.B. Calibration of spatially distributed hydrological processes and model parameters in SWAT using remote sensing data and an auto-calibration procedure: A case study in a Vietnamese river basin. Water 2018, 10, 212. [Google Scholar] [CrossRef] [Green Version]
  85. Odusanya, A.E.; Mehdi, B.; Schürz, C.; Oke, A.O.; Awokola, O.S.; Awomeso, J.A.; Schulz, K. Multi-site calibration and validation of SWAT with satellite-based evapotranspiration in a data-sparse catchment in southwestern Nigeria. HESS 2019, 23, 1113–1144. [Google Scholar] [CrossRef] [Green Version]
  86. Ministry of Environment of Uruguay. Uruguay’s National Water Plan. Available online: https://www.gub.uy/ministerio-ambiente/politicas-y-gestion/planes/plan-nacional-aguas (accessed on 24 April 2021).
  87. Skansi, M.; Brunet, M.; Sigró, J.; Aguilar, E.; Groening, J.A.A.; Bentancur, O.J.; Rojas, C.O. Warming and wetting signals emerging from analysis of changes in climate extreme indices over South America. Glob. Planet. Chang. 2013, 100, 295–307. [Google Scholar] [CrossRef]
  88. Seo, S.N.; McCarl, B.A.; Mendelsohn, R. From beef cattle to sheep under global warming? An analysis of adaptation by livestock species choice in South America. Ecol. Econ. 2010, 69, 2486–2494. [Google Scholar] [CrossRef]
  89. Etchebarne, V.; Brazeiro, A. Effects of livestock exclusion in forests of Uruguay: Soil condition and tree regeneration. For. Ecol. Manag. 2016, 362, 120–129. [Google Scholar] [CrossRef]
  90. Field, C.B. (Ed.) Climate Change 2014–Impacts, Adaptation and Vulnerability: Regional Aspects; Cambridge University Press: Cambridge, UK, 2014. [Google Scholar]
  91. Doak, D.F.; Morris, W.F. Demographic compensation and tipping points in climate-induced range shifts. Nature 2010, 467, 959–962. [Google Scholar] [CrossRef] [PubMed]
  92. Jeppesen, E.; Kronvang, B.; Meerhoff, M.; Søndergaard, M.; Hansen, K.M.; Andersen, H.E.; Lauridsen, T.L.; Liboriussen, L.; Beklioglu, M.; Özen, A.; et al. Climate change effects on runoff, catchment phosphorus loading and lake ecological state, and potential adaptations. J. Environ. Qual. 2009, 38, 1930–1941. [Google Scholar] [CrossRef] [PubMed]
  93. Gobler, C.J. Climate change and harmful algal blooms: Insights and perspective. Harmful Algae 2020, 91, 101731. [Google Scholar] [CrossRef]
  94. Sinha, E.; Michalak, A.M.; Balaji, V. Eutrophication will increase during the 21st century as a result of precipitation changes. Science 2017, 357, 405–408. [Google Scholar] [CrossRef] [PubMed] [Green Version]
  95. O’Neil, J.M.; Davis, T.W.; Burford, M.A.; Gobler, C.J. The rise of harmful cyanobacteria blooms: The potential roles of eutrophication and climate change. Harmful Algae 2012, 14, 313–334. [Google Scholar] [CrossRef]
  96. Haakonsson, S.; Rodríguez-Gallego, L.; Somma, A.; Bonilla, S. Temperature and precipitation shape the distribution of harmful cyanobacteria in subtropical lotic and lentic ecosystems. Sci. Total Environ. 2017, 609, 1132–1139. [Google Scholar] [CrossRef]
  97. Heo, K.Y.; Ha, K.J.; Yun, K.S.; Lee, S.S.; Kim, H.J.; Wang, B. Methods for uncertainty assessment of climate models and model predictions over East Asia. Int. J. Clim. 2014, 34, 377–390. [Google Scholar] [CrossRef]
  98. Hamel, P.; Chaplin-Kramer, R.; Sim, S.; Mueller, C. A new approach to modeling the sediment retention service (InVEST 3.0): Case study of the Cape Fear catchment, North Carolina, USA. Sci. Total Environ. 2015, 524, 166–177. [Google Scholar] [CrossRef] [PubMed]
  99. Carrasco-Letelier, L.; Beretta-Blanco, A. Soil erosion by water estimated for 99 Uruguayan basins. Int. J. Agric. Nat. Res. 2017, 44, 184–194. [Google Scholar] [CrossRef] [Green Version]
  100. Walling, D.E. The Impact of Global Change on Erosion and Sediment Transport by Rivers: Current Progress and Future Challenges; The United Nations Educational Scientific and Cultural Organization: Paris, France, 2009; Volume 81, p. 30. ISBN 978-92-3-104135-8. [Google Scholar]
  101. Bengtsson, J.; Bullock, J.M.; Egoh, B.; Everson, C.; Everson, T.; O’Connor, T.; O’Farrell, P.J.; Smith, H.G.; Lindborg, R. Grasslands—More important for ecosystem services than you might think. Ecosphere 2019, 10, e02582. [Google Scholar] [CrossRef]
  102. Souchère, V.; King, C.; Dubreuil, N.; Lecomte-Morel, V.; Le Bissonnais, Y.; Chalat, M. Grassland and crop trends: Role of the European Union Common Agricultural Policy and consequences for runoff and soil erosion. Environ. Sci. Policy 2003, 6, 7–16. [Google Scholar] [CrossRef]
  103. Pilgrim, E.S.; Macleod, C.J.; Blackwell, M.S.; Bol, R.; Hogan, D.V.; Chadwick, D.R.; Cardenas, L.; Misselbrook, T.H.; Haygarth, P.M.; Brazier, R.E.; et al. Interactions among agricultural production and other ecosystem services delivered from European temperate grassland systems. In Advances in Agronomy; Academic Press: Cambridge, MA, USA, 2010; Volume 109, pp. 117–154. [Google Scholar] [CrossRef]
  104. Marengo, J.A.; Ambrizzi, T.; Da Rocha, R.P.; Alves, L.M.; Cuadra, S.V.; Valverde, M.C.; Ferraz, S.E. Future change of climate in South America in the late twenty-first century: Intercomparison of scenarios from three regional climate models. Clim. Dyn. 2010, 35, 1073–1097. [Google Scholar] [CrossRef]
  105. Penalba, O.C.; Rivera, J.A. Future changes in drought characteristics over Southern South America projected by a CMIP5 multi-model ensemble. Amer. J. Clim. Chang. 2013, 2, 173–182. [Google Scholar] [CrossRef] [Green Version]
  106. Barros, V.R.; Boninsegna, J.A.; Camilloni, I.A.; Chidiak, M.; Magrín, G.O.; Rusticucci, M. Climate change in Argentina: Trends, projections, impacts and adaptation. Wiley Interdiscip. Rev. Clim. Chang. 2015, 6, 151–169. [Google Scholar] [CrossRef]
  107. Poff, N.L.; Allan, J.D.; Bain, M.B.; Karr, J.R.; Prestegaard, K.L.; Richter, B.D.; Sparks, R.E.; Stromberg, J.C. The natural flow regime. BioScience 1997, 47, 769–784. [Google Scholar] [CrossRef]
  108. Richter, B.D.; Richter, H.E. Prescribing flood regimes to sustain riparian ecosystems along meandering rivers. Conserv. Biol. 2000, 14, 1467–1478. [Google Scholar] [CrossRef]
  109. Hefting, M.M.; Clement, J.C.; Bienkowski, P.; Dowrick, D.; Guenat, C.; Butturini, A.; Verhoeven, J.T. The role of vegetation and litter in the nitrogen dynamics of riparian buffer zones in Europe. Ecol. Eng. 2005, 24, 465–482. [Google Scholar] [CrossRef]
  110. Bagstad, K.J.; Semmens, D.J.; Winthrop, R. Comparing approaches to spatially explicit ecosystem service modeling: A case study from the San Pedro River, Arizona. Ecosyst. Serv. 2013, 5, 40–50. [Google Scholar] [CrossRef]
  111. Hou, Y.; Burkhard, B.; Müller, F. Uncertainties in landscape analysis and ecosystem service assessment. J. Environ. Manag. 2013, 127, S117–S131. [Google Scholar] [CrossRef] [PubMed]
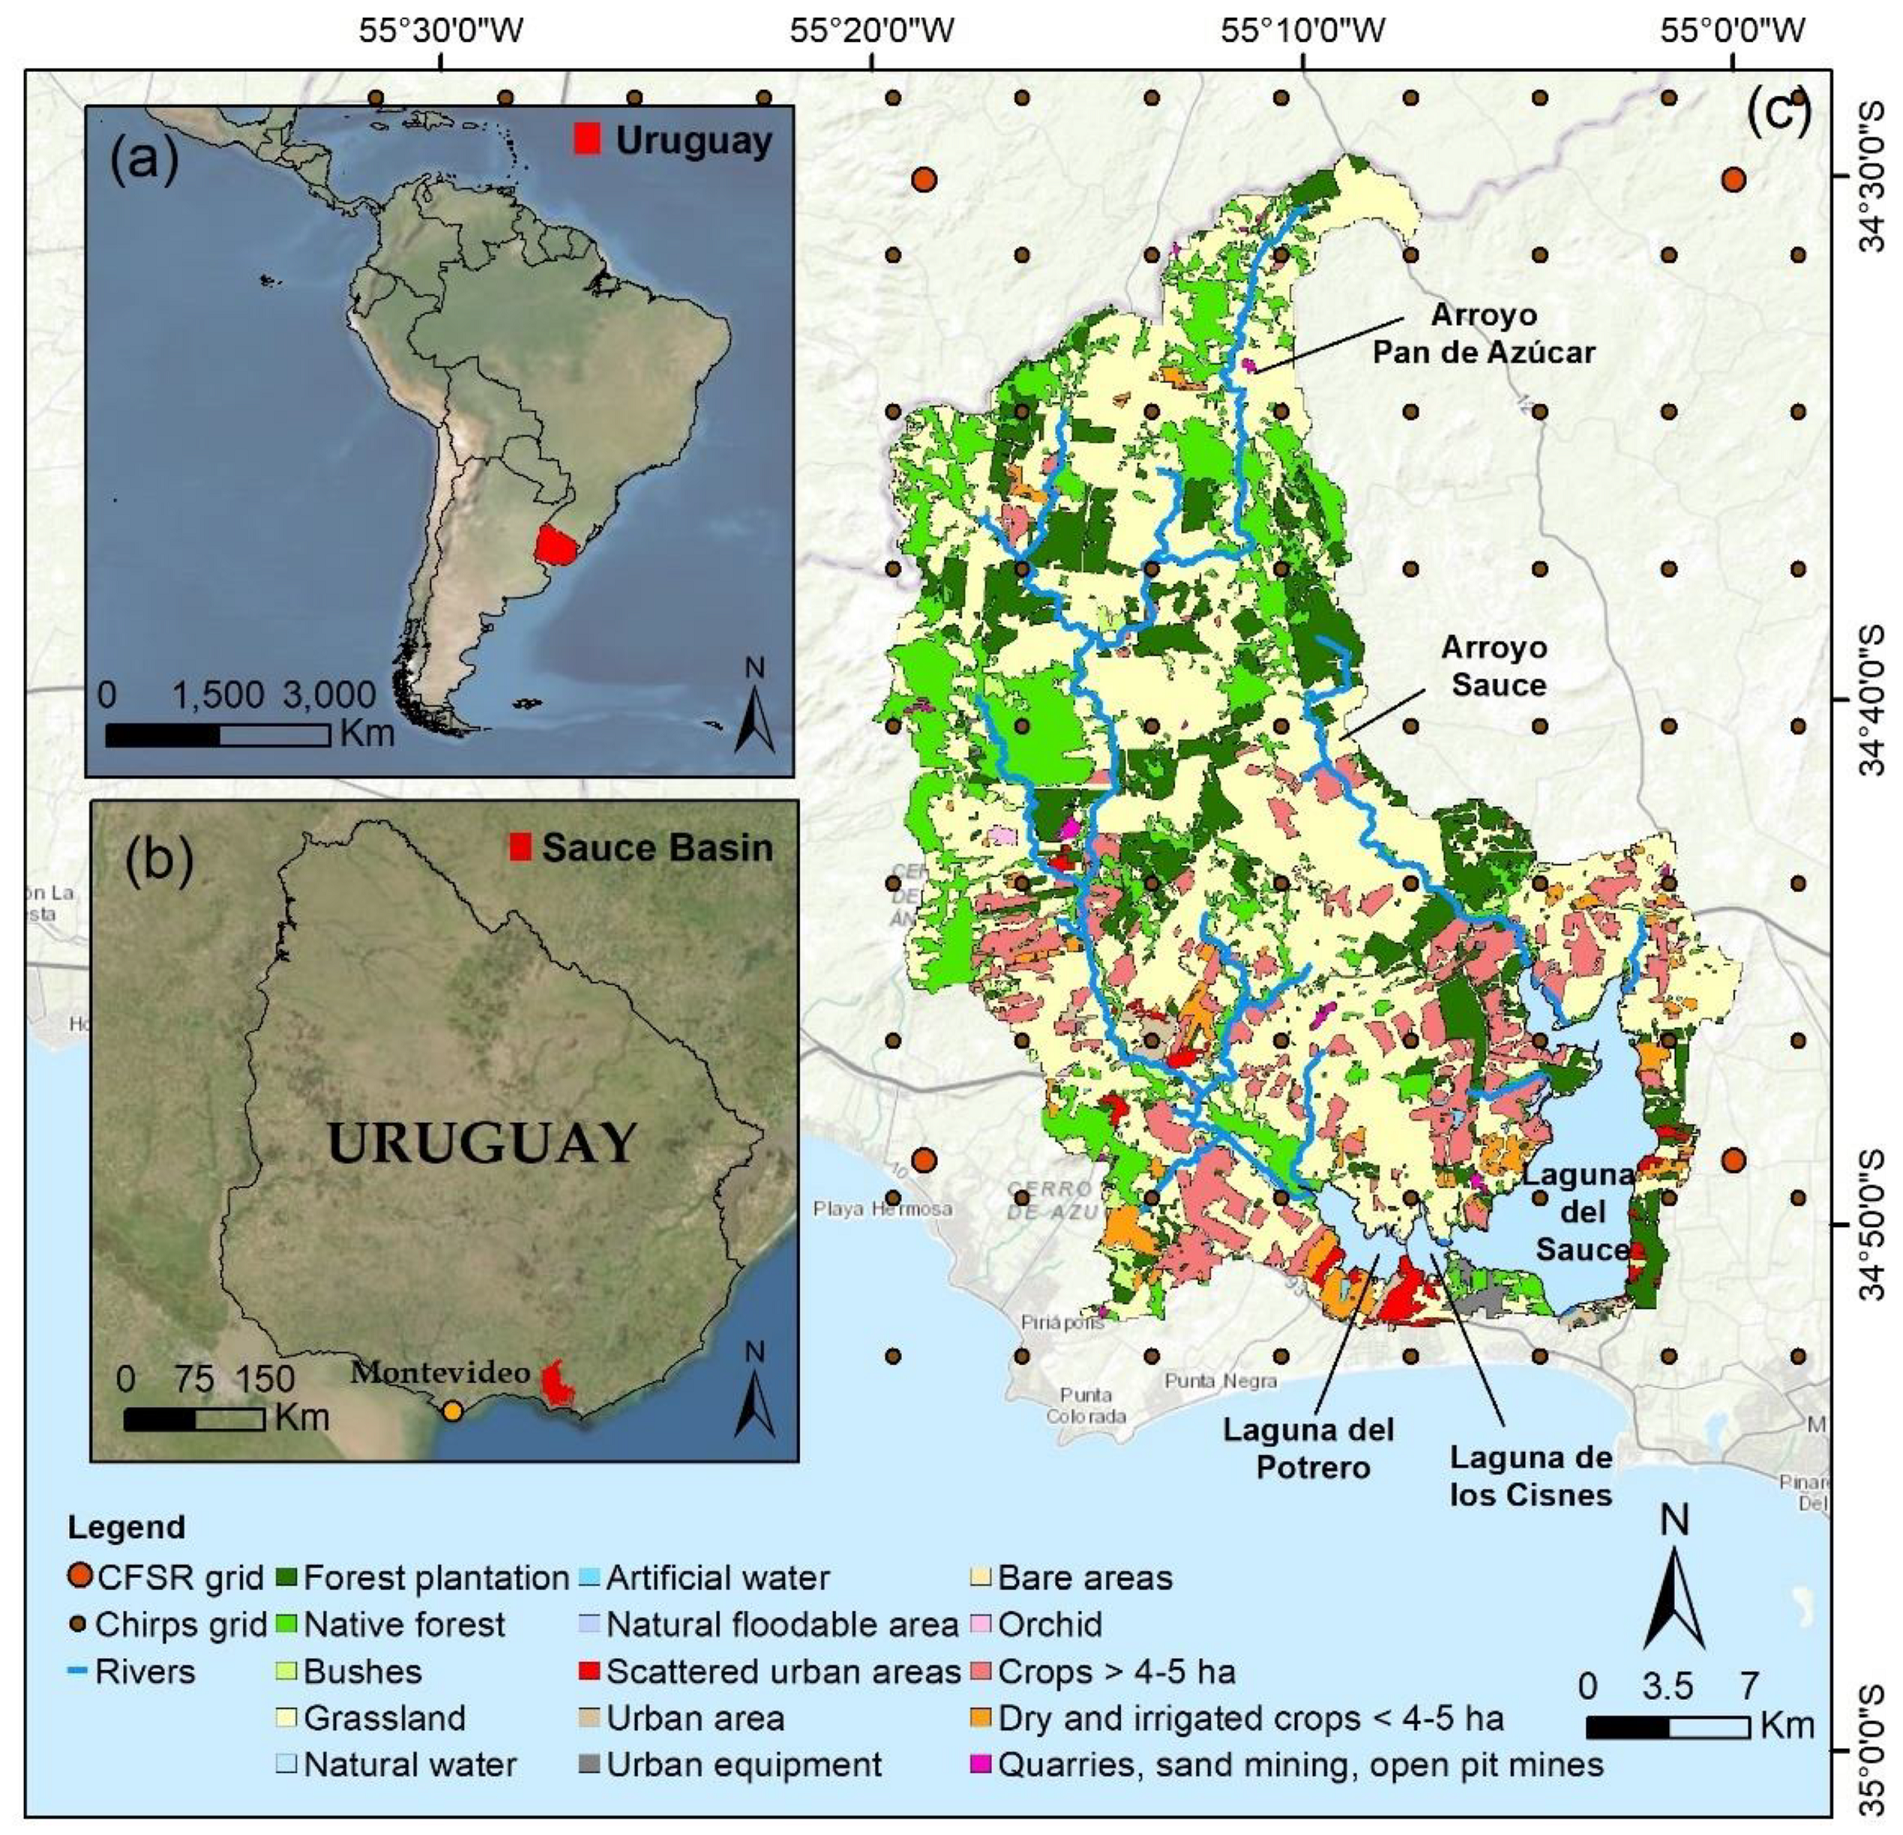
Figure 1. Location of the Laguna del Sauce basin in (a) South America, (b) Uruguay and (c) land uses in the catchment. Subsystems: Laguna del Sauce, Laguna de los Cisnes and Laguna del Potrero. Tributaries: Pan de Azúcar and Sauce river. Land uses for 2015 [35].
Remotesensing 13 02014 g001
Figure 2. SWAT model calibration and validation for the period 2005–2013. Evapotranspiration data from SSEBOP compared to the obtained data from our simulated model.
Remotesensing 13 02014 g002
Figure 3. SWAT model performance for the period 2003–2013 on a sub-basin scale.
Remotesensing 13 02014 g003
Figure 4. Local climate change impact analysis variation in precipitation (left) and temperature (right) for CanESM2 (upper panels) and HadGem2-ES model, (lower panels) from baseline (1981–2005). Summer refers to January, February and March, Autumn refers to April, May and June, Winter refers to July, August and September and Spring refers to October, November and December.
Remotesensing 13 02014 g004
Figure 5. Seasonal groundwater recharge variations for RCP 2.6, RCP 4.5 and RCP 8.5 scenarios.
Remotesensing 13 02014 g005
Figure 6. Spatial distribution of sediment yield in [t/ha] per-year metrics at the sub-basin level for each RCP pathway and time scenario.
Remotesensing 13 02014 g006
Figure 7. Heat map of the impact of climate change on flood seasonality. Y-axis represents the RCP pathway (Historical, 2.6, 4.5, 8.5) for the different time scenarios (NF, MF, FF) for each month. Colour gradient represents the average number of days in the month when flow is equalled or surpassed the flow associated with the 5% exceedance percentile, based on model: (a) CanESM2 and (b) HadGEM2-ES.
Remotesensing 13 02014 g007
Table 1. SWAT behavioral parameters used for calibration.
ParametersParameter DefinitionDefault ValueCalibration Value
CN2Curve number83.38 *−10%
EPCOSoil evaporation
compensation factor
0.950.8
ESCOPlan uptake
compensation factor
0.800.95
* area averaged.
Table 2. Indicators based on SWAT output parameters (Adapted from [71,72]).
HESDescriptionSWAT IndicatorOutputs
Water
supply
Freshwater availability for consumptive use and in situ water supplyWater yield [mm] at the sub-subbbasin levelWYLD
Water flow regulationMaintaining water cycle features through green and blue waterGreen Water (flow and storage): Evapotranspiration [mm]; Soil water content [mm]
Blue Water: Water yield [mm]; Deep aquifer recharge [mm]
WYLD
DA RCHG
ET
SW
Soil
erosion control
Sediment retention
service provision
Sediment yield [t/ha] at thesub-basin levelSYLD
Natural
Hazard
protection
Flood, storms and
climatic extreme events mitigation
Daily streamflow [m3/s] + IAHRISFLOW OUT
Table 3. Parameters used in this study for flood analysis.
AspectParameterAcronymUnit
Magnitude and frequencyAverage of yearly maximum daily flowMMDFm3/s
Effective dischargeEDm3/s
Connectivity flowCFm3/s
Flushing flood (5% exceedance percentile)FlFm3/s
VariabilityCoefficient of variation of yearly maximum daily flowCV_MMDF-
Coefficient of variation of flushing flood seriesCV_FF-
DurationConsecutive days in a year with a percentile above 5%CD_Q5days
SeasonalityThe average number of days per month with a percentile above 5%AD_Q5days
Table 4. Local climate change impacts analysis ensemble of CanESM2 and HadGem2-ES models for RCP 2.6, 4.5 and 8.5.
PathwayScenarioPeriodP
(mm)
ΔP
(%)
T
(°C)
ΔT (°C)PET
(mm)
ΔPET
(%)
Baseline-1981–20051023.25-17.0-1283.7-
RCP 2.6NF2026–20501053.202.917.020.021326.33.3
MF2051–20751008.50−1.417.060.061332.53.8
FF2076–21001025.450.217.080.081328.23.5
RCP 4.5NF2026–20501056.303.2318.11.01306.91.81
MF2051–20751069.154.4918.61.61325.83.28
FF2076–21001044.202.0519.12.11349.25.10
RCP 8.5NF2026–20501034.701.1218.31.31325.33.24
MF2051–20751093.706.8819.42.31354.15.48
FF2076–21001143.9011.7921.03.91415.510.26
Table 5. Water regulation indicators: Water Yield (variation and mean values ex-pressed in percentage), Blue Water (BW), Green Water Flow (GWF), Green Water Storage (GWS) and Green Water Coefficient (GWC) in comparison to the three different projected periods for all RCPs and both models used.
PathwayScenarioPeriodWater
Yield (mm)
Δ Water
Yield (%)
BW
(mm)
GWF
(mm)
GWS
(mm)
GWC
Baseline-1981–2005275.75-283.5753.2986.490.72
RCP 2.6NF2026–2050306.5311.2%315.13750.788.780.70
MF2051–2075261.93−5.0%269.1754.899.9850.73
FF2076–2100270.50−1.9%277.89762.189.0850.73
RCP 4.5NF2026–2050301.359.28%309.62759.6894.370.70
MF2051–2075316.1214.64%324.91758.0587.910.69
FF2076–2100297.147.76%305.33753.0887.950.71
RCP 8.5NF2026–2050292.546.09%300.57749.2285.010.72
MF2051–2075330.7819.96%339.79765.3795.420.68
FF2076–2100342.9830.92%352.55785.7585.970.69
Table 6. Indicators of Hydrologic Alteration in Rivers (IAHRIS) results for floods in RCP 2.6, 4.5 and RCP 8.5 scenarios. Aspect: MF = Magnitude and frequency; V = Variability; D = Duration; Hist = historical data.
ModelAspectParameterHistRCP 2.6RCP 4.5RCP 8.5
NFMFFFNFMFFFNFMFFF
CanESM2MFMMDF92.1298.5692.2993.21101.92100.2085.0697.8491.61127.22
ED93.20100.2288.9991.21105.58101.8385.8105.3580.54118.5
CF124.40134.16116.23119.95142.29136.27114.43144.62100.83152.28
FF8.8010.188.3610.477.388.506.696.7210.0810.46
VCV_MMDF0.520.530.440.460.560.530.510.630.300.39
CV_FF0.620.620.420.740.800.770.620.860.640.58
DCD_Q58.2912.455.457.628.3310.652.924.548.9611.5
HadGem2-ESMFMMDF98.45108.71105.9595.4393.6496.26106.67115.87107.92119.11
ED98.50105.4398.8591.3285.0288.9094.76105.81106.1117.64
CF131.00138.07127.13118.85107.97113.78119.17134.72139.85155.39
FF11.8913.7712.3411.4012.6113.912.1712.8611.4413.51
VCV_MMDF0.500.450.390.430.350.370.310.360.470.48
CV_FF0.590.860.570.510.550.520.500.540.510.59
DCD_Q53.798.165.294.958.176.294.048.546.5810.29
Publisher’s Note: MDPI stays neutral with regard to jurisdictional claims in published maps and institutional affiliations.