Abstract
Fengyun-3C (FY-3C) is a Global Navigation Satellite Systems (GNSS) Radio Occultation (RO) mission founded which was by China on 23 September 2013. In this study, under a specific temporal and spatial domain, we systematically compare FY-3C refractivity profiles with Constellation Observing System for Meteorology Ionosphere and Climate (COSMIC) refractivity profiles for the year 2015. The COSMIC profiles used in this study contain reflections, as identified in the Radio Occultation Meteorology Satellite Application Facility (ROM SAF) flag database. From 0 to 25 km altitude, the mean biases and relative standard deviations of the comparisons between FY-3C and COSMIC are less than 1% and 2% when COSMIC profiles present reflected signals. Radio holographic analysis is used to visualize and identify the spectra of FY-3C-reflected signals in the time-frequency domain. It is confirmed that the reflected signals in the lower troposphere and near the surface can be tracked by an FY-3C receiver. Further, most of the FY-3C events that matched with COSMIC reflected events show reflection patterns at a lower height, especially above the ocean’s surface. Under Bouguer’s rule and spherical symmetry assumptions, we reconstructed the reflected bending angle models by Abel transformation, which are valuable for reducing N-bias in the ducting layer. Three examples of FY-3C events show that the reflected bending branch is near the surface. Overall, the reflected signal of FY-3C could be used as a supplementary data portion for FY-3C atmospheric products.
1. Introduction
Global Navigation Satellite Systems Radio Occultation (GNSS-RO) is a satellite remote sensing technique that uses GNSS measurements for sounding Earth’s atmosphere [1,2,3,4]. GPS, GLONASS, Galileo and BeiDou are fully used for precise positioning services [5,6], and are widely used in GNSS-RO missions. As GNSS signal passes through the atmosphere, the signals received by the receiver on the Low Earth Orbit (LEO) are bent and delayed, which accurately produces the high-quality atmospheric profiles containing humidity, pressure and temperature information [7,8,9,10].
In recent years, a number of studies have focused on the GNSS RO reflected signals. Usually, signals of GNSS RO events may propagate to Earth’s surface and then be received by LEO satellites as reflected signals. Around half of RO events, frequently over the ocean, snow and ice surfaces, could present the reflection signatures [11]. The reflected signals enable the capture of variations in the troposphere profiles. At the bottom of the troposphere, the Signal to Noise Ratios (SNR) of the occultation signal drops to a noise level, and the occultation reflected signals may provide valuable meteorological information of the lower atmosphere [12,13]. Furthermore, the bending angles of profiles that present reflected signals have better departure statistics in the troposphere compared to European Centre for Medium-Range Weather Forecasts (ECMWF) analyses. The reflections with good instrumental and atmospheric conditions were proven good enough to produce high quality data without disturbing the structure of atmospheric retrievals [14]. The reflected signal component during occultation events can be used to reduce refractivity bias under the ducting layer [15]. Moreover, recent studies have found that reflections in the grazing angle of observations can provide a few cm of precision at sea surface [16] and sea-ice [17] altimetry, with the latter using GNSS RO payloads.
Currently, the usual implemental approach for reflection signals identification is radio holographic analysis. This method has been successfully applied to separate the direct and reflected signals according to the spectrum of the GNSS RO events, such as reflection in GPS/Meteorology (GPS/MET) and Challenging Minisatellite Payload (CHAMP) RO data, allowing the estimation for bending profiles with a strong error and removing the contribution of reflection in temperature retrievals in the lower troposphere [18,19,20]. Taking advantage of the extensive number of RO data, Cardellach et al. adapted a supervised learning algorithm, named super vector machines (SVM) [21], to train thousands of radio holographic images and automatically classify millions of occultations (ROM SAF reflection flag database) [22]. Alternatively, the techniques developed for retrieving RO in multipath areas, such as canonical transform (CT) methods [23,24] and phase matching (PM) [25], can also retrieve the reflected signals of the bending angle profiles. A modified CT technique was reported to retrieve the reflected bending angles, and even achieved good agreement with the ROM SAF database [26]. The PM method can highly enhance the signatures of surface reflections by means of processing only an appropriately selected segment of the received signal [27].
Although lots of studies have introduced and investigated the reflection signals on Earth’s surface by means of GNSS RO missions, little research reports the reflections of the Chinese Fengyun 3C (FY-3C) measurements. The FY-3C RO satellite was launched by the Chinese Meteorology Agency (CMA) in 2013, which is the third unit of the FY-3 series, and its main mission is operational meteorology [28,29,30]. The occultation receiver of FY-3C is Global Navigation satellite system Occultation Sounder (GNOS), which is designed to receive both GPS and BeiDou (BDS) signals [31]. This design employs the open-loop mode, which guarantees an accurate tracking of signals at the lower impact height, where multipath and reflection often occur [32]. In the past decade, FY-3C products have been evaluated via comparisons with other ROs’ profiles. For example, FY-3C refractivity products from the near surface to the altitude of 30 km are as good as COSMIC refractivity products [33,34]. Over a long-term perspective, the latitudinal and seasonal variations of refractivity, temperature and specific humidity data produced by FY-3C were fully investigated and showed slight differences from ERA-Interim data [35]. It is noticeable that the quality analysis in such an evaluation mentioned above only refers to the influence of multipath and super refraction in the lower atmosphere, without taking the reflected signals of FY-3C into account. It is well-known that the signal travels to lower height and can be reflected at the surface and received by RO receivers. Therefore, it is possible to detect the surface-reflected signals of FY-3C RO events and provide the opportunity to improve FY-3C products resolution.
In this paper, we put the emphasis on the surface-reflected signals of FY-3C, which have not been studied before. Firstly, we systematically compared the mean bias and standard deviation between FY-3C profiles and COSMIC refractivity profiles. We selected COSMIC events with both reflected and non-reflected signals. Subsequently, we used a radio holographic technique to visualize and identify the reflection of the FY-3C signals. At last, we reconstructed the models of reflected signals of FY-3C RO events. Section 2 introduces the available data and data preprocessing. Section 3 shows the methodology of the research and details the results. Section 4 discusses the results and Section 5 is our final conclusion to the present study.
2. Data and Quality Control
2.1. COSMIC RO Data
In order to pick the reflected RO events, we used the ROM SAF reflection flag database to extract COSMIC profiles for convenience. The COSMIC occultations with an SVM flag value over 0.25 were likely to be reflections, but some of them may also be disturbed by atmospheric multipaths or other instrumental nuisances to show non-reflections [14]. Hence, for the purpose of this study, we identified the occultations with an SVM flag value greater than 0.25 as reflections and the occultations with an SVM flag value below 0 as non-reflections. The COSMIC refractivity profiles during 2015 were obtained from COSMIC Data Analysis and Archive Center (CDAAC) and used for the consequent comparison with FY-3C refractivity profiles from 2015.
2.2. FY-3C RO Data
FY-3C has the capability to observe the phase and amplitude measurements from GPS and BDS satellites as they are occulted by Earth’s atmosphere, and these raw data are defined as the Level-0 data [32]. Based on the highly accurate LEO precise orbit determination (POD) data and occultation observations (Level-0), the calculation program was run to determine excess phase data (Level-1). The bending angle profiles were retrieved by Geometric Optics (GO) and Wave Optics (WO) methods at different altitudes [2,24], then the refractivity profiles were retrieved through Abel transforming based on the optimized bending angle profiles (Level-2) [32]. In this paper, the FY-3C raw data measurements of Level-1 and refractivity profiles of Level-2 during 2015 were used for in-depth analysis.
2.3. Data Matching and Quality Control
In order to obtain the collocated profiles, we matched the refractivity profiles of COSMIC and FY-3C with spatial and temporal criteria. At first, we set the matching window with the time interval limited to 1 h, and the latitude and longitude interval limited to 2.5 degrees. Then, we used this window as the matching criteria to extract FY-3C and COSMIC refractivity profiles. Finally, we used a spline interpolation method to interpolate the collocated refractivity profiles from 0 km to 25 km, with vertical steps of 0.2 km.
To improve the profiles quality for comparison, we rejected refractivity profiles with relative bias higher than 10% from the altitudes of 0 km to 25 km.
3. Methods and Results
3.1. Comparison of FY-3C Refractivity Profiles with COSMIC
The GNSS RO reflections frequently happen on smooth land, ocean and ice surfaces. Globally, the reflected occultations present seasonal and latitudinal patterns [11]. For example, the percentage of reflections from middle latitude to polar regions is higher than that from the low latitude regions. In the winters of the northern and southern hemispheres, the percentage of reflections is also higher due to the snow and ice cover on the land’s surface [11].
Figure 1 shows the global distribution of FY-3C- and COSMIC-matched event groups from January to February (top) and August to September (bottom) during 2015. As previously reported, the reflected signal tend to occur in colder and drier conditions, and are strongly related with the total column water [12]. In our study, the distribution of matched events between FY-3C and COSMIC is identical with a pattern that shows that the reflections prefer to occur in colder and drier conditions. As is shown in Figure 1, the matched events between FY-3C and COSMIC are mainly gathered at both hemispherical latitudes between 40–50°, while the matched events at the tropics and polar regions are sparsely scattered. At the tropical oceans, the number of matched events falls as the water vapor above the ocean surface increases. Over the larger ocean area in the southern hemisphere, where it is more suitable for reflections to occur, there are more matched events in the southern hemisphere than in the northern hemisphere. Besides, the number of matched events over land in January and February (top) is larger than in August and September (bottom) at a latitude of >60°. Such distribution patterns may be caused by the cover of snow and ice over land in winter; thus, the reflections occur.
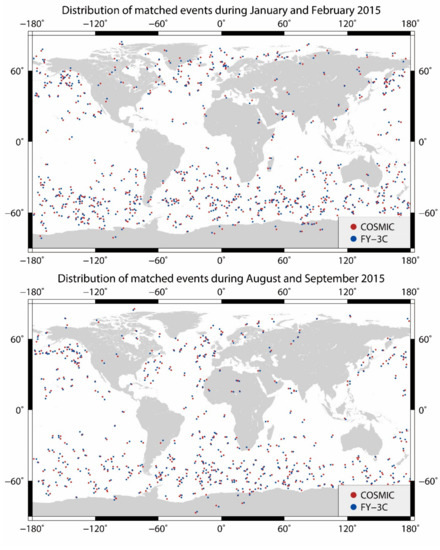
Figure 1.
Global distribution of the matched RO events between FY-3C and COSMIC. The red marks represent COSMIC events and the blue marks represent FY-3C events. The top panel shows the distribution in January and February 2015, the bottom panel shows the distribution in August and September 2015.
As shown in Figure 2, the number of COSMIC RO reflection events in each month is around 7000 to 19,000, while the number of FY-3C RO events is around 6000 to 14,000 in each month in 2015. No data are available for FY-3C from June to July 2015. Based on the criteria which we mentioned in Section 2.3, we obtained 2372 matched events between FY-3C and COSMIC with reflections, and 2709 matched events between FY-3C and COSMIC without reflections (no-reflection). All these matched events will be used for subsequent comparisons.
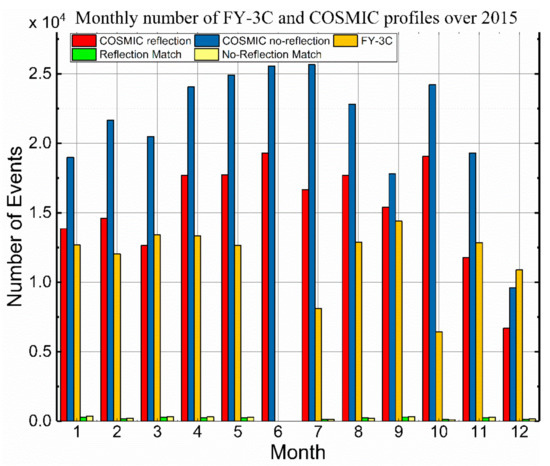
Figure 2.
Monthly number of COSMIC occultations with reflection, no-reflection, FY-3C occultations and matched occultations from January to December 2015.
After obtaining the collocated refractivity profiles and data quality control, we used mean relative bias and relative standard deviation to evaluate the accuracy index between COSMIC and FY-3C events. The comparison indexes are defined as follows [36]:
where k is the individual altitude layer, is the total number of profiles in each layer, R is the refractivity, F and C represent FY-3C and COSMIC, respectively, and represent mean relative bias and relative standard deviation, respectively.
As the seasonal patterns of COSMIC RO reflection events were verified significantly [11], we selected four representative months with more reflection events for the subsequent comparison (Figure 3). The statistical differences of mean bias and standard deviation bias are substantially consistent.
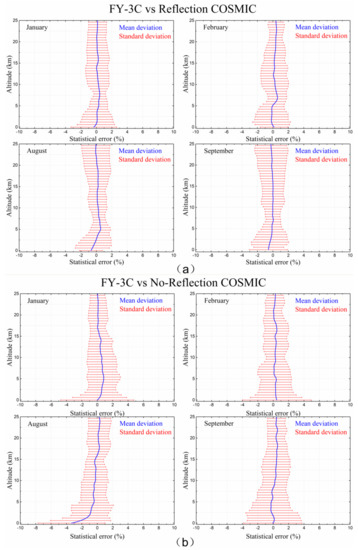
Figure 3.
(a) Refractivity deviation from matched profiles of FY-3C and COSMIC events with presence of reflected signals. (b) Refractivity deviation from matched profiles of FY-3C and COSMIC events without presence of reflected signals. Each panel from left to right and from top to bottom shows the mean bias (blue) and standard deviation (red) of one selected month.
For the comparisons between FY-3C and COSMIC with reflected signals across the four representative months (Figure 3a), from 5 km to 25 km, the mean relative biases are less than 1%, and the corresponding relative standard deviations are less than 2%. Below 5 km, the relative biases of the refractivity profiles are within 1%, and the relative standard deviations are less than 2%. Due to reflection and atmospheric multipath below 2 km, the statistical differences increase significantly and show negative trends. Compared to the former comparisons (Figure 3a), the comparisons between FY-3C and COSMIC without reflections (Figure 3b) deviated more widely, from 0 km to 5 km. It is highly remarkable that the comparisons below 2 km show −3% mean bias and 5% standard deviation, which may be attributed to the different quality control method at each stage of the retrieval processes at a lower height between FY-3C and COSMIC. In practice, the GNSS-RO signals do not often reach the surface, there is no reflection on the surface and the cutting height in FY-3C and COSMIC is different, which might result in such wide deviations for the comparisons below 2 km.
From other previous studies, COSMIC occultation refractivity profiles with reflections in lower altitude have better performance with respect to ECMWF post-analyzed data than the refractivity profiles without reflections [36]. In their opinion, the reflected signals are derived from clear atmospheric conditions and can make better occultation signals to generate quality profiles at lower altitudes. Without considering the influence of surface reflections, Liao et al. [33] identified a slight negative bias between FY-3C and ECMWF comparisons below 2 km; while, from 0 km to 35 km, FY-3C shows high consistency with respect to COSMIC, and the bias of raw bending angles between FY-3C and COSMIC was elaborated by a different retrieval data-processing algorithm and observational noise.
Based on our comparison results, the refractivity profiles of FY-3C and COSMIC have small systematic differences in a lower atmosphere when COSMIC events present reflected signals. The mean relative difference of the matched profiles with presence of reflected signals below 2 km is smaller than 0.5% (Figure 3a), which indicated both FY-3C and COSMIC events do indeed penetrate below 2 km, since the similar atmospheric and surface conditions are fine enough to attain clean raw data and generate quality profiles. The minor bias between the matched profiles may be due to observational noise rather than atmospheric influence. Therefore, we think that the FY-3C RO profiles which matched with the reflected COSMIC profiles also have reflection features near the surface.
3.2. FY-3C Radio Holographic Analysis
The reflected signals of GNSS RO events always present different frequency spectra than direct signals [11,13,18,22]. Radio holographic analysis is still the main method to identify reflections in RO events [26]. After identification of the portion of reflected signals, a detailed analysis can help determine the atmospheric and surface properties [13].
The FY-3C RO wave field was expressed as follows [13]:
where is SNR on L1 channel, measured amplitude, is carrier phase measurements and t is time instant. Besides the observed wave field , we require the reference wave field [13]:
where is the smoothed fit to . Then, the sliding wave field is given as the following function [13]:
After that, Fourier Transform (FT) analysis is applied to the . Since the direct signal in the observed wave field of FY-3C is large enough to dominate the sliding wave field, the spectrum of the direct single is almost at zero frequency, and the spectrum of reflected signal can be identified in the time-frequency domain.
Figure 4, Figure 5 and Figure 6 show the SNR on L1 channel, radio holographic image and geographical location of three individual FY-3C RO events over the ocean at different latitudes. The examples show two events with reflections at the beginning and, lastly, show an event without a reflection. Under radio holographic analysis, the frequency shift of the reflected signal is identifiable from the radio holographic image. These three events are distributed in different locations, and the reflections of FY-3C also show varying behaviors depending on the different SVM flag value of COSMIC events.
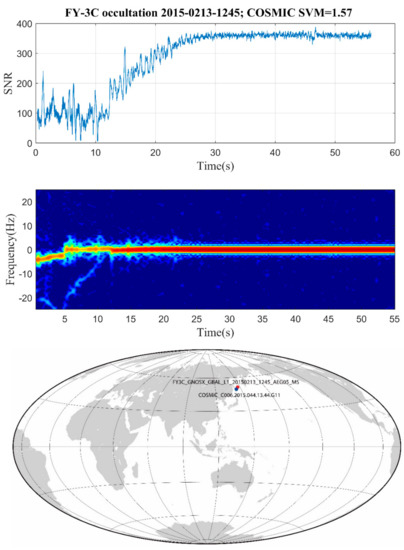
Figure 4.
FY-3C event on 13 February 2015: received SNR of L1 channel (upper panel), radio hologram spectrum from FY-3C Level_1 data (middle panel), geographical location of FY-3C event (bottom panel).
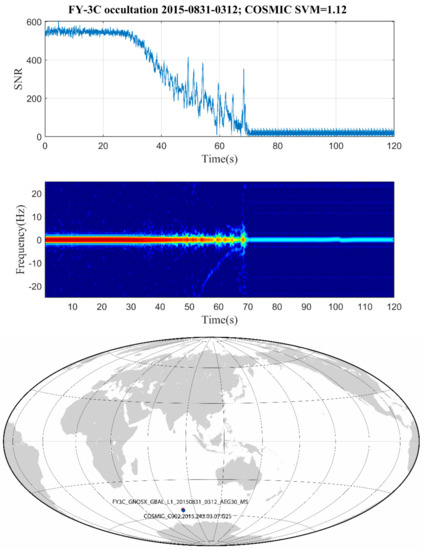
Figure 5.
FY-3C event on 31 August 2015: received SNR of L1 channel (upper panel), radio hologram spectrum from FY-3C Level_1 data (middle panel), geographical location of FY-3C event (bottom panel).
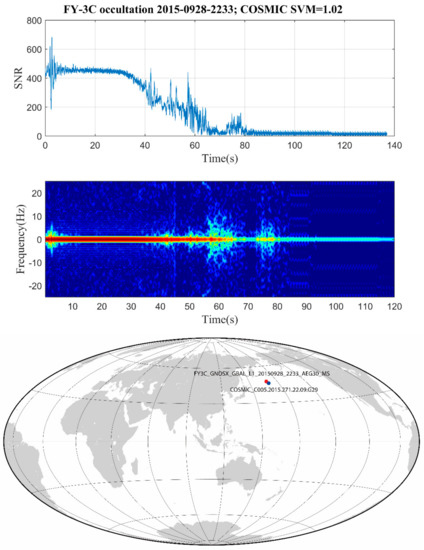
Figure 6.
FY-3C event on 28 September 2015: received SNR of L1 channel (upper panel), radio hologram spectrum from FY-3C Level_1 data (middle panel), geographical location of FY-3C event (bottom panel).
In Figure 4, the FY-3C RO event was distributed at the ocean’s surface. The SNR is above noise level during the first 10 s of this rising event. The radio holographic image shows the main spectra power near 0 Hz and a secondary branch is varied from the main spectra; after about 12 s, the power is down to the normal floor. The SVM flag value of the COSMIC RO-reflected event from the matched pair is about 1.57, which presents substantial reflection. In Figure 5, reflection happens during the last time of the setting event and the power of the SNR is evidently above the noise level for about 60–70 s. From the holographic image, there are visible negative frequency shifts between 60–70 s, which are considered as the reflected portion of the signal. This FY-3C event also presents reflection and the SVM flag value of COSMIC RO event from the matched pair is about 1.12. Figure 6 shows an unclear reflection at the end of the setting event and the SVM flag value of matched COSMIC RO event is about 1.02. It is worth noting that the reflected spectrum in Figure 6 is less significant than that in Figure 5. The FY-3C event in Figure 6 with this spectrum should be classified as no clear reflection, although the matched COSMIC event did present a clear reflection. Indeed, the minimum capture altitude of FY-3C signal in Figure 6 is below 2 km, but this does not guarantee a reflection event. Therefore, it seems to relate to instrumental problems rather than the ocean surface’s roughness.
Both FY-3C and COSMIC receivers have open-loop tracking capability in the lower part of the troposphere [9,32]. With the open-loop tracking technique, the tracking ability for rising RO event is much improved [37]. FY-3C and COSMIC receivers adopt a 100 Hz open-loop sampling rate and a 50 Hz open-loop sampling rate, respectively [32,38,39,40]. In other words, the FY-3C receiver is as capable as the COSMIC received for capturing detailed atmospheric information at a lower height. Furthermore, under the similar objective condition of the matched pairs, FY-3C receivers can capture reflected signals on the surface, similarly to COSMIC receivers.
We manually tested other FY-3C RO events from the matched pairs and found different degrees of reflections. The matched events of COSMIC with the presence of reflected signals and FY-3C roughly have the same geographical location and atmospheric conditions, so it is credible that they have similar reflection characteristics at the immediate time period. Meanwhile, we also found some occultation events without distinct reflection spectra from the radio holographic images. Since about 80% of total GPS RO signals can penetrate to below 2 km [33], some extracted FY-3C signals that, under the matching criteria, still could not arrive to Earth’s surface and reflected on the surface. The occultations without reflection spectra may be due to sudden atmospheric changes and instrumental problems in the lower troposphere.
3.3. Reflected Bending Angle Model of FY-3C
In the COSMIC RO mission, the L2 signal was mainly used to improve the quality of the ionosphere at a higher altitude, and the atmospheric products in a lower troposphere were obtained with the L1 signal [41]. It is known that the FY-3C receiver has tracking problems in a GPS L2 signal, and most problems occur in rising occultations [42]. Only about 70% of the rising occultations can go below 20 km [42]. Due to lack of observation data, it may prevent the generation of bending angles of L2 at a lower height, especially near the surface of Earth. Therefore, a new L2 extrapolation method was applied to effectively improve the combination of bending angles with L1 and L2 [42]. However, by means of an open-loop tracking technique implemented in FY-3C, the L1 signal penetration depth can reach below 5 km, and even below 2 km, with proportions of about 95.7% and 79.5%, respectively [33]. Meanwhile, due to the super refraction and ducting effect, especially above the ocean’s surface, the refractive index and impact parameter are multivalued functions [43,44]. In order to separate the reflected signals from the raw data and avoid the tracking problems of the L2 signal of FY-3C, we just focus here on the L1 signal. We picked three FY-3C events with clear reflections in Section 3.2 (Figure 4, Figure 5 and Figure 6), and computed the bending angles from raw data of L1 signal by GO method [2]. Based on the assumption of spherical symmetry, we obtained the single-path bending angles with the refractive index and the impact parameter from the surface to 40 km altitude.
Under Bouguer’s rule and spherical symmetry assumptions, the propagation of occultation ray can be described with Geometrical Optics. The bending angle can be obtained by a forward Abel transform [2,45]:
where the integral starts from the tangent point above the surface. As the occultation ray reaches Earth’s surface, the ray may reflect there. At the reflected point, where and , the additional bending angle due to reflection is [11]:
Based on Equations (6) and (7), we will attain the reflected portion from total bending angles [11]:
where the integral starts at the impact parameter of Earth’s surface level and the is slightly less than ; thus, the signal could reach the surface and be reflected.
Figure 7, Figure 8 and Figure 9 show the reconstructed bending angles of three FY-3C events. In detail, the left panels show the bending angles from RO profiles of FY-3C Level_2 (red lines), the bending angles (dashed green lines) reconstructed by single-valued forward Abel integral of Equation (6) and the bending angles from raw data of L1 signal by GO method (blue lines). The right panels show the reflected bending angle models which were calculated by Equation (8).
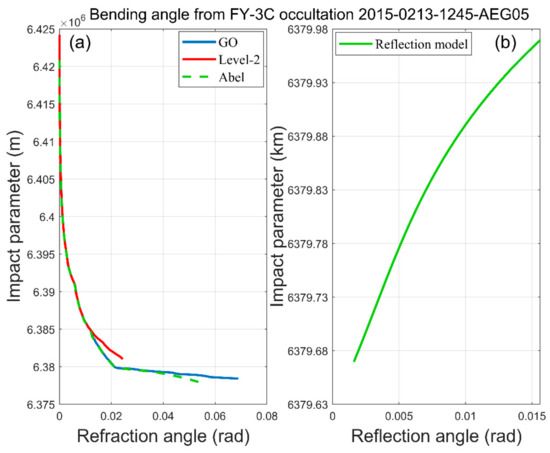
Figure 7.
Bending angles of FY-3C event on 13 February 2015: in (a), the red curve shows the bending angles of refractivity profile from cutting height to 40 km altitude, the green dashed curve shows the bending angles by Equation (6) and the blue curve shows the recalculated bending angle by GO method from Earth’s surface to 40 km altitude; (b) shows the reflected bending angle model extracted by Equation (8).
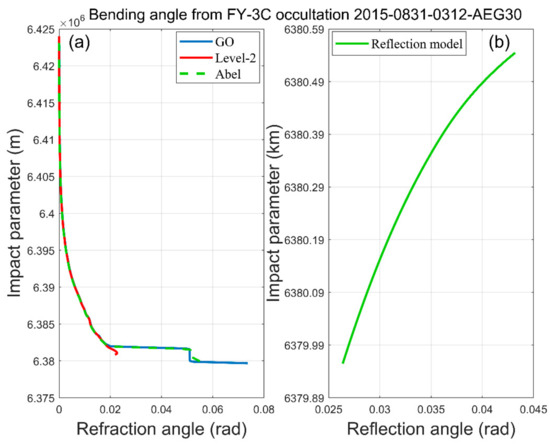
Figure 8.
Bending angles of FY-3C event on 31 August 2015: in (a), the red curve shows the bending angles of refractivity profile from cutting height to 40 km altitude, the green dashed curve shows the bending angles by Equation (6) and the blue curve shows the recalculated bending angle by GO method from Earth’s surface to 40 km altitude; (b) shows the reflected bending angle model extracted by Equation (8).
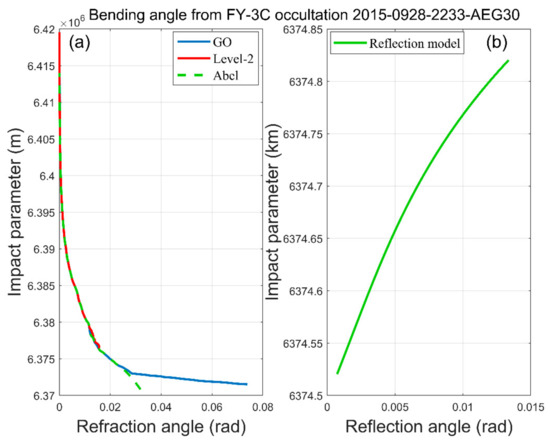
Figure 9.
Bending angles of FY-3C event on 28 September 2015: in (a), the red curve shows the bending angles of refractivity profile from cutting height to 40 km altitude, the green dashed curve shows the bending angles by Equation (6) and the blue curve shows the recalculated bending angle by GO method from Earth’s surface to 40 km altitude. (b) shows the reflected bending angle model extracted by Equation (8).
The bending angles (red lines) of FY-3C Level_2 above the cutting height are shown in Figure 7, Figure 8 and Figure 9. The bending angle profiles of FY-3C Level_2 are determined by a geometric optics algorithm (GO) above an altitude of 25 km, where a single path ray propagates through the atmosphere. Below 25 km, bending angle profiles from Level_2 are determined by a wave optics (WO) algorithm due to the multipath [32]. Before the signal is completely obscured by the earth, the signal may reach the appropriate surface and can be reflected there. In the data processing center, bending profiles were truncated at a certain altitude and did not reach the surface in most cases. As described above, in order to obtain the reflected bending angle model by Equation (8), we reconstructed the bending angle profiles from the surface to 40 km altitude (blue lines) to attain the lower impact parameter and refractive index. It can be observed from the three cases that the bending angles have a sharp gradient below 2 km, where the reflections and ducting occur.
Furthermore, in the right panels of Figure 7, Figure 8 and Figure 9, the reflected bending models gradually decrease in lower impact heights, from RE to curvature radius of the reference ellipsoid. The reflected bending range of variation is about 0.01 rad and the range of altitude variation is about 0.3 km. It is indicated that the reflected bending angle model is sensitive to the ducting layer and could reduce the bias below the ducting layer of GNSS RO measurements [11,46]. Therefore, we think the reflected bending angle models of FY-3C are useful in the atmosphere near the surface.
4. Discussion
Under the matching criteria, we found FY-3C RO profiles have good performance compared with COSMIC profiles. The consistency of FY-3C and COSMIC products has been successfully validated as well. Within the closer location area and temporal interval, FY-3C events present reflection signatures similar to COSMIC reflection events. However, some events from matched pairs do not present much clearer reflections. We speculate that the absence of reflections may result from poor surface conditions and turbulent weather variations.
The refractivity profiles of FY-3C RO events do not start from the surface in most cases, but the reflections may occur at the surface. We reprocessed the new bending angle profiles of FY-3C from the surface to 40 km altitude. Then, we reconstructed the model of reflected bending angles from the surface of Earth. However, there are still some uncertainties in the reflected bending calculation, due to the influence of low SNR or atmospheric interference. Further, more appropriate algorithms could extract more information and physical mechanisms at a lower height. It is worth noting that the reflected signal retrieval is not straightforward in practice. It is a classic routine to use PM [46] or CT [26] methods to separate the reflected signal from the direct signal and to then calculate the direct reflected bending angles through a GO algorithm [26], which will be our next emphasis in a coming study. In the current study, we only focused on the reflection existence in FY-3C and calculated the model of reflected bend angles, which paves the way for digging FY-3C in the future.
FY-3C RO products have been used in numerical weather prediction (NWP) for several years. The reflected signals with good prior information are able to provide substantial benefits of NWP. Taking advantage of reflected RO signals with independent information in lower height enables us to improve product quality. In our following work, specific statistics will be focused on the reflection distribution and physical characteristics of FY-3C.
5. Conclusions
In this study, we discussed the reflection occurrence and extracted the reflected bending model of FY-3C RO events. First, we used a matching criterion to extract the FY-3C and COSMIC refractivity profiles for the year 2015. We picked the COSMIC RO cases with reflected signal components, as identified in the ROM SAF reflection database. The mean bias of matched profiles is less than 1%, and standard deviation is less than 2%, from the altitudes of 5 km to 25 km. From the surface to the altitude of 5 km, the mean biases and standard deviation of matched profiles are less than 1% and 2%. The results demonstrated that there is a small systematic difference in the matching profiles of FY-3C and COSMIC. We also found worse comparison results below 2 km when COSMIC profiles without reflected signals. This is probably related to the different cutting height of FY-3C and COSMIC profiles.
We picked a mass of FY-3C cases from the matched events when COSMIC profiles with reflected signals and found that these FY-3C cases show different degrees of reflection, especially over the ocean at high latitudes. The reflected signal is quite different from the direct signal, and the reflected bending angle increases as the impact height decreases. The reflected signals of FY-3C could be separated from the direct signals and could be used operationally in FY-3C RO products.
Like other GNSS RO missions, the land-reflected signals of FY-3C are not as numerous as those over the ocean, and the reflection effect is not obvious. Reflections over ocean present distinct seasonal and dimensional characteristics, but these are not obvious over land. FY-3C will continuously provide RO products until 2030, and further work will be expected to investigate the uncertainty of land reflections.
Author Contributions
Conceptualization, Y.X. and W.C.; methodology, Y.X. and W.C.; software, W.C.; validation, Y.X., W.C., X.L., B.Z., R.Z. and S.X.; writing—original draft preparation, W.C.; writing—review and editing, Y.X., W.C.; visualization, Y.X.; supervision, Y.X.; funding acquisition, Y.X. All authors have read and agreed to the published version of the manuscript.
Funding
This research was funded by National Key Research Program of China (No. 2016YFB0501900), National Natural Science Foundation of China (Grant No. 41674028 and 41274044).
Institutional Review Board Statement
Not applicable.
Informed Consent Statement
Not applicable.
Acknowledgments
The authors would like to thank ROM SAF for the use of demonstration data. We are thankful to the CDAAC for providing COSMIC radio occultation data. Additionally, we would like to thank the National Satellite Meteorological Centre, Chinese Meteorological Administration for providing FY-3C radio occultation data.
Conflicts of Interest
The authors declare no conflict of interest.
References
- Melbourne, W.; Davis, E.; Duncan, C.; Hajj, G.; Hardy, K.; Kursinski, E.; Meehan, T.; Young, L.; Yunck, T. The application of spaceborne GPS to atmospheric limb sounding and global change monitoring. JPL Publ. 1994, 147, 94-18. [Google Scholar]
- Kursinski, E.R.; Hajj, G.A.; Schofield, J.T.; Linfield, R.P.; Hardy, K.R. Observing Earth’s atmosphere with radio occultation measurements using the Global Positioning System. J. Geophys. Res. Atmos. 1997, 102, 23429–23465. [Google Scholar] [CrossRef]
- Kuo, Y.-H.; Zou, X.; Huang, W. The impact of global positioning system data on the prediction of an extratropical cyclone: An observing system simulation experiment. Dyn. Atmos. Ocean. 1998, 27, 439–470. [Google Scholar] [CrossRef]
- Kuo, Y.-H.; Zou, X.; Chen, S.; Huang, W.; Guo, Y.-R.; Anthes, R.; Exner, M.; Hunt, D.; Rocken, C.; Sokolovskiy, S. A GPS/MET sounding through an intense upper-level front. Bull. Am. Meteorol. Soc. 1998, 79, 617–626. [Google Scholar] [CrossRef]
- Barnes, D. GPS status and modernization. In Proceedings of the Presentation at Munich Satellite Navigation Summit 2019, Munich, Germany, 25–27 March 2019. [Google Scholar]
- Zrinjski, M.; Barković, Đ.; Matika, K. Development and Modernization of GNSS. Geod. List 2019, 73, 45–65. [Google Scholar]
- Rocken, C.; Anthes, R.; Exner, M.; Hunt, D.; Sokolovskiy, S.; Ware, R.; Gorbunov, M.; Schreiner, W.; Feng, D.; Herman, B. Analysis and validation of GPS/MET data in the neutral atmosphere. J. Geophys. Res. Atmos. 1997, 102, 29849–29866. [Google Scholar] [CrossRef]
- Rius, A.; Ruffini, G.; Cucurull, L. Improving the vertical resolution of ionospheric tomography with GPS occultations. Geophys. Res. Lett. 1997, 24, 2291–2294. [Google Scholar] [CrossRef]
- Anthes, R.A.; Rocken, C.; Ying-Hwa, K. Applications of COSMIC to meteorology and climate. Terr. Atmos. Ocean. Sci. 2000, 11, 115–156. [Google Scholar] [CrossRef]
- Kuo, Y.-H.; Wee, T.-K.; Sokolovskiy, S.; Rocken, C.; Schreiner, W.; Hunt, D.; Anthes, R. Inversion and error estimation of GPS radio occultation data. J. Meteorol. Soc. Jpn. Ser. II 2004, 82, 507–531. [Google Scholar] [CrossRef]
- Aparicio, J.M.; Cardellach, E.; Rodríguez, H. Information content in reflected signals during GPS Radio Occultation observations. Atmos. Meas. Tech. 2018, 11, 1883–1900. [Google Scholar] [CrossRef]
- Healy, S. The Use of the GPS Radio Occultation Reflection Flag for NWP Applications. Available online: http://www.romsaf.org (accessed on 17 May 2021).
- Boniface, K.; Aparicio, J.M.; Cardellach, E. Meteorological information in GPS-RO reflected signals. Atmos. Meas. Tech. 2011, 4, 1397–1407. [Google Scholar] [CrossRef]
- Cardellach, E.; Oliveras, S. Assessment of a Potential Reflection Flag Product. Available online: http://www.romsaf.org (accessed on 17 May 2021).
- Xie, F.; Wu, D.L.; Ao, C.O.; Kursinski, E.R.; Mannucci, A.J.; Syndergaard, S. Super-refraction effects on GPS radio occultation refractivity in marine boundary layers. Geophys. Res. Lett. 2010, 37. [Google Scholar] [CrossRef]
- Cardellach, E.; Li, W.; Rius, A.; Semmling, M.; Wickert, J.; Zus, F.; Ruf, C.S.; Buontempo, C. First precise spaceborne sea surface altimetry with GNSS reflected signals. IEEE J. Sel. Top. Appl. Earth Obs. Remote Sens. 2019, 13, 102–112. [Google Scholar] [CrossRef]
- Nguyen, V.A.; Nogués-Correig, O.; Yuasa, T.; Masters, D.; Irisov, V. Initial GNSS Phase Altimetry Measurements From the Spire Satellite Constellation. Geophys. Res. Lett. 2020, 47, e2020GL088308. [Google Scholar] [CrossRef]
- Hocke, K.; Pavelyev, A.; Yakovlev, O.; Barthes, L.; Jakowski, N. Radio occultation data analysis by the radioholographic method. J. Atmos. Solar. Terr. Phys. 1999, 61, 1169–1177. [Google Scholar] [CrossRef]
- Beyerle, G.; Hocke, K. Observation and simulation of direct and reflected GPS signals in Radio Occultation Experiments. Geophys. Res. Lett. 2001, 28, 1895–1898. [Google Scholar] [CrossRef]
- Beyerle, G. GPS radio occultations with CHAMP: A radio holographic analysis of GPS signal propagation in the troposphere and surface reflections. J. Geophys. Res. 2002, 107, ACL 27-1–ACL 27-14. [Google Scholar] [CrossRef]
- Joachims, T. Learning to Classify Text Using Support Vector Machines: Methods, Theory and Algorithms. Available online: http://cognet.mit.edu/journal/10.1162/089120103322753374 (accessed on 17 May 2021).
- Cardellach, E.; Oliveras, S.; Rius, A. GNSS signal interference classified by means of a supervised learning method applied in the time-frequency domain. In Proceedings of the 2009 2nd International Congress on Image and Signal Processing, Tianjing, China, 17–19 October 2009; pp. 1–5. [Google Scholar]
- Gorbunov, M. Canonical transform method for processing radio occultation data in the lower troposphere. Radio Sci. 2002, 37, 9-1–9-10. [Google Scholar] [CrossRef]
- Gorbunov, M.; Lauritsen, K. Analysis of wave fields by Fourier integral operators and their application for radio occultations. Radio Sci. 2004, 39, 1–15. [Google Scholar] [CrossRef]
- Jensen, A.S.; Lohmann, M.S.; Nielsen, A.S.; Benzon, H.H. Geometrical optics phase matching of radio occultation signals. Radio Sci. 2004, 39. [Google Scholar] [CrossRef]
- Gorbunov, M.E.; Cardellach, E.; Lauritsen, K.B. Reflected ray retrieval from radio occultation data using radio holographic filtering of wave fields in ray space. Atmos. Meas. Tech. 2018, 11, 1181–1191. [Google Scholar] [CrossRef]
- Sievert, T.; Rasch, J.; Carlström, A.; Pettersson, M.I. Analysis of reflections in GNSS radio occultation measurements using the phase matching amplitude. Atmos. Meas. Tech. 2018, 11, 569–580. [Google Scholar] [CrossRef]
- Bai, W.; Sun, Y.; Du, Q.; Yang, G.; Yang, Z.; Zhang, P.; Bi, Y.; Wang, X.; Wang, D.; Meng, X. An introduction to FY3 GNOS in-orbit performance and preliminary validation results. In Proceedings of the EGU General Assembly Conference Abstracts, Vienna, Austria, 27 April–2 May 2014; p. 4036. [Google Scholar]
- Bai, W.; Wang, G.; Sun, Y.; Shi, J.; Yang, G.; Meng, X.; Wang, D.; Du, Q.; Wang, X.; Xia, J. Application of the Fengyun 3 C GNSS occultation sounder for assessing the global ionospheric response to a magnetic storm event. Atmos. Meas. Tech. 2019, 12, 1483–1493. [Google Scholar] [CrossRef]
- Liao, M.; Zhang, P.; Bi, Y.; Yang, G. A preliminary estimation of the radio occultation products accuracy from the Fengyun-3C meteorological satellite. Acta Meteorol. Sin 2015, 73, 1131–1140. [Google Scholar]
- Bai, W.; Sun, Y.; Du, Q.F.; Yang, G.; Yang, Z.; Zhang, P.; Bi, Y.; Wang, X.; Cheng, C.; Han, Y. An introduction to the FY3 GNOS instrument and mountain-top tests. Atmos. Meas. Tech. 2014, 7, 1817–1823. [Google Scholar] [CrossRef]
- Sun, Y.; Bai, W.; Liu, C.; Liu, Y.; Du, Q.; Wang, X.; Yang, G.; Liao, M.; Yang, Z.; Zhang, X.; et al. The FengYun-3C radio occultation sounder GNOS: A review of the mission and its early results and science applications. Atmos. Meas. Tech. 2018, 11, 5797–5811. [Google Scholar] [CrossRef]
- Liao, M.; Zhang, P.; Yang, G.-L.; Bi, Y.-M.; Liu, Y.; Bai, W.-H.; Meng, X.-G.; Du, Q.-F.; Sun, Y.-Q. Preliminary validation of the refractivity from the new radio occultation sounder GNOS/FY-3C. Atmos. Meas. Tech. 2016, 9, 781–792. [Google Scholar] [CrossRef]
- Xu, X.; Gao, P.; Zhang, X. Global multiple tropopause features derived from COSMIC radio occultation data during 2007 to 2012. J. Geophys. Res. Atmos. Res. 2014, 119, 8515–8534. [Google Scholar] [CrossRef]
- Wei, J.; Li, Y.; Zhang, K.; Liao, M.; Bai, W.; Liu, C.; Liu, Y.; Wang, X. An Evaluation of Fengyun-3C Radio Occultation Atmospheric Profiles over 2015–2018. Remote Sens. 2020, 12, 2116. [Google Scholar] [CrossRef]
- Cardellach, E.; Oliveras, S.; Rius, A. Applications of the reflected signals found in GNSS radio occultation events. In Proceedings of the GRAS SAF Workshop on Applications of GPS Radio Occultation Measurements, Reading, UK, 16–18 June 2008; pp. 133–143. [Google Scholar]
- Ao, C.; Hajj, G.; Meehan, T.; Dong, D.; Iijima, B.; Mannucci, A.; Kursinski, E. Rising and setting GPS occultations by use of open-loop tracking. J. Geophys. Res. Atmos. 2009, 114. [Google Scholar] [CrossRef]
- Sokolovskiy, S.V. Tracking tropospheric radio occultation signals from low Earth orbit. Radio Sci. 2001, 36, 483–498. [Google Scholar] [CrossRef]
- Sokolovskiy, S.; Rocken, C.; Lenschow, D.; Kuo, Y.H.; Anthes, R.; Schreiner, W.; Hunt, D. Observing the moist troposphere with radio occultation signals from COSMIC. Geophys. Res. Lett. 2007, 34. [Google Scholar] [CrossRef]
- Sokolovskiy, S.; Rocken, C.; Schreiner, W.; Hunt, D.; Johnson, J. Postprocessing of L1 GPS radio occultation signals recorded in open-loop mode. Radio Sci. 2009, 44, 1–13. [Google Scholar] [CrossRef]
- Zeng, Z.; Sokolovskiy, S.; Schreiner, W.; Hunt, D.; Lin, J.; Kuo, Y.-H. Ionospheric correction of GPS radio occultation data in the troposphere. Atmos. Meas. Tech. 2016, 9, 335–346. [Google Scholar] [CrossRef]
- Liao, M.; Healy, S.; Zhang, P. Processing and quality control of FY-3C GNOS data used in numerical weather prediction applications. Atmos. Meas. Tech. 2019, 12, 2679–2692. [Google Scholar] [CrossRef]
- Ao, C.O.; Meehan, T.; Hajj, G.; Mannucci, A.; Beyerle, G. Lower troposphere refractivity bias in GPS occultation retrievals. J. Geophys. Res. Atmos. 2003, 108. [Google Scholar] [CrossRef]
- Sokolovskiy, S. Effect of superrefraction on inversions of radio occultation signals in the lower troposphere. Radio Sci. 2003, 38. [Google Scholar] [CrossRef]
- Fjeldbo, G.; Kliore, A.J.; Eshleman, V.R. The neutral atmosphere of Venus as studied with the Mariner V radio occultation experiments. Astron. J. 1971, 76, 123. [Google Scholar] [CrossRef]
- Wang, K.-N.; Ao, C.O.; Juarez, M.D.L.T. GNSS-RO Refractivity Bias Correction under Ducting Layer Using Surface-Reflection Signal. Remote Sens. 2020, 12, 359. [Google Scholar] [CrossRef]


Publisher’s Note: MDPI stays neutral with regard to jurisdictional claims in published maps and institutional affiliations. |
© 2021 by the authors. Licensee MDPI, Basel, Switzerland. This article is an open access article distributed under the terms and conditions of the Creative Commons Attribution (CC BY) license (https://creativecommons.org/licenses/by/4.0/).