Assessing Wildfire Burn Severity and Its Relationship with Environmental Factors: A Case Study in Interior Alaska Boreal Forest

 , ,
, ,  ,
,  , and
, and
Abstract
1. Introduction
2. Materials and Methods
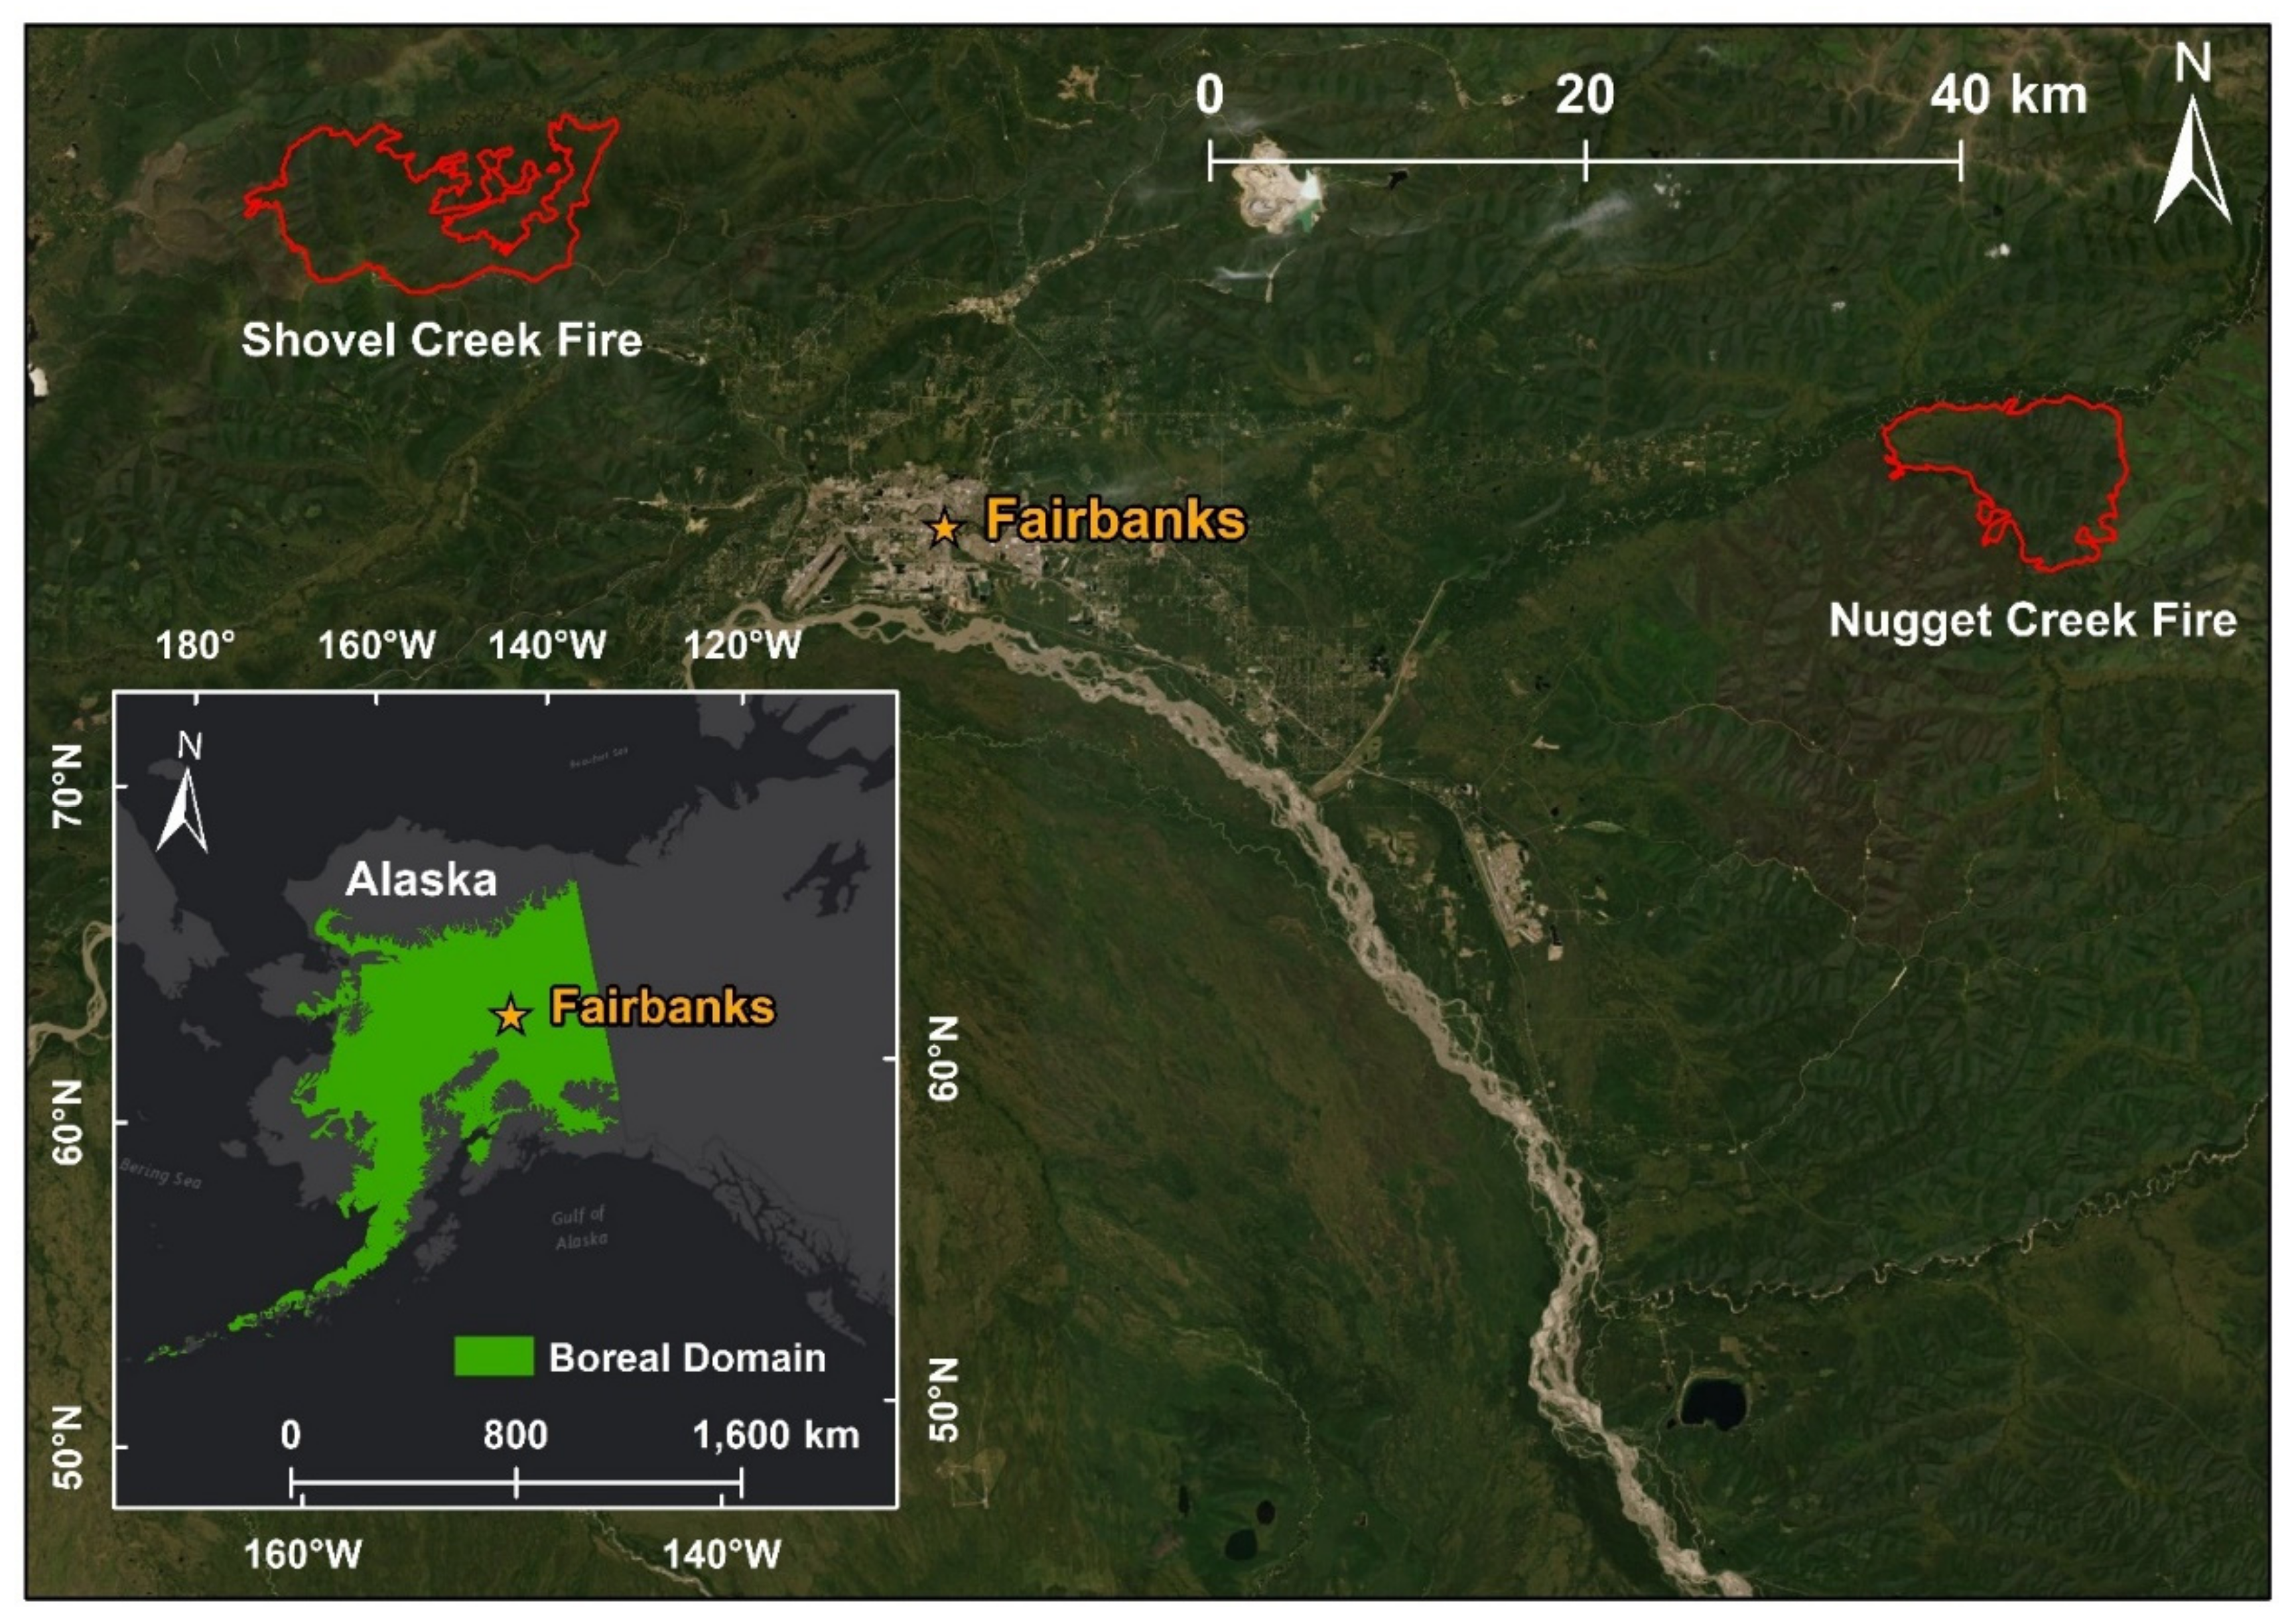
2.1. Study Area
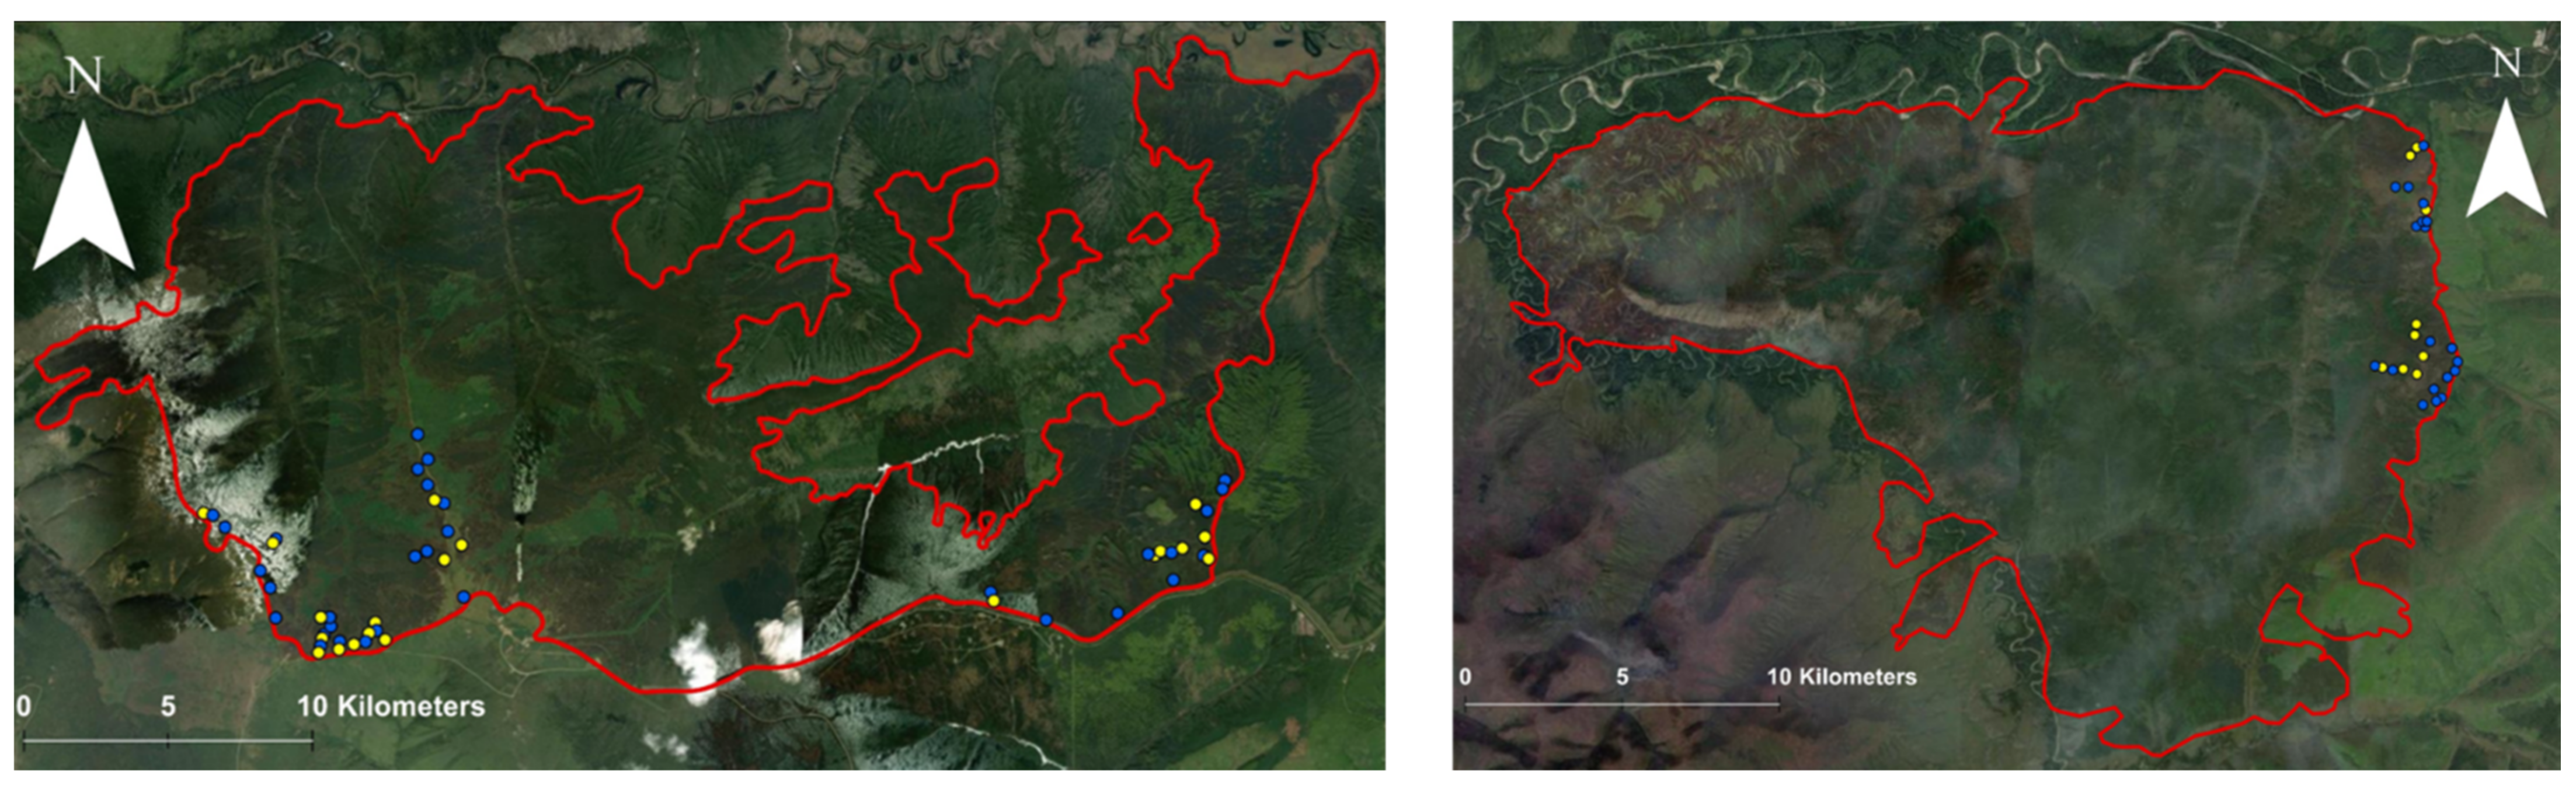
2.2. Field Work
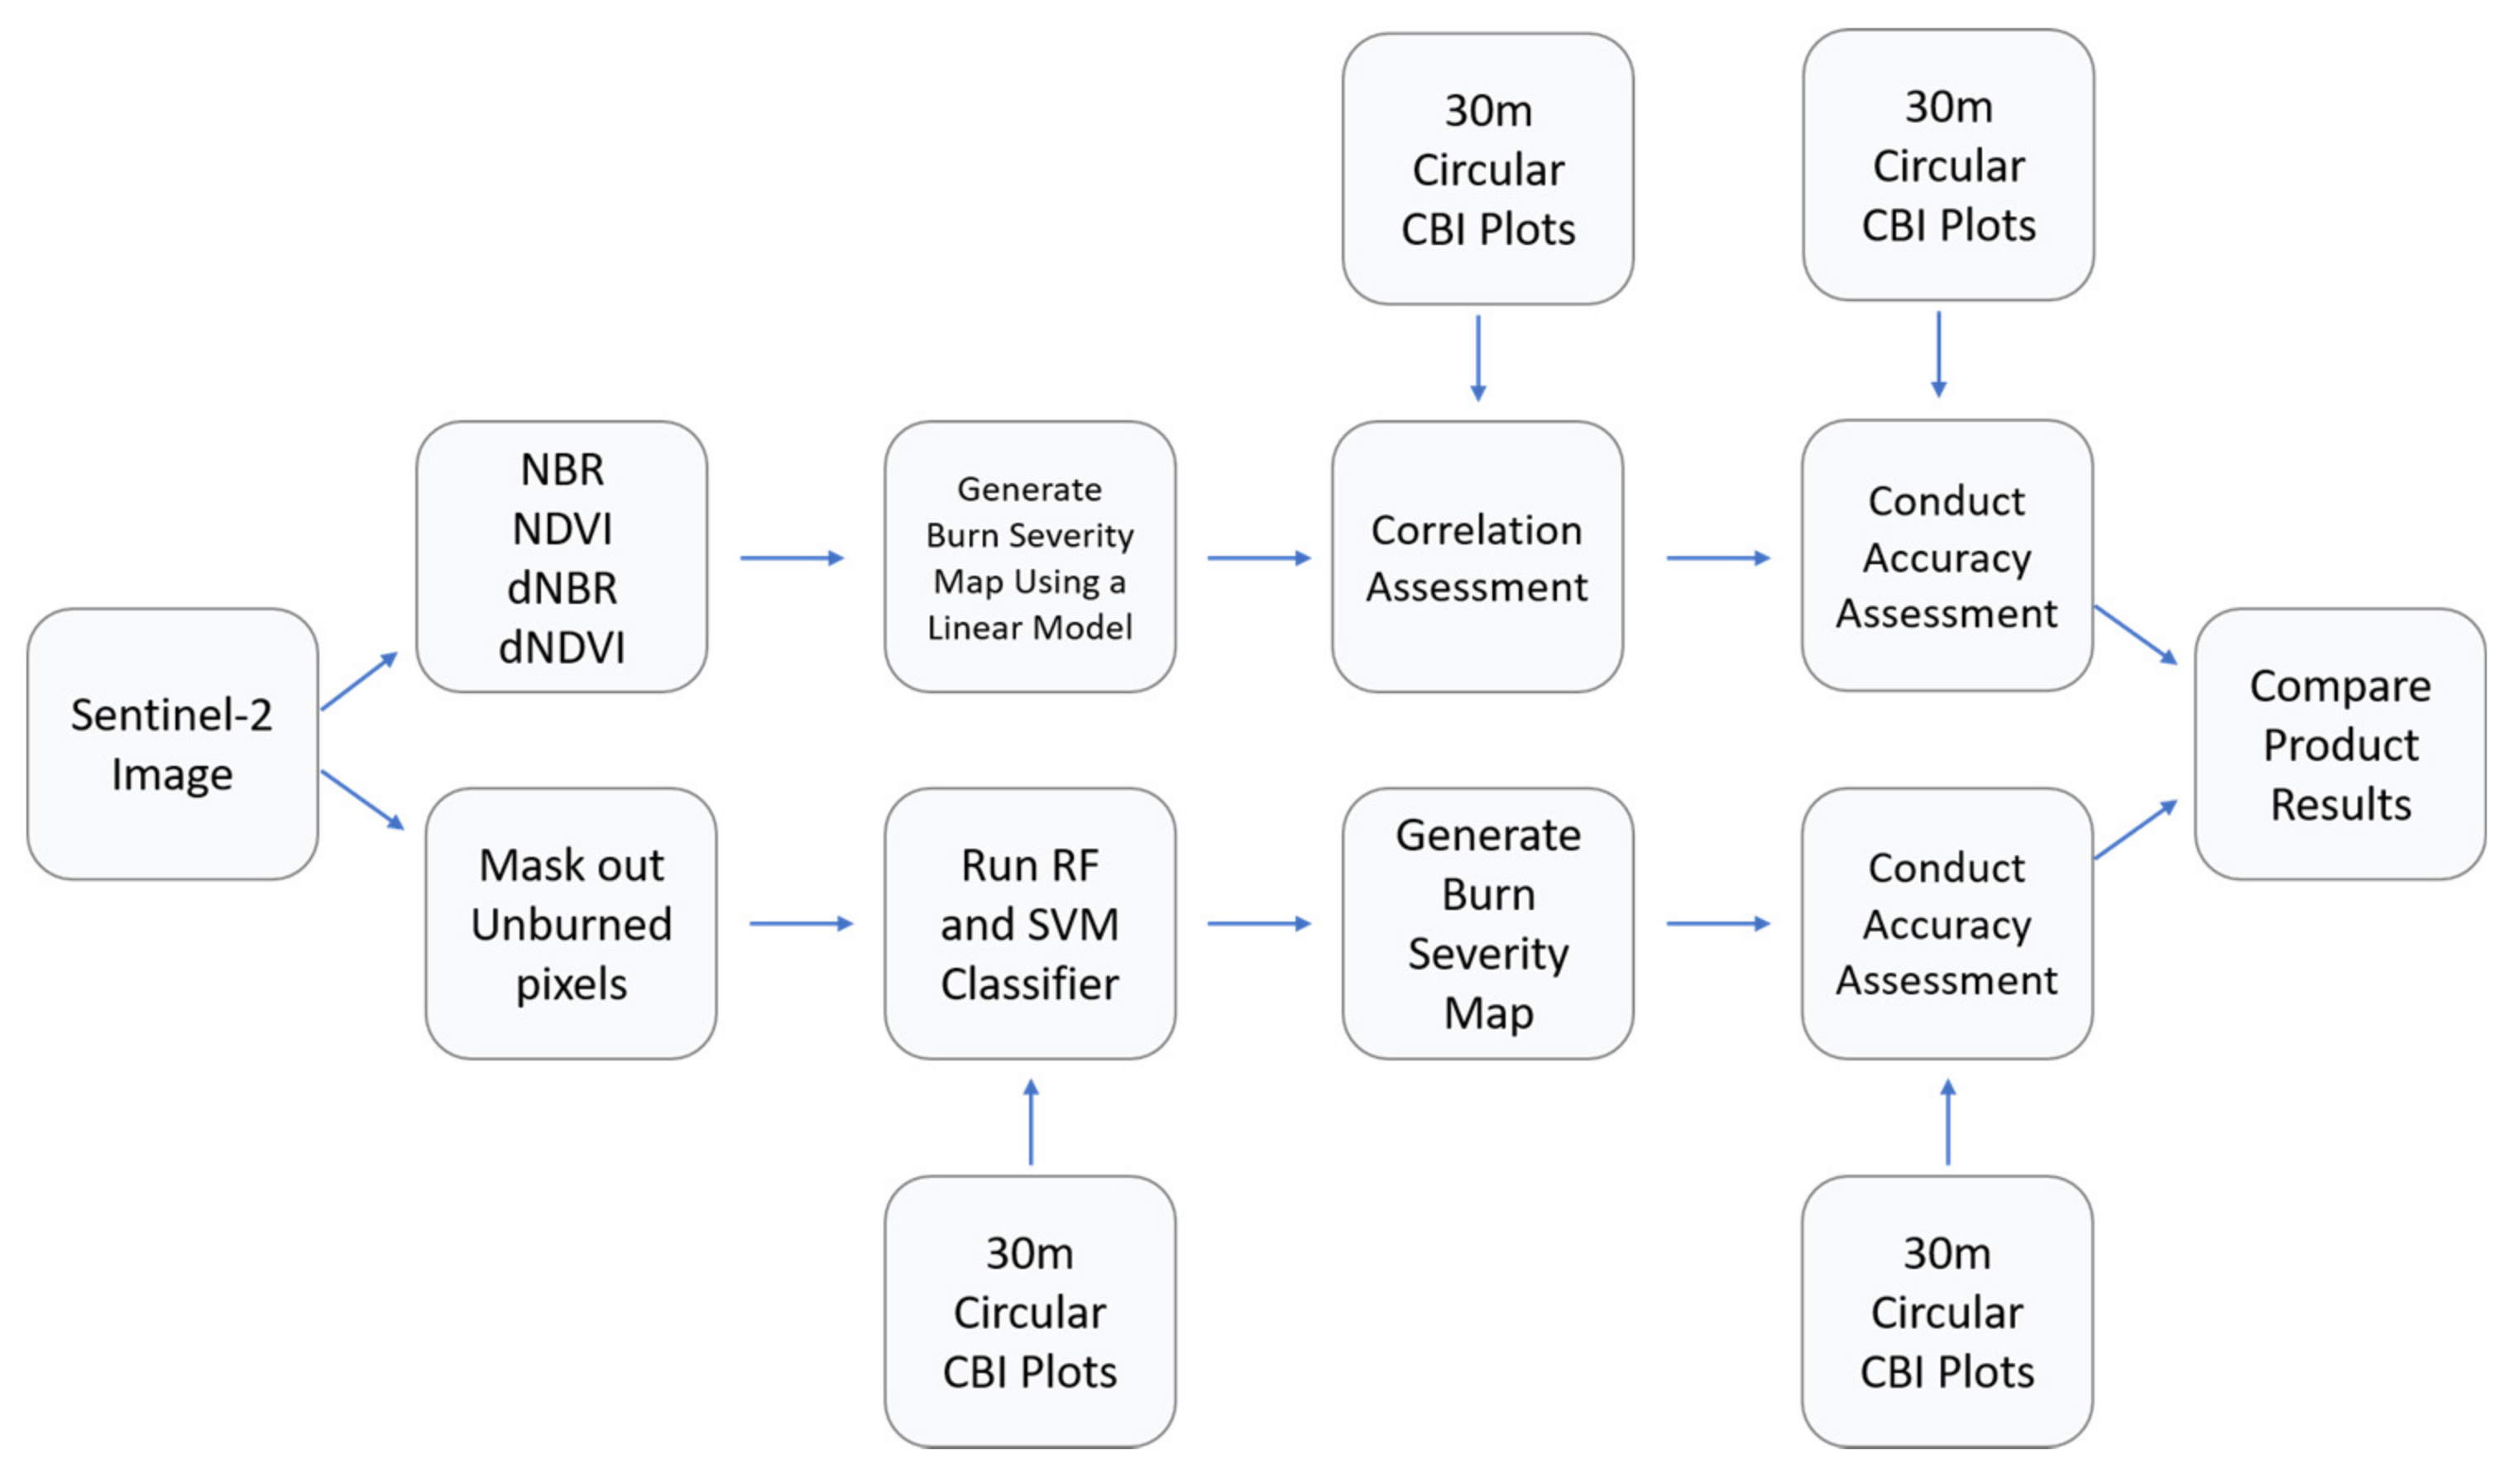
2.3. Burn Severity Mapping from Sentinel-2 Images
2.4. Burn Severity Relationship to Environmental Factors
3. Results
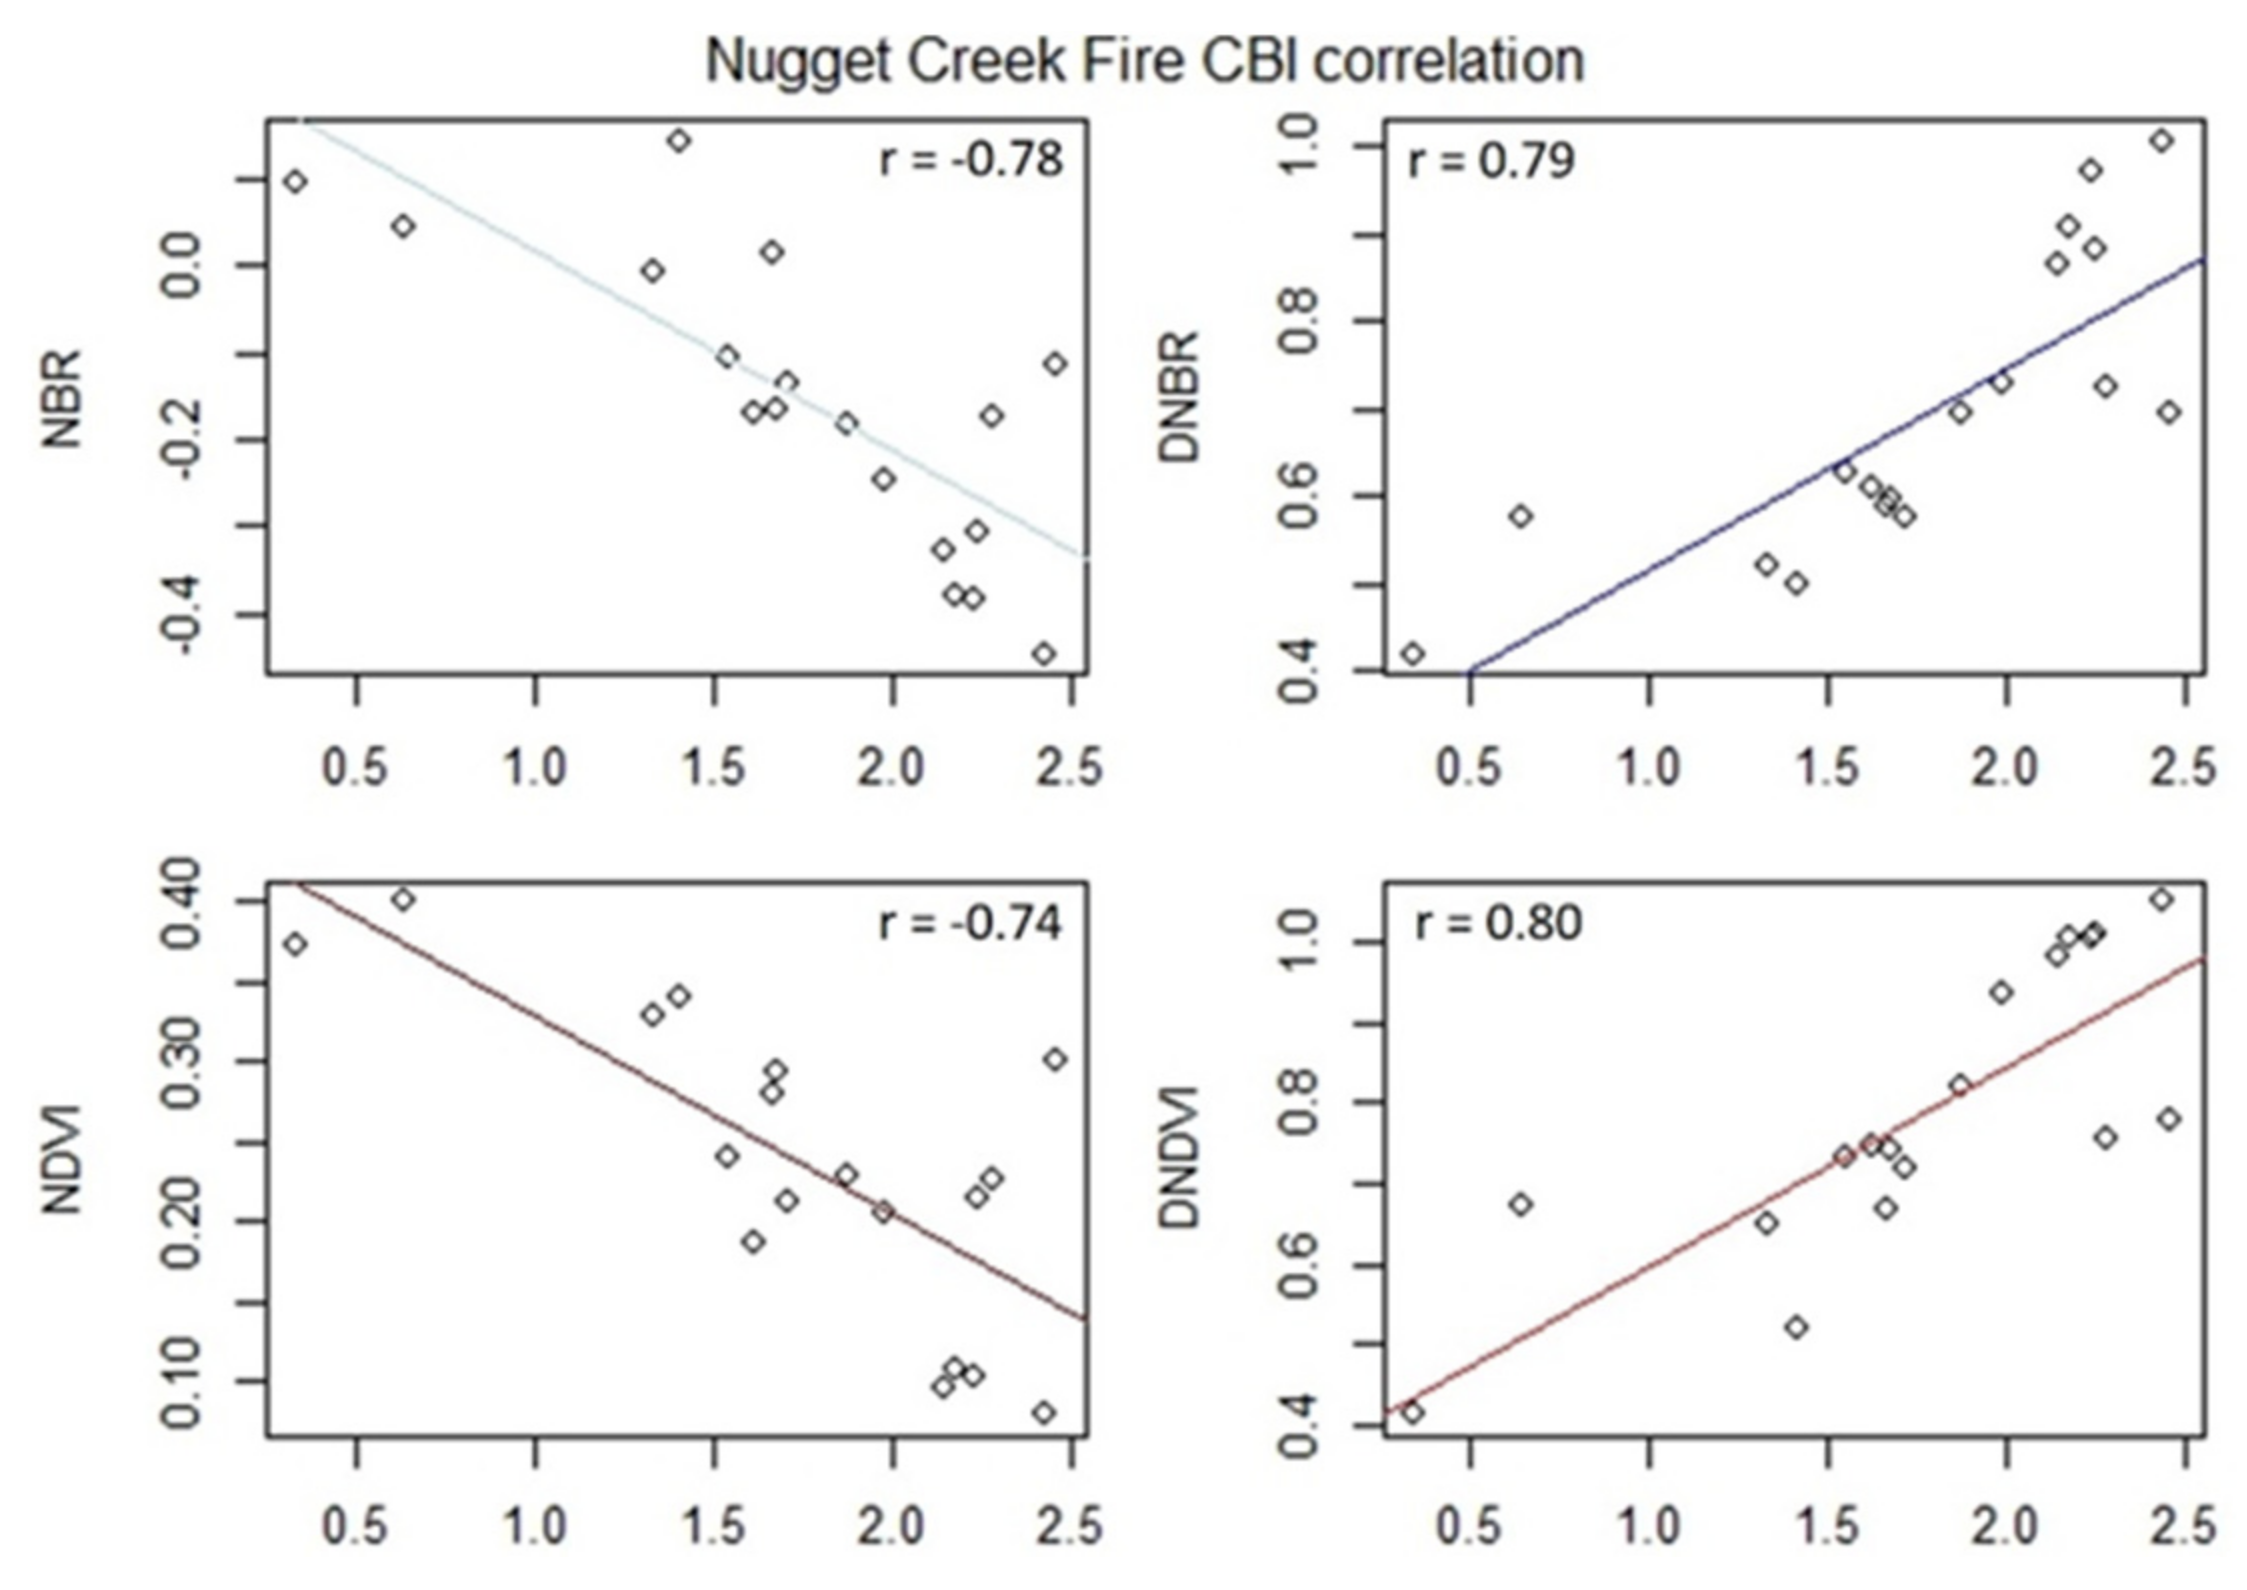
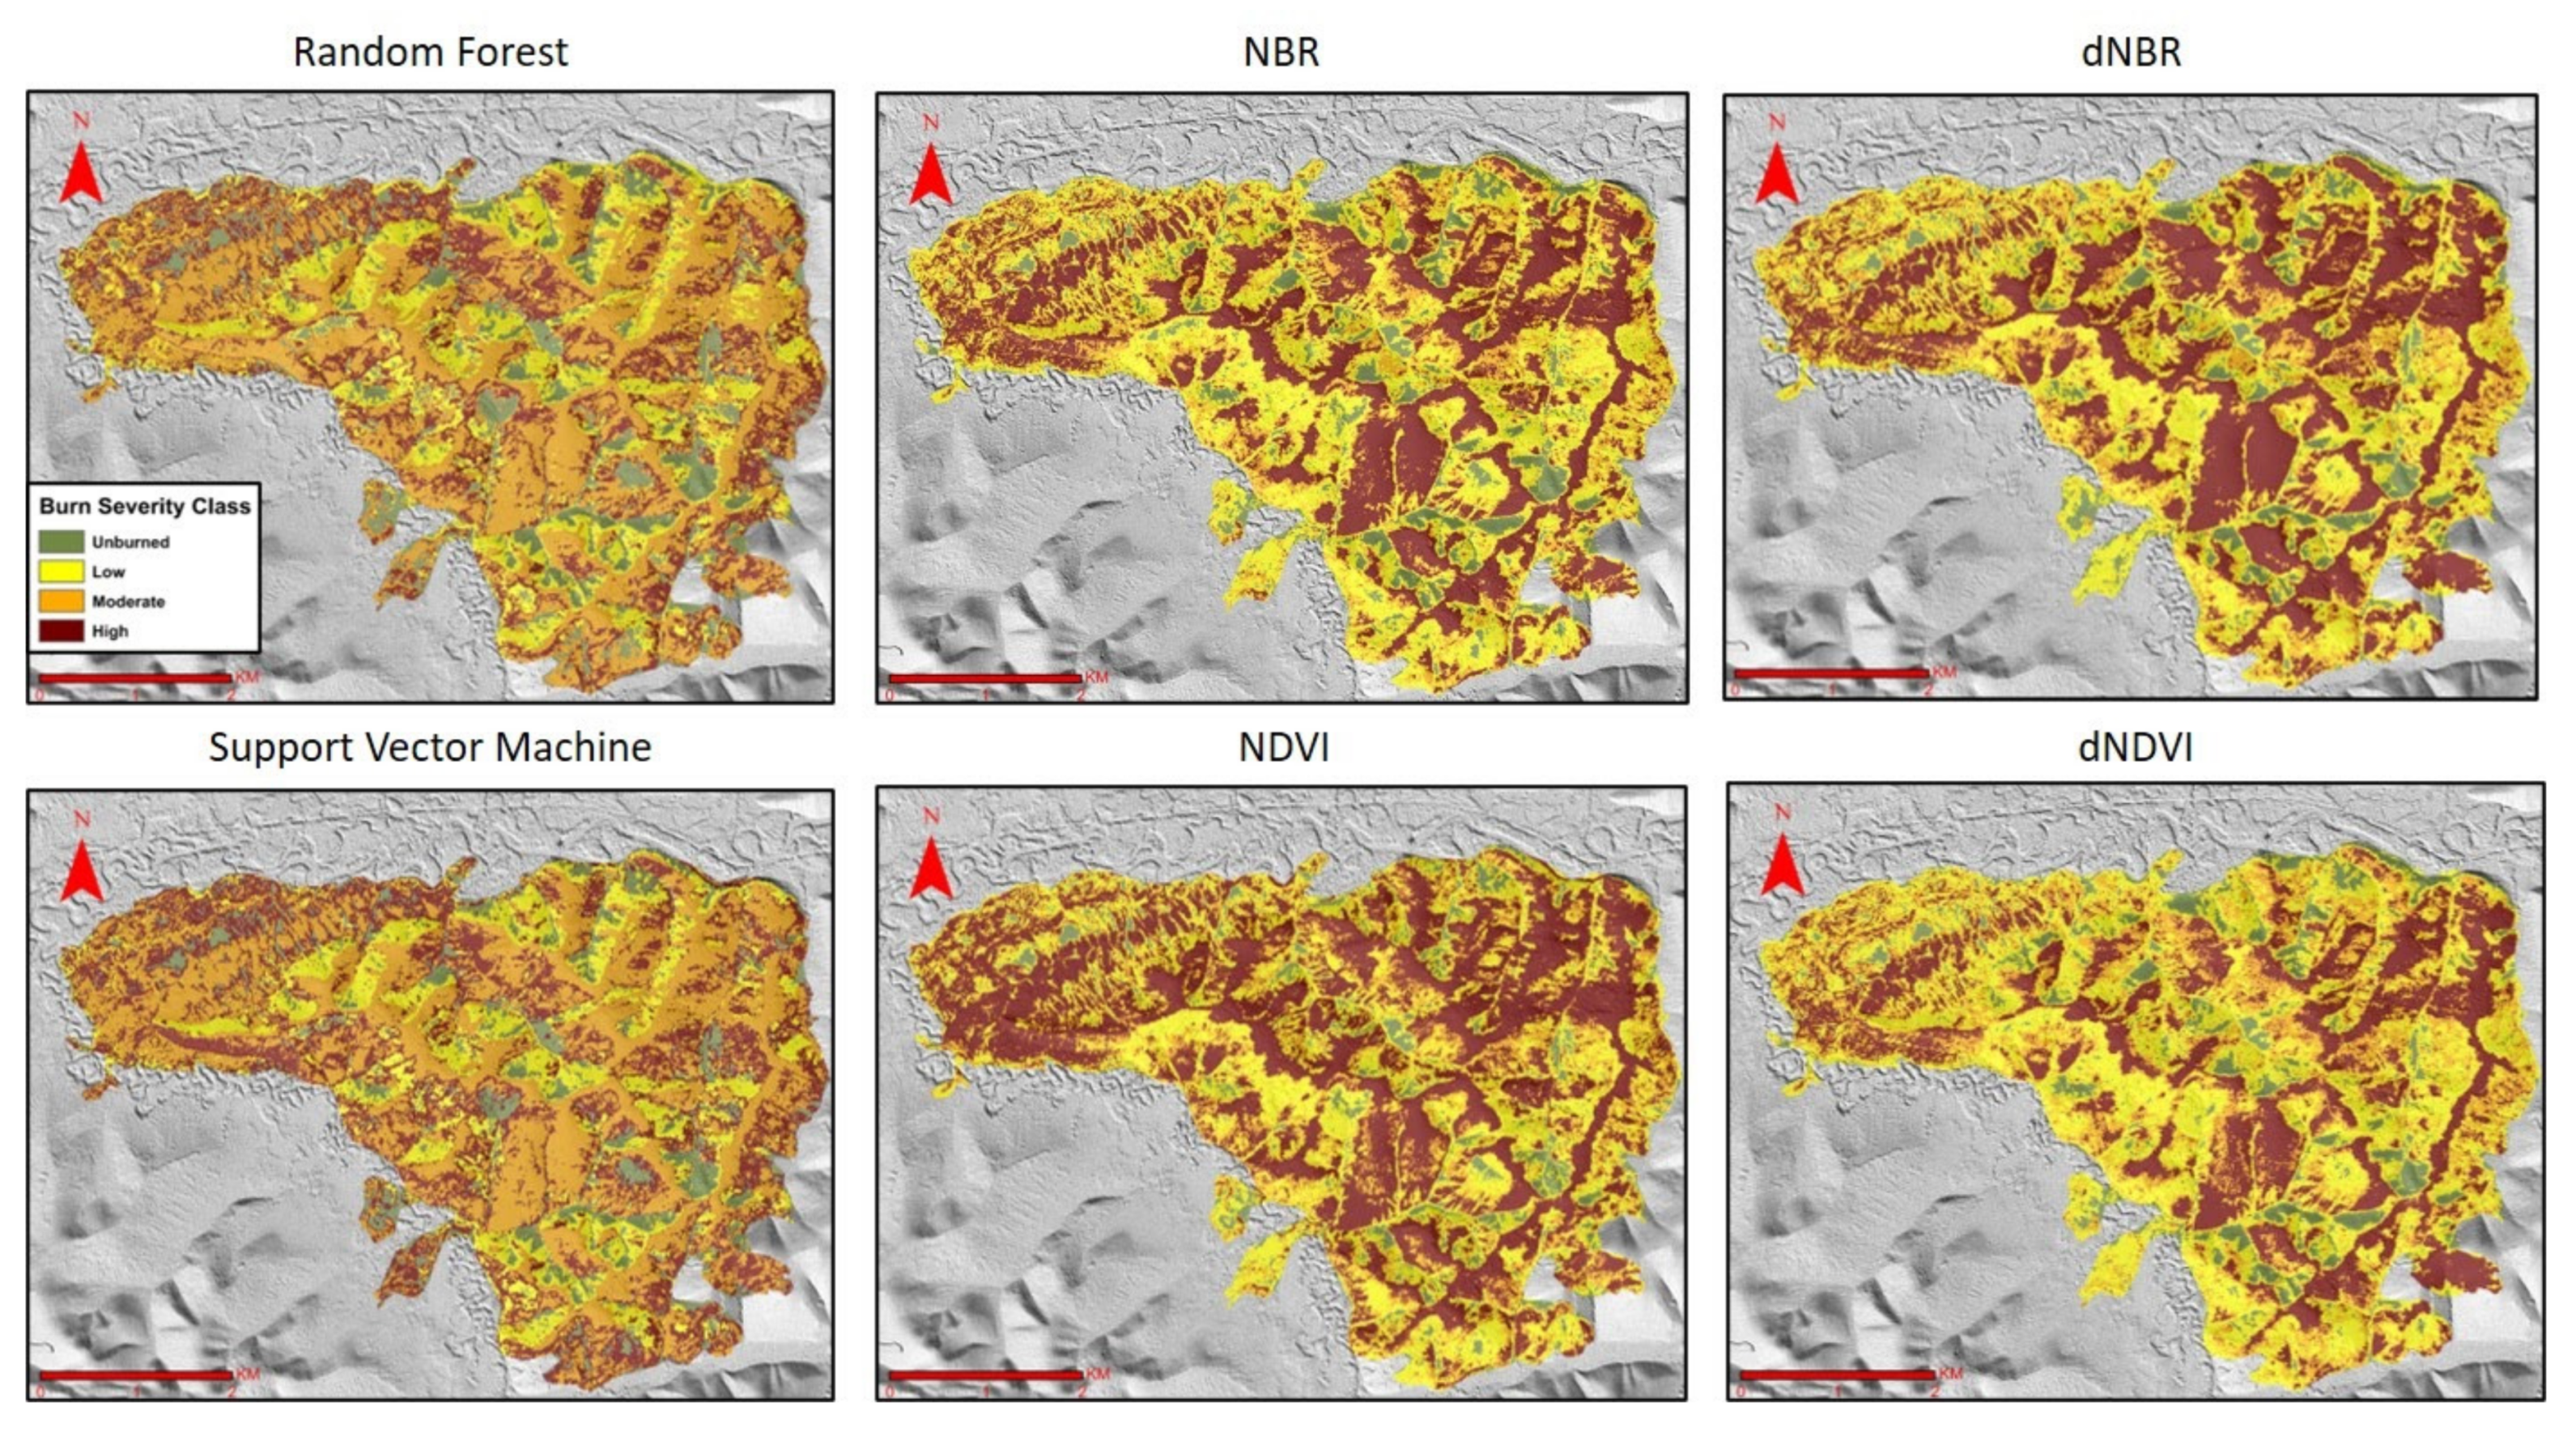
3.1. Nugget Creek Burn Severity Mapping
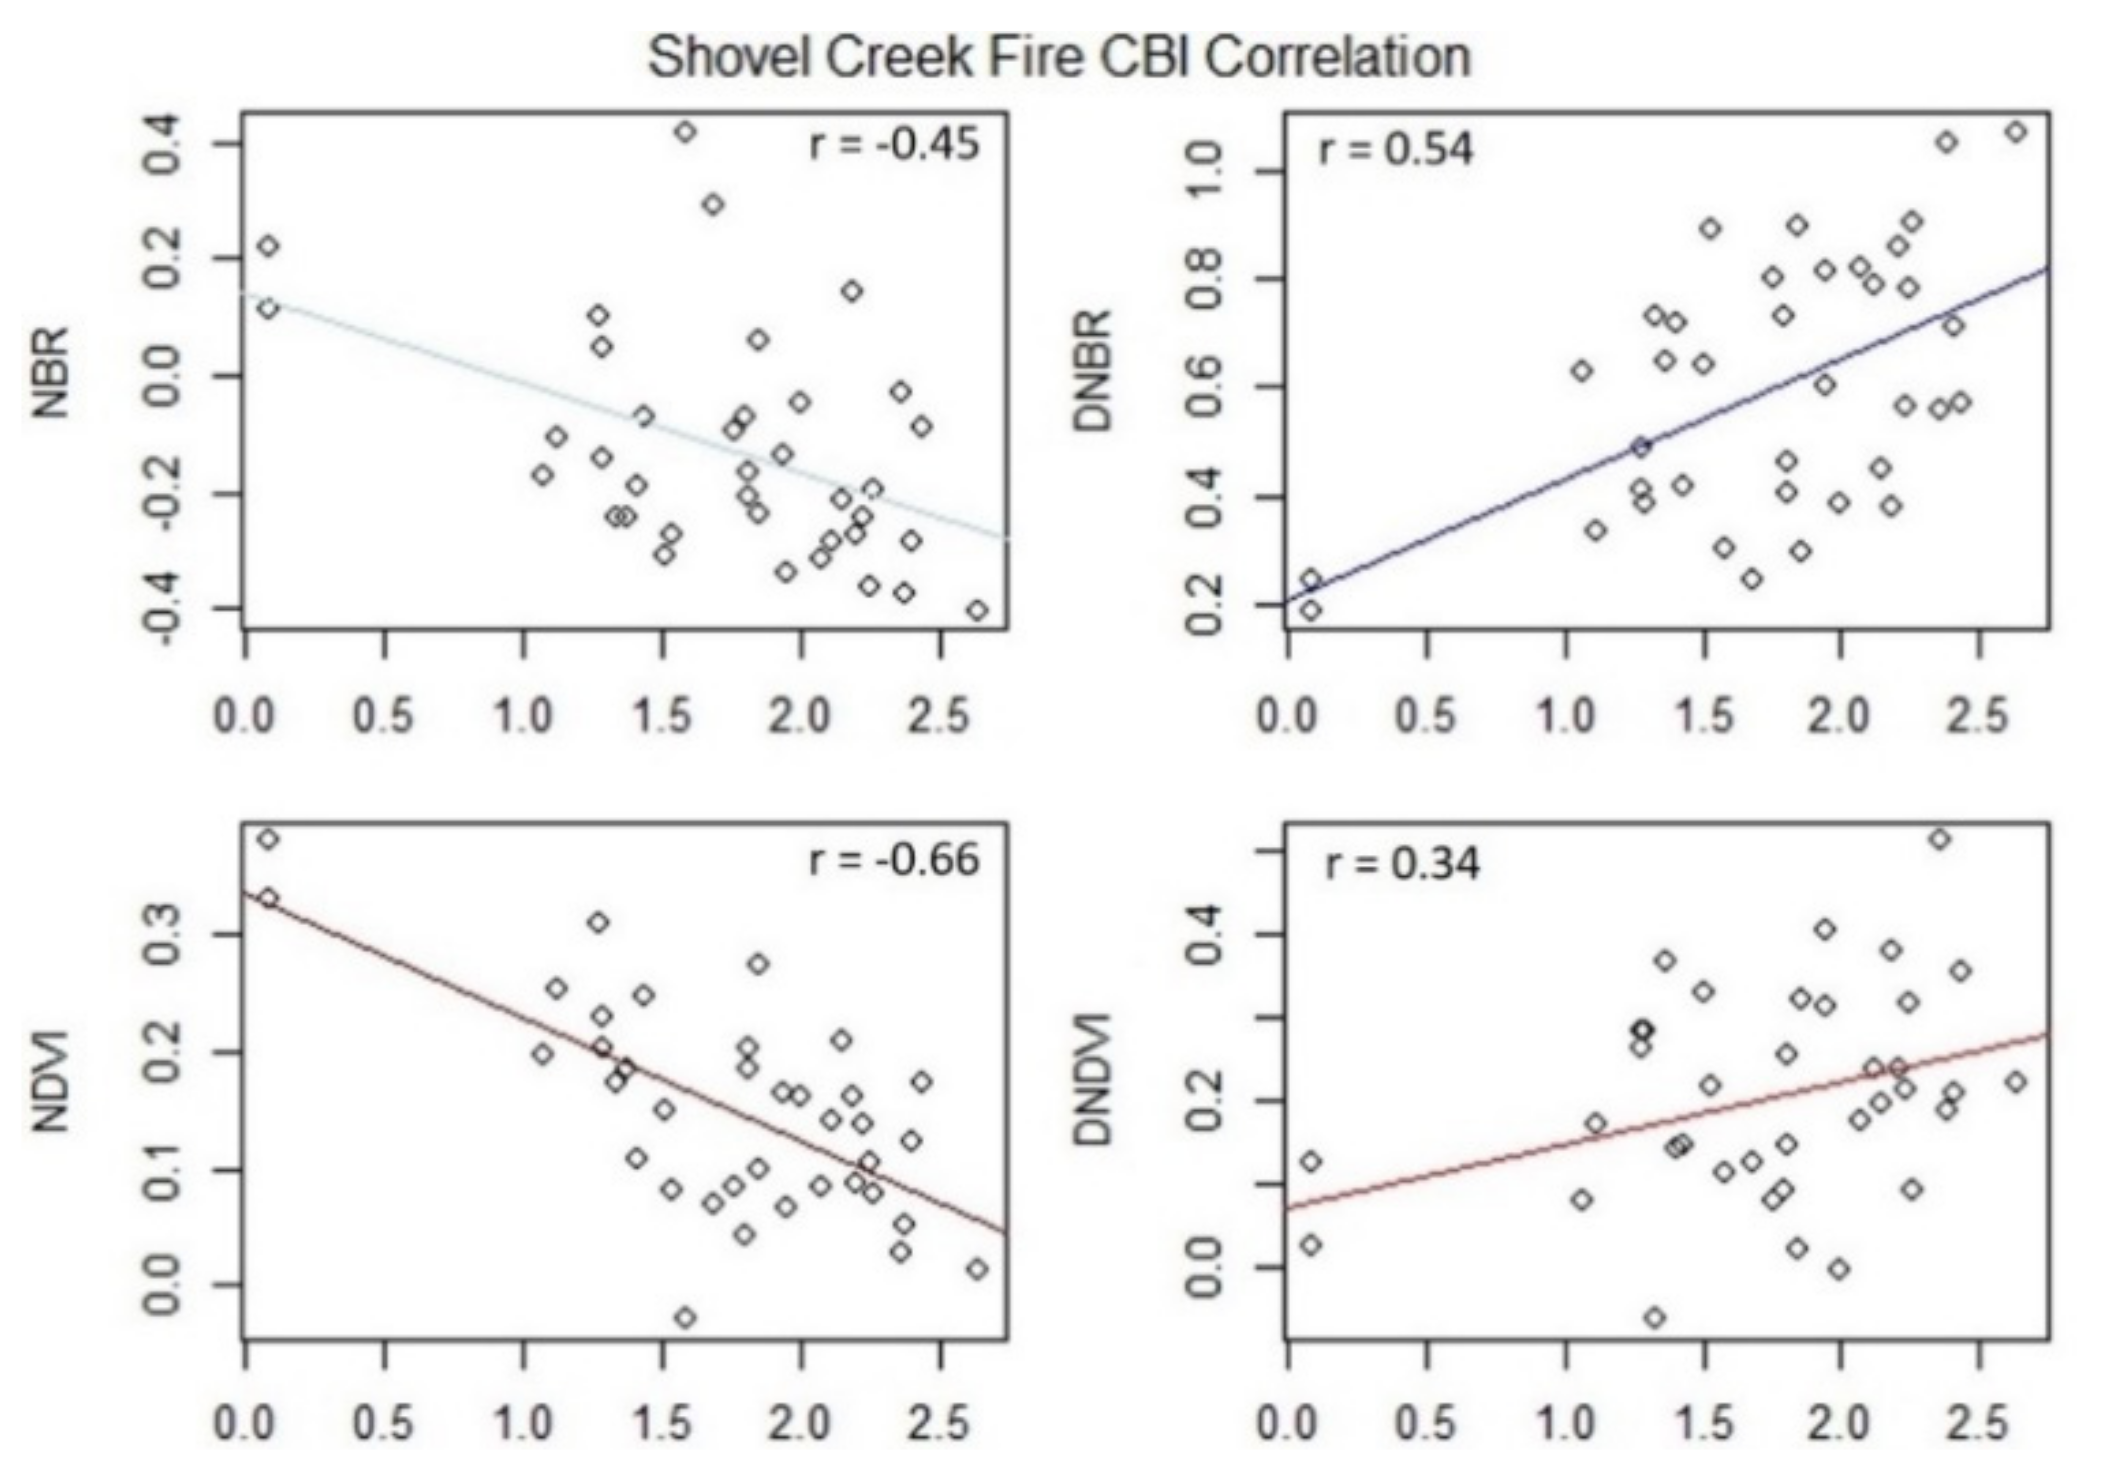
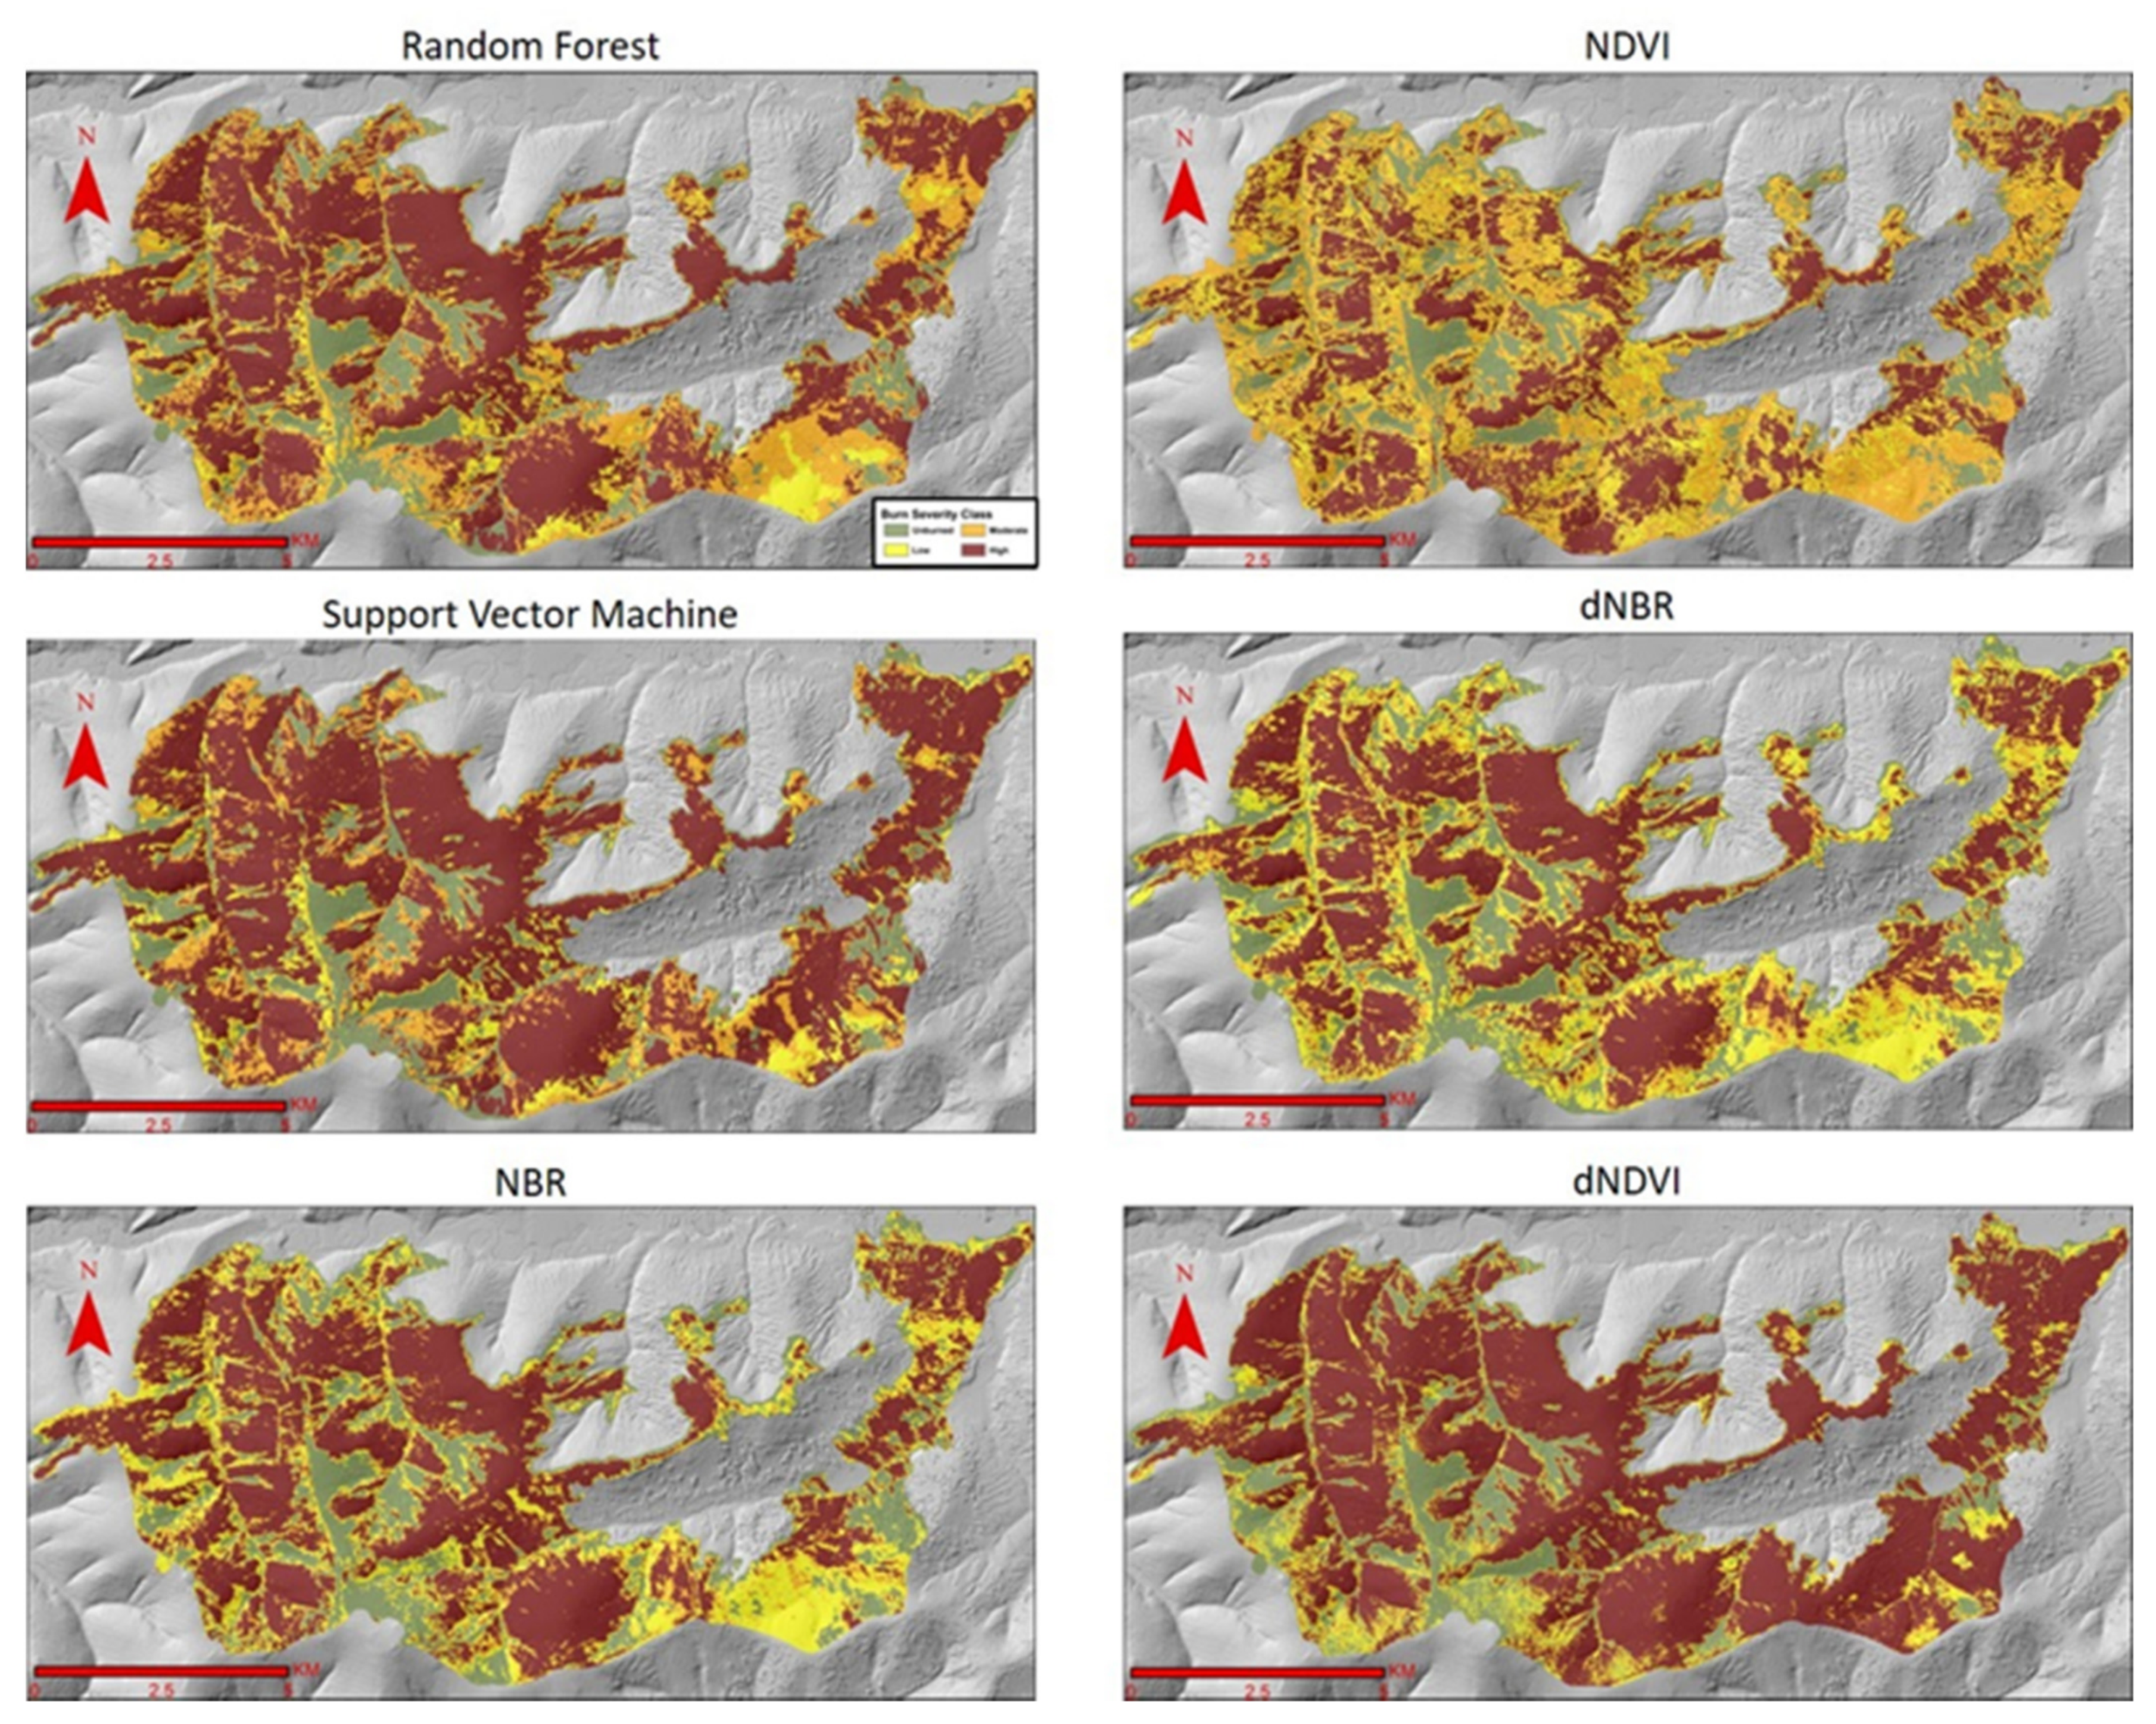
3.2. Shovel Creek Burn Severity Mapping
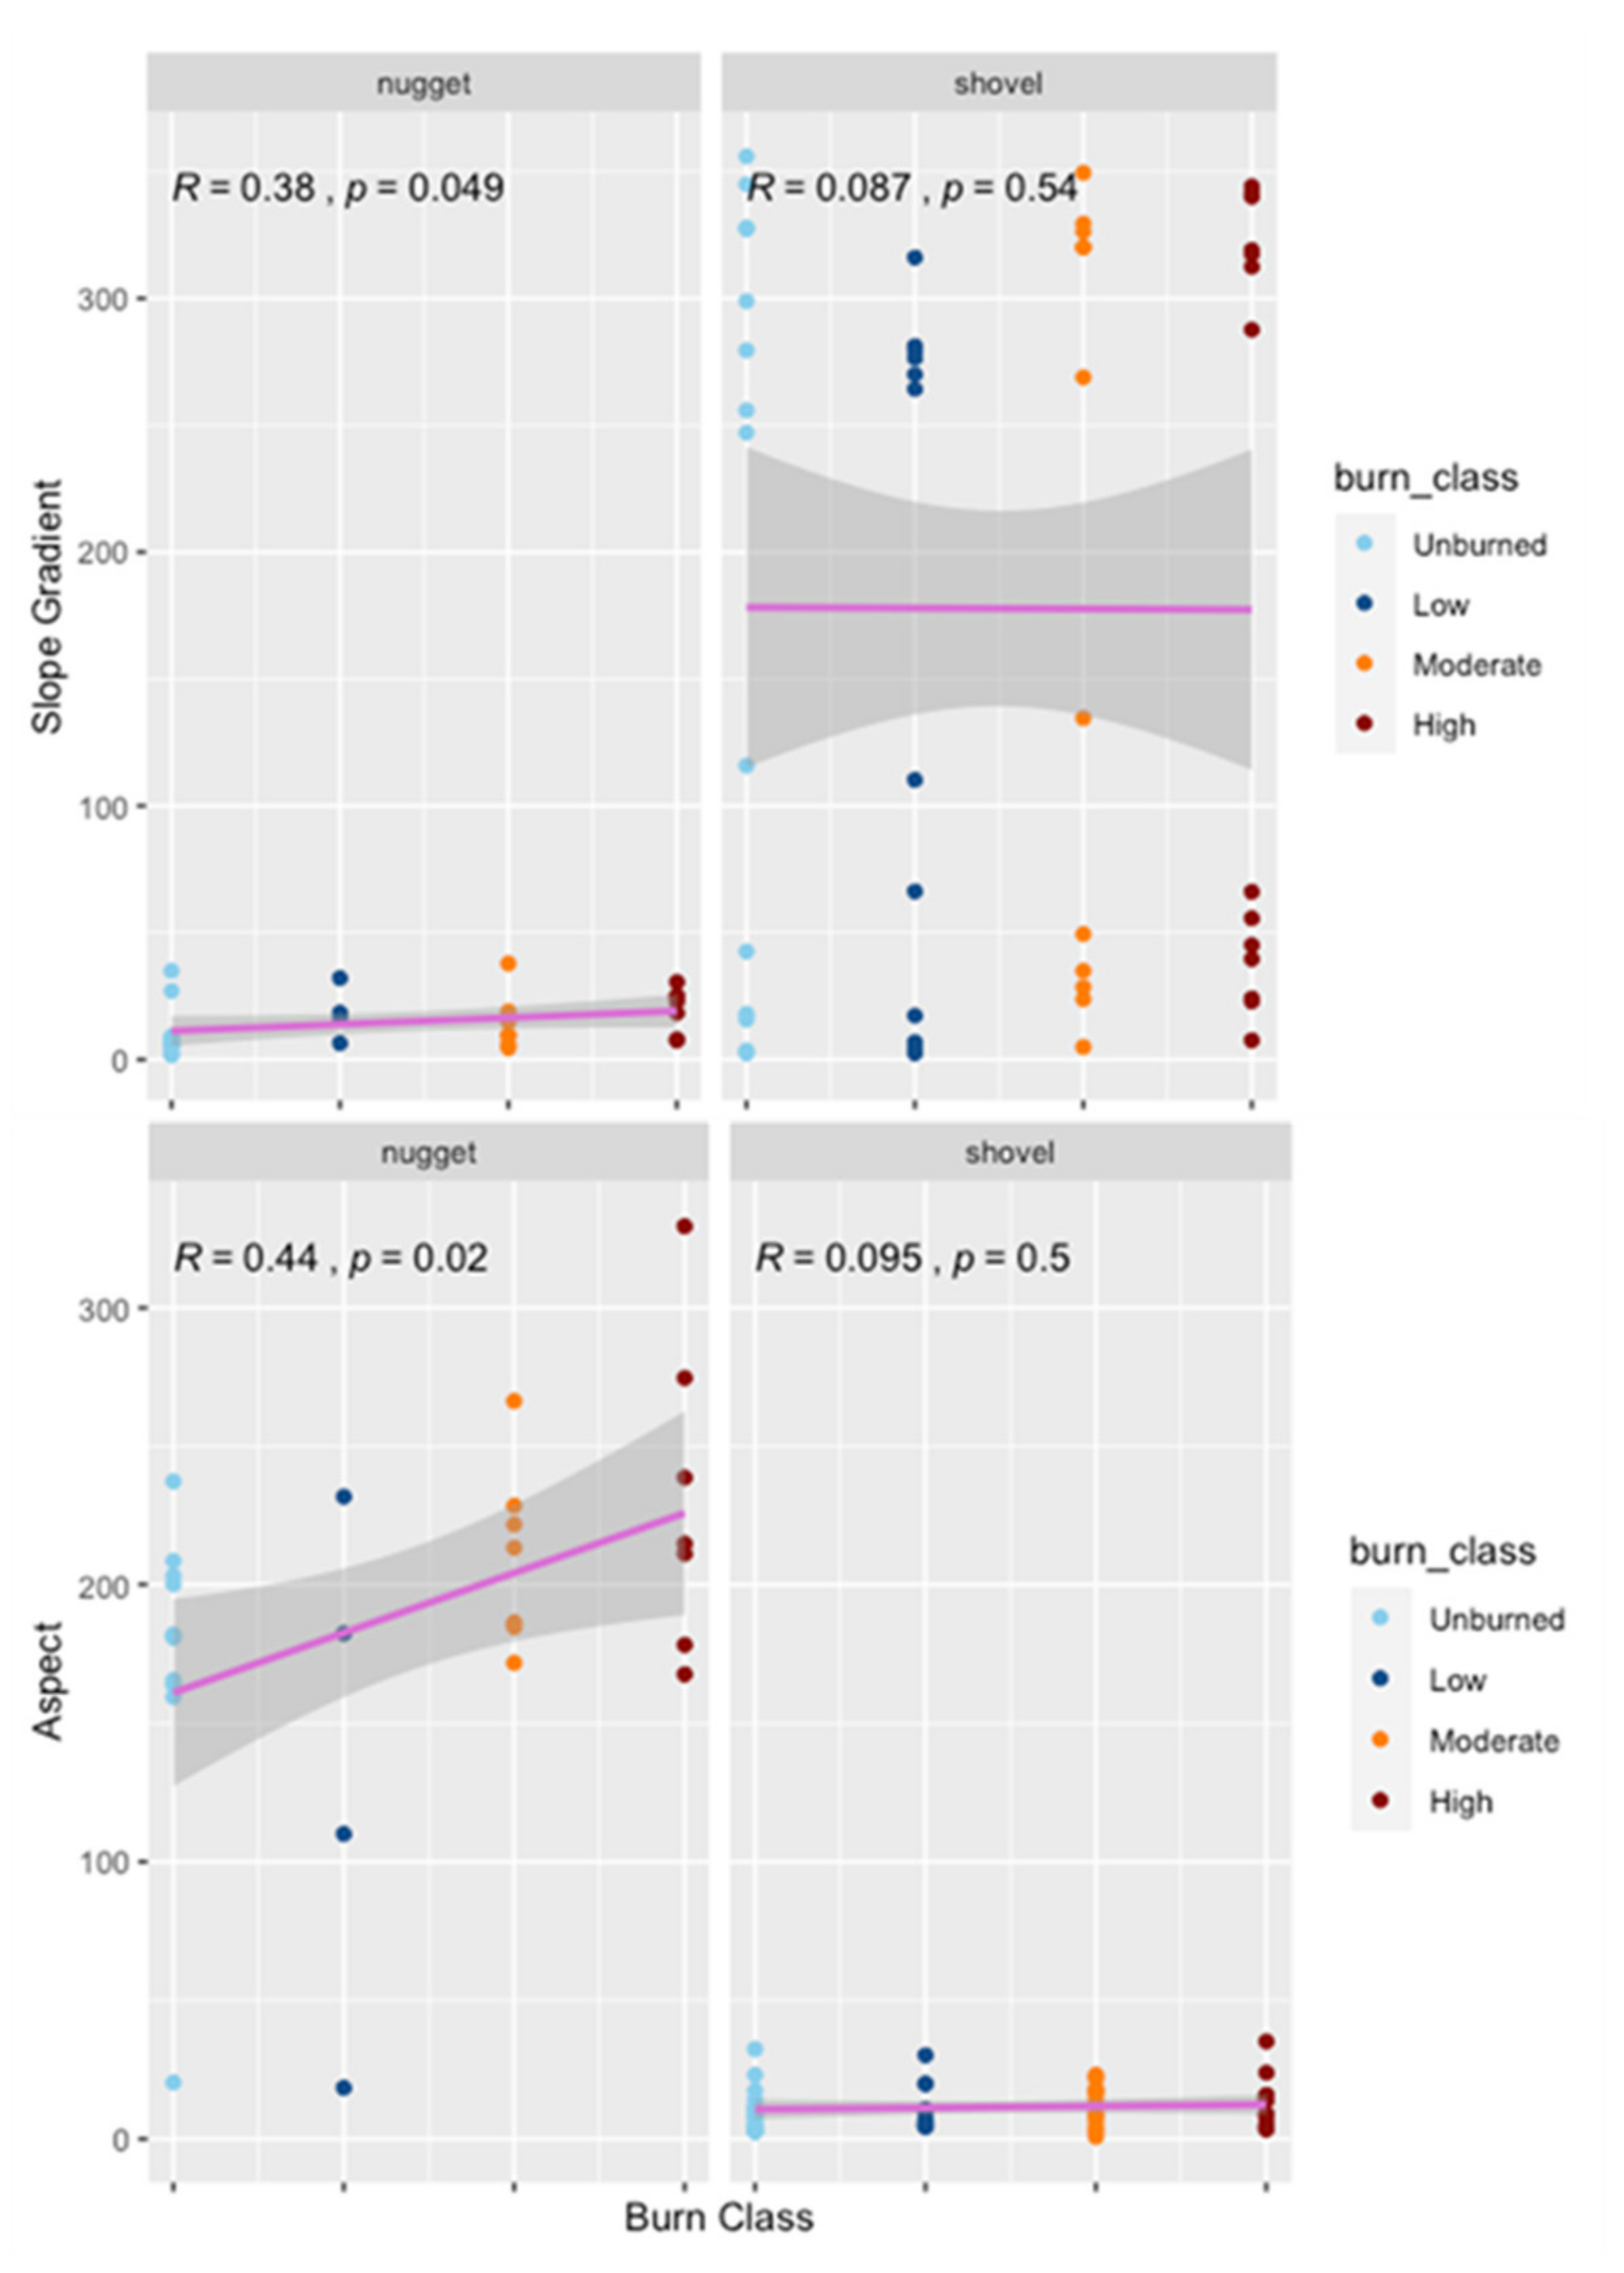
3.3. Burn Severity Relationship to Environmental Factors
4. Discussion
4.1. Burn Severity Mapping
4.2. Burn Severity Relationship to Environmental Factors
5. Conclusions
Supplementary Materials
Author Contributions
Funding
Acknowledgments
Conflicts of Interest
Abbreviation
| ML | Machine Learning |
| CBI | Composite Burn Index |
| RF | Random Forest |
| SVM | Support Vector Machine |
| NDVI | Normalized Difference Vegetation Index |
| WUI | Wildland Urban Interface |
| NBR | Normalized Burn Ratio |
| dNDVI | Differenced Normalized DifferenceVegetation Index |
| dNBR | Differenced Normalized Burn Ratio |
References
- Holland, M.M.; Bitz, C.M. Polar Amplification of Climate Change in Coupled Models. Clim. Dyn. 2003, 21, 221–232. [Google Scholar] [CrossRef]
- Rick, T.; Walsh, J. Alaska’s Changing Environment. International Arctic Research Center. Available online: https://uaf-iarc.org/our-work/alaskas-changing-environment/ (accessed on 25 February 2021).
- Box, J.; Colgan, W.; Christensen, T.R.; Schmidt, N.; Lund, M.; Parmentier, F.-J.; Brown, R.; Bhatt, U.; Euskirchen, E.; Romanovsky, V.; et al. Key Indicators of Arctic Climate Change: 1971–2017. Environ. Res. Lett. 2019, 14, 045010. [Google Scholar] [CrossRef]
- Kasischke, E.S.; Turetsky, M.R. Recent Changes in the Fire Regime across the North American Boreal Region—Spatial and Temporal Patterns of Burning across Canada and Alaska. Geophys. Res. Lett. 2006, 33. [Google Scholar] [CrossRef]
- Kelly, R.; Chipman, M.L.; Higuera, P.E.; Stefanova, I.; Brubaker, L.B.; Hu, F.S. Recent Burning of Boreal Forests Exceeds Fire Regime Limits of the Past 10,000 Years. Proc. Natl. Acad. Sci. USA 2013, 110, 13055–13060. [Google Scholar] [CrossRef] [PubMed]
- York, A.; Bhatt, U.S.; Gargulinski, E.; Grabinski, Z.; Jain, P.; Soja, A.; Thoman, R.L.; Ziel, R. Wildland Fire in High Northern Latitudes Arctic Report Card 2020; Thoman, R.L., Richter-Menge, J., Druckenmiller, M.L., Eds.; NOAA: Washington, DC, USA, 2020. [Google Scholar] [CrossRef]
- Bureau of Land Management. Alaska Fire History Points. Alaska Wildland Fire Coordination Group & Alaska Interagency Coordination Center, 2021. Available online: https://fire.ak.blm.gov/content/maps/aicc/Metadata/Metadata/Zipped%20file%20geodatabases/AlaskaFireHistory_Points_metadata.xml (accessed on 8 April 2021).
- Bhatt, U.S.; Lader, R.T.; Walsh, J.E.; Bieniek, P.A.; Thoman, R.; Berman, M.; Borries-Strigle, C.; Bulock, K.; Chriest, J.; Hahn, M.; et al. Emerging Anthropogenic Influences on the Southcentral Alaska Temperature and Precipitation Extremes and Related Fires in 2019. Land 2021, 10, 82. [Google Scholar] [CrossRef]
- Molina, A.C. Wildfire in Alaska: The Economic Role of Fuel Treatments and Homeowner Preferences in the Wildland Urban Interface. Ph.D. Dissertation, University of Alaska, Fairbanks, AK, USA, 2019. Available online: https://scholarworks.alaska.edu/bitstream/handle/11122/10633/Molina_A_2019.pdf?sequence=1 (accessed on 17 May 2021).
- Centers for Disease Control and Prevention. Protect Yourself from Wildfire Smoke. Available online: www.cdc.gov/features/wildfires/index.html (accessed on 5 August 2019).
- Schuur, E.A.G.; McGuire, A.D.; Schädel, C.; Grosse, G.; Harden, J.W.; Hayes, D.J.; Hugelius, G.; Koven, C.D.; Kuhry, P.; Lawrence, D.M.; et al. Climate Change and the Permafrost Carbon Feedback. Nature 2015, 520, 171–179. [Google Scholar] [CrossRef] [PubMed]
- Bieniek, P.A.; Bhatt, U.S.; York, A.; Walsh, J.E.; Lader, R.; Strader, H.; Ziel, R.; Jandt, R.R.; Thoman, R.L. Lightning Variability in Dynamically Downscaled Simulations of Alaska’s Present and Future Summer Climate. J. Appl. Meteorol. Climatol. 2020, 59, 1139–1152. [Google Scholar] [CrossRef]
- Veraverbeke, S.; Rogers, B.M.; Goulden, M.L.; Jandt, R.R.; Miller, C.E.; Wiggins, E.B.; Randerson, J.T. Lightning as a Major Driver of Recent Large Fire Years in North American Boreal Forests. Nat. Clim. Chang. 2017, 7, 529–534. [Google Scholar] [CrossRef]
- Parks, S.A.; Holsinger, L.M.; Panunto, M.H.; Jolly, W.M.; Dobrowski, S.Z.; Dillon, G.K. High-Severity Fire: Evaluating Its Key Drivers and Mapping Its Probability across Western US Forests. Environ. Res. Lett. 2018, 13, 044037. [Google Scholar] [CrossRef]
- Roberts, D.A.; Dennison, P.E.; Gardner, M.E.; Hetzel, Y.; Ustin, S.L.; Lee, C.T. Evaluation of the potential of Hyperion for fire danger assessment by comparison to the Airborne Visible/Infrared Imaging Spectroradiometer. IEEE Trans. Geosci. Remote Sens. 2003, 40, 1297–1310. [Google Scholar] [CrossRef]
- Chuvieco, E.; Riaño, D.; Danson, F.M.; Martin, P. Use of a Radiative Transfer Model to Simulate the Postfire Spectral Response to Burn Severity. J. Geophys. Res. Biogeosci. 2006, 111. [Google Scholar] [CrossRef]
- De Santis, A.; Chuvieco, E. Burn Severity Estimation from Remotely Sensed Data: Performance of Simulation versus Empirical Models. Remote Sens. Environ. 2007, 108, 422–435. [Google Scholar] [CrossRef]
- He, Y.; Chen, G.; De Santis, A.; Roberts, D.A.; Zhou, Y.; Meentemeyer, R.K. A Disturbance Weighting Analysis Model (DWAM) for Mapping Wildfire Burn Severity in the Presence of Forest Disease. Remote Sens. Environ. 2019, 221, 108–121. [Google Scholar] [CrossRef]
- Fernandez-Manso, O.; Quintano, C.; Fernandez-Manso, A. Combining spectral mixture analysis and object-based classification for fire severity mapping. For. Syst. 2009, 18, 296–313. [Google Scholar] [CrossRef]
- Quintano, C.; Fernandez-Manso, A.; Roberts, D.A. Multiple endmember spectral mixture analysis (MESMA) to map burn severity levels from Landsat image in Mediterranean countries. Remote Sens. Environ. 2013, 136, 76–88. [Google Scholar] [CrossRef]
- Veraverbeke, S.; Hook, S.J. Evaluating spectral indices and spectral mixture analysis for assessing fire severity, combustion completeness and carbon emission. Int. J. Wildland Fire 2013, 22, 707. [Google Scholar] [CrossRef]
- Veraverbeke, S.; Stravos, E.N.; Hook, S.J. Assessing fire severity using imaging spectroscopy data from the airborne visible/infrared imaging spectrometer (AVIRIS) and comparison with multispectral capabilities. Remote Sens. Environ. 2014, 154, 153–163. [Google Scholar] [CrossRef]
- Veraverbeke, S.; Dennison, P.; Gitas, I.; Hulley, G.; Kalashnikova, O.; Katagis, T.; Kuai, L.; Meng, R.; Roberts, D.; Stravos, E.N. Hyperspectral remote sensing of fire: State-of-the-art and future perspectives. Remote Sens. Environ. 2018, 216, 105–121. [Google Scholar] [CrossRef]
- Boucher, J.; Beaudoin, A.; Hébert, C.; Guindon, L.; Bauce, É. Assessing the Potential of the Differenced Normalized Burn Ratio (DNBR) for Estimating Burn Severity in Eastern Canadian Boreal Forests. Int. J. Wildland Fire 2017, 26, 32–45. [Google Scholar] [CrossRef]
- Mohammad Daniel, M.D.W. Spatio Temporal Distribution of Forest Fire Using Landsat [NDVI] and [NBR]/Mohammad Daniel Wafry Mohd Nazari. Ph.D. Thesis, Universiti Teknologi Mara Perlis, Arau, Malaysia, 2019. [Google Scholar]
- Shin, J.; Seo, W.; Kim, T.; Park, J.; Woo, C. Using UAV Multispectral Images for Classification of Forest Burn Severity—A Case Study of the 2019 Gangneung Forest Fire. Forests 2019, 10, 1025. [Google Scholar] [CrossRef]
- Amos, C.; Petropoulos, G.P.; Ferentinos, K.P. Determining the Use of Sentinel-2A MSI for Wildfire Burning & Severity Detection. Int. J. Remote Sens. 2019, 40, 905–930. [Google Scholar] [CrossRef]
- Key, C.H.; Benson, N. Landscape Assessment: Ground Measure of Severity, the Composite Burn Index; and Remote Sensing of Severity, the Normalized Burn Ratio. In FIREMON: Fire Effects Monitoring and Inventory System; Campbell, D.L., Ed.; Rocky Mountain Research Station, US Forest Service: Fort Collins, CO, USA, 2006. [Google Scholar]
- Parks, S.A.; Holsinger, L.M.; Koontz, M.J.; Collins, L.; Whitman, E.; Parisien, M.-A.; Loehman, R.A.; Barnes, J.L.; Bourdon, J.-F.; Boucher, J.; et al. Giving Ecological Meaning to Satellite-Derived Fire Severity Metrics across North American Forests. Remote Sens. 2019, 11, 1735. [Google Scholar] [CrossRef]
- Chapman, D.S.; Bonn, A.; Kunin, W.E.; Cornell, S.J. Random Forest Characterization of Upland Vegetation and Management Burning from Aerial Imagery. J. Biogeogr. 2010, 37, 37–46. [Google Scholar] [CrossRef]
- Belgiu, M.; Drăguţ, L. Random Forest in Remote Sensing: A Review of Applications and Future Directions. ISPRS J. Photogramm. Remote Sens. 2016, 114, 24–31. [Google Scholar] [CrossRef]
- Prasad, M.A.; Iverson, L.R.; Liaw, A. Newer Classification and Regression Tree Techniques: Bagging and Random Forests for Ecological Prediction. Ecosystems 2006, 9, 181–199. [Google Scholar] [CrossRef]
- Smith, C.W.; Panda, S.K.; Bhatt, U.S.; Meyer, F.J. Improved Boreal Forest Wildfire Fuel Type Mapping in Interior Alaska Using AVIRIS-NG Hyperspectral Data. Remote Sens. 2021, 13, 897. [Google Scholar] [CrossRef]
- Noble, W.S. What Is a Support Vector Machine? Nat. Biotechnol. 2006, 24, 1565–1567. [Google Scholar] [CrossRef] [PubMed]
- Wang, M.; Wan, Y.; Ye, Z.; Lai, X. Remote Sensing Image Classification Based on the Optimal Support Vector Machine and Modified Binary Coded Ant Colony Optimization Algorithm. Inf. Sci. 2017, 402, 50–68. [Google Scholar] [CrossRef]
- Oommen, T.; Misra, D.; Twarakavi, N.K.C.; Prakash, A.; Sahoo, B.; Bandopadhyay, S. An Objective Analysis of Support Vector Machine Based Classification for Remote Sensing. Math. Geosci. 2008, 40, 409–424. [Google Scholar] [CrossRef]
- Mountrakis, G.; Im, J.; Ogole, C. Support Vector Machines in Remote Sensing: A Review. ISPRS J. Photogramm. Remote Sens. 2011, 66, 247–259. [Google Scholar] [CrossRef]
- Thanh Noi, P.; Kappas, M. Comparison of Random Forest, k-Nearest Neighbor, and Support Vector Machine Classifiers for Land Cover Classification Using Sentinel-2 Imagery. Sensors 2018, 18, 18. [Google Scholar] [CrossRef]
- Foody, G.M.; Mathur, A. The Use of Small Training Sets Containing Mixed Pixels for Accurate Hard Image Classification: Training on Mixed Spectral Responses for Classification by a SVM. Remote Sens. Environ. 2006, 103, 179–189. [Google Scholar] [CrossRef]
- United States Department of Agriculture. Shovel Creek Fire. Shovel Creek Fire Information—InciWeb the Incident Information System, 25 November 2020. Available online: https://inciweb.nwcg.gov/incident/6400/ (accessed on 17 May 2021).
- United States Department of Agriculture. Nugget Creek Fire. Nugget Creek Fire Information—InciWeb the Incident Information System, 25 November 2020. Available online: https://inciweb.nwcg.gov/incident/6401/ (accessed on 17 May 2021).
- Alaska Interagency Coordination Center. Shovel Creek Incident Status Summary (ICS-209); Alaska Interagency Coordination Center: Fairbanks, AK, USA, 2019.
- Alaska Interagency Coordination Center. Nugget Creek Incident Status Summary (ICS-209); Alaska Interagency Coordination Center: Fairbanks, AK, USA, 2019.
- Barnes, J.L.; McMillan, J.S.; Hrobak, J. NPS Alaska Fire and Fuels Circular Plot Monitoring Protocol, Version 1.0. 47. National Park Service: Fairbanks, Alaska, 2020. Available online: https://irma.nps.gov/DataStore/DownloadFile/637331 (accessed on 17 May 2021).
- Escuin, S.; Navarro, R.; Fernández, P. Fire Severity Assessment by Using NBR (Normalized Burn Ratio) and NDVI (Normalized Difference Vegetation Index) Derived from LANDSAT TM/ETM Images. Int. J. Remote Sens. 2008, 29, 1053–1073. [Google Scholar] [CrossRef]
- Storey, J.; Roy, D.P.; Masek, J.; Gascon, F.; Dwyer, J.; Choate, M. A Note on the Temporary Misregistration of Landsat-8 Operational Land Imager (OLI) and Sentinel-2 Multi Spectral Instrument (MSI) Imagery. Remote Sens. Environ. 2016, 186, 121–122. [Google Scholar] [CrossRef]
- Stumpf, A.; Michéa, D.; Malet, J.-P. Improved Co-Registration of Sentinel-2 and Landsat-8 Imagery for Earth Surface Motion Measurements. Remote Sens. 2018, 10, 160. [Google Scholar] [CrossRef]
- Rana, V.K.; Suryanarayana, T.M.V. Performance Evaluation of MLE, RF and SVM Classification Algorithms for Watershed Scale Land Use/Land Cover Mapping Using Sentinel 2 Bands. Remote Sens. Appl. Soc. Environ. 2020, 19, 100351. [Google Scholar] [CrossRef]
- ESRI. ArcGIS Desktop: Release 10; Environmental Systems Research Institute: Redlands, CA, USA, 2019; Available online: https://desktop.arcgis.com/en/arcmap/latest/tools/spatial-analyst-toolbox/train-support-vector-machine-classifier.htm (accessed on 17 May 2021).
- Alaska Center for Conservation Science. Alaska Vegetation and Wetland Composite|Alaska Conservation Science Catalog. Available online: https://accscatalog.uaa.alaska.edu/dataset/alaska-vegetation-and-wetland-composite (accessed on 2 February 2021).
- Viereck, L.A.; Dyrness, C.T.; Batten, A.R.; Wenzlick, K.J. The Alaska Vegetation Classification. Gen. Tech. Rep. 1992, 286. [Google Scholar] [CrossRef]
- RStudio Team. RStudio: Integrated Development for R; RStudio: Boston, MA, USA, 2020. [Google Scholar]
- Wickham, H. Ggplot2: Elegant Graphics for Data Analysis; Use R! Springer: New York, NY, USA, 2009. [Google Scholar]
- Bigler, C.; Kulakowski, D.; Veblen, T.T. Multiple disturbance interactions and drought influence fire severity in Rocky Mountain subalpine forests. Ecology 2005, 86, 3018–3029. [Google Scholar] [CrossRef]
- Del Pino, J.S.N.; Ruiz-Gallardo, J.R. Modelling post-fire soil erosion hazard using ordinal logistic regression: A case study in South-eastern Spain. Geomorphology 2015, 232, 117–124. [Google Scholar] [CrossRef]
- Aho, K.; Derryberry, D.; Peterson, T. Model selection for ecologists: The worldviews of AIC and BIC. Ecology 2014, 95, 631–636. [Google Scholar] [CrossRef]
- Epting, J.; Verbyla, D.; Sorbel, B. Evaluation of Remotely Sensed Indices for Assessing Burn Severity in Interior Alaska Using Landsat TM and ETM+. Remote Sens. Environ. 2005, 96, 328–339. [Google Scholar] [CrossRef]
- Murphy, K.A.; Reynolds, J.H.; Koltun, J.M. Evaluating the Ability of the Differenced Normalized Burn Ratio (DNBR) to Predict Ecologically Significant Burn Severity in Alaskan Boreal Forests. Int. J. Wildland Fire 2008, 17, 490–499. [Google Scholar] [CrossRef]
- Miller, J.D.; Thode, A.E. Quantifying Burn Severity in a Heterogeneous Landscape with a Relative Version of the Delta Normalized Burn Ratio (DNBR). Remote Sens. Environ. 2007, 109, 66–80. [Google Scholar] [CrossRef]
- Carmo, M.; Moreira, F.; Casimiro, P.; Vaz, P. Land Use and Topography Influences on Wildfire Occurrence in Northern Portugal. Landsc. Urban Plan. 2011, 100, 169–176. [Google Scholar] [CrossRef]
- Cumming, S.G. Forest Type and Wildfire in the Alberta Boreal Mixedwood: What Do Fires Burn? Ecol. Appl. 2001, 11, 97–110. [Google Scholar]
- Fryer, J.L. Fire regimes of Alaskan Black Spruce Communities. In Fire Effects Information System; U.S. Department of Agriculture, Forest Service, Rocky Mountain Research Station, Fire Sciences Laboratory (Producer): Washington, DC, USA, 2014; Available online: www.fs.fed.us/database/feis/fire_regimes/AK_black_spruce/all.html (accessed on 15 March 2021).
- Viereck, L.A.; Dyrness, C.T.; Cleve, K.V.; Foote, M.J. Vegetation, Soils, and Forest Productivity in Selected Forest Types in Interior Alaska. Can. J. For. Res. 2011. [Google Scholar] [CrossRef]
- Chen, G.; He, Y.; De Santis, A.; Li, G.; Cobb, R.; Meentemeyer, R.K. Assessing the impact of emerging forest disease on wildfire using Landsat and KOMPSAT-2 data. Remote Sens. Environ. 2017, 195, 218–229. [Google Scholar] [CrossRef]
- Lee, H.-J.; Choi, Y.E.; Lee, S.-W. Complex Relationships of the Effects of Topographic Characteristics and Susceptible Tree Cover on Burn Severity. Sustainability 2018, 10, 295. [Google Scholar] [CrossRef]


| Shovel Creek Fire | Nugget Creek Fire | |
|---|---|---|
| Unburned CBI = 0 | 14 | 10 |
| Low CBI = 0.010–1.49 | 12 | 4 |
| Moderate CBI = 1.50–1.99 | 12 | 7 |
| High CBI = 2.0–3.0 | 14 | 7 |
| Index | Formula |
|---|---|
| NDVI | (B4-B8)/(B4+B8) |
| NBR | (B8-B12)/(B8+B12) |
| dNDVI | Pre-fire NDVI—Post-fire NDVI |
| dNBR | Pre-fire NBR—Post-fire NBR |
| Product | Nugget Creek | Shovel Creek |
|---|---|---|
| NDVI | 96% | 65% |
| dNBR | 89% | 73% |
| RF | 67% | 83% |
| NBR | 75% | 73% |
| dNDVI | 71% | 60% |
| SVM | 67% | 83% |
| Fuel Type | Shovel Creek Cover (%) | Nugget Creek Cover (%) |
|---|---|---|
| Conifer Forest | 80.085 | 72.728 |
| Mixed Forest | 11.781 | 25.495 |
| Shrub | 4.427 | 1.424 |
| Deciduous Forest | 3.370 | 0.290 |
| Bare | 0.337 | 0.061 |
| Grass | 0 | 0.003 |
| LR | Chisq | Df | Pr (>Chisq) | |
|---|---|---|---|---|
| Aspect | 5.23 | 1 | 0.022 | * |
| Slope Gradient | 0.03 | 1 | 0.87 | |
| Fuel Type | 0.55 | 2 | 0.761 | |
| Site | 4.27 | 1 | 0.039 | * |
| Nugget Creek Fire Percent Area by Severity Class | ||||||
|---|---|---|---|---|---|---|
| RF | SVM | NDVI | NBR | dNDVI | dNBR | |
| Unburned (CBI = 0) | 11% | 11% | 6% | 9% | 9% | 8% |
| Low (CBI = 0.01–1.49) | 22% | 19% | 30% | 35% | 38% | 32% |
| Moderate (CBI = 1.50–1.99) | 43% | 39% | 20% | 20% | 24% | 21% |
| High (CBI = 2–3) | 25% | 32% | 45% | 35% | 29% | 39% |
| Shovel Creek Fire Percent Area by Severity Class | ||||||
|---|---|---|---|---|---|---|
| RF | SVM | NDVI | NBR | dNDVI | dNBR | |
| Unburned (CBI = 0) | 21% | 21% | 18% | 21% | 16% | 21% |
| Low (CBI = 0.01–1.49) | 8% | 8% | 28% | 21% | 13% | 23% |
| Moderate (CBI = 1.50–1.99) | 19% | 13% | 18% | 9% | 5% | 13% |
| High (CBI = 2–3) | 52% | 58% | 35% | 49% | 66% | 43% |
Publisher’s Note: MDPI stays neutral with regard to jurisdictional claims in published maps and institutional affiliations. |
© 2021 by the authors. Licensee MDPI, Basel, Switzerland. This article is an open access article distributed under the terms and conditions of the Creative Commons Attribution (CC BY) license (https://creativecommons.org/licenses/by/4.0/).
Share and Cite
Smith, C.W.; Panda, S.K.; Bhatt, U.S.; Meyer, F.J.; Badola, A.; Hrobak, J.L. Assessing Wildfire Burn Severity and Its Relationship with Environmental Factors: A Case Study in Interior Alaska Boreal Forest. Remote Sens. 2021, 13, 1966. https://doi.org/10.3390/rs13101966
Smith CW, Panda SK, Bhatt US, Meyer FJ, Badola A, Hrobak JL. Assessing Wildfire Burn Severity and Its Relationship with Environmental Factors: A Case Study in Interior Alaska Boreal Forest. Remote Sensing. 2021; 13(10):1966. https://doi.org/10.3390/rs13101966
Chicago/Turabian StyleSmith, Christopher W, Santosh K Panda, Uma S Bhatt, Franz J Meyer, Anushree Badola, and Jennifer L Hrobak. 2021. "Assessing Wildfire Burn Severity and Its Relationship with Environmental Factors: A Case Study in Interior Alaska Boreal Forest" Remote Sensing 13, no. 10: 1966. https://doi.org/10.3390/rs13101966
APA StyleSmith, C. W., Panda, S. K., Bhatt, U. S., Meyer, F. J., Badola, A., & Hrobak, J. L. (2021). Assessing Wildfire Burn Severity and Its Relationship with Environmental Factors: A Case Study in Interior Alaska Boreal Forest. Remote Sensing, 13(10), 1966. https://doi.org/10.3390/rs13101966