Article

Assessing Wildfire Burn Severity and Its Relationship with Environmental Factors: A Case Study in Interior Alaska Boreal Forest

1
Geophysical Institute, University of Alaska Fairbanks, Fairbanks, AK 99775, USA
2
Department of Natural Resources and Environment and Institute of Agriculture, Natural Resources and Extension, University of Alaska Fairbanks, Fairbanks, AK 99775, USA
3
Alaska Satellite Facility, University of Alaska Fairbanks, Fairbanks, AK 99775, USA
4
National Park Service, Alaska Regional Office, Fairbanks, AK 99709, USA
*
Author to whom correspondence should be addressed.
Remote Sens. 2021, 13(10), 1966; https://doi.org/10.3390/rs13101966
Submission received: 10 April 2021 / Revised: 14 May 2021 / Accepted: 17 May 2021 / Published: 18 May 2021
(This article belongs to the Special Issue Satellite Image Processing and Applications)

Abstract

:
In recent years, there have been rapid improvements in both remote sensing methods and satellite image availability that have the potential to massively improve burn severity assessments of the Alaskan boreal forest. In this study, we utilized recent pre- and post-fire Sentinel-2 satellite imagery of the 2019 Nugget Creek and Shovel Creek burn scars located in Interior Alaska to both assess burn severity across the burn scars and test the effectiveness of several remote sensing methods for generating accurate map products: Normalized Difference Vegetation Index (NDVI), Normalized Burn Ratio (NBR), and Random Forest (RF) and Support Vector Machine (SVM) supervised classification. We used 52 Composite Burn Index (CBI) plots from the Shovel Creek burn scar and 28 from the Nugget Creek burn scar for training classifiers and product validation. For the Shovel Creek burn scar, the RF and SVM machine learning (ML) classification methods outperformed the traditional spectral indices that use linear regression to separate burn severity classes (RF and SVM accuracy, 83.33%, versus NBR accuracy, 73.08%). However, for the Nugget Creek burn scar, the NDVI product (accuracy: 96%) outperformed the other indices and ML classifiers. In this study, we demonstrated that when sufficient ground truth data is available, the ML classifiers can be very effective for reliable mapping of burn severity in the Alaskan boreal forest. Since the performance of ML classifiers are dependent on the quantity of ground truth data, when sufficient ground truth data is available, the ML classification methods would be better at assessing burn severity, whereas with limited ground truth data the traditional spectral indices would be better suited. We also looked at the relationship between burn severity, fuel type, and topography (aspect and slope) and found that the relationship is site-dependent.

Graphical Abstract

1. Introduction

The circumpolar north has experienced a temperature change 1.5 times higher than the global average [1,2]. The intensification of global climate change is leading to an increase in frequency, size, severity, and duration of boreal forest fires due to the warming summer temperatures (hot, dry, and windy conditions), earlier snowmelt that lengthens the fire season, and variable precipitation [2,3,4,5,6]. In the past 20 years (2001–2020), wildfires in Alaska burned 30.9 million acres, which is 2.1 times more acres burned than during the previous two decades (1981–2000: 14.6 million acres burned). In 2019, 721 fires burned 2,671,604 acres across the state of Alaska [7]. These fires caused major property damage and placed a significant strain on local and national firefighting resources already spread thin to meet increasing demands. Among these fires, a large number of them were located near major population centers at the Wildland Urban Interface (WUI) [8]. The Shovel Creek and Nugget Creek fires near Fairbanks, Alaska, were two such examples. Smoke resulting from wildfires can have serious health and economic consequences [9]. Unhealthy air quality from the 2019 fires lasted for weeks, prompting health issues such as eye and respiratory irritation along with worsening of chronic heart and lung diseases [10]. These fires not only put human health and safety at risk, but also release CO2 and other greenhouse gases during combustion, creating a positive feedback loop that further contributes to the warming of the climate [11]. Moreover, increases in lightning activity were observed in Alaska between 1985 and 2015 [12], with lightning-caused ignitions increasing in Alaska since 1975 [13]. This combination of rapidly changing environmental conditions that contribute to wildfires necessitates novel studies that advance our understanding of fire severity and post-fire effects. By using satellite data, we can generate products that provide insight for post-fire risk mitigation, forest restoration practices, and adaptive management strategies that all help reduce the long-term impacts of wildfires [2].
The immediate societal impacts of wildland fires can also be reduced with access to accurate vegetation, fuel, and burn severity risk data at a local scale appropriate for decision making. Variation in fire behavior, which is largely driven by fuels, terrain, and weather, leads to various degrees of burn severity across the landscape [14,15]. However, the influence and relative importance of these factors on burn severity are not clear. In this study, we used two recent fires, the 2019 Shovel Creek and Nugget Creek fires, to advance research on burn severity mapping in boreal forests. We hope to better understand the complex relationship between burn severity, fuel type, and terrain along with how fire severity is influenced by environmental characteristics, which will potentially help fire managers identify areas at risk of high-severity fires.
There are two major types of studies used to map burn severity, physical process-based modeling studies and empirical studies. Physical process modeling looks for certain conditions that a fire would have, such as an increase in soil covered by charcoal and an increase in drying and consumption of leaves as burn severity increases [16]. These methods also help identify bands that are sensitive to changes in burn severity [16]. These models are time and cost effective because they do not need field data and can be replicated at other study sites [16,17,18]. However, these models still require field data for product validation [17]. Empirical studies, on the other hand, try to find a correlation between field data and remotely sensed data to map burn severity, and the results are site-dependent [17]. When sufficient field data are available to build a statistically significant empirical model, an empirical modeling approach can be easier to implement for mapping burn severity and yields higher accuracy [17]. Most recently, a number of studies have used Spectral Mixture Analysis (SMA) for mapping burn severity at the sub-pixel level [19,20,21]. SMA can be very effective for severity assessment with the additional advantage that it outputs estimates of the sub-pixel fraction of ground cover classes [22,23].
Remote sensing spectral indices using visible, near-infrared (NIR), and shortwave infrared (SWIR) bands, such as the Normalized Difference Vegetation Index (NDVI), Normalized Burn Ratio (NBR), and differenced (preburn − postburn) indices, have been commonly used to assess burn severity in the boreal forest [24,25,26]. Particularly, NBR has been heavily used due to the SWIR band’s sensitivity in detecting changes within fire disturbances [27]. Ground truth burn severity data in the boreal forest are limited for several reasons. Firstly, many burn scars are remote, making them difficult to access. Secondly, vegetation regrowth occurs quickly, limiting the timeframe in which accurate ground-based data can be collected to about 2 years after a fire event [28]. Fortunately, the two recent fires (Shovel Creek and Nugget Creek) identified for this research occurred close to Fairbanks and are accessible by road (Figure 1). These burn scars offer a unique opportunity to test remote sensing methods for mapping boreal fire burn severity and understanding burn severity’s relationship to environmental factors.
Application of advanced machine learning algorithms, such as Random Forest (RF) and Support Vector Machine (SVM), for mapping and assessing burn severity in the boreal forest has been limited [29]. The RF classifier is a supervised classification algorithm that uses decision trees to classify pixels into classes [30]. It has the ability to effectively process large volume datasets while avoiding overfitting [31], making RF an ideal classifier if a large amount of training data is available. Though only a few studies have used RF to classify burn severity [29], there is a volume of literature demonstrating its efficiency in mapping land cover, making it a good candidate for testing burn severity assessments [30,32,33]. Support Vector Machine (SVM) is another machine learning classifier that learns to label objects into classes using previously provided examples [34]. For remote sensing image classifications, SVM has been demonstrated to be one of the most successful classifiers [35]. SVM is an ideal classifier when training data is limited, runs on datasets with high dimensionality, and has been used previously to generate land cover maps [35,36,37,38]. It uses training sites to find the optimal separating hyperplane between classes [39]. Although RF and SVM have not been heavily used to study burn severity, they both have great potential for this application [29].
The primary goal of this study is to determine which of the aforementioned remote sensing techniques produce the most accurate products for assessing wildfire burn severity in the boreal forest. The secondary goal is to investigate how burn severity relates to fuel type and topography. To address these goals, we collected ground-based data within the Nugget Creek and Shovel Creek burn scars, trained the classifiers using this data, and then validated the performance of the classifiers with accuracy assessments. By performing this investigation of burn severity within the 2019 Nugget Creek and Shovel Creek fires, we hope to identify which remote sensing methods are best for assessing burn severity and to better understand how fuel type and topography influence burn severity.

2. Materials and Methods

2.1. Study Area

The Shovel Creek burn scar is located approximately 20 miles northwest of Fairbanks and was ignited by a lightning strike. The fire started June 21, 2019 and burned 91 km2 [40]. The Nugget Creek burn scar is located 35 miles east of Fairbanks and was also started by a lightning strike on June 21, 2019 and consumed 77 km2 [41]. The suppression cost of the Nugget Creek fire was around USD 56,000 while the suppression cost for the Shovel Creek fire was over USD 25 million [42,43]. The Shovel Creek fire was suppressed more heavily as it threatened life and property in the Murphy Dome community.

2.2. Field Work

During the summer of 2020, we surveyed burn severity within the Nugget Creek and Shovel Creek burn scars following the Composite Burn Index (CBI) protocol modified for Alaska [28,44] (Supplementary Figure S1). CBI is a standard survey protocol used to assess ecological changes following a wildfire [20]. The modified CBI is broken into five different strata, including (a) substrates; (b) herbs, low shrubs, and trees less than 1 m; (c) tall shrubs > 1 m and trees 1 to 2 m; (d) intermediate trees 2–8 m; and (e) big trees > 8 m. Each stratum contains 4–5 variables that assess the amount of change by looking at various factors, such as species mortality, char height, changes to soil and duff layers, changes in species composition, and several other factors that are rated by the surveyor [38,44]. CBI takes the average score of all the factors rated to assign a burn severity value that can range from 0 to 3.0. At Nugget Creek, the CBI values for the fire-disturbed plots ranged from 0.34 to 2.46, and at Shovel Creek the values ranged from 0.09 to 2.38. We used a Trimble R10 RTK GPS to get the precise locations of the field plots (30 m in diameter). The location of the plots surveyed was based on site accessibility and visual interpretation of burn severity from pre- and post-fire images in order to capture the range of severity. At Shovel Creek, we surveyed 52 CBI plots while at the Nugget Creek burn scar, we surveyed 28 CBI plots (Figure 2). We grouped the CBI values into four classes, taking into account the impact of fire on the five strata that were rated as part of the CBI assessment and the spread of the CBI values within the two burn scars: unburned (CBI = 0), low (CBI = 0.01–1.49), moderate (CBI = 1.50–1.99), and high (CBI = 2.0–3.0) (Table 1).

2.3. Burn Severity Mapping from Sentinel-2 Images

Optical satellite images with bands that cover the visible, near-infrared, and shortwave infrared wavelengths are ideal for mapping and assessing burn severity as vegetation and burned areas can be accurately differentiated using these bands [45]. We used Sentinel-2 Level 1-C reflectance satellite imagery, publicly available on the USGS EarthExplorer portal (source: https://earthexplorer.usgs.gov/). The Sentinel-2 bands used in this study had a spatial resolution of 10–20 m. Bands 2, 3, 4, and 8 have a 10-m pixel size while bands 5, 6, 7, 8A, 11, and 12 have a pixel size of 20 m. For the Shovel Creek fire, we used a pre-fire image collected on May 16, 2019 and a post-fire image acquired on May 20, 2020. For the Nugget Creek fire, we used a pre-fire image collected July 24, 2018 and a post-fire image collected May 17, 2020. The pre- and post-fire images were adequate for assessing burn severity because the images were collected in the summer season and the vegetation was in a similar growth stage.
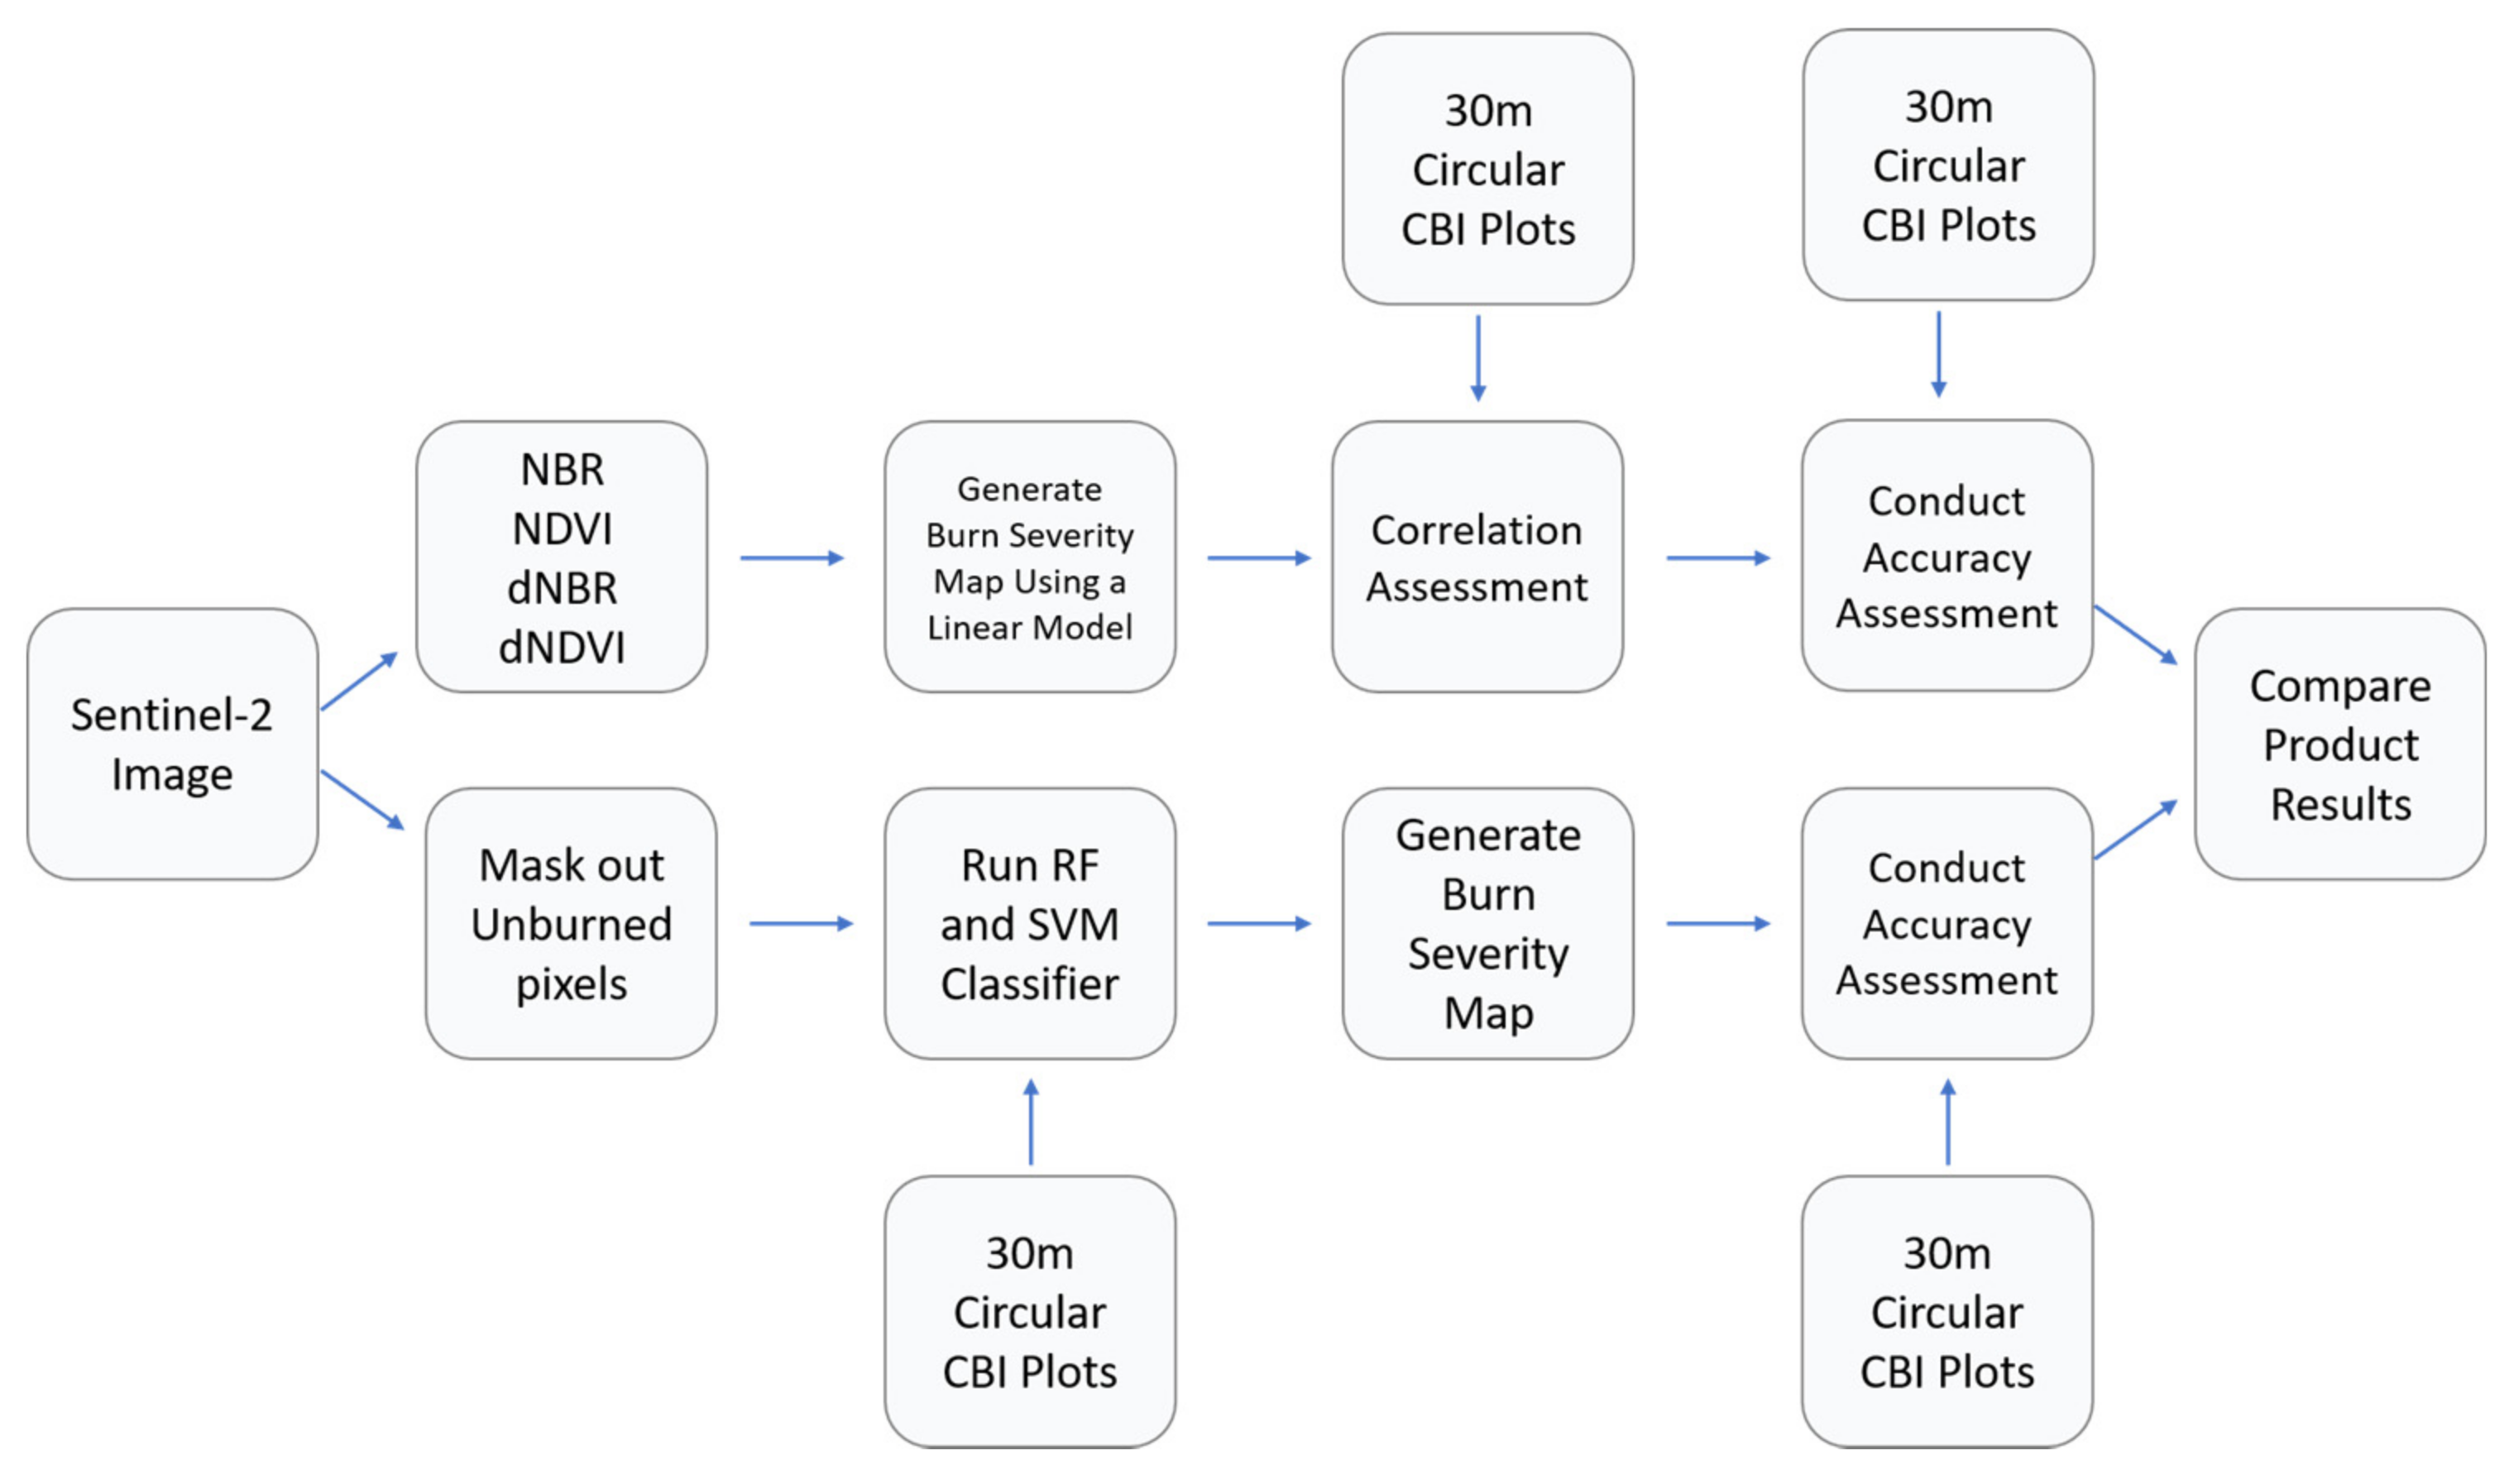
For both burn scars, we generated pre- and post-fire NDVI and NBR maps, as well as differenced NDVI (dNDVI = preNDVI—postNDVI) and differenced NBR (dNBR = preNBR − postNBR) maps (Table 2 and Figure 3). We used linear models to link spectral indices with CBI values. The estimated CBI values were then broken into three burn severity classes: low-severity (CBI: 0.01–1.49), moderate-severity (1.5–1.99), and high-severity (2.0–3.0). We used all the CBI plots to assess the user, producer, and overall accuracy of the spectral indices-based burn severity maps (Nugget Creek: 28 plots; Shovel Creek: 52 plots). The Sentinel-2 sensor is designed to register image products to a global reference image framework that usually has a residual geolocation error. The absolute geolocation performance specification for Sentinel-2 is 12.5 m [46]. We used a Trimble R10 RTK GPS (with mm accuracy) to get the precise locations of field CBI plots (30 m in diameter). In order to account for the location offset between the surveyed CBI plots and image pixel, we used a 20-m buffer around each plot for accuracy assessment [46,47].
For running supervised classifications, we first removed the unburned pixels from the image. In order to mask out unburned pixels, we tested different indices and threshold values by visually inspecting how well they masked out the unburned pixels. The NDVI index with a threshold of 0.4 was most effective for the Nugget Creek burn scar (all 10 unburned CBI plots are correctly identified; Supplementary Table S7) while at the Shovel Creek burn scar the dNBR index with a threshold of 0.24 was the most effective (all 14 unburned CBI plots are correctly identified; Supplementary Table S4). We removed unburned areas to avoid potential misclassification of the low severity class as unburned. Sentinel-2 bands 1, 9, and 10 are mainly used for atmospheric corrections and cirrus-cloud screening and are not useful for land cover classification; therefore, we removed them from the image classification [48]. We used only post-fire images to run the SVM and RF (500 trees, 30 rules per tree) supervised classifications [49]. We used half of the burned CBI plots surveyed at each site (9 at Nugget Creek and 20 at Shovel Creek) to train the classifiers. Each CBI plot that was used for training contained 2–4 pixels. While the remaining half of the CBI plots were used for accuracy assessment. We classified the images into low, moderate, and high burn severity classes based on the CBI values (see values in Table 1). We used the remaining CBI plots (9 at Nugget Creek and 18 at Shovel Creek) with a 20-m buffer (to account for image positional offset) to assess the classification accuracy. For RF classification, we also tested if including elevation, aspect, and slope as dependent variables with the Sentinel-2 bands would improve the overall mapping accuracy. Since it did not, we did not use this mapping technique for downstream analysis, and only reported the results from Sentinel-2 bands products. We reported accuracy as the percent of correctly mapped CBI plots. We used ESRI’s ArcMap 10.7 software for all image processing and analyses.

2.4. Burn Severity Relationship to Environmental Factors

Using the 2019 Alaska Vegetation and Wetland Composite (AVWC) map we calculated the percent area occupied by each level II vegetation class within the Nugget Creek and Shovel Creek burn scars. The AVWC maps vegetation at a scale analogous to level IV of the Alaska Vegetation Classification [50,51]. We analyzed the relationship between vegetation type, topography (aspect and slope), and burn severity. We used a 2 m Arctic Digital Elevation Model (DEM) as a source for generating the slope and aspect maps of the burn scars (source: Polar Geospatial Center, University of Minnesota). We used ESRI’s ArcMap 10.7 [49] software for image processing, and RStudio 1.2.5019 [52] for all statistical analyses. We generated plots visualizing these relationships between environmental variables (slope grade, aspect, and fuel type) and burn severity class using ggplot2 version 3.3.2 [53]. Regression analysis, namely ordinal regression, has been used in previous remote sensing studies to generate predictive models with fire severity using an ordinal scale [54,55]. We used Ordinal Logistic Regressions (OLR) to generate models with burn severity classes as the response, and aspect, slope, burn scar site (Nugget Creek or Shovel Creek), and fuel type as the explanatory variables, using the plor function in the MASS package (version 7.3-51.5). We used a two-way ANOVA test to quantify the effect of each explanatory variable on severity class with a type III sums of squares, which identifies the variables that are significant independently of one another. Lastly, we performed model selection using the Akaike Information Criterion (AIC), which is a common model selection tool used to test the quality of ecological models relative to other models generated using a single dataset [56]. We used AIC to test the statistical significance of the full model (severity class ~ aspect + slope + site + fuel type), and all combinations of the third-, second-, and first-order models. This model selection allowed us to determine which combination of explanatory environmental variables are best at explaining burn severity in our dataset.

3. Results

3.1. Nugget Creek Burn Severity Mapping

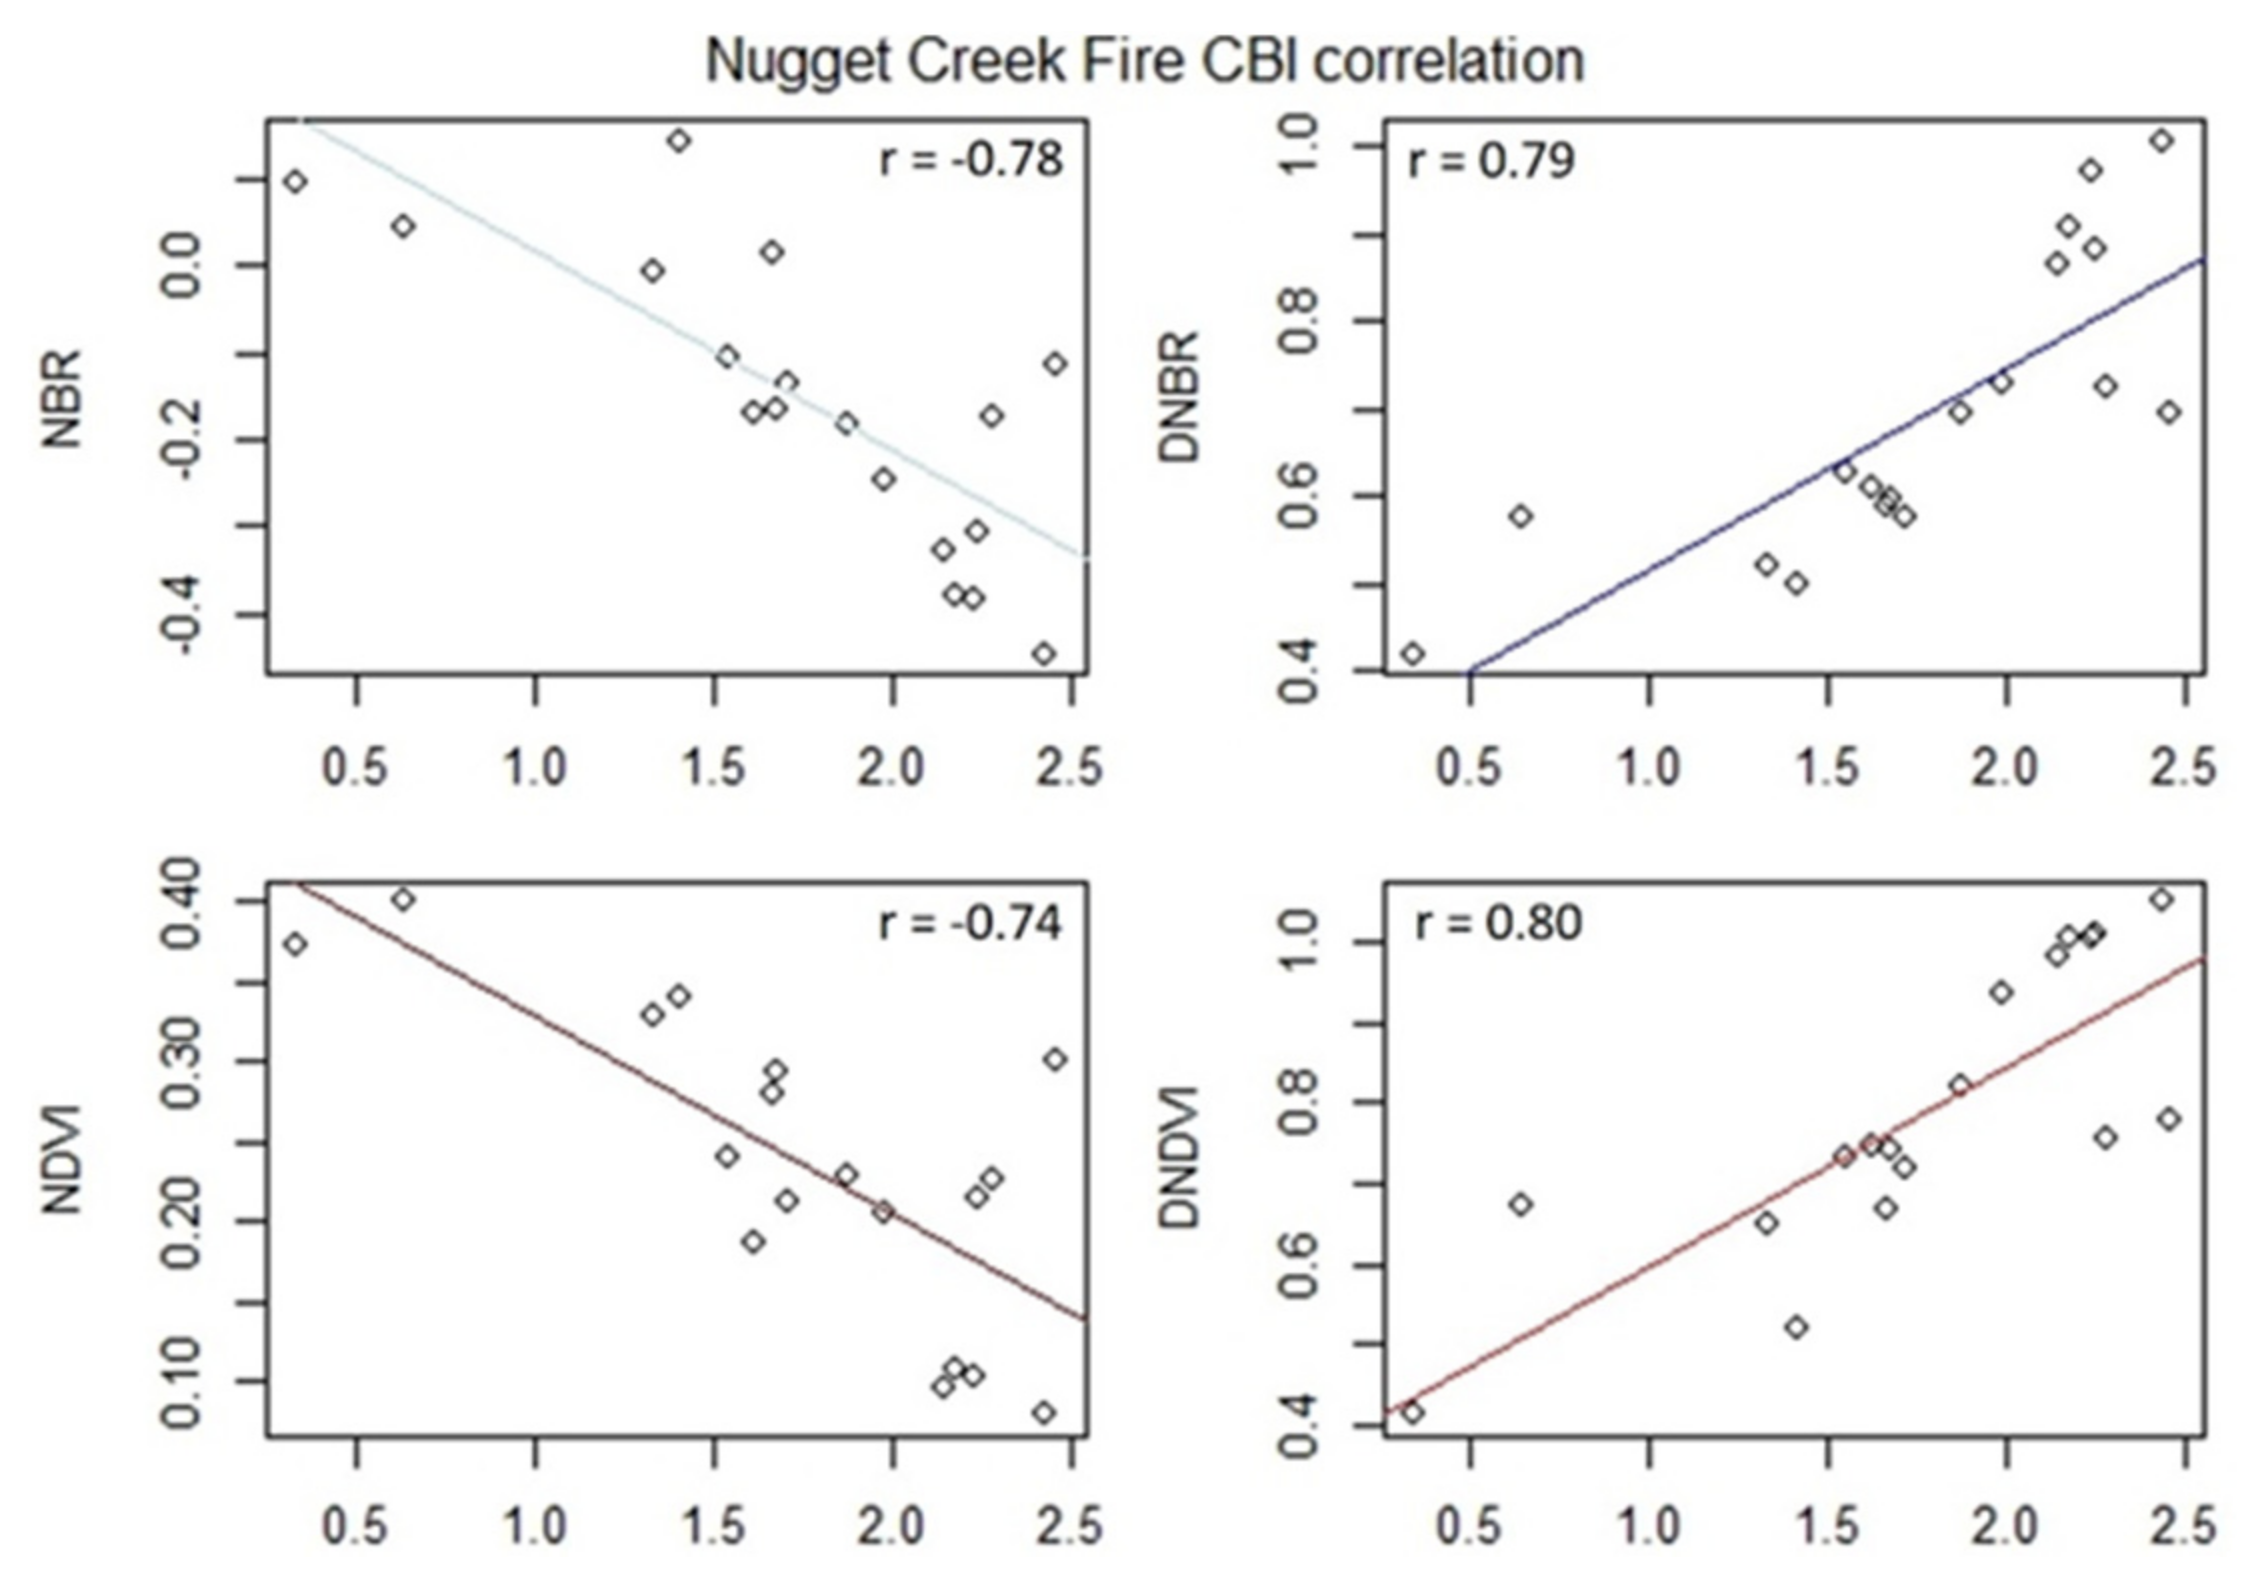
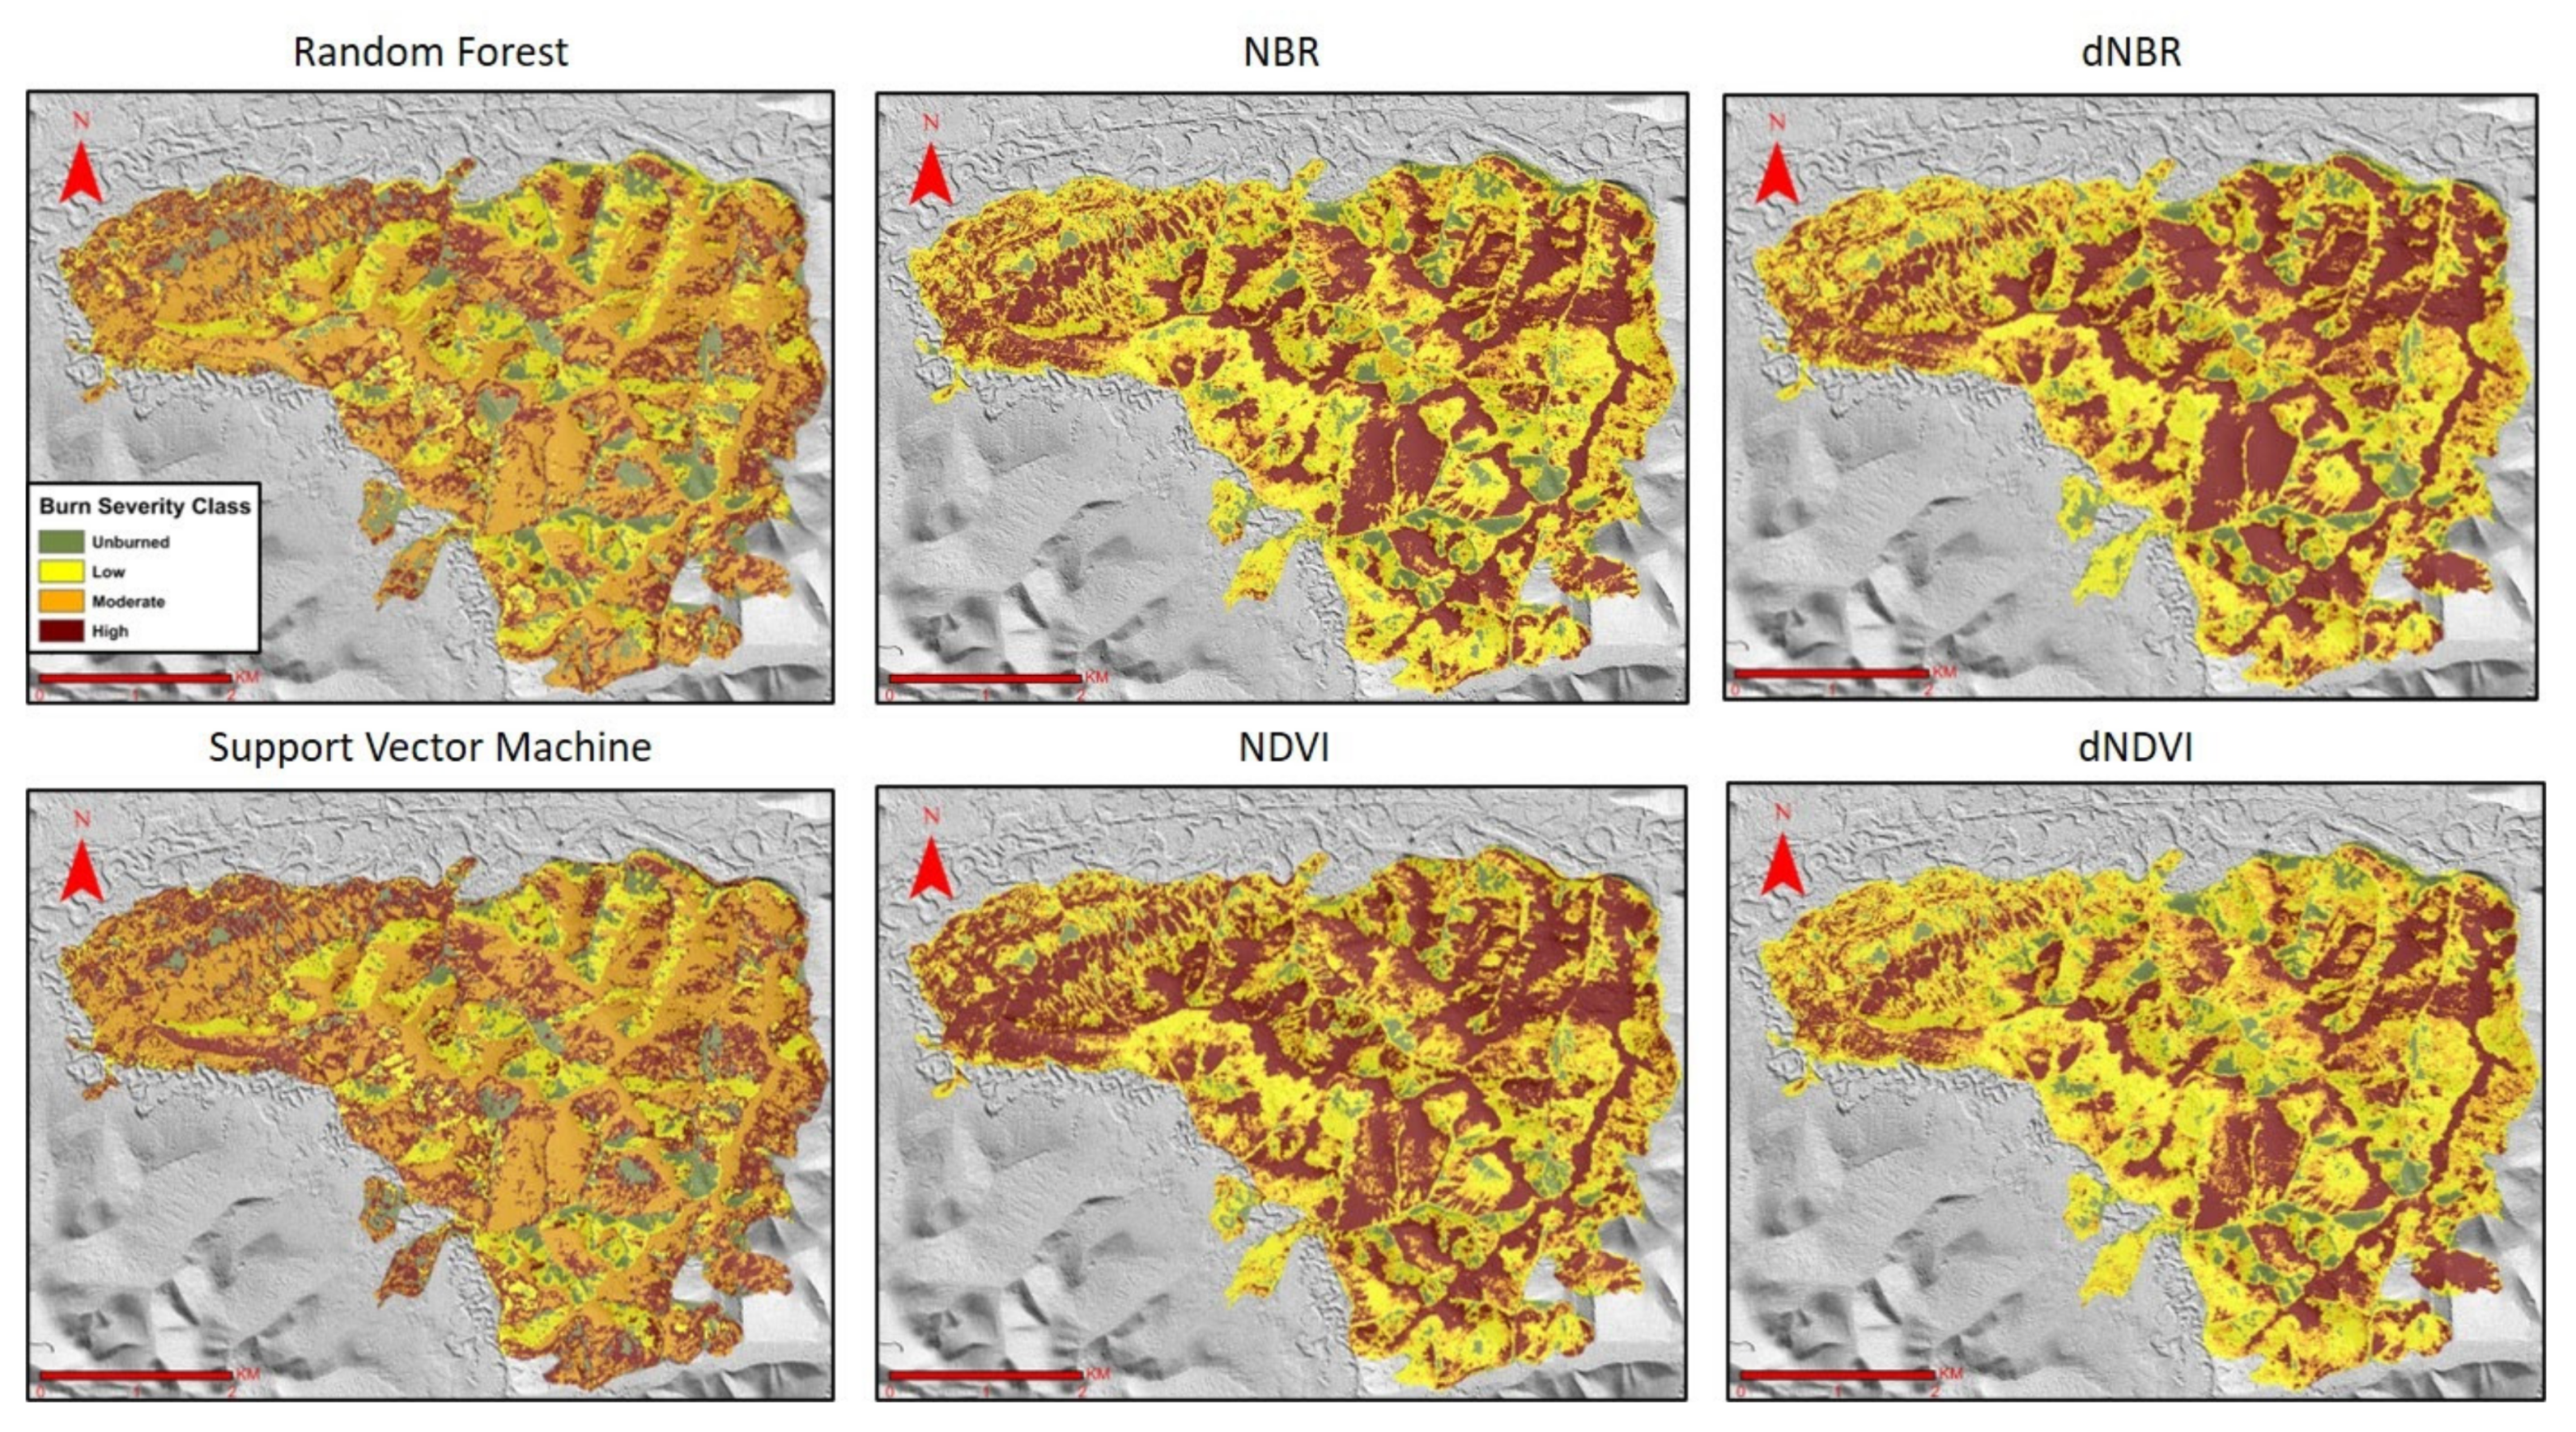
At Nugget Creek, all of the indices (NDVI, NBR, dNDVI, and dNBR) had a high correlation to CBI (|r| > 0.75), with dNDVI having the highest (|r| = 0.80) and NDVI the lowest (|r| = 0.75) (Figure 4). Linear models produced for each index indicated a significant relationship between the respective indices and CBI (p < 0.05) that were then used to produce burn severity maps. The best performing index using only a post-fire image was NDVI, with a 96.43% accuracy while the NBR had an accuracy of 75% (Table 3). The dNBR (89.29% accuracy) was the best performing differenced index while the dNDVI had a 71.43% accuracy. Both supervised classification products had a 66.67% accuracy (Table 3 and Figure 5). Overall, the NDVI-based burn severity map was the best product at Nugget Creek (Table 3).

3.2. Shovel Creek Burn Severity Mapping

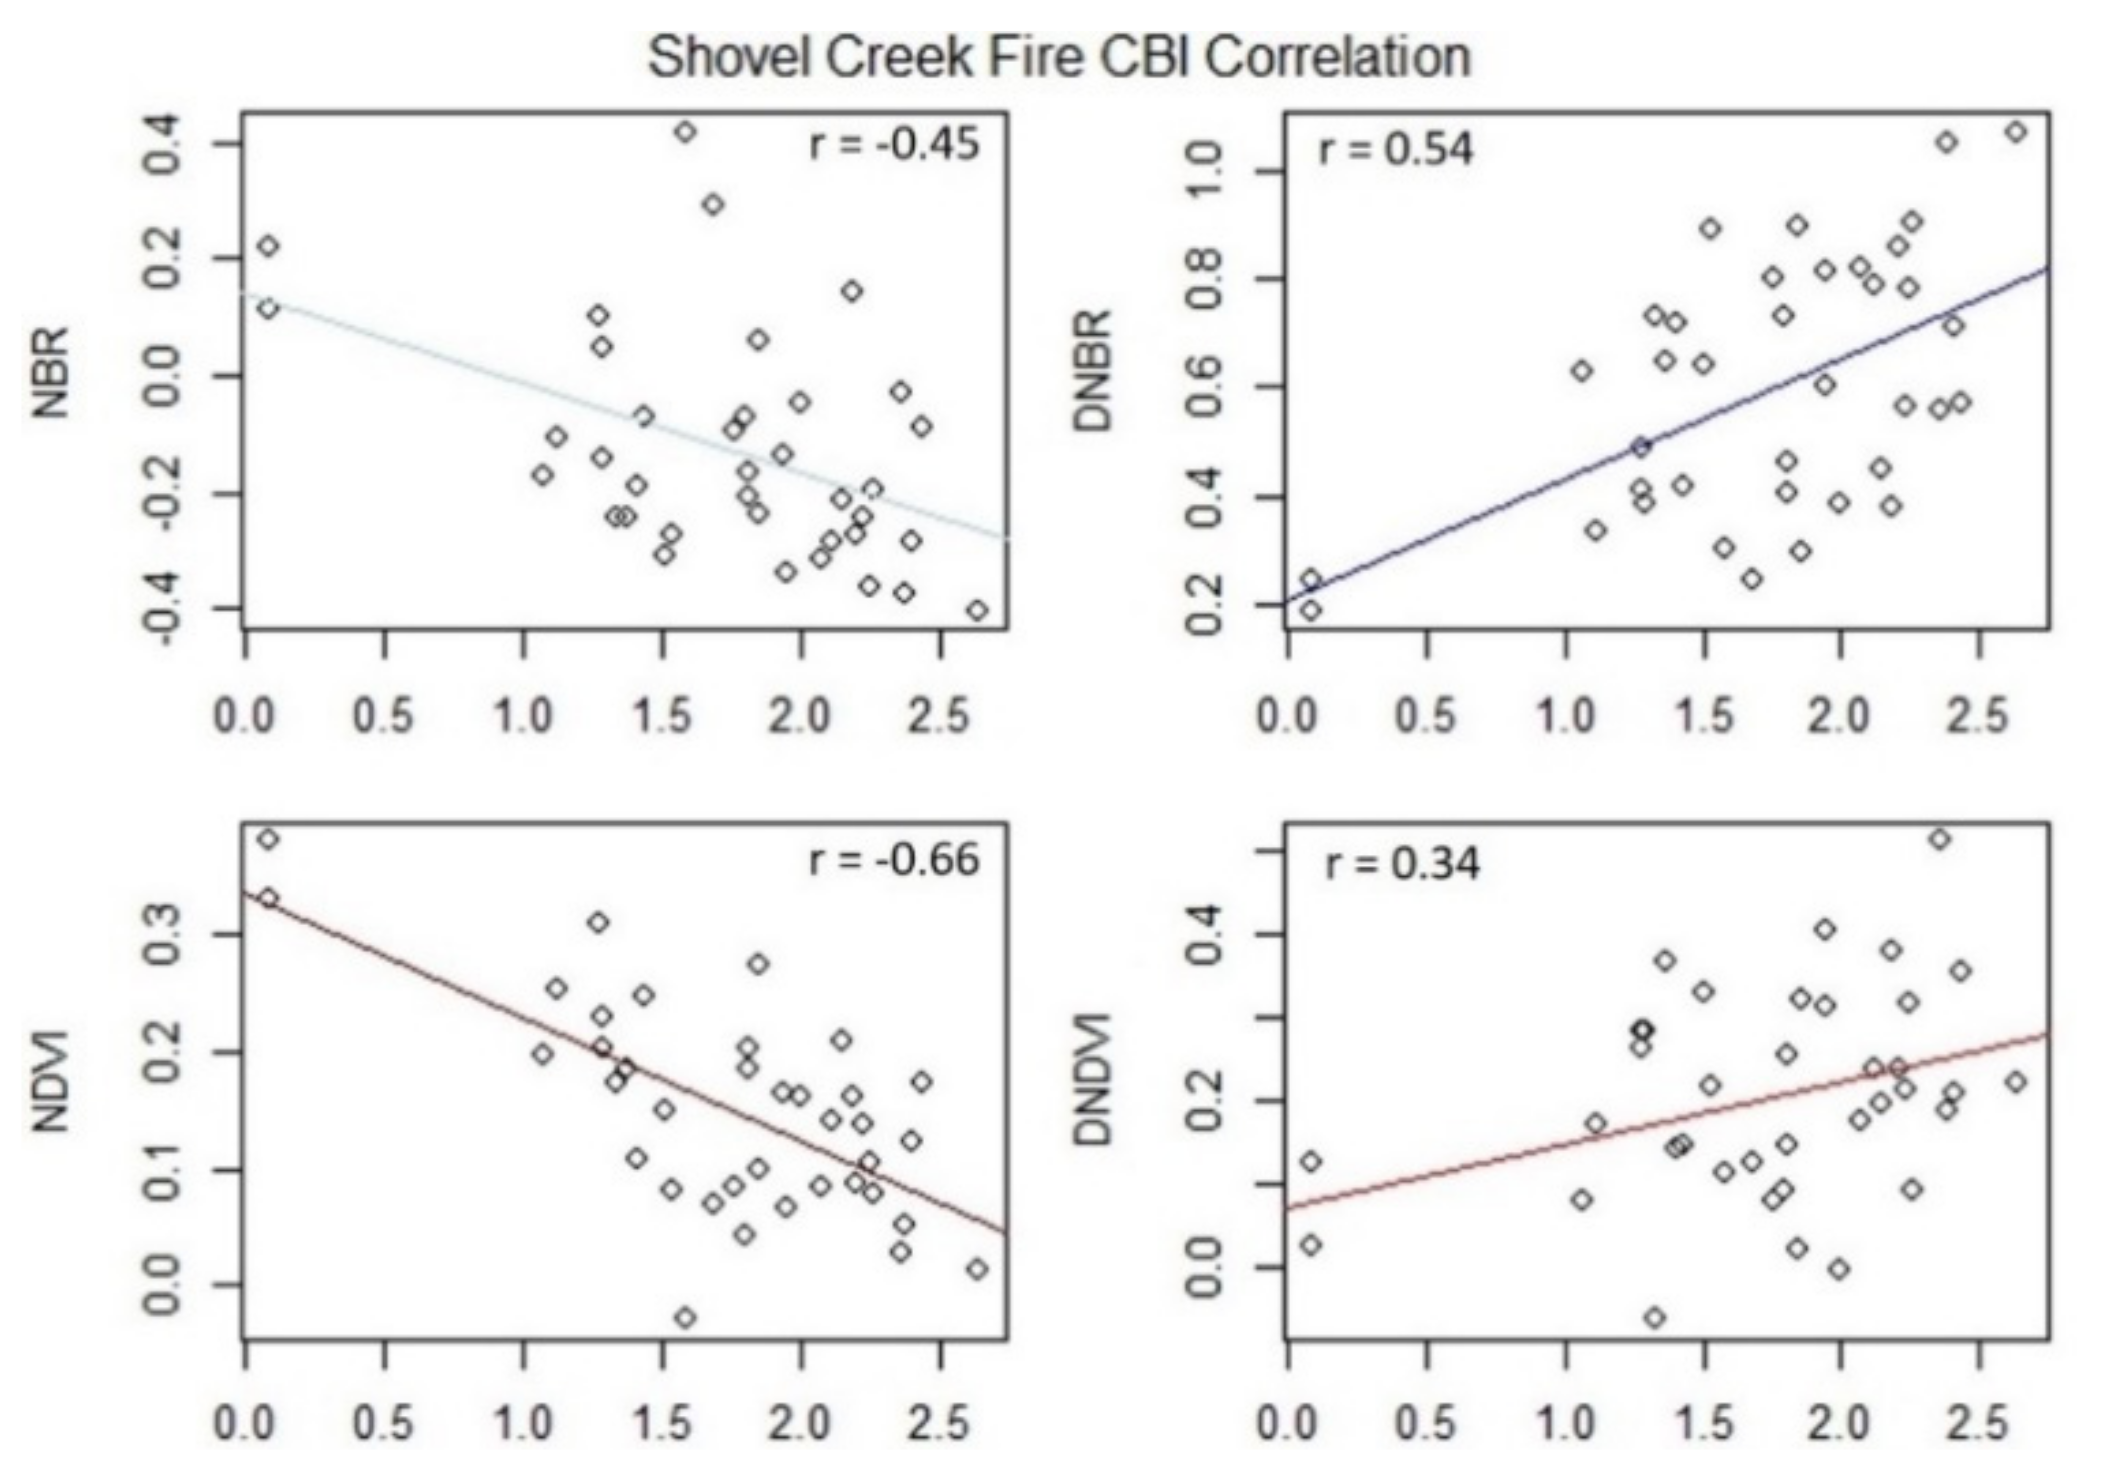
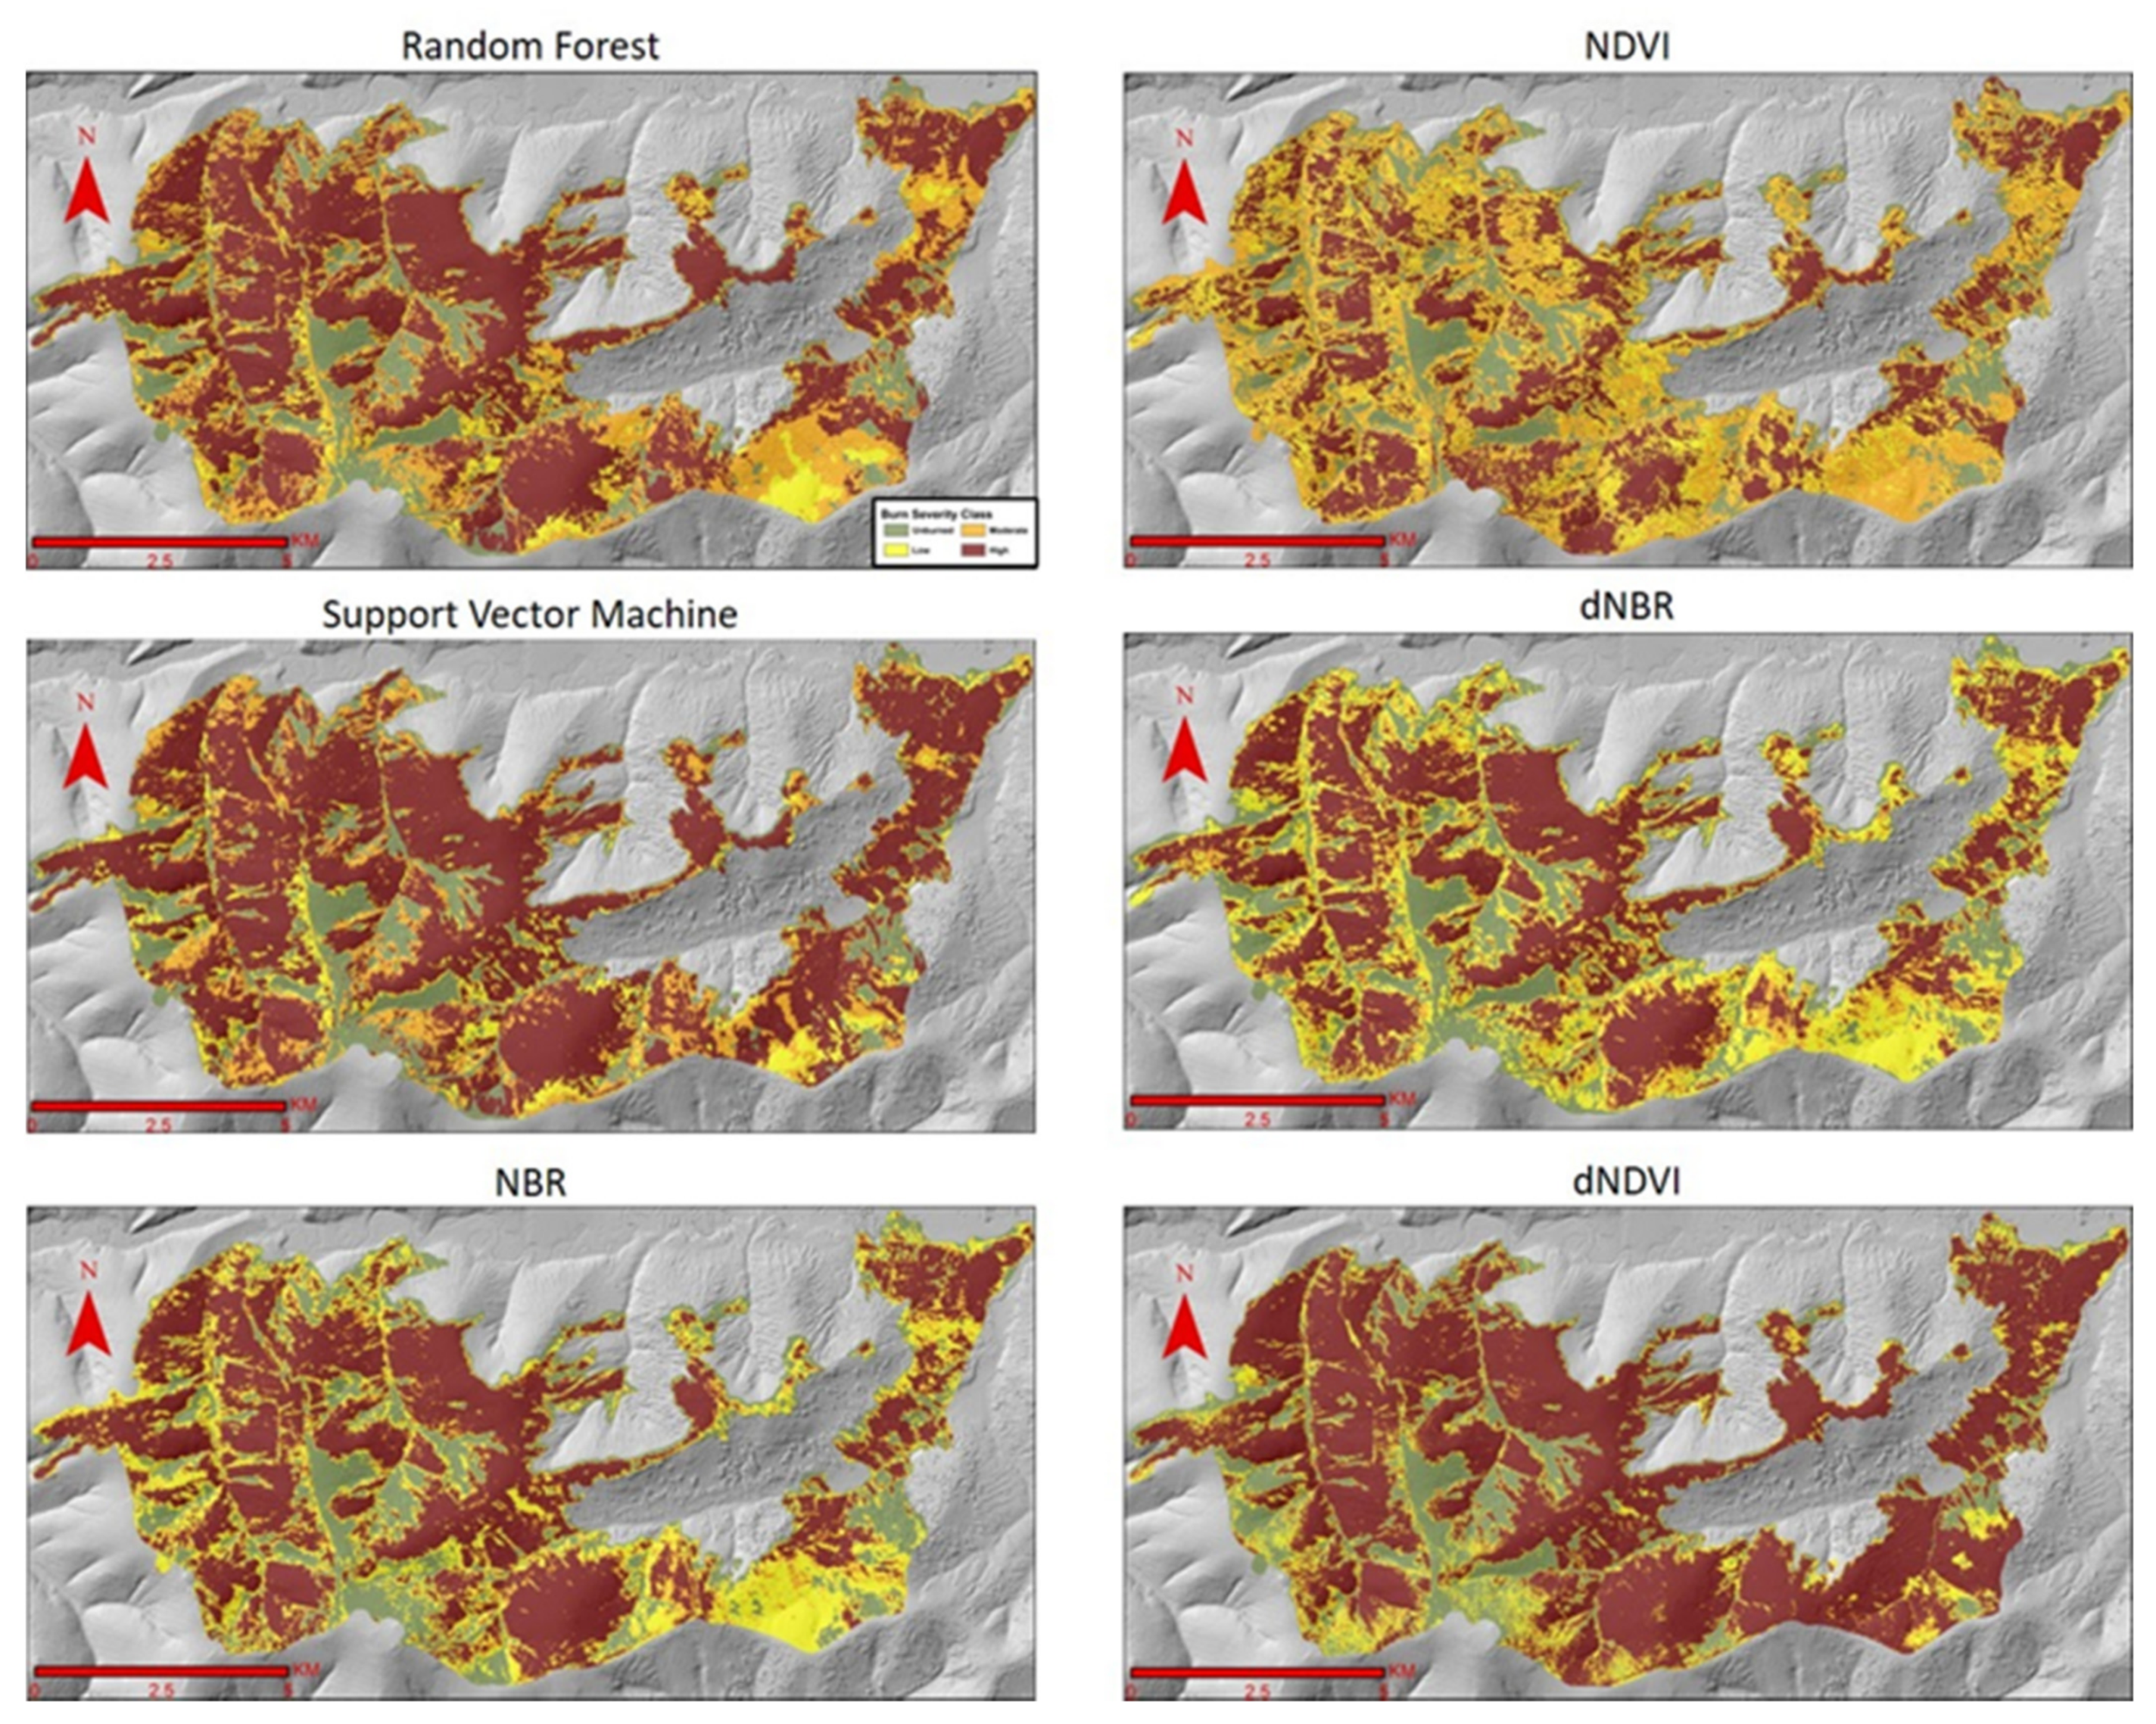
At Shovel Creek, the indices had low to moderate correlations (r: 0.33–0.66) to CBI (Figure 6). The NDVI had the highest correlation (|r| = 0.66) and dNDVI the lowest correlation (|r| = 0.34) (Figure 6). Linear models at Shovel Creek produced for each index had a significant relationship between the respective indices and CBI values (p < 0.05). Out of all indices, the post-fire NBR-based severity map had the highest accuracy (73.08%) and the dNDVI had the lowest accuracy (65.38%). The RF and SVM supervised classification map products performed similarly with both of the products, having an 83.33% accuracy (Table 3 and Figure 7). Overall, the RF and SVM supervised map products outperformed all other products at assessing burn severity within the Shovel Creek fire (Table 3).

3.3. Burn Severity Relationship to Environmental Factors

According to the AVWC, 80.1% of the pre-fire vegetation cover in the Shovel Creek burn scar was conifer forest and 11.8% was mixed forest (conifer and deciduous) (Table 4). In the Nugget Creek burn scar, 72.8% of the area was conifer forest while 25.5% mixed forest (Table 4). In both fires, conifer forest occupied the majority of the burn scars, confirming that both fires mostly burned conifer vegetation.
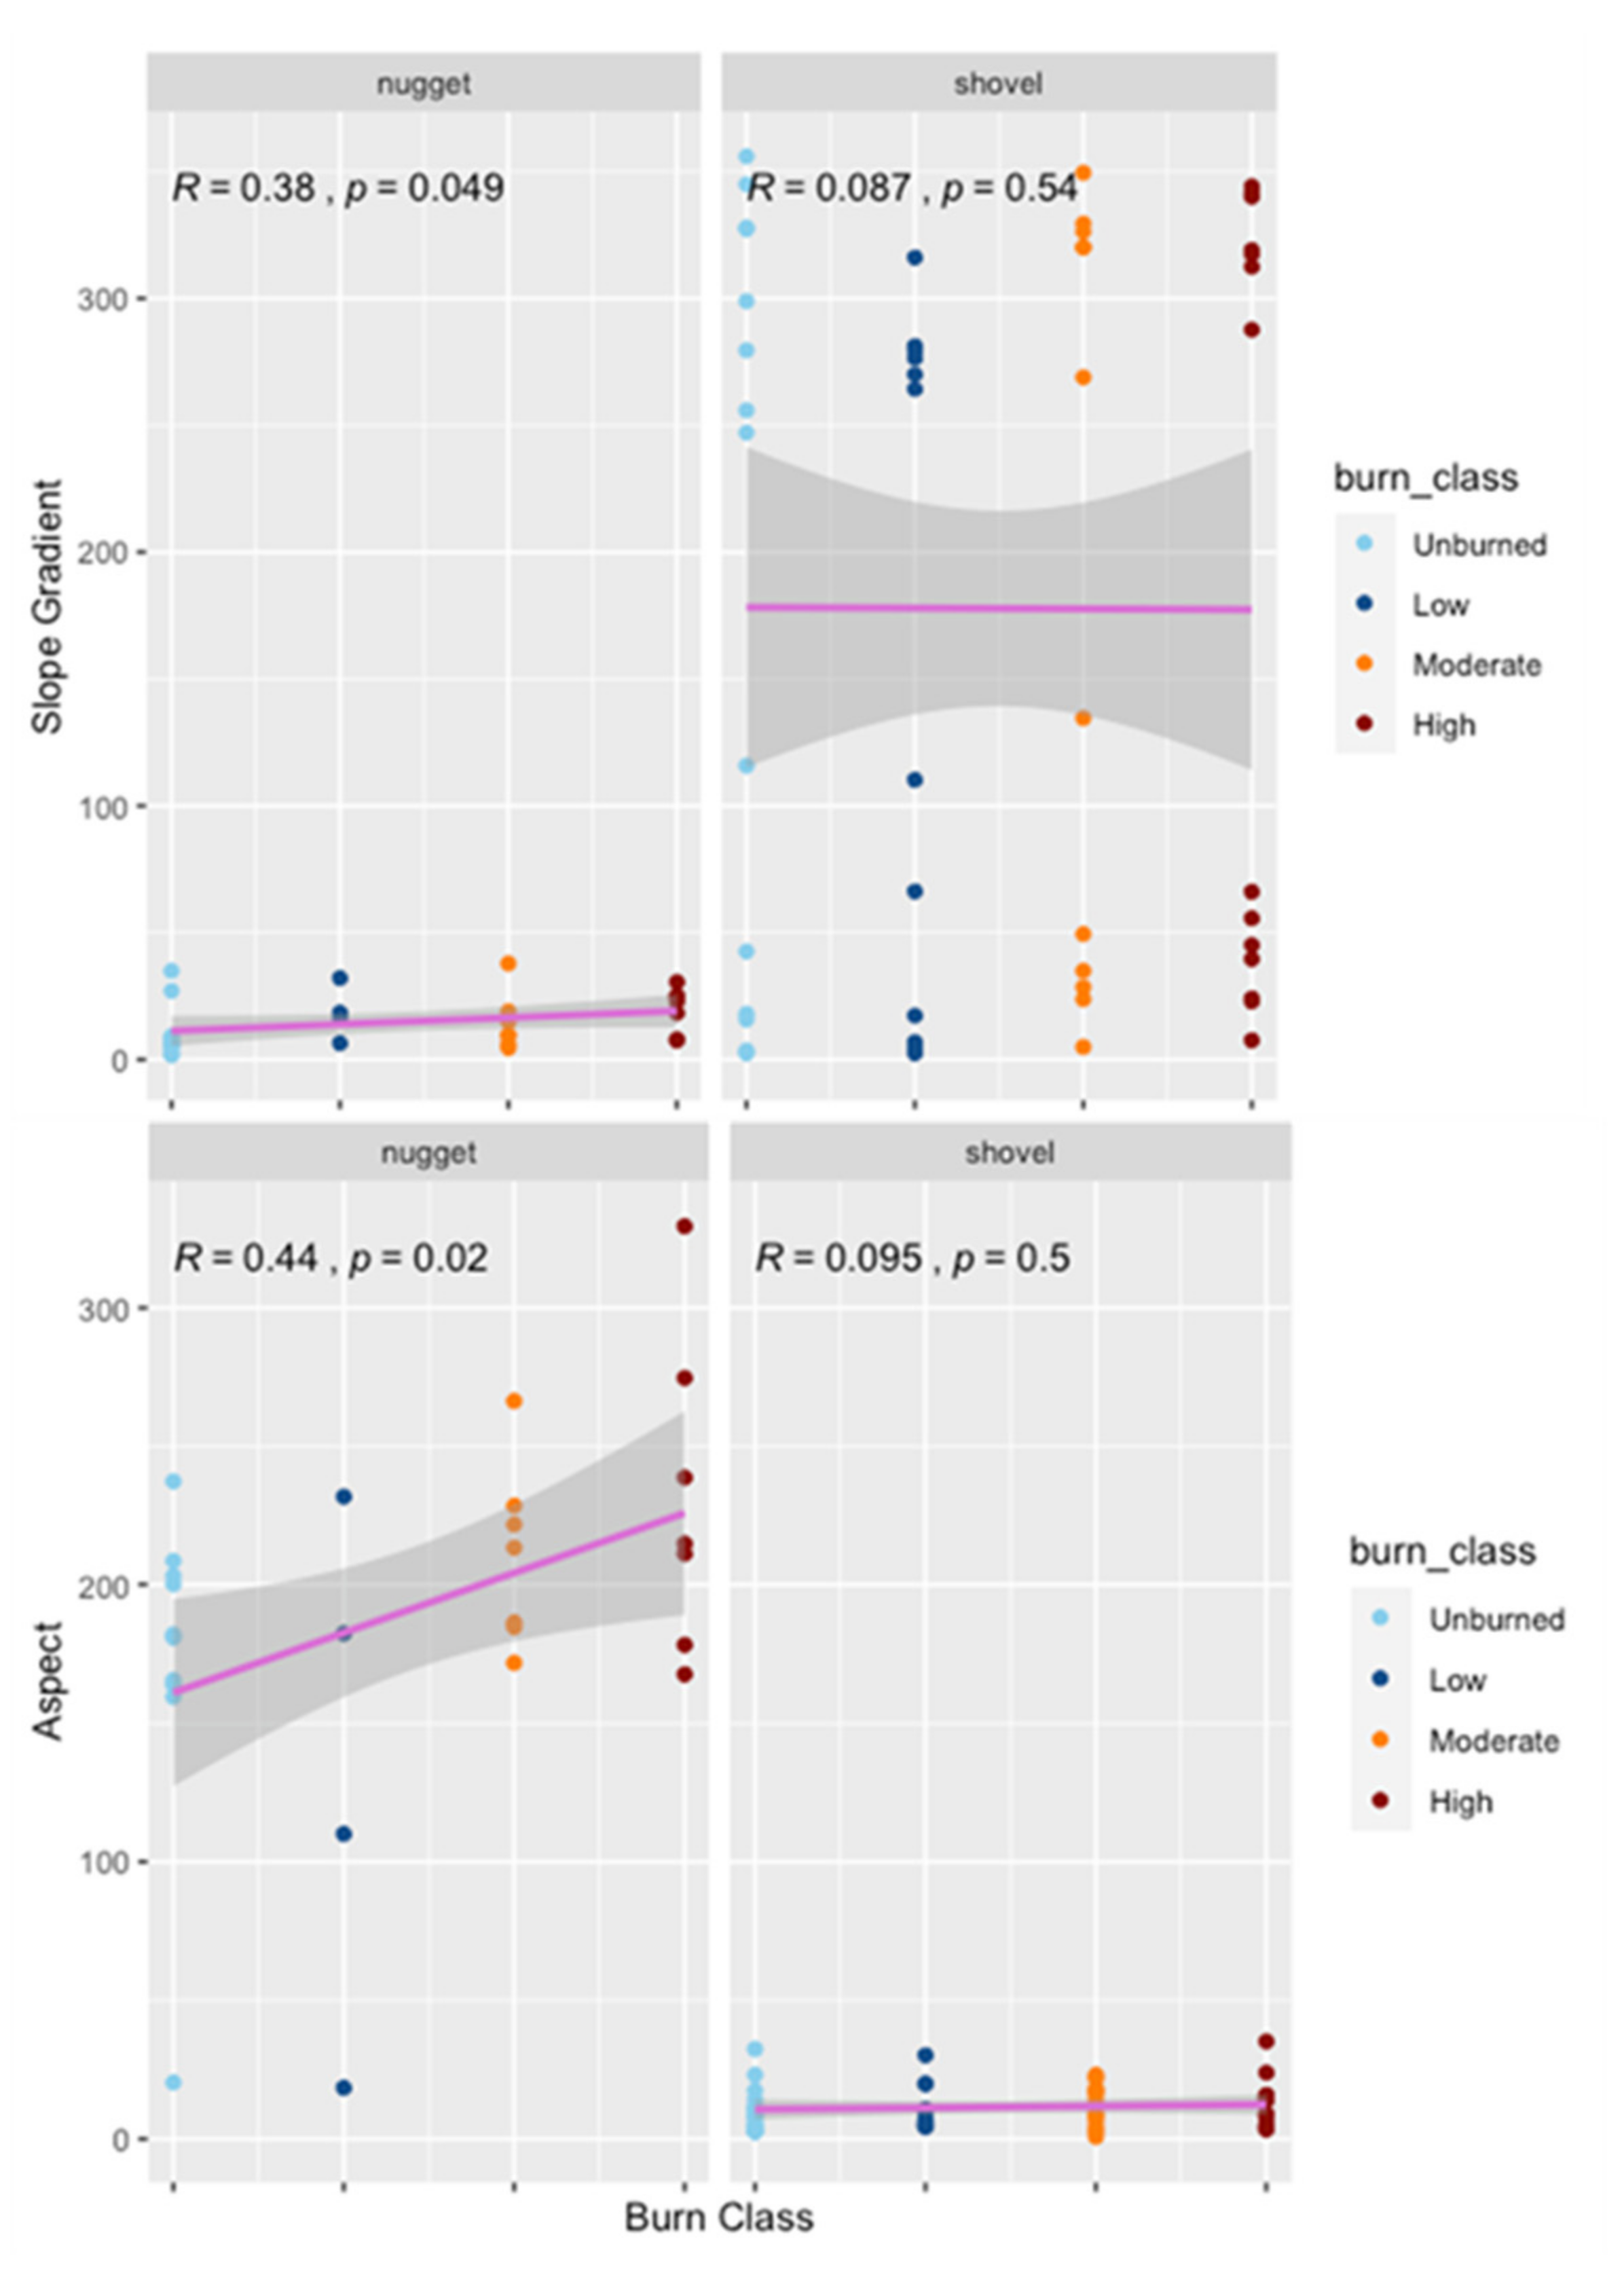
We conducted several statistical tests to investigate the relationship of fuel type, slope, aspect, and burn scar site with burn severity classes (unburned, low, moderate, and high). First, we used type III sums of squares with all explanatory variables. We found that aspect and burn site (Shovel Creek and Nugget Creek) were the two statistically significant explanatory variables for burn severity classes (Table 5). We used AIC to determine which regression model best explained burn severity; of all possible models, the model with aspect and burn scar site as explanatory variables had the lowest AIC value and best fit. When we visualize the relationships between burn severity and aspect at both burn scar sites, we can see that aspect and burn severity classes have a stronger relationship at the Nugget Creek burn scar (R = 0.44, p = 0.02) than at the Shovel Creek burn scar (R = 0.095, p = 0.5 Figure 8). The slope had a statistically significant relationship with burn severity classes (R = 0.38, p = 0.049) only at Nugget Creek. Fuel type did not have a statistically significant relationship with burn severity classes at either site. These observations suggest that models for predicting burn severity using environmental variables are site-dependent, and likely unsuited for modeling risk of high burn severity at a larger scale.

4. Discussion

4.1. Burn Severity Mapping

Several previous studies used traditional spectral index-based remote sensing methods to map burn severity in the boreal forest [57,58]. Epting et al. (2005) identified NBR as a better index for assessing burn severity than NDVI in the boreal forest [57]. Furthermore, they found the differenced indices (dNDVI and dNBR) outperformed post-fire indices (NDVI and NBR). The differenced indices are better than post-fire indices because they measure the amount of change over time [59]. Using 347 sites across 6 fires, Murphy et al. (2008) found that dNBR had a relatively weak correlation with CBI (R2 adjusted, 0.11–0.64) [58]. In our study, we found that the post-fire NDVI and NBR indices outperformed the differenced indices at Shovel Creek, and the post-fire NDVI index outperformed the differenced NDVI (dNDVI) at Nugget Creek (Table 3). In fact, the NDVI-based burn severity map for the Nugget Creek burn scar had the highest accuracy (96%) between the two sites. Burn severity factors such as vegetation type and location impact the performance of the spectral indices and are not transferable between sites [29,58].
At the Shovel Creek burn scar, the RF and SVM (83%) outperformed all index products. Parks et al. (2019) used 19 fires to predict burn severity in Alaska using RF and had a R2 value of 0.62 between the observed vs. predicted CBI, which is similar to the R2 values of the dNBR index and CBI reported by Murphy et al. (2008) [29,58]. The supervised classification (RF and SVM) products outperformed the traditional index products at Shovel Creek as more CBI training plots (20) were available for this site compared to the Nugget Creek site (9 plots). At Nugget Creek, the traditional index-based burn severity map products (NDVI: 96%; dNBR: 89%) outperformed the RF and SVM products. We had only 9 CBI plots to train the RF and SVM classifiers for the Nugget Creek site, which may have caused the lower accuracy (RF: 67%; SVM: 67%) for the classified map products compared to the index-based map products. Field surveys of burn severity at remote sites are not always feasible due to logistical and funding challenges. So, when adequate field data to train a supervised classifier are not available, the index-based burn severity mapping would be ideal. Field surveys of burn scars to train supervised classifiers are time consuming and expensive but can result in accurate map products. The differences in the accuracy between the burn severity map products may also be the results of the spatial spread of the CBI plots collected. Our findings suggest that index-based methods can result in reliable burn severity map products, and offer insights on fire damage. However, if adequate field data are available to train supervised machine learning classifiers, then the classifiers can outperform index-based methods.
At the Nugget Creek fire, the SVM and RF mapped more of the moderate burn severity class and less of the low and high burn severity classes compared to the traditional indices (Table 6). This may be the result of the classifiers having limited training plots (2) to use to train the low burn severity class. At the Shovel Creek fire, the SVM and RF mapped more of the high burn severity class and less of the low burn severity class compared to the indices (Table 7). A common misclassification was CBI plots with values close to the edge of the class boundary (i.e., a CBI 1.49 being misclassified in the moderate class) (Tables S1–S12). In most products, a high burn severity was the most accurate class. This is likely a result of the high burn severity class being the most spectrally distinct from the other burn severity classes. In some applications, more than three burn severity classes may be needed. Overall, we found that both spectral indices and machine learning classifiers can adequately assess burn severity.

4.2. Burn Severity Relationship to Environmental Factors

The relationship between fire and environmental factors is complex and varies across a landscape [60]. Looking at the vegetation classes that were in the burn scar prior to the fire shows that the classes that contain conifer species (conifer and mixed forest) appear to be more likely to burn than other vegetation types and is consistent with a previous study [61]. Needles and branches of coniferous species are more flammable due to the presence of the resinous substance and are also distributed continuously from ground to treetop, allowing the fire to easily spread to the tree crowns [62]. In the Alaskan boreal forest, north-facing slopes are more conducive for black spruce growth because of colder soil conditions, lower solar insolation, and being less productive, whereas the dry south-facing slopes are more conducive for hardwood growth [63]. Hardwoods are less flammable fuel types (more moisture) while black spruce are incredibly flammable due to their lower moisture content, resin production, and low branches that promote crown fires [62]. Presence of diseased trees and dead trees can alter the relationship between burn severity and environmental factors. A case study on the basin complex fire in California suggested that a disease-caused increase in wildfire fuels can result in increased burn severity [64]. At Shovel Creek, there was not a significant relationship between burn severity and topography (aspect and slope). While at Nugget Creek, aspect had a strong correlation with burn severity, showing that the burn severity and topography relationship is site-dependent. The Nugget Creek fire was located far away from human infrastructure and little effort was put into containing the fire compared to the Shovel Creek fire that was suppressed aggressively as it was close to human infrastructure. For the Shovel Creek fire, the total suppression cost was over USD 25 million while at Nugget Creek the suppression cost was USD 56,000 [42,43]. The efforts to contain the fire may have caused the burn severity relationship with environmental factors to appear insignificant for the Shovel Creek fire. Therefore, the inclusion of topography to predict burn severity or create a burn severity probability map over a large landscape or region can be problematic.
Understanding the relationship between burn severity and environmental variables will help researchers and fire managers predict areas most at risk of high-severity fires, allowing for proper mitigation and restoration strategies that reduce the negative effects of fire. Topography has a complex relationship with fire that varies across landscapes and with daily climatic conditions, making it hard to model fire and severity risks [60,65]. Mapping burn severity helps managers see the effects that fires have on the landscape and allow managers to better understand changes to ecosystem functions and services caused by the fire. By creating accurate burn severity maps in the boreal forest that consider the environmental factors and their relationship to burn severity, we gain insight into what factors favor more severe impacts from fires. Areas with a high burn severity are of particular interest to land managers as they indicate areas with the largest amount of change to vegetation ecosystem properties due to fire. These areas are more susceptible to the colonization of invasive species, permafrost thaw, erosion, and potential vegetation type conversions [59]. Land managers are also interested in the changes to wildlife habitat and recreational activities caused by fire [59]. The relationship between burn severity, environmental factors, and vegetation recovery should continue to be investigated to advance the understanding of ecosystem responses to fire and ability to predict burn severity.

5. Conclusions

In this study, we were able to show that both supervised classification methods and spectral indices can accurately map burn severity in the boreal forest. At the Nugget Creek fire, with 28 CBI plots, the spectral indices NDVI (96%) and dNBR (89%) produced higher accuracy products than the supervised classification RF product (78%). While at the Shovel Creek fire, where we sampled 52 CBI plots, the RF and SVM products (83%) outperformed the spectral index-based burn severity maps. This shows that when we have more ground truth field data, the better the supervised classifier performs in assigning pixels to a burn severity class. In most cases, using pre- and post-fire images to create a differenced index did not improve the accuracy of assessing burn severity. Overall, both supervised classification and spectral indices create highly accurate burn severity maps in the boreal forest. Based on our study, coniferous forests appear more likely to burn than other vegetation types. We also found that the influence of environmental variables on burn severity is site-dependent and further research needs to be done to understand this relationship and explore additional factors in order to predict burn severity on the landscape. The products from this study will help fire managers identify areas of concern based on burn severity information that can then be integrated into management practices that will help mitigate and reduce the negative effects of fire.

Supplementary Materials

The following are available online at https://www.mdpi.com/article/10.3390/rs13101966/s1, Figure S1: CBI data sheet used to survey wildfire burn severity at the Shovel Creek and Nugget Creek burn scars. The data sheet was originally created by Key and Benson (2006) and modified by Barnes et al., (2020) for boreal forest in Alaska, Table S1: Shovel Creek Fire NDVI burn severity error matrix, Table S2: Shovel Creek Fire NBR burn severity error matrix, Table S3: Shovel Creek Fire dNDVI burn severity error matrix, Table S4: Shovel Creek Fire dNBR burn severity error matrix, Table S5: Shovel Creek Fire RF burn severity error matrix, Table S6: Shovel Creek Fire SVM burn severity error matrix, Table S7: Nugget Creek Fire NDVI burn severity error matrix, Table S8: Nugget Creek Fire NBR burn severity error matrix, Table S9: Nugget Creek Fire dNDVI burn severity error matrix, Table S10: Nugget Creek Fire dNBR burn severity error matrix, Table S11: Nugget Creek Fire RF burn severity error matrix, Table S12: Nugget Creek Fire SVM burn severity error matrix.

Author Contributions

Conceptualization, C.W.S. and S.K.P.; methodology, C.W.S., S.K.P., A.B. and J.L.H.; validation, C.W.S.; formal analysis, C.W.S.; writing—original draft preparation, C.W.S. and S.K.P.; writing—review and editing, C.W.S., S.K.P., F.J.M., U.S.B., A.B. and J.L.H.; visualization, C.W.S. All authors have read and agreed to the published version of the manuscript.

Funding

This work was supported in part by the Alaska Space Grant Program through a NASA grant (80NSSC20M0070). This material is based upon work supported by the National Science Foundation under award #OIA-1753748 and by the State of Alaska.

Acknowledgments

Thanks to Jennifer Barnes, Lisa Saperstein, Alison York, Heidi Strader and GaBriella Branson for feedback on our research. Thanks to Colleen Haan for assisting in fieldwork. A special thanks to the Alaska Center for Conservation Science for creating and allowing access to the Alaska Vegetation and Wetland Composite map. The Alaska Vegetation and Wetland Composite map can be found at https://accscatalog.uaa.alaska.edu/dataset/alaska-vegetation-and-wetland-composite. Thanks to the Polar Geospatial Center for creating and allowing access to the Arctic DEM. The Arctic DEM can be found at https://www.pgc.umn.edu/data/arcticdem/. A big thank you to the anonymous reviewers and our editor Aguero Gui.

Conflicts of Interest

The authors declare no conflict of interest. The funders had no role in the design of the study; in the collection, analyses, or interpretation of data; in the writing of the manuscript, or in the decision to publish the results.

Abbreviation

MLMachine Learning
CBIComposite Burn Index
RFRandom Forest
SVMSupport Vector Machine
NDVINormalized Difference Vegetation Index
WUIWildland Urban Interface
NBRNormalized Burn Ratio
dNDVIDifferenced Normalized DifferenceVegetation Index
dNBRDifferenced Normalized Burn Ratio

References

  1. Holland, M.M.; Bitz, C.M. Polar Amplification of Climate Change in Coupled Models. Clim. Dyn. 2003, 21, 221–232. [Google Scholar] [CrossRef]
  2. Rick, T.; Walsh, J. Alaska’s Changing Environment. International Arctic Research Center. Available online: https://uaf-iarc.org/our-work/alaskas-changing-environment/ (accessed on 25 February 2021).
  3. Box, J.; Colgan, W.; Christensen, T.R.; Schmidt, N.; Lund, M.; Parmentier, F.-J.; Brown, R.; Bhatt, U.; Euskirchen, E.; Romanovsky, V.; et al. Key Indicators of Arctic Climate Change: 1971–2017. Environ. Res. Lett. 2019, 14, 045010. [Google Scholar] [CrossRef]
  4. Kasischke, E.S.; Turetsky, M.R. Recent Changes in the Fire Regime across the North American Boreal Region—Spatial and Temporal Patterns of Burning across Canada and Alaska. Geophys. Res. Lett. 2006, 33. [Google Scholar] [CrossRef] [Green Version]
  5. Kelly, R.; Chipman, M.L.; Higuera, P.E.; Stefanova, I.; Brubaker, L.B.; Hu, F.S. Recent Burning of Boreal Forests Exceeds Fire Regime Limits of the Past 10,000 Years. Proc. Natl. Acad. Sci. USA 2013, 110, 13055–13060. [Google Scholar] [CrossRef] [PubMed] [Green Version]
  6. York, A.; Bhatt, U.S.; Gargulinski, E.; Grabinski, Z.; Jain, P.; Soja, A.; Thoman, R.L.; Ziel, R. Wildland Fire in High Northern Latitudes Arctic Report Card 2020; Thoman, R.L., Richter-Menge, J., Druckenmiller, M.L., Eds.; NOAA: Washington, DC, USA, 2020. [Google Scholar] [CrossRef]
  7. Bureau of Land Management. Alaska Fire History Points. Alaska Wildland Fire Coordination Group & Alaska Interagency Coordination Center, 2021. Available online: https://fire.ak.blm.gov/content/maps/aicc/Metadata/Metadata/Zipped%20file%20geodatabases/AlaskaFireHistory_Points_metadata.xml (accessed on 8 April 2021).
  8. Bhatt, U.S.; Lader, R.T.; Walsh, J.E.; Bieniek, P.A.; Thoman, R.; Berman, M.; Borries-Strigle, C.; Bulock, K.; Chriest, J.; Hahn, M.; et al. Emerging Anthropogenic Influences on the Southcentral Alaska Temperature and Precipitation Extremes and Related Fires in 2019. Land 2021, 10, 82. [Google Scholar] [CrossRef]
  9. Molina, A.C. Wildfire in Alaska: The Economic Role of Fuel Treatments and Homeowner Preferences in the Wildland Urban Interface. Ph.D. Dissertation, University of Alaska, Fairbanks, AK, USA, 2019. Available online: https://scholarworks.alaska.edu/bitstream/handle/11122/10633/Molina_A_2019.pdf?sequence=1 (accessed on 17 May 2021).
  10. Centers for Disease Control and Prevention. Protect Yourself from Wildfire Smoke. Available online: www.cdc.gov/features/wildfires/index.html (accessed on 5 August 2019).
  11. Schuur, E.A.G.; McGuire, A.D.; Schädel, C.; Grosse, G.; Harden, J.W.; Hayes, D.J.; Hugelius, G.; Koven, C.D.; Kuhry, P.; Lawrence, D.M.; et al. Climate Change and the Permafrost Carbon Feedback. Nature 2015, 520, 171–179. [Google Scholar] [CrossRef] [PubMed]
  12. Bieniek, P.A.; Bhatt, U.S.; York, A.; Walsh, J.E.; Lader, R.; Strader, H.; Ziel, R.; Jandt, R.R.; Thoman, R.L. Lightning Variability in Dynamically Downscaled Simulations of Alaska’s Present and Future Summer Climate. J. Appl. Meteorol. Climatol. 2020, 59, 1139–1152. [Google Scholar] [CrossRef]
  13. Veraverbeke, S.; Rogers, B.M.; Goulden, M.L.; Jandt, R.R.; Miller, C.E.; Wiggins, E.B.; Randerson, J.T. Lightning as a Major Driver of Recent Large Fire Years in North American Boreal Forests. Nat. Clim. Chang. 2017, 7, 529–534. [Google Scholar] [CrossRef]
  14. Parks, S.A.; Holsinger, L.M.; Panunto, M.H.; Jolly, W.M.; Dobrowski, S.Z.; Dillon, G.K. High-Severity Fire: Evaluating Its Key Drivers and Mapping Its Probability across Western US Forests. Environ. Res. Lett. 2018, 13, 044037. [Google Scholar] [CrossRef]
  15. Roberts, D.A.; Dennison, P.E.; Gardner, M.E.; Hetzel, Y.; Ustin, S.L.; Lee, C.T. Evaluation of the potential of Hyperion for fire danger assessment by comparison to the Airborne Visible/Infrared Imaging Spectroradiometer. IEEE Trans. Geosci. Remote Sens. 2003, 40, 1297–1310. [Google Scholar] [CrossRef]
  16. Chuvieco, E.; Riaño, D.; Danson, F.M.; Martin, P. Use of a Radiative Transfer Model to Simulate the Postfire Spectral Response to Burn Severity. J. Geophys. Res. Biogeosci. 2006, 111. [Google Scholar] [CrossRef] [Green Version]
  17. De Santis, A.; Chuvieco, E. Burn Severity Estimation from Remotely Sensed Data: Performance of Simulation versus Empirical Models. Remote Sens. Environ. 2007, 108, 422–435. [Google Scholar] [CrossRef]
  18. He, Y.; Chen, G.; De Santis, A.; Roberts, D.A.; Zhou, Y.; Meentemeyer, R.K. A Disturbance Weighting Analysis Model (DWAM) for Mapping Wildfire Burn Severity in the Presence of Forest Disease. Remote Sens. Environ. 2019, 221, 108–121. [Google Scholar] [CrossRef]
  19. Fernandez-Manso, O.; Quintano, C.; Fernandez-Manso, A. Combining spectral mixture analysis and object-based classification for fire severity mapping. For. Syst. 2009, 18, 296–313. [Google Scholar] [CrossRef]
  20. Quintano, C.; Fernandez-Manso, A.; Roberts, D.A. Multiple endmember spectral mixture analysis (MESMA) to map burn severity levels from Landsat image in Mediterranean countries. Remote Sens. Environ. 2013, 136, 76–88. [Google Scholar] [CrossRef]
  21. Veraverbeke, S.; Hook, S.J. Evaluating spectral indices and spectral mixture analysis for assessing fire severity, combustion completeness and carbon emission. Int. J. Wildland Fire 2013, 22, 707. [Google Scholar] [CrossRef]
  22. Veraverbeke, S.; Stravos, E.N.; Hook, S.J. Assessing fire severity using imaging spectroscopy data from the airborne visible/infrared imaging spectrometer (AVIRIS) and comparison with multispectral capabilities. Remote Sens. Environ. 2014, 154, 153–163. [Google Scholar] [CrossRef]
  23. Veraverbeke, S.; Dennison, P.; Gitas, I.; Hulley, G.; Kalashnikova, O.; Katagis, T.; Kuai, L.; Meng, R.; Roberts, D.; Stravos, E.N. Hyperspectral remote sensing of fire: State-of-the-art and future perspectives. Remote Sens. Environ. 2018, 216, 105–121. [Google Scholar] [CrossRef]
  24. Boucher, J.; Beaudoin, A.; Hébert, C.; Guindon, L.; Bauce, É. Assessing the Potential of the Differenced Normalized Burn Ratio (DNBR) for Estimating Burn Severity in Eastern Canadian Boreal Forests. Int. J. Wildland Fire 2017, 26, 32–45. [Google Scholar] [CrossRef]
  25. Mohammad Daniel, M.D.W. Spatio Temporal Distribution of Forest Fire Using Landsat [NDVI] and [NBR]/Mohammad Daniel Wafry Mohd Nazari. Ph.D. Thesis, Universiti Teknologi Mara Perlis, Arau, Malaysia, 2019. [Google Scholar]
  26. Shin, J.; Seo, W.; Kim, T.; Park, J.; Woo, C. Using UAV Multispectral Images for Classification of Forest Burn Severity—A Case Study of the 2019 Gangneung Forest Fire. Forests 2019, 10, 1025. [Google Scholar] [CrossRef] [Green Version]
  27. Amos, C.; Petropoulos, G.P.; Ferentinos, K.P. Determining the Use of Sentinel-2A MSI for Wildfire Burning & Severity Detection. Int. J. Remote Sens. 2019, 40, 905–930. [Google Scholar] [CrossRef]
  28. Key, C.H.; Benson, N. Landscape Assessment: Ground Measure of Severity, the Composite Burn Index; and Remote Sensing of Severity, the Normalized Burn Ratio. In FIREMON: Fire Effects Monitoring and Inventory System; Campbell, D.L., Ed.; Rocky Mountain Research Station, US Forest Service: Fort Collins, CO, USA, 2006. [Google Scholar]
  29. Parks, S.A.; Holsinger, L.M.; Koontz, M.J.; Collins, L.; Whitman, E.; Parisien, M.-A.; Loehman, R.A.; Barnes, J.L.; Bourdon, J.-F.; Boucher, J.; et al. Giving Ecological Meaning to Satellite-Derived Fire Severity Metrics across North American Forests. Remote Sens. 2019, 11, 1735. [Google Scholar] [CrossRef] [Green Version]
  30. Chapman, D.S.; Bonn, A.; Kunin, W.E.; Cornell, S.J. Random Forest Characterization of Upland Vegetation and Management Burning from Aerial Imagery. J. Biogeogr. 2010, 37, 37–46. [Google Scholar] [CrossRef]
  31. Belgiu, M.; Drăguţ, L. Random Forest in Remote Sensing: A Review of Applications and Future Directions. ISPRS J. Photogramm. Remote Sens. 2016, 114, 24–31. [Google Scholar] [CrossRef]
  32. Prasad, M.A.; Iverson, L.R.; Liaw, A. Newer Classification and Regression Tree Techniques: Bagging and Random Forests for Ecological Prediction. Ecosystems 2006, 9, 181–199. [Google Scholar] [CrossRef]
  33. Smith, C.W.; Panda, S.K.; Bhatt, U.S.; Meyer, F.J. Improved Boreal Forest Wildfire Fuel Type Mapping in Interior Alaska Using AVIRIS-NG Hyperspectral Data. Remote Sens. 2021, 13, 897. [Google Scholar] [CrossRef]
  34. Noble, W.S. What Is a Support Vector Machine? Nat. Biotechnol. 2006, 24, 1565–1567. [Google Scholar] [CrossRef] [PubMed]
  35. Wang, M.; Wan, Y.; Ye, Z.; Lai, X. Remote Sensing Image Classification Based on the Optimal Support Vector Machine and Modified Binary Coded Ant Colony Optimization Algorithm. Inf. Sci. 2017, 402, 50–68. [Google Scholar] [CrossRef]
  36. Oommen, T.; Misra, D.; Twarakavi, N.K.C.; Prakash, A.; Sahoo, B.; Bandopadhyay, S. An Objective Analysis of Support Vector Machine Based Classification for Remote Sensing. Math. Geosci. 2008, 40, 409–424. [Google Scholar] [CrossRef]
  37. Mountrakis, G.; Im, J.; Ogole, C. Support Vector Machines in Remote Sensing: A Review. ISPRS J. Photogramm. Remote Sens. 2011, 66, 247–259. [Google Scholar] [CrossRef]
  38. Thanh Noi, P.; Kappas, M. Comparison of Random Forest, k-Nearest Neighbor, and Support Vector Machine Classifiers for Land Cover Classification Using Sentinel-2 Imagery. Sensors 2018, 18, 18. [Google Scholar] [CrossRef] [Green Version]
  39. Foody, G.M.; Mathur, A. The Use of Small Training Sets Containing Mixed Pixels for Accurate Hard Image Classification: Training on Mixed Spectral Responses for Classification by a SVM. Remote Sens. Environ. 2006, 103, 179–189. [Google Scholar] [CrossRef]
  40. United States Department of Agriculture. Shovel Creek Fire. Shovel Creek Fire Information—InciWeb the Incident Information System, 25 November 2020. Available online: https://inciweb.nwcg.gov/incident/6400/ (accessed on 17 May 2021).
  41. United States Department of Agriculture. Nugget Creek Fire. Nugget Creek Fire Information—InciWeb the Incident Information System, 25 November 2020. Available online: https://inciweb.nwcg.gov/incident/6401/ (accessed on 17 May 2021).
  42. Alaska Interagency Coordination Center. Shovel Creek Incident Status Summary (ICS-209); Alaska Interagency Coordination Center: Fairbanks, AK, USA, 2019.
  43. Alaska Interagency Coordination Center. Nugget Creek Incident Status Summary (ICS-209); Alaska Interagency Coordination Center: Fairbanks, AK, USA, 2019.
  44. Barnes, J.L.; McMillan, J.S.; Hrobak, J. NPS Alaska Fire and Fuels Circular Plot Monitoring Protocol, Version 1.0. 47. National Park Service: Fairbanks, Alaska, 2020. Available online: https://irma.nps.gov/DataStore/DownloadFile/637331 (accessed on 17 May 2021).
  45. Escuin, S.; Navarro, R.; Fernández, P. Fire Severity Assessment by Using NBR (Normalized Burn Ratio) and NDVI (Normalized Difference Vegetation Index) Derived from LANDSAT TM/ETM Images. Int. J. Remote Sens. 2008, 29, 1053–1073. [Google Scholar] [CrossRef]
  46. Storey, J.; Roy, D.P.; Masek, J.; Gascon, F.; Dwyer, J.; Choate, M. A Note on the Temporary Misregistration of Landsat-8 Operational Land Imager (OLI) and Sentinel-2 Multi Spectral Instrument (MSI) Imagery. Remote Sens. Environ. 2016, 186, 121–122. [Google Scholar] [CrossRef] [Green Version]
  47. Stumpf, A.; Michéa, D.; Malet, J.-P. Improved Co-Registration of Sentinel-2 and Landsat-8 Imagery for Earth Surface Motion Measurements. Remote Sens. 2018, 10, 160. [Google Scholar] [CrossRef] [Green Version]
  48. Rana, V.K.; Suryanarayana, T.M.V. Performance Evaluation of MLE, RF and SVM Classification Algorithms for Watershed Scale Land Use/Land Cover Mapping Using Sentinel 2 Bands. Remote Sens. Appl. Soc. Environ. 2020, 19, 100351. [Google Scholar] [CrossRef]
  49. ESRI. ArcGIS Desktop: Release 10; Environmental Systems Research Institute: Redlands, CA, USA, 2019; Available online: https://desktop.arcgis.com/en/arcmap/latest/tools/spatial-analyst-toolbox/train-support-vector-machine-classifier.htm (accessed on 17 May 2021).
  50. Alaska Center for Conservation Science. Alaska Vegetation and Wetland Composite|Alaska Conservation Science Catalog. Available online: https://accscatalog.uaa.alaska.edu/dataset/alaska-vegetation-and-wetland-composite (accessed on 2 February 2021).
  51. Viereck, L.A.; Dyrness, C.T.; Batten, A.R.; Wenzlick, K.J. The Alaska Vegetation Classification. Gen. Tech. Rep. 1992, 286. [Google Scholar] [CrossRef]
  52. RStudio Team. RStudio: Integrated Development for R; RStudio: Boston, MA, USA, 2020. [Google Scholar]
  53. Wickham, H. Ggplot2: Elegant Graphics for Data Analysis; Use R! Springer: New York, NY, USA, 2009. [Google Scholar]
  54. Bigler, C.; Kulakowski, D.; Veblen, T.T. Multiple disturbance interactions and drought influence fire severity in Rocky Mountain subalpine forests. Ecology 2005, 86, 3018–3029. [Google Scholar] [CrossRef]
  55. Del Pino, J.S.N.; Ruiz-Gallardo, J.R. Modelling post-fire soil erosion hazard using ordinal logistic regression: A case study in South-eastern Spain. Geomorphology 2015, 232, 117–124. [Google Scholar] [CrossRef]
  56. Aho, K.; Derryberry, D.; Peterson, T. Model selection for ecologists: The worldviews of AIC and BIC. Ecology 2014, 95, 631–636. [Google Scholar] [CrossRef]
  57. Epting, J.; Verbyla, D.; Sorbel, B. Evaluation of Remotely Sensed Indices for Assessing Burn Severity in Interior Alaska Using Landsat TM and ETM+. Remote Sens. Environ. 2005, 96, 328–339. [Google Scholar] [CrossRef]
  58. Murphy, K.A.; Reynolds, J.H.; Koltun, J.M. Evaluating the Ability of the Differenced Normalized Burn Ratio (DNBR) to Predict Ecologically Significant Burn Severity in Alaskan Boreal Forests. Int. J. Wildland Fire 2008, 17, 490–499. [Google Scholar] [CrossRef]
  59. Miller, J.D.; Thode, A.E. Quantifying Burn Severity in a Heterogeneous Landscape with a Relative Version of the Delta Normalized Burn Ratio (DNBR). Remote Sens. Environ. 2007, 109, 66–80. [Google Scholar] [CrossRef]
  60. Carmo, M.; Moreira, F.; Casimiro, P.; Vaz, P. Land Use and Topography Influences on Wildfire Occurrence in Northern Portugal. Landsc. Urban Plan. 2011, 100, 169–176. [Google Scholar] [CrossRef] [Green Version]
  61. Cumming, S.G. Forest Type and Wildfire in the Alberta Boreal Mixedwood: What Do Fires Burn? Ecol. Appl. 2001, 11, 97–110. [Google Scholar]
  62. Fryer, J.L. Fire regimes of Alaskan Black Spruce Communities. In Fire Effects Information System; U.S. Department of Agriculture, Forest Service, Rocky Mountain Research Station, Fire Sciences Laboratory (Producer): Washington, DC, USA, 2014; Available online: www.fs.fed.us/database/feis/fire_regimes/AK_black_spruce/all.html (accessed on 15 March 2021).
  63. Viereck, L.A.; Dyrness, C.T.; Cleve, K.V.; Foote, M.J. Vegetation, Soils, and Forest Productivity in Selected Forest Types in Interior Alaska. Can. J. For. Res. 2011. [Google Scholar] [CrossRef]
  64. Chen, G.; He, Y.; De Santis, A.; Li, G.; Cobb, R.; Meentemeyer, R.K. Assessing the impact of emerging forest disease on wildfire using Landsat and KOMPSAT-2 data. Remote Sens. Environ. 2017, 195, 218–229. [Google Scholar] [CrossRef] [Green Version]
  65. Lee, H.-J.; Choi, Y.E.; Lee, S.-W. Complex Relationships of the Effects of Topographic Characteristics and Susceptible Tree Cover on Burn Severity. Sustainability 2018, 10, 295. [Google Scholar] [CrossRef] [Green Version]
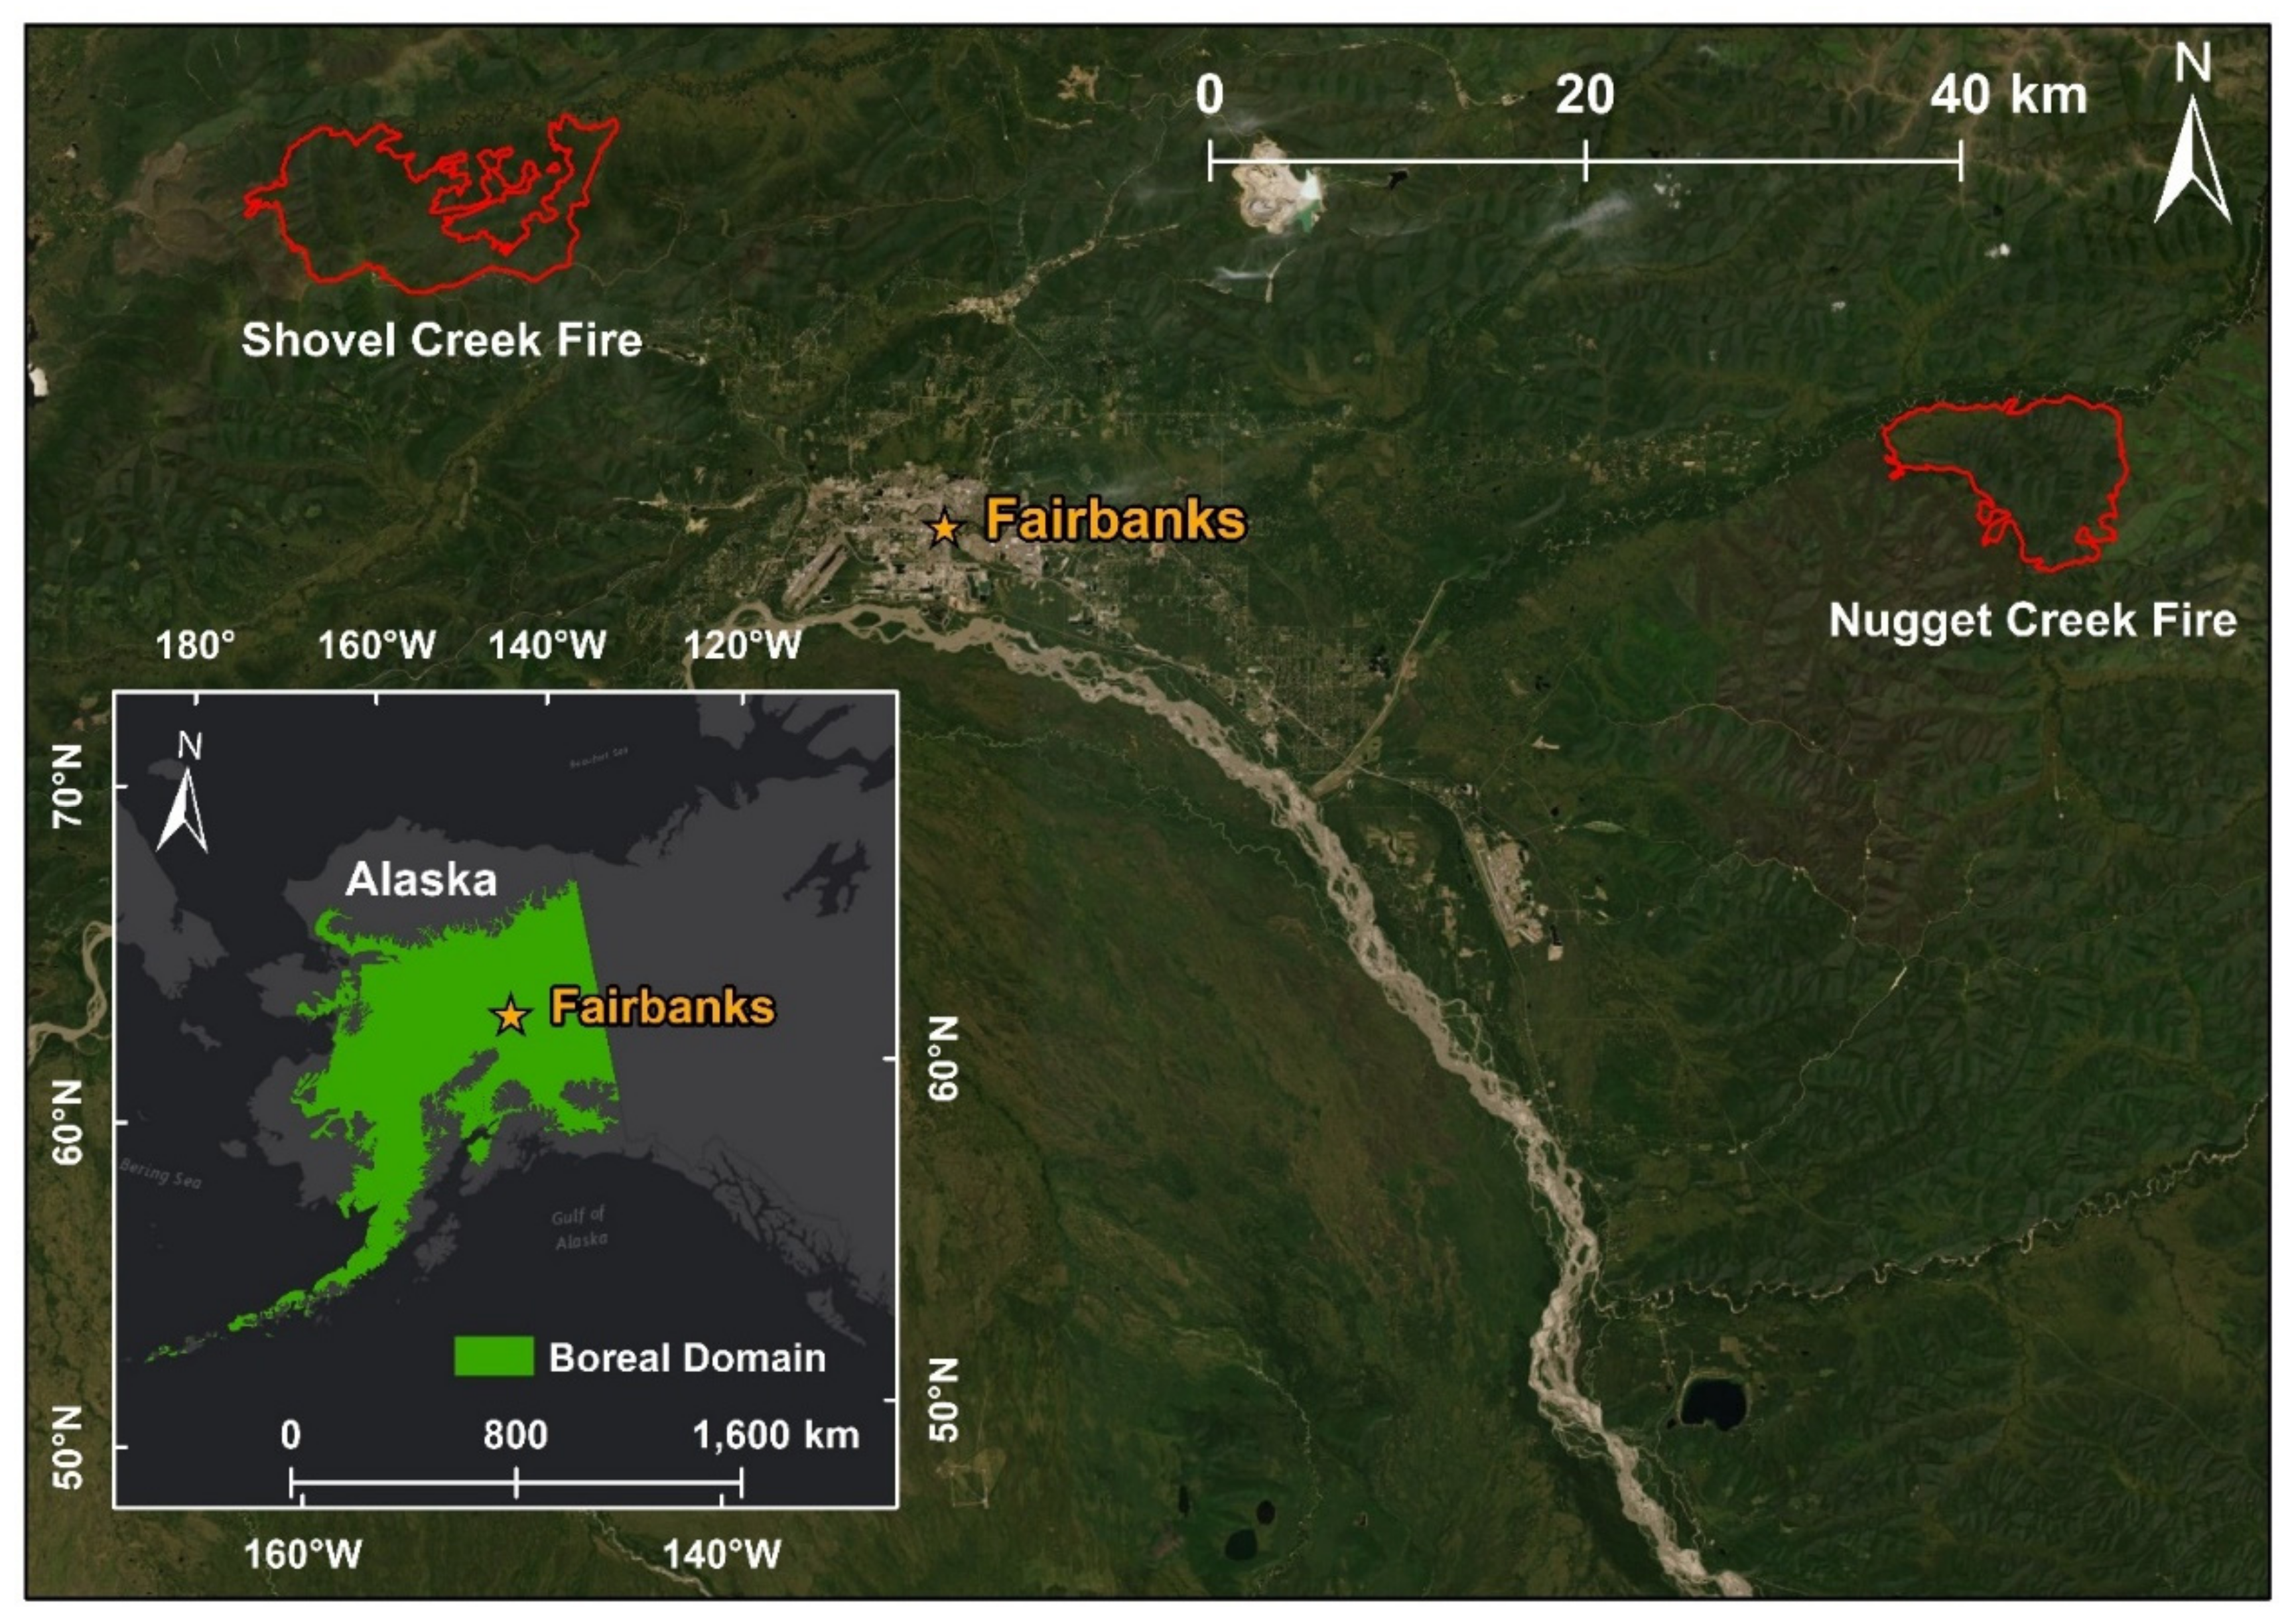
Figure 1. Location of 2019 Shovel Creek fire and Nugget Creek fire burn scars in relationship to the Alaskan Boreal Forest and Fairbanks.
Remotesensing 13 01966 g001
Figure 2. The 52 CBI plots (yellow = training; blue = non-training) surveyed within the Shovel Creek burn scar (left); and the 28 CBI plots surveyed within the Nugget Creek burn scar (right) (red: burn scar outlines).
Remotesensing 13 01966 g002
Figure 3. Image processing workflow for burn severity mapping and accuracy assessment.
Remotesensing 13 01966 g003
Figure 4. Correlation between CBI values and indices with Pearson correlation coefficients for the Nugget Creek fire plots.
Remotesensing 13 01966 g004
Figure 5. Comparison of the Nugget Creek burn severity map products.
Remotesensing 13 01966 g005
Figure 6. Correlation between the CBI values and indices with Pearson correlation coefficients for the Shovel Creek fire plots.
Remotesensing 13 01966 g006
Figure 7. Comparison of the Shovel Creek burn severity map products.
Remotesensing 13 01966 g007
Figure 8. Graphs showing the relationship between slope gradient and burn severity classes (top plots) by site (left: Nugget Creek; right: Shovel Creek) and aspect by burn severity classes (bottom plots). Top left in each panel shows the Spearman correlation and significance of the relationship. Pink lines show the regression.
Remotesensing 13 01966 g008
Table 1. Number of plots surveyed by CBI severity class for the Shovel Creek and Nugget Creek fires.
Shovel Creek FireNugget Creek Fire
Unburned
CBI = 0
1410
Low
CBI = 0.010–1.49
124
Moderate
CBI = 1.50–1.99
127
High
CBI = 2.0–3.0
147
Table 2. Table showing the indices tested and the formula used to calculate them.
IndexFormula
NDVI(B4-B8)/(B4+B8)
NBR(B8-B12)/(B8+B12)
dNDVIPre-fire NDVI—Post-fire NDVI
dNBRPre-fire NBR—Post-fire NBR
Table 3. Accuracy table of the burn severity map products for the Nugget Creek and Shovel Creek fires.
ProductNugget CreekShovel Creek
NDVI96%65%
dNBR89%73%
RF67%83%
NBR75%73%
dNDVI71%60%
SVM67%83%
Table 4. Pre-fire vegetation cover by fuel type in the Shovel Creek and Nugget Creek burn scars as per the AVWC map.
Fuel TypeShovel Creek Cover (%)Nugget Creek Cover (%)
Conifer Forest80.08572.728
Mixed Forest11.78125.495
Shrub4.4271.424
Deciduous Forest3.3700.290
Bare0.3370.061
Grass00.003
Table 5. Type III sums of squares ANOVA results for a full model with burn severity classes (unburned, low, moderate, and high) as response, and aspect, slope, fuel type, and burn scar site as explanatory variables. * indicates significant p-value of less than 0.05.
LRChisqDfPr (>Chisq)
Aspect5.2310.022*
Slope Gradient0.0310.87
Fuel Type0.5520.761
Site4.2710.039*
Table 6. Percent area of each burn severity class by product for the Nugget Creek fire.
Nugget Creek Fire Percent Area by Severity Class
RFSVMNDVINBRdNDVIdNBR
Unburned (CBI = 0)11%11%6%9%9%8%
Low (CBI = 0.01–1.49)22%19%30%35%38%32%
Moderate (CBI = 1.50–1.99)43%39%20%20%24%21%
High (CBI = 2–3)25%32%45%35%29%39%
Table 7. Percent area of each burn severity class by product for the Shovel Creek fire.
Shovel Creek Fire Percent Area by Severity Class
RFSVMNDVINBRdNDVIdNBR
Unburned (CBI = 0)21%21%18%21%16%21%
Low (CBI = 0.01–1.49)8%8%28%21%13%23%
Moderate (CBI = 1.50–1.99)19%13%18%9%5%13%
High (CBI = 2–3)52%58%35%49%66%43%
Publisher’s Note: MDPI stays neutral with regard to jurisdictional claims in published maps and institutional affiliations.