Article

Estimating the Suitability for the Reintroduced Arabian Oryx (Oryx leucoryx, Pallas 1777) of Two Desert Environments by NIRS-Aided Fecal Chemistry

1
Department of Natural Resources, Institute of Plant Sciences, Agricultural Research Organization, the Volcani Center, Bet Dagan 50250, Israel
2
P.O. Box 746, Mount Shasta, CA 96067, USA
3
643 Marva Lane, Eilat 88000, Israel
4
Nature Park Ramat Hanadiv, P.O. Box 325, Zikhron Ya’akov 3095202, Israel
5
Mitrani Department of Desert Ecology, The Jacob Blaustein Institutes for Desert Research, Ben Gurion University of the Negev, Sede Boqer Campus, Midreshet Ben-Gurion 84990, Israel
*
Author to whom correspondence should be addressed.
Remote Sens. 2021, 13(10), 1876; https://doi.org/10.3390/rs13101876
Submission received: 10 March 2021 / Revised: 3 May 2021 / Accepted: 7 May 2021 / Published: 12 May 2021
(This article belongs to the Special Issue Near Infrared Spectroscopy in Animal Ecophysiology)

Abstract

:
The re-introduction paradigm is that Arabian Oryx (Oryx leucoryx) herds adjust the size of their home ranges depending on the availability of vegetation, which is directly related to rainfall. In Israel, Arabian oryx were released in two hyper-arid sites: the Arava Valley and in the Paran wilderness, belonging to the Sudanese and the Saharo–Arabian biogeographic zones, respectively. While post-release survival was similar in both, reproductive success in the Paran wilderness reintroduction site was extremely low, resulting in an acute decline of the reintroduced population over time. The hypothesis that impaired nutrition might be associated with this finding was assessed with near-infrared spectroscopy (NIRS)-aided chemistry of monthly sampled fecal pellets, used as remote sensing evidence of ingested diets, throughout a year. Fecal nitrogen (FN), used as an estimate of nutritional status, was consistently higher in the Arava. Grass was never the sole or even a major dietary component. The dietary contribution of tannin-rich browse was high and steady all year-round in the Arava and increased steadily in Paran from winter to summer, corresponding to the period of availability of Acacia raddiana pods in both regions. The oryx in Paran had a home-range that was ten-fold, compared to the Arava, suggesting less feed availability. Acacia browsing may mitigate the effects of temporal variance in primary production. Under such conditions, oryx should be preferably released in areas that support significant acacia stands.

Graphical Abstract

1. Introduction

The Arabian oryx (Oryx leucoryx, Pallas 1777), a specialized desert ungulate of the Bovidae family, once roamed hyper-arid zones in the Arabian Peninsula, southern Israel, and parts of the Sinai desert, but became extinct in the wild by 1972 due to the fact of uncontrolled hunting. Several reintroduction programs have established wild populations in Oman, Bahrain, Saudi Arabia, and Israel, but the Arabian oryx is still classified as vulnerable on the IUCN Red List (In [1]; IUCN, 2017; criterion D1. Ver 3.1), with only 1220 individuals in the wild, approximately 850 of them mature.
Kleiman et al. [2] suggested 13 criteria to plan and proceed with species reintroduction, one of which is that the habitat is sufficiently protected and a quality food resource exists. Based on the experience of oryx reintroduction in Saudi Arabia, the reintroduction schedule should imperatively take into account the quality and unpredictability of food resources in arid environments [3]. However, often reintroductions take place in areas where extirpation occurred before any on-site nutritional- and habitat-preference studies took place.
Combined with global changes occurring over the past 50 years, from 1997 to date, regions in the historical range of the oryx have become more arid with up to a 25–50% decrease in annual rainfall in southern Israel [4], with rainfall events becoming more local. Thus, the probability of nutritional issues adversely affecting the dynamics of such reintroduced species has increased.
The Arabian oryx reintroduction program in Israel relies on repeated releases from a permanent local breeding nucleus [5]. Animals were first reintroduced in Ein Shahak in the Arava Desert in 1997–8: thirty-one (9 males and 22 females) individuals, in two releases of which 19 carried very high-frequency (VHF) collars. Between 2000 and 2002, three releases were carried out in the Paran wilderness, totaling 40 (20 male and 20 female) individuals of which 37 carried VHF collars. Animals were relocated regularly several times a month, either by direct observation after locating them by triangulation or remotely by triangulation alone with no direct line of sight. The two release areas border each other but belong to different biogeographical zones: the Arava Valley is in the Sudanese biogeographic zone and the Paran wilderness lies in the Saharo–Arabian biogeographic zone. The dynamics over the first post-release years differed considerably between the two sites: whereas the oryx population in the Arava grew in the first 5 years from 31 to an estimated >50 individuals, that in Paran declined from 40 to 14 individuals by January 2007. Though possible in the study area, predation on oryx by wolves (Canis lupus) has never been evidenced.
Observations indicated that the main cause of poor performance at Paran was low recruitment and not adult mortality, as mortality rates did not differ between sites. Specifically, very few births have been recorded in the Paran (2.6 ± 0.8 birth/year ≅ a reproductive success of 0.2)—far lower than needed for a positive growth rate [6]. By contrast, in the Arava, the annual birth rate was estimated at 0.6. Of the thirty-seven radio-collared oryx in Paran, twenty-three died over the 7 years after the first release. In the Arava, of the nineteen radio-collared animals, seven died over the first 3 years.
Drinking water is freely available year-round in both areas, but in the 2nd y after release, the home range size of the Paran herd was 10 times that of the Arava herd [7], suggesting, according to Stanley Price [8], that food availability was greater in the Arava than in Paran. No calving seasonality was reported for oryx in Oman. Conception rates peaked following good nutritional conditions, and the proportion of desert-born animals in each month was correlated to dietary crude protein in the 60 days preceding and 30 days following parturition. The chances of an oryx being fecund in any year of its life decreases at low levels of dietary crude protein in the preceding year [9]. In Saudi Arabia, rates of conception were lower during droughts [10].
Given the above information, we hypothesized that the poor performance of the Paran herd was nutrition related. However, monitoring the nutrition of oryx is a challenging task, because they are shy animals that do not tolerate humans at close proximity, ruling out direct observations of food choice. Immobilization by darting for weighing and blood sampling was also ruled out as oryx are over-reactive to darting and immobilization [11]. Radio-tracking may be instrumental in locating their grazing circuits but, because the oryx exhibits selective feeding behavior, randomly clipped vegetation is not representative of consumed diets. Consequently, we decided to assess nutrition by collecting fecal material. This protocol does not necessitate direct handling of the animals. Fecal pellets have the advantage of being representative of one animal and one diet; hence, fecal collection and the use of chemical fecal indicators represent a remote sensing evaluation of individual diets.
Fecal N (FN) was the first fecal indicator used to monitor nutrition [12] and is still the most used indicator of nutrition, but its use is controversial [13]: FN is mainly of metabolic, mostly microbial origin [14], and it must be used with caution because it is associated with dietary energy content as much as with dietary N [12,14] and is affected by dietary tannins [13]. In their review of the uses and misuses of FN in wildlife nutrition studies, Leslie and Bowyer [13] stressed the need for information on tannins when applying FN and endorsed the use of FN only with regard to comparable study units and within a species. Another concern could be loss of N in the form of volatile ammonia, but, in deserts, the release from fecal pellets of N to ammonia and ammonium salts is inhibited, as the moisture holding capacity is less than 25% [15].
Other fecal indicators have been used to monitor nutrition in grazing animals: although fiber is digested, fiber fractions, and, specifically, acid detergent fiber (ADF) in feces, were well correlated with dietary fiber in gazelles [16]; a positive correlation was found between fecal lignin and the amount of lignaceous forage in the diet of white-tailed deer [17]; and fecal ash was positively correlated with grazing cattle density [18].
Browse, in particular acacia trees, is rich in tannins [19] and in lignin but contains less neutral and acid detergent fiber (NDF and ADF) than mature grasses. NDF, ADF, and lignin (generally measured as acid detergent lignin (ADL)) contents are low in young herbage but accumulate quickly as grass matures [13]. Fecal lignin [17] and condensed tannins [20] are of dietary origin and, although their fecal recovery is not perfect, both are mainly undigested. Therefore, high fecal concentrations of lignin and condensed tannins are indicative of lignin- and tannin-rich dietary plant material, respectively. Measurements of FN, fiber attributes, and tannins enable defining three main categories of diets: (i) feces high in N and low in lignin and tannin that originate mainly in lush green herbaceous species; (ii) feces low in N and tannin but high in lignin, NDF, and ADF represent diets rich in mature annual or perennial grasses; (iii) feces high in N, tannin, and lignin, but of medium NDF and ADF contents reflect diets rich in browse. Recently, using these categories, the seasonality of diets ingested by Neolithic goats has been elucidated, based on the contents of N and fiber attributes in well-preserved fecal pellets in the Negev desert of Israel [21].
The use of near-infrared spectroscopy (NIRS) greatly reduces the cost of analyses of feces and provides accurate estimates of a wide array of fecal attributes. First pioneered in 1996 [22], NIRS has become the method of choice where high throughput analyses of fecal chemistry are needed: till 2009, Dixon and Coates [23] listed 21 and 14 studies that used NIRS-aided determination of fecal N and fiber attributes, respectively.
Our hypothesis was that the recorded differences in oryx population dynamics were diet related and sprang from the differing ecological conditions between the two release sites. To substantiate this hypothesis, we used NIRS-aided fecal chemical attributes, as a remote sensing estimate of diets consumed, to compare oryx nutrition in the two release sites throughout a year.

2. Materials and Methods
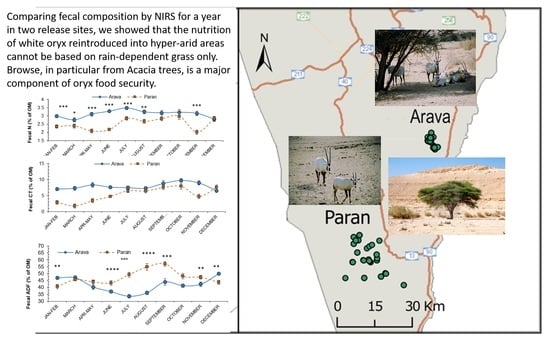
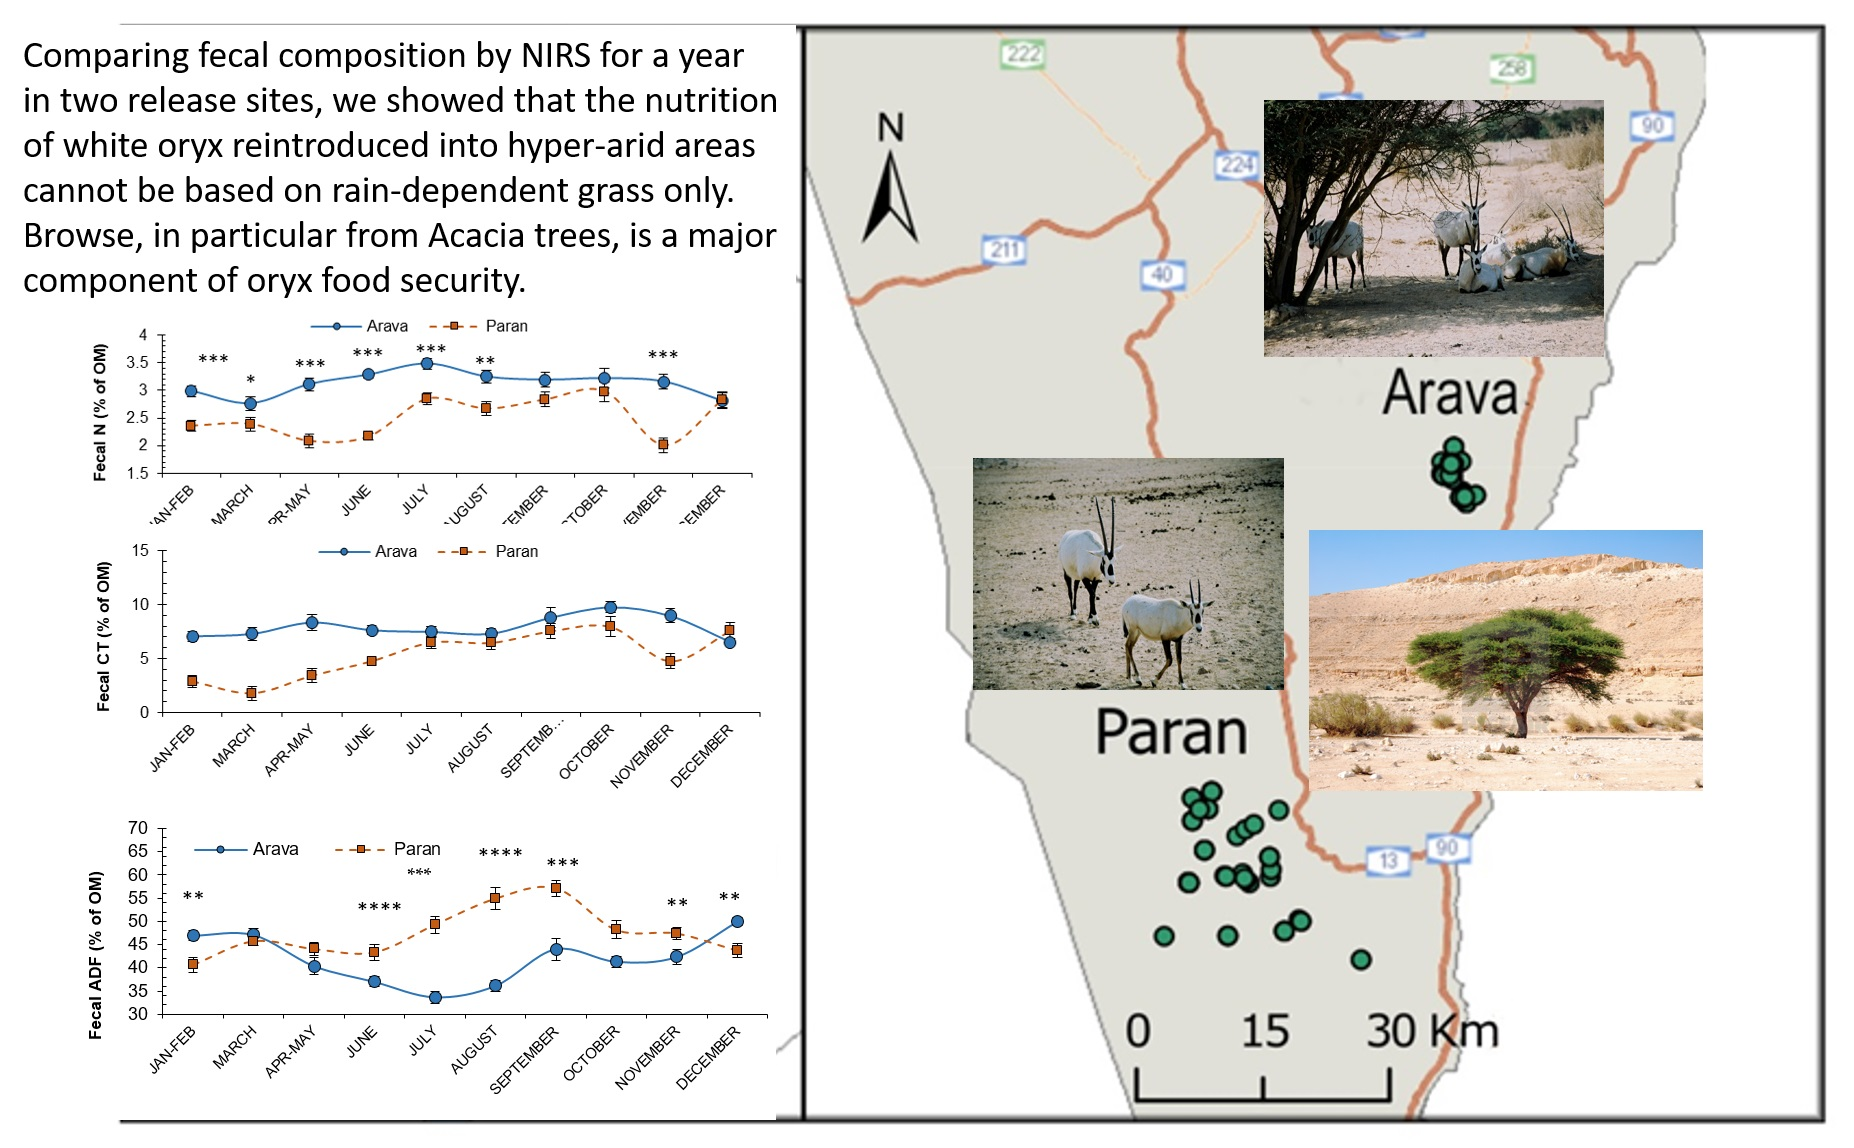
2.1. Study Area

We conducted the field study from December 2004 to January 2006 in the two oryx release regions: the Arava desert, belonging to the Sudanese biogeographic zone, and the Wadi Paran wilderness and its tributaries south of the Negev mountains belonging to the Saharo–Arabian biogeographic zone (Figure 1).
The Arava release site (30°48′ N, 35°15′ E, −125 m a.s.l.), located in a part of the Rift Valley system, receives an average annual precipitation of approximately 40 mm, with at least one flood per year in the larger wadis; in contrast, the average annual precipitation in the Paran site (30°21′30 N, 35°9′15 E, 100 m to 500 m a.s.l.) is 25 mm, and flood-free years are common.
While vegetation communities differ somewhat between the two zones, it is typically concentrated in the wadis of both of them. The landscape is dominated by Acacia trees, and the wadis resemble East African savannas but with accompanying Saharo–Arabian species (Paran), with few or no perennial grasses in either region. Acacia raddiana (Savi) is widespread over the entire Negev desert, whereas the sympatric species, A. tortilis (Forssk.), occurs only in the warmer Arava Valley and, conversely, A. pachyceras (O. Schwartz), thrives only in the Negev heights above 400 m a.s.l. and is not found in the Arava.
All Acacia trees are evergreen but shed some of their leaves in winter, and in the Israeli dry season behave as in the African wet season, bearing their fruit in summer [24]. However, there are major differences in the value of their fruits as forage. In A. raddiana and A. tortilis full seed pods begin to shed in June and July, respectively, until August, whereas the fruit of A. pachyceras sheds its seeds from October to December, and the empty pods fall down gradually. Apart from Acacias, the bushes Ochradenus baccatus (Delile) and saltbush (Atriplex halimus L.) anecdotally represent important sources of browse. Germination of annuals occurs typically in December but is greatly affected by the timing and amounts of precipitation.
Drinking water is freely available year-round in both areas from permanent oases.

2.2. Fecal Sampling

Because the reintroduced populations ranged over military firing zones, we collected fecal samples from the field only on weekends, when the firing zones were open to civilians. We did this on three weekends per month: two in the Paran area, where locating the animals was difficult, and one in the Arava area [25]. Collection was from wadi beds where the herd was relocated by triangulation in each specific outing. Altogether, we collected a total of 228 fresh samples of individual oryx feces from February 2005 to February 2006, in 20 and 30 locations sites in the Arava and Paran, respectively, that were known to be visited recently by the oryx. Because the Paran site was closed also during a few weekends, some months—January, February, April, and May—had an insufficient number of samples available. We therefore merged the data from each pair of months, thus obtaining 10 periods for analysis.

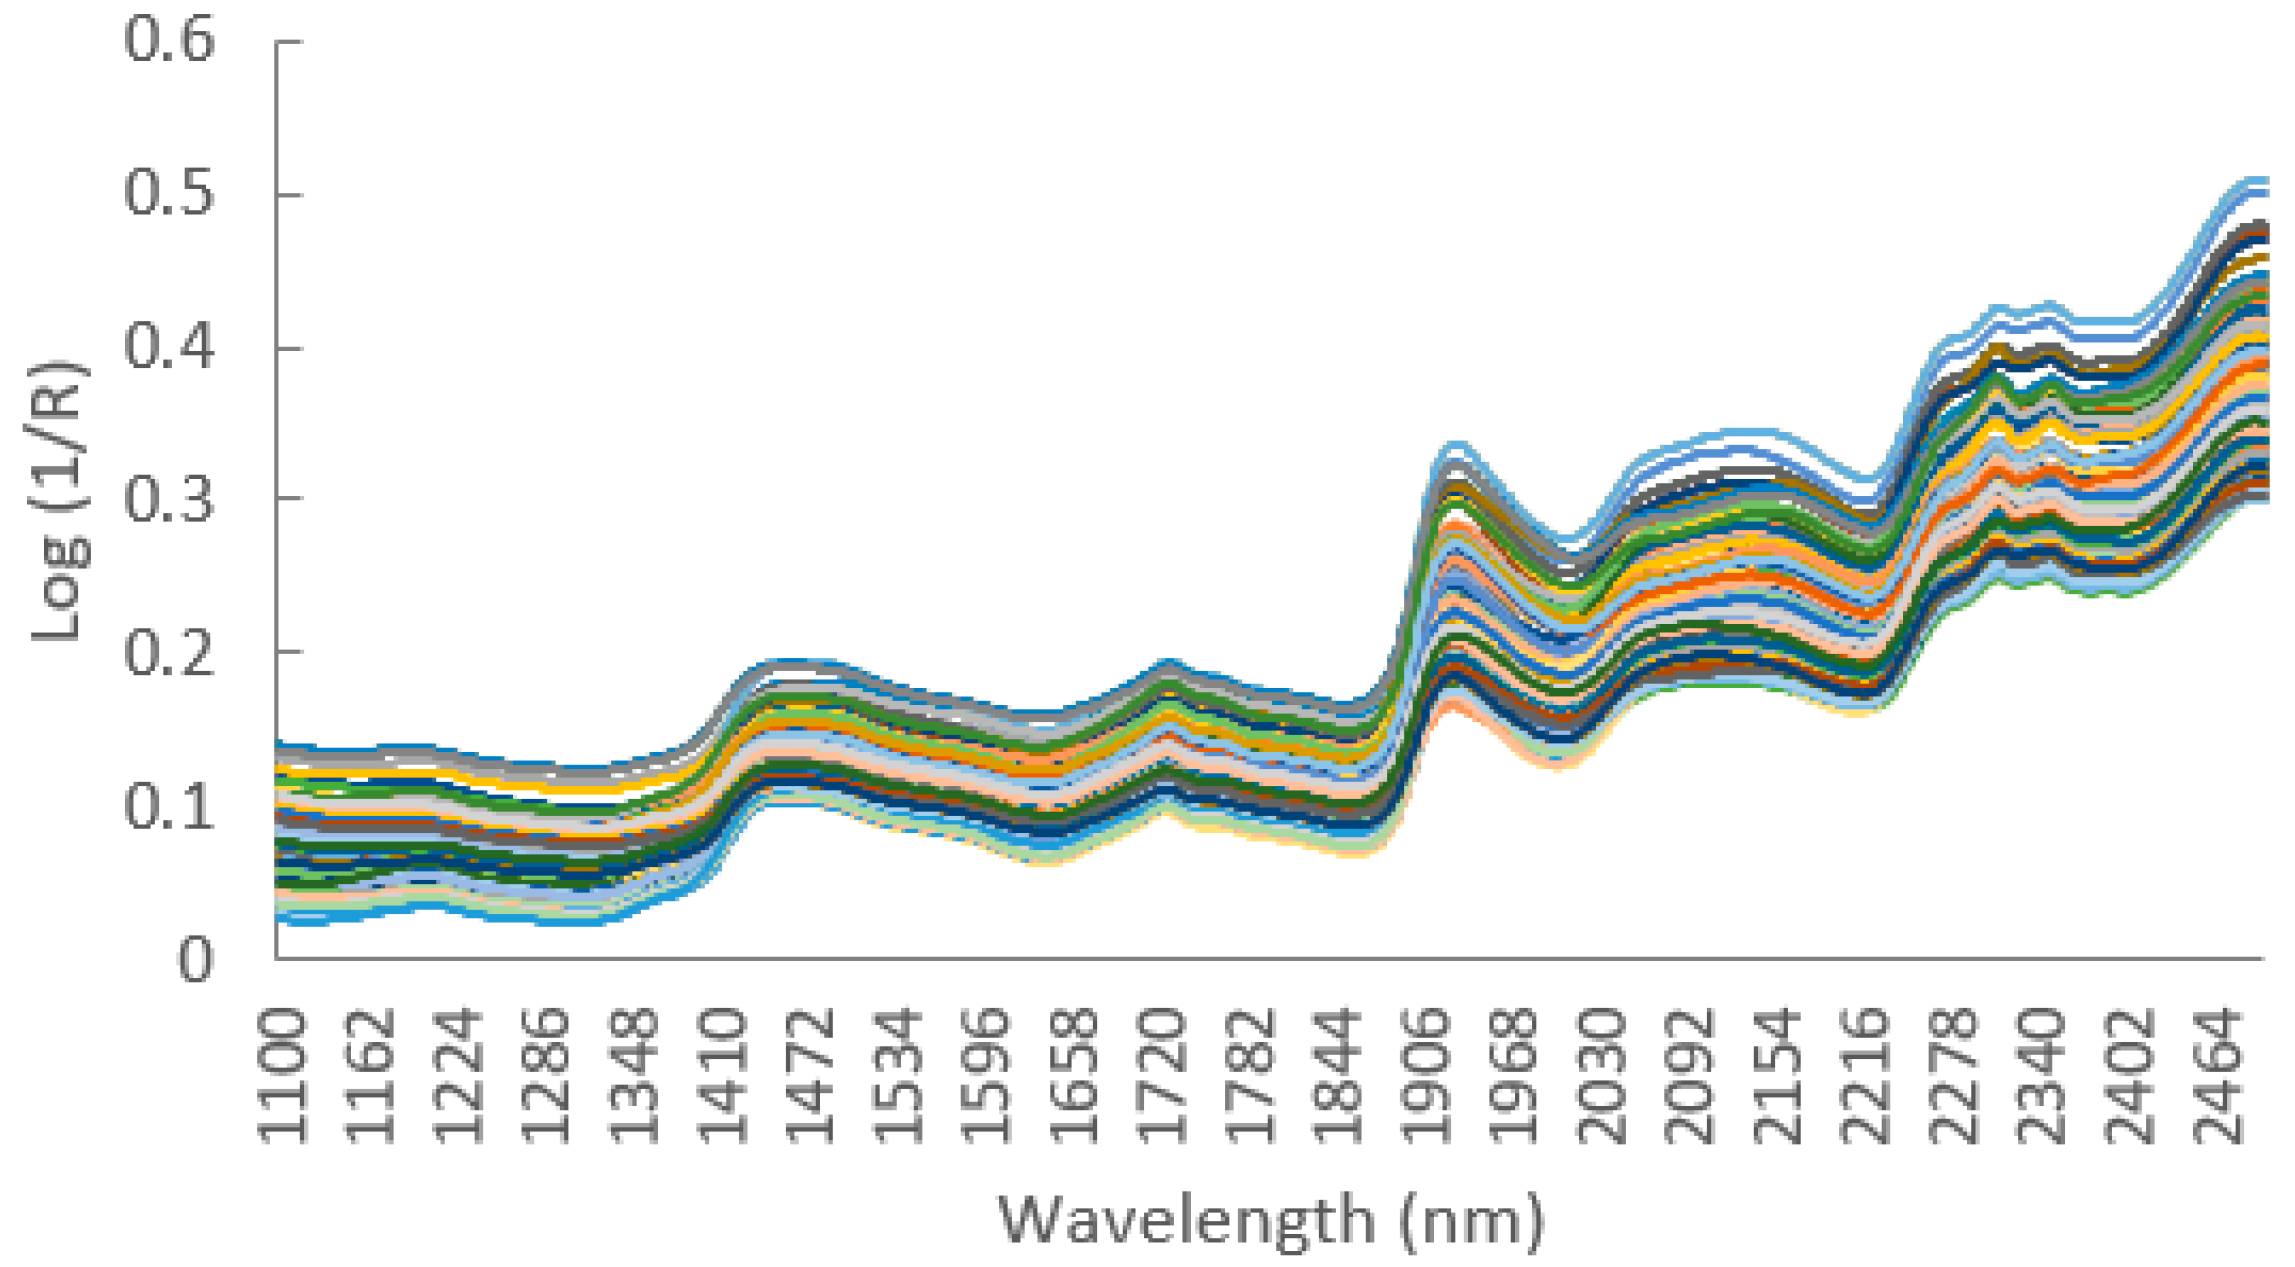
2.3. Chemical Analyses

In order to collect NIR spectra as log (1/R)—where R = reflectance—fecal samples were scanned between 1104–2492 nm in 2 nm increments using a Foss NIRSystems 5000 NIR reflectance monochromator spectrometer (Foss Tecator, Hoganas, Sweden) as described before [18,21]. For all NIRS calibration procedures, we used the WinISI II V 1.02 software (Infrasoft International LLC, State College, PA, USA).
Before the development of calibration equations, raw spectral data were transformed with the standard normal variate and detrend procedures to remove the non-linearity that results from light scattering. Mathematical treatments were used to enhance spectral differences where “1, 4, 4, 1” or “2, 6, 6, 1”, where the values represent the derivative, the gap width over which the derivative was calculated, the number of points in a moving average (i.e., first smoothing procedure), and the number of nm over which the second smoothing was applied. Calibration equations were developed on the treated spectral data, using the modified partial least squares routine of the WinISI II software in which stored NIRS spectra from fecal samples were the independent variables, and nutritional attributes or chemical composition were the dependent reference data. Calibration precision was assessed according to the multiple coefficient of determination (R2), i.e., the proportion of variability in the reference data accounted for by the regression equation. The standard error of calibration (SEC)—defined by the variability in the differences between predicted and laboratory (reference) values—was calculated. The calibration accuracy was evaluated by a cross-validation procedure, and the estimate of accuracy was the standard error of cross-validation (SECV), i.e., the average root mean square difference between predicted and reference values when the equation was calculated and applied sequentially to subsets (of which there were 4 in the present study) of data from the calibration data set. R2cal and R2CV served as estimates of linearity, or precision, in the calibration and cross-validation equations, respectively.
Fecal samples were re-dried at 60 °C for 1 h and allowed to equilibrate in a desiccator at ambient temperature for 1 h before NIR scanning. Then, they were packed into sample cells with a near-infrared transparent quartz cover glass, and three spectra were taken for each sample and then averaged. We used NIRS to analyze the fecal chemistry with the aid of a database comprising oryx fecal pellets collected in the study area, for which we assayed FN (n = 103), fecal ash (FASH, n = 103), fiber constituents (n = 59) composed of fecal neutral detergent fiber (FNDF), fecal acid detergent fiber (FADF), and fecal acid detergent lignin (FADL). Approximately half of the fecal samples were collected in the Arava and Paran and analyzed in 2004; the remainder were 4–6 samples collected monthly in the two sites of the present study and assayed for fecal properties.
The calibrations used to determine forage nutritional attributes were issued from a wide database encompassing grazed species in the Negev desert of Israel.
In order to provide reference values for the NIRS calibrations of fecal chemistry, we assayed for FN and fecal fiber (FNDF, FADF, and FADL) using the same methods generally used for feeds, which are recognized by the AOAC [26] as official procedure no. 989.03. We assayed FN with an automated Kjeldahl method (no. 976.05; AOAC [26]) and FNDF, FADF, and FADL according to Goering and Van Soest [27]. To assay fecal condensed tannins, we used NIRS equations calibrated as described in [28], with reference values for condensed tannins (CTs) assayed by the procedures described by Makkar [29] and which are presented as percentages of catechin equivalents on an organic matter (OM) basis. The calibration for CTs encompassed 55 plant samples and 45 fecal samples from captive oryx-fed diets varying within a wide array of CT contents (see [25]). Merging CT contents in feeds and feces was associated with increased spectral variety and better calibration performance. Fecal ash was obtained by incineration in a muffle furnace at 500 °C overnight.
We also analyzed N, fiber attributes, and condensed tannins for the major species of browse found in the vicinity of feces. We evaluated the in vitro dry matter digestibility (IVDMD) in feeds following Tilley and Terry [30]. All NIRS calibration procedures were according to [31]. We present the NIRS calibration equations in Table 1.

2.4. Statistical Analyses

As standardized H distance (H or Mahalanobis distance) higher than 3 standard deviation (SD) units from the mean are used to exclude spectral outliers from a population, before applying NIRS equations to the field samples, we verified that the spectral distances from our samples to the centroid of the NIRS calibration samples were <3, as expressed in standard deviation units, to ensure that the study field samples and calibration samples belonged to the same statistical population [32]. We also used H to verify that all spectral samples belonged to one population, to justify the use of FN according to the criterion “with regard to comparable study units and within a species” of Leslie and Bowyer [13].
We verified that all measurements of fecal chemical properties exhibited normal distributions by applying the Shapiro–Wilk test, using the SAS PROC UNIVARIATE procedure, and then applied an unbalanced general linear model using the SAS PROC GLM [33] to study the effects on these properties of the location of fecal collection (Arava or Paran), “month”, and their interactions. We did not use a repeated measurement procedure, because there was no evidence that the feces collected in different months were dropped by the same animals; rather, we considered samples to have been defecated by random animals from the whole herd at each of the two locations. The location × month interaction was significant for all fecal attributes; therefore, we also ran t-tests for comparisons of means on a monthly basis. We calculated Pearson correlations between the various attributes of fecal composition, averaged by month.

3. Results

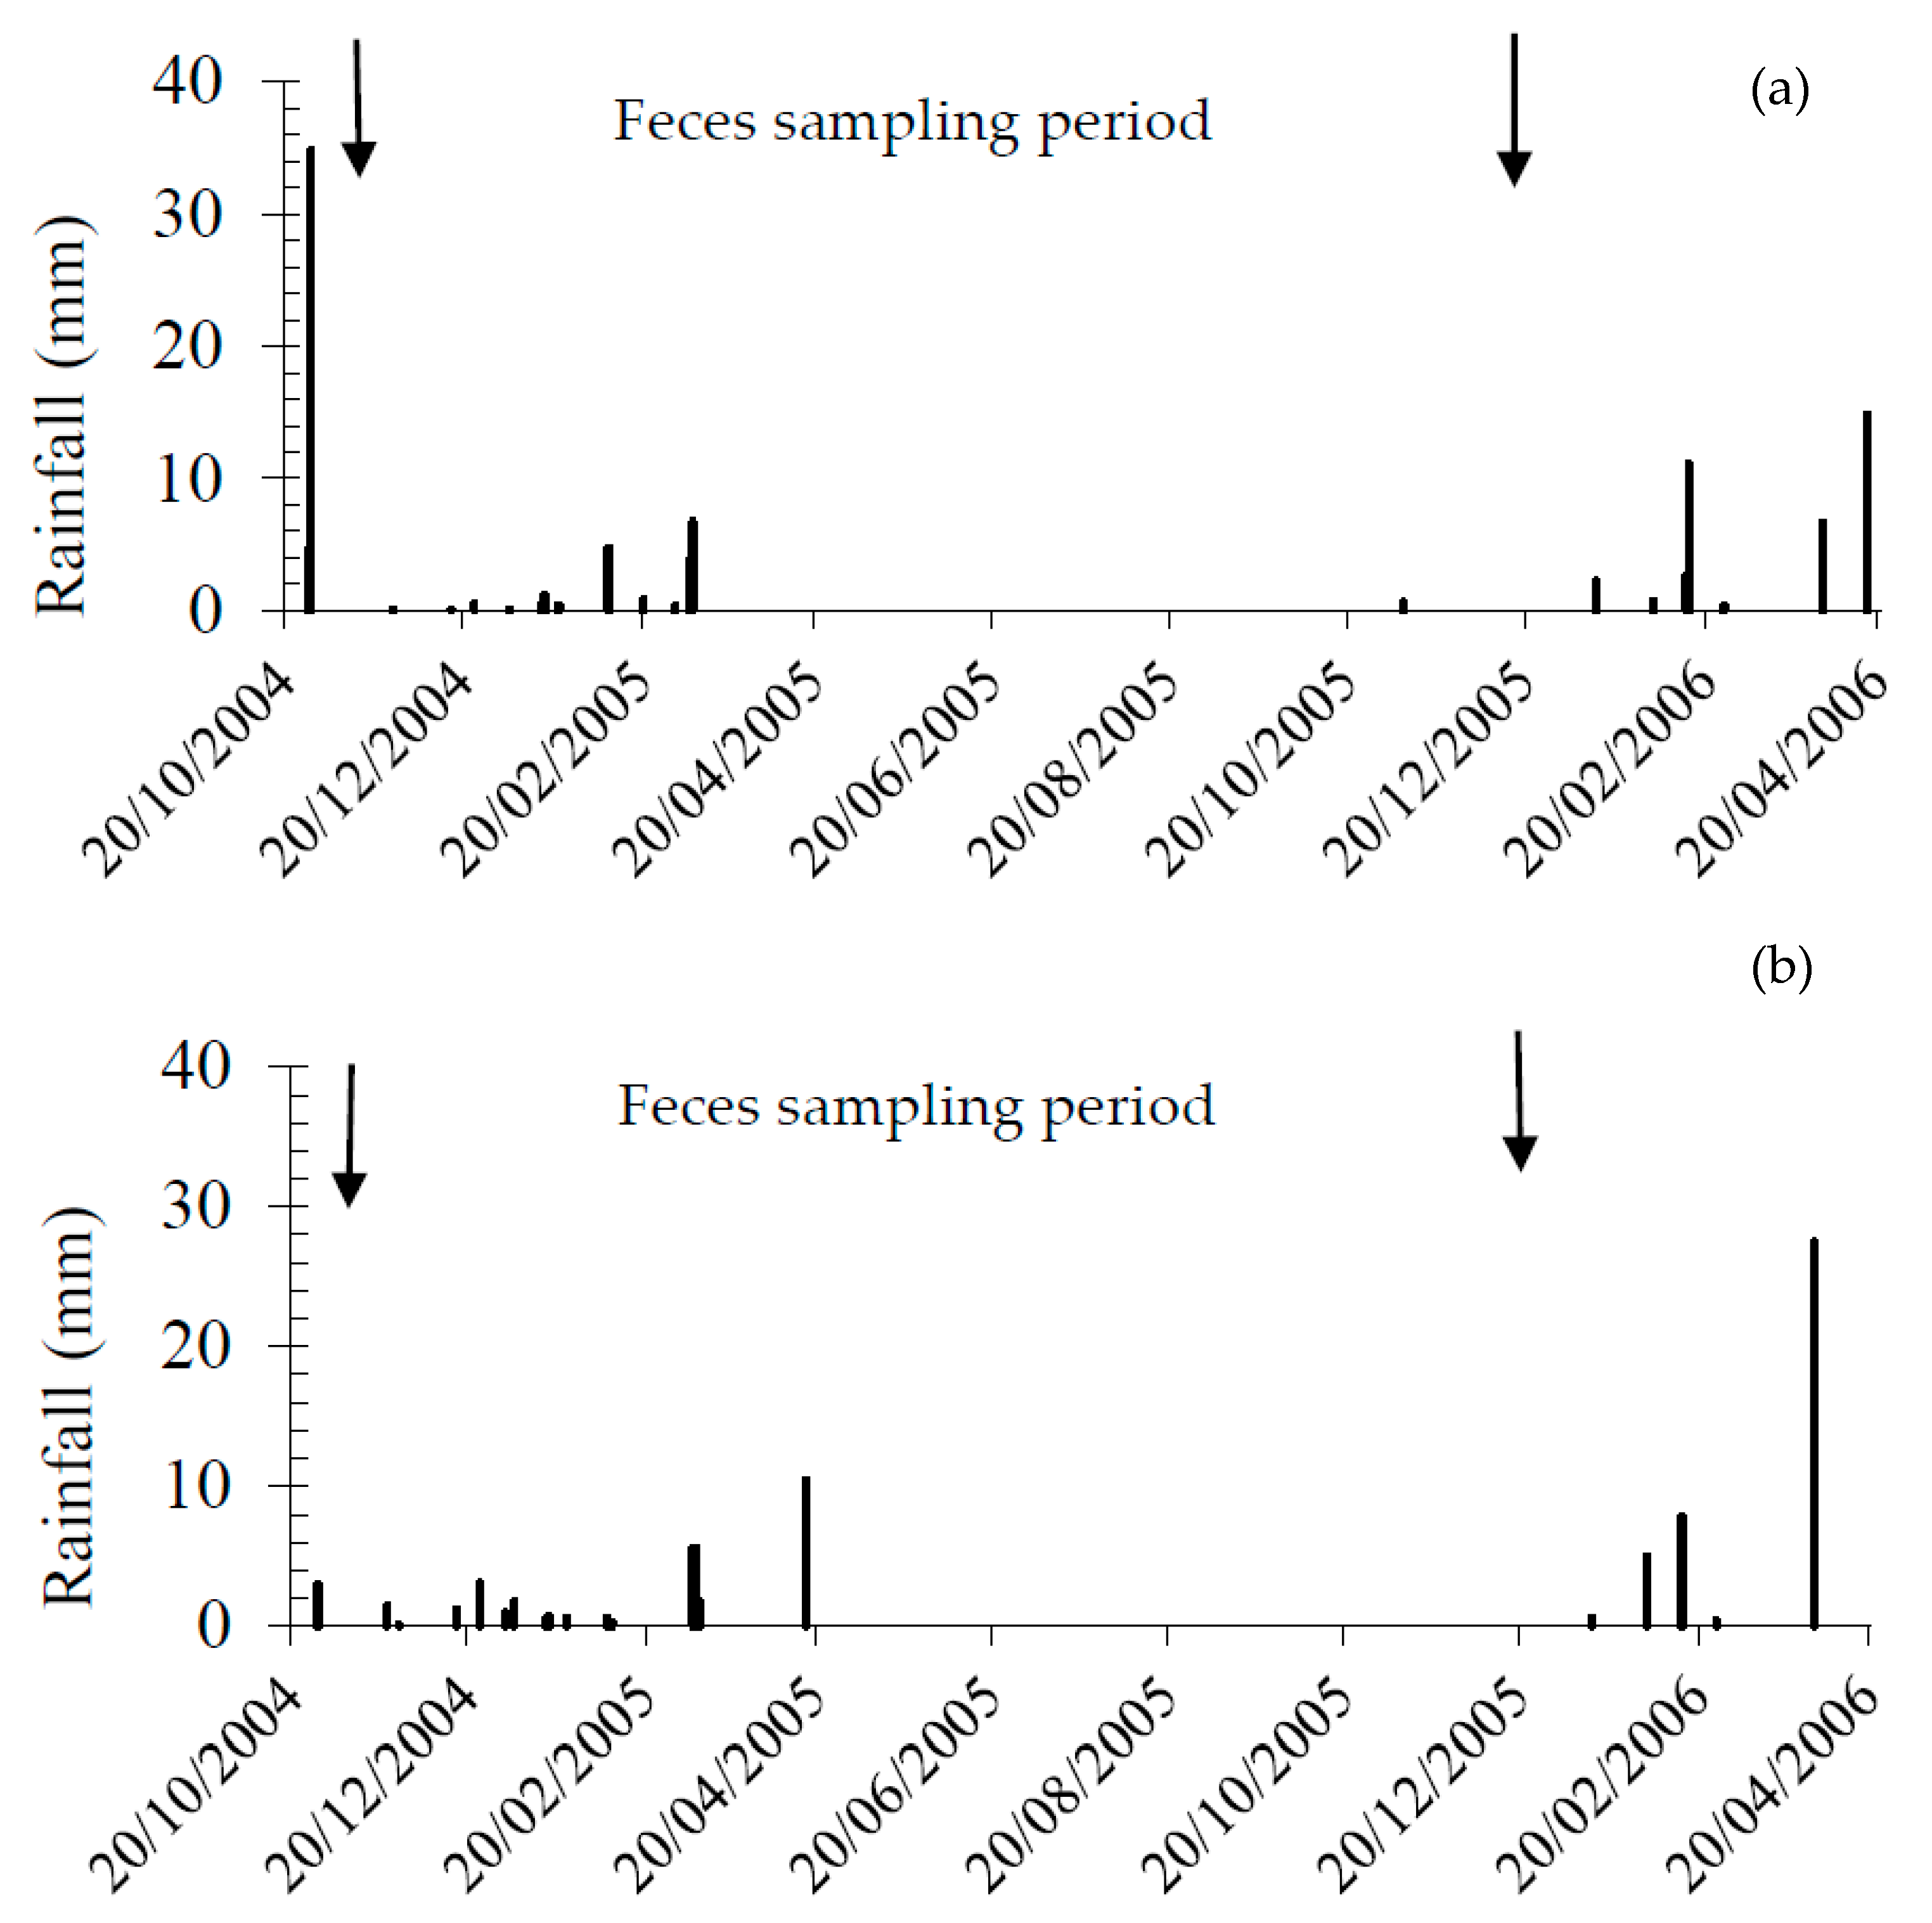
3.1. Habitat and Rainfall

The sampling areas extended over 4 × 6.6 km2 and 16 × 17 km2 in the Arava and Paran release sites, respectively (Figure 1).
Rainfall during the sampling year is depicted in Figure 2. A major difference was found between sites: a significant rain downpour occurred on 28 October 2004 in the Arava (34.9 mm) but not in Paran (1.1 mm, only), two months before fecal sampling was initiated. Rainfall of more than 5–6 mm in an event causes flood. Mass annual germination follows floods in autumn (October–November), and winter and spring rains are less effective for annual germination. As germination of annuals occurs typically in December, it could infer that more annual grass was available in the Arava in spring 2005. Apart from this event, throughout the study there were no significant rain events and, thus, annual germination was expected to be low, especially in Paran. In addition, the significant Arava rain event in late October would contribute to the greening of the acacia trees.

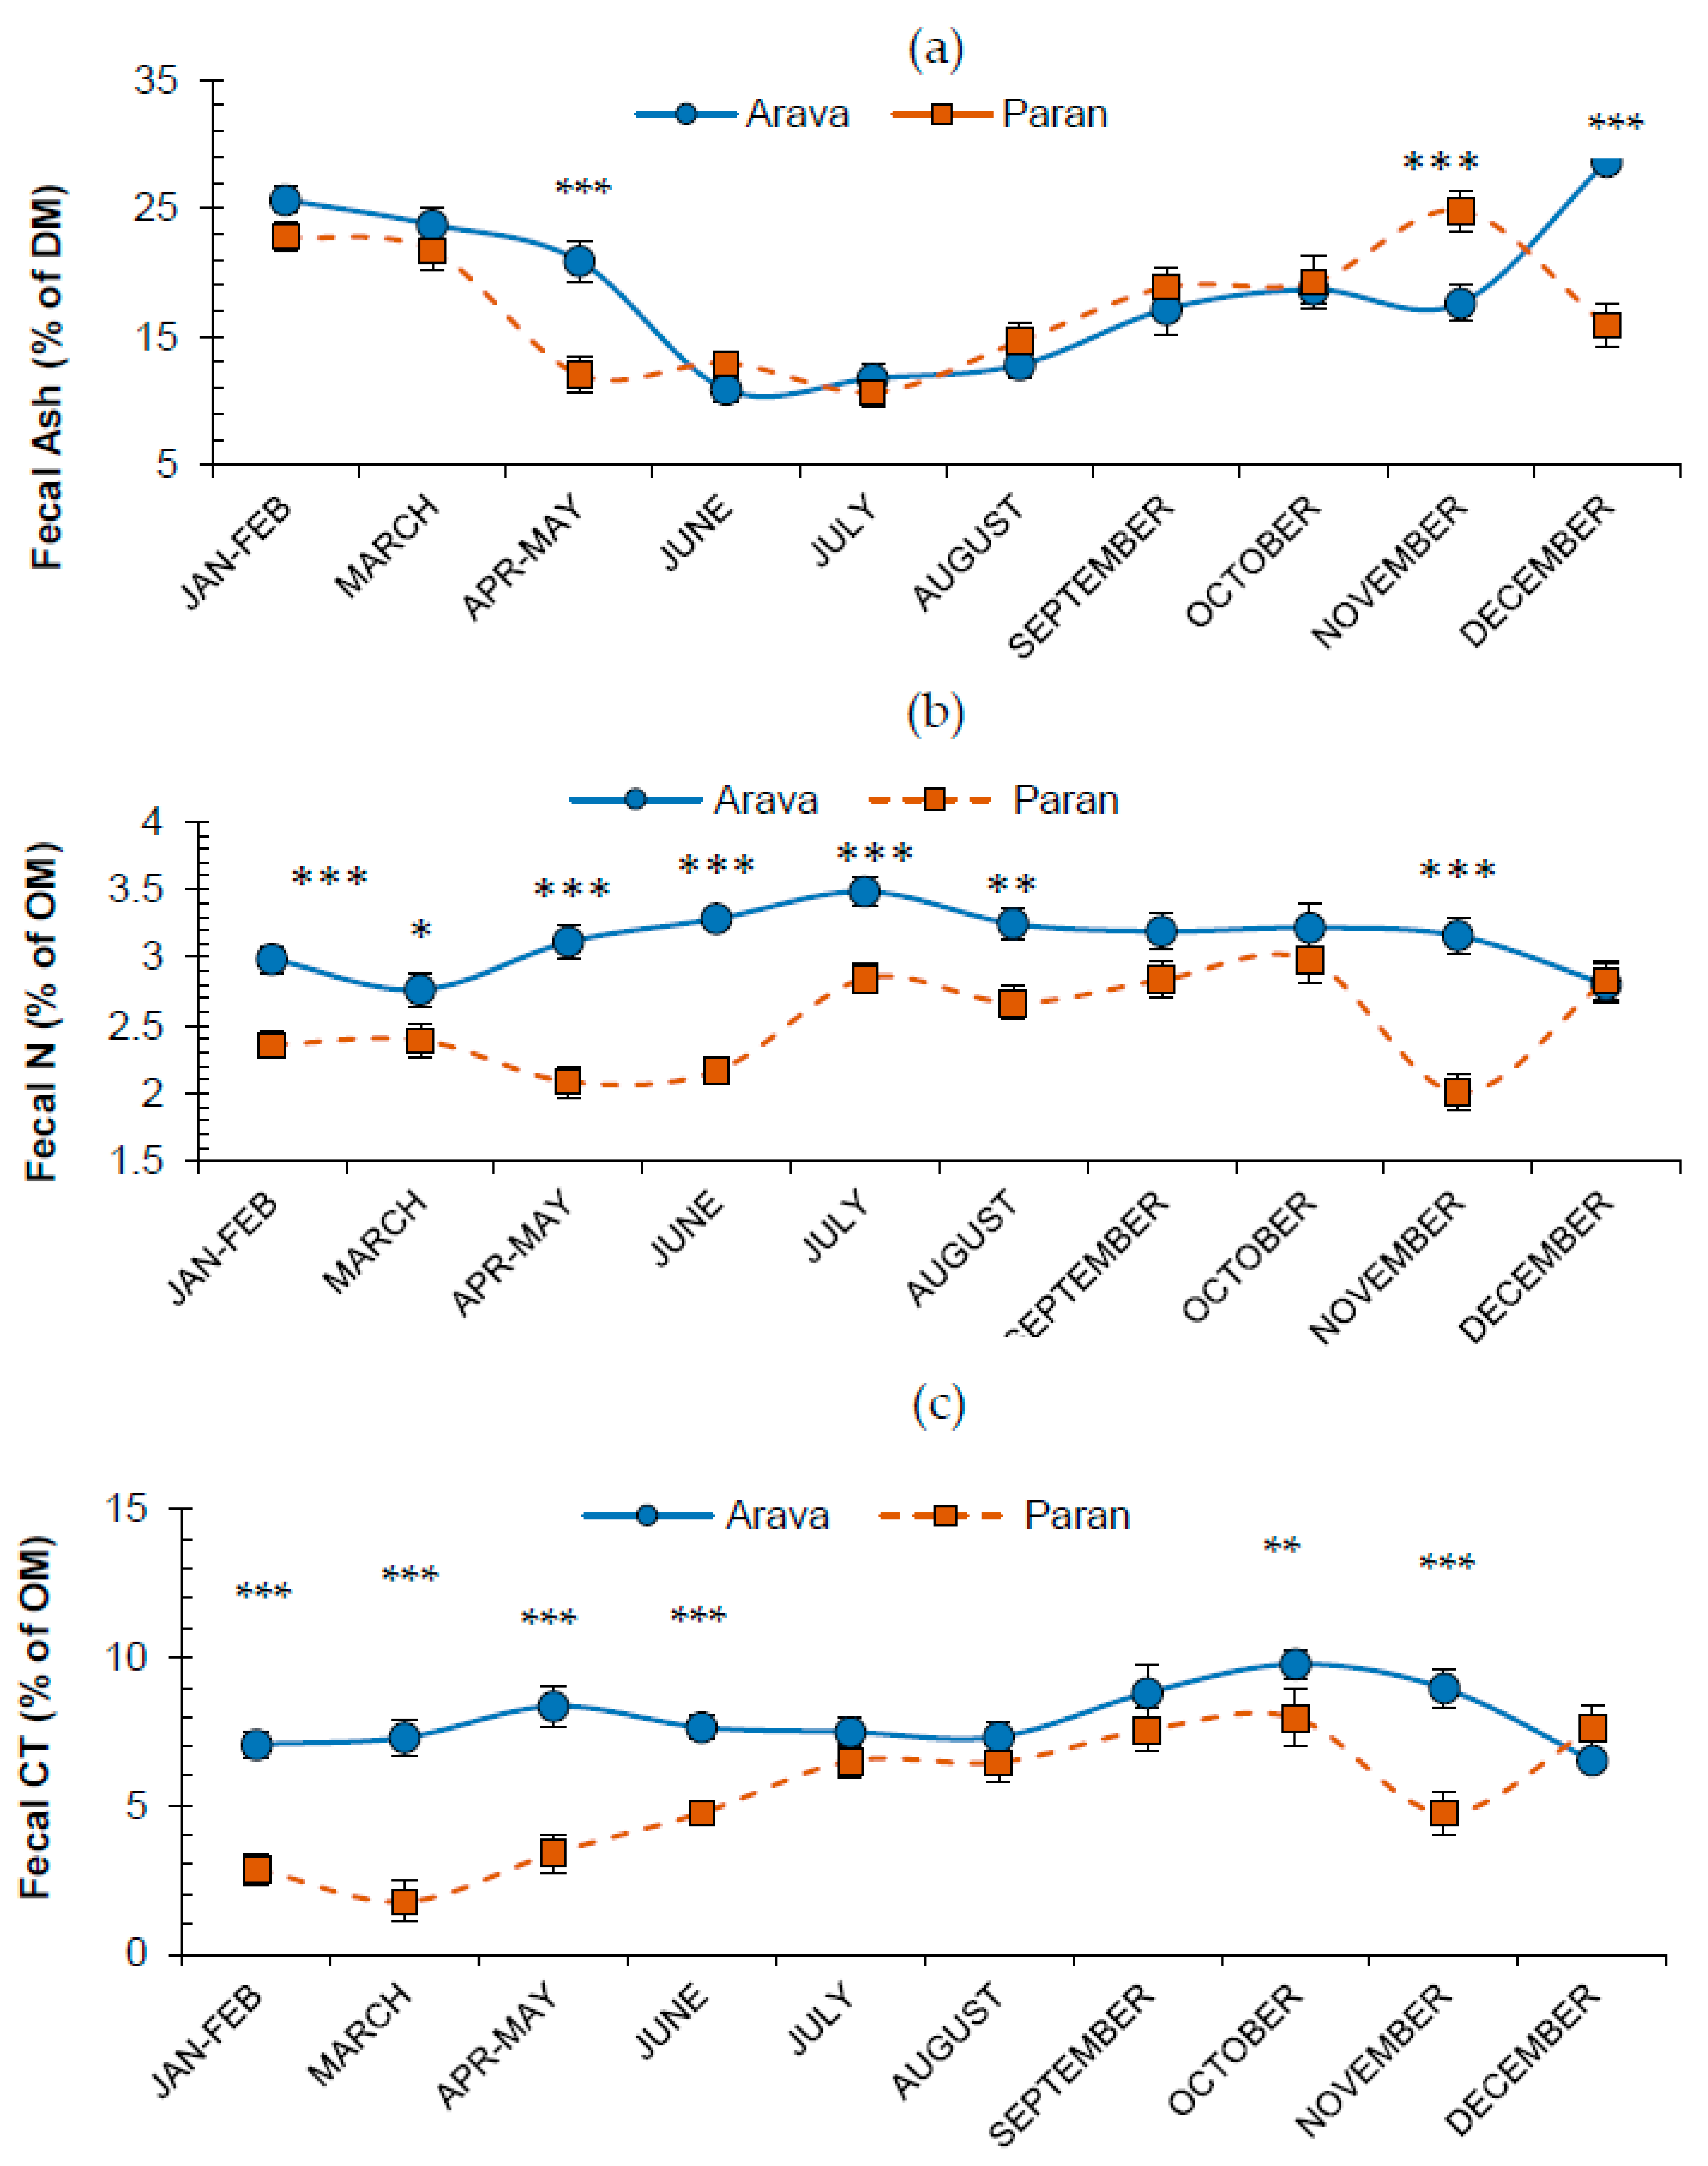
3.2. Effects of Release Site and Month on Fecal Attributes

Untransformed fecal spectra (n = 228) are presented in Figure 3.
The average and median NIR spectral distances (Mahalanobis H values) from the centroid of the Arava spectral population to Paran spectral centroid were 2.6 and 2.3 (expressed as SD values of the Arava population), respectively. Therefore, chemically, all fecal samples belonged to one spectral population.
Fecal ash was affected by location, by month of collection and interaction (F1,227 = 9.40, p < 0.0001; and F9,227 = 34, p ≤ 0.0001; F9,227 = 10.8, p ≤ 0.0001, respectively) (Figure 4). The annual patterns of FASH were similar in both locations: unimodal with a maximum in autumn––winter and a minimum in early summer. We recorded a lag period between Paran and the Arava: the decrease in FASH occurred in April–May in Paran and in June in the Arava. In light of the amplitude of the FASH curve, there was a concern that FASH could be affected by fecal pellets being dust-encrusted in the time elapsed from defecation to collection, and we decided to present the results of all fecal attributes on an OM basis (Figure 4, Figure 5 and Figure 6).
Location, month, and their interaction affected all fecal attributes, as expressed on an OM basis: FN (F1,227 = 138, p < 0.001; F9,227 = 10.2, p < 0.001; F9,227 = 6.56, p < 0.001, respectively), Fecal CT (FCT; F1,227 = 94.0, p < 0.001; F9,227 = 14.1, p < 0.001, F9,227 = 5.54, p < 0.001, respectively), FNDF (F1,227 = 29.1, p < 0.001; F9,227 = 52.2, p < 0.001, F9,227 = 18.6, p < 0.001, respectively), FADF (F1,227 = 81.8, p < 0.001; F9,227 = 18.6, p < 0.001, F9,227 = 5.54, p < 0.001, respectively), and ADL (F1,227 = 6.40, p < 0.05; F9,227 = 18.6, p < 0.001, F9,227 = 9.32, p < 0.001, respectively).
As the interaction of location x month was significant for all fecal estimates, t-tests were used to compare the effects of location on a monthly basis.

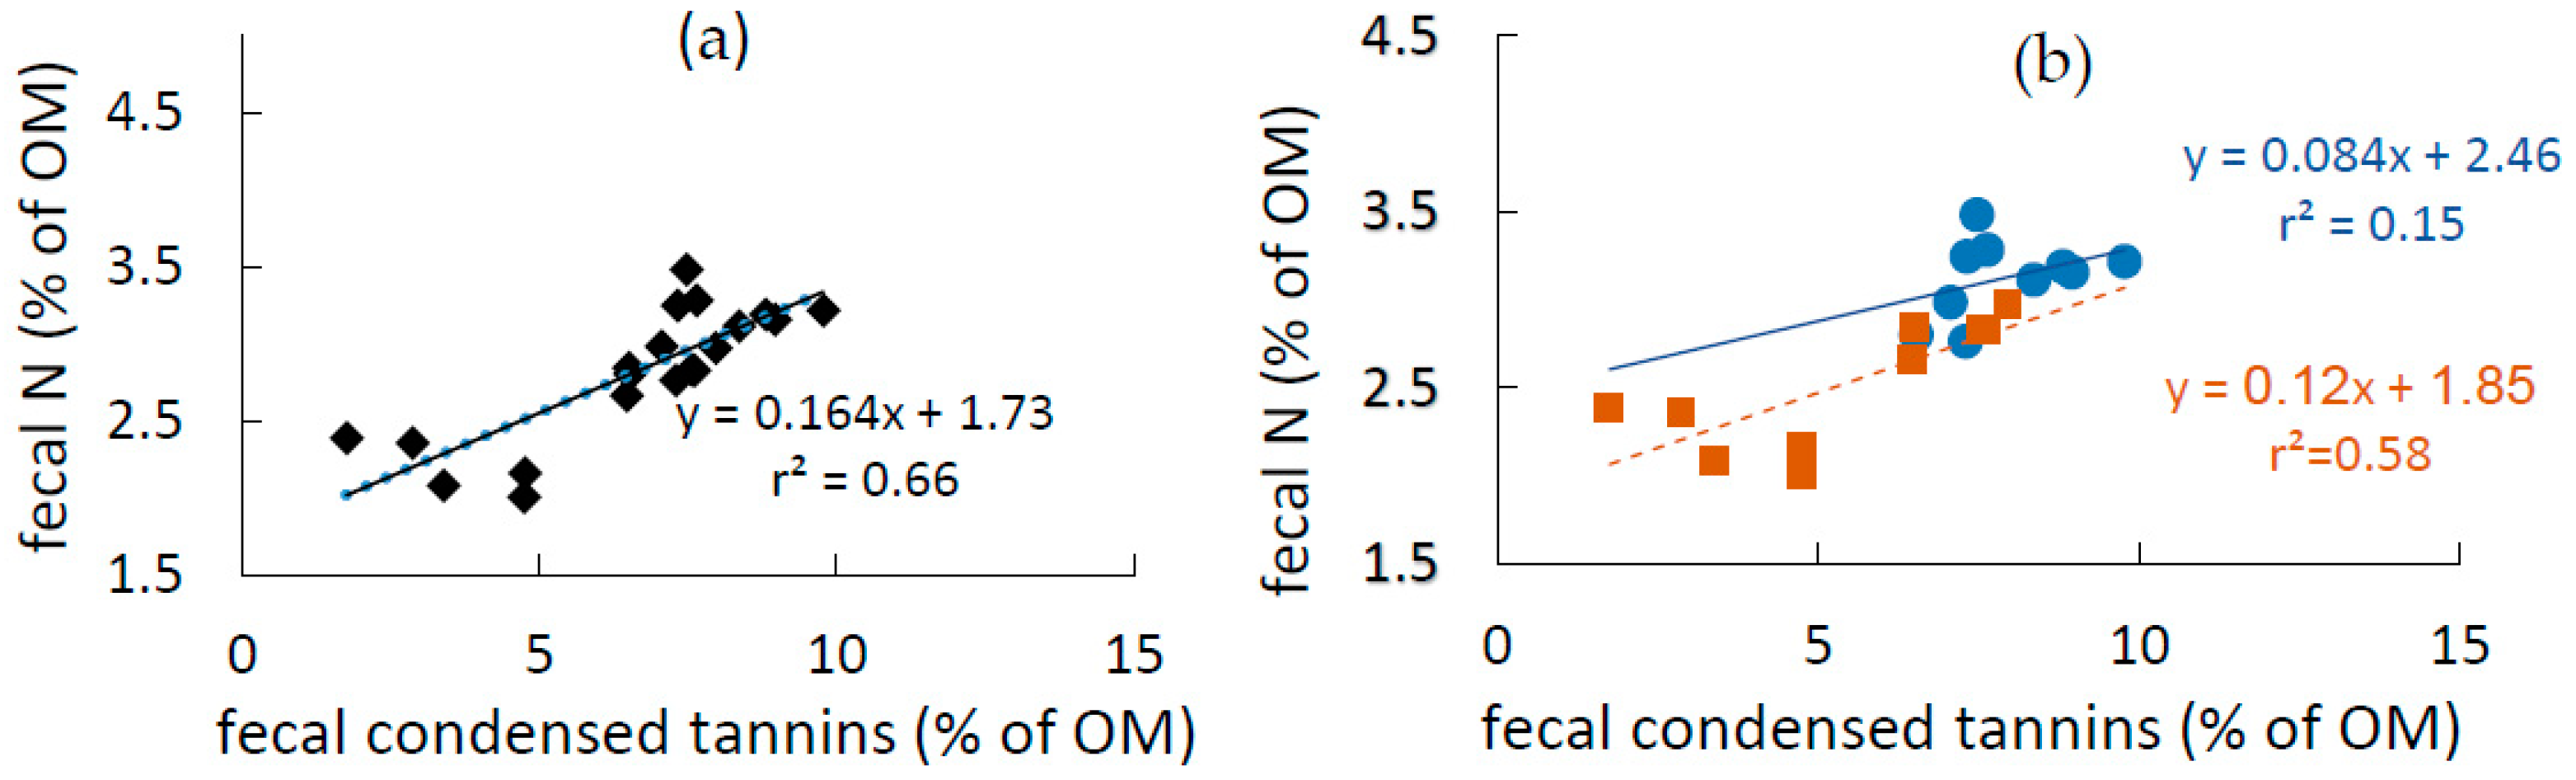
3.3. Fecal N and Tannins

The variation patterns for FN and FCT differed between the Arava and Paran (Figure 4). In the Arava, FN values (Figure 4b) on an OM basis ranged from 2.8% to 3.5%, compared with 2.0–3.0% in Paran. In the Arava, the FN curve showed a moderate binomial pattern (R2 = 0.77) with a maximum in July, whereas at Paran, the FN content was steady from February to June, rose sharply from June through July, and remained steady until October, after which it decreased until December, when it rose again. FN was higher in the Arava throughout the year except in September–October and December, when no significant difference was noted between the two locations.
Expressed on an OM basis, FCT content (Figure 4c) showed greater monthly variability in Paran (1.8–8% on an OM basis) than in the Arava (6.5–9.8%): it remained steady from April through November in the Arava, but only from July through October at Paran. We also observed that FCT increased linearly from March through October in Paran (R2 = 0.87). At both sites, the FCT contents fell and then rose again during Autumn, with minima in October and November for the Paran and Arava feces, respectively. Higher FCT was found in the Arava than in Paran from January to June and in November; the differences were greatest in late winter and spring, i.e., 7.1% and 2.9 % (p < 0.001); in March, 7.3% and 1.8 % (p < 0.001); April–May, 8.4% and 3.4 % (p < 0.001); and in June, 6.8% and 4.2% (p < 0.01), with no difference in FCT between locations in July–September and December.
We found a significant positive linear correlation between the monthly mean values of FN and of fecal FCT (r = 0.81, p < 0.01; Figure 5a). When analyzed for the two release sites separately (Figure 5b), the correlation between FCT and FN was still linear and positive (r = 0.76; p < 0.01) for Paran, but no significant correlation was found for the Arava site (r = 0.38). When values were split according to CT into lower—all from Paran—or greater than 5.0, no significant correlation whatsoever was found between fecal CT and FN at CT < 5.0, but fecal CT was correlated to FN at higher CT values (p < 0.05, not shown). Interestingly, at given CT contents, samples from Paran and from the Arava had identical FN values.

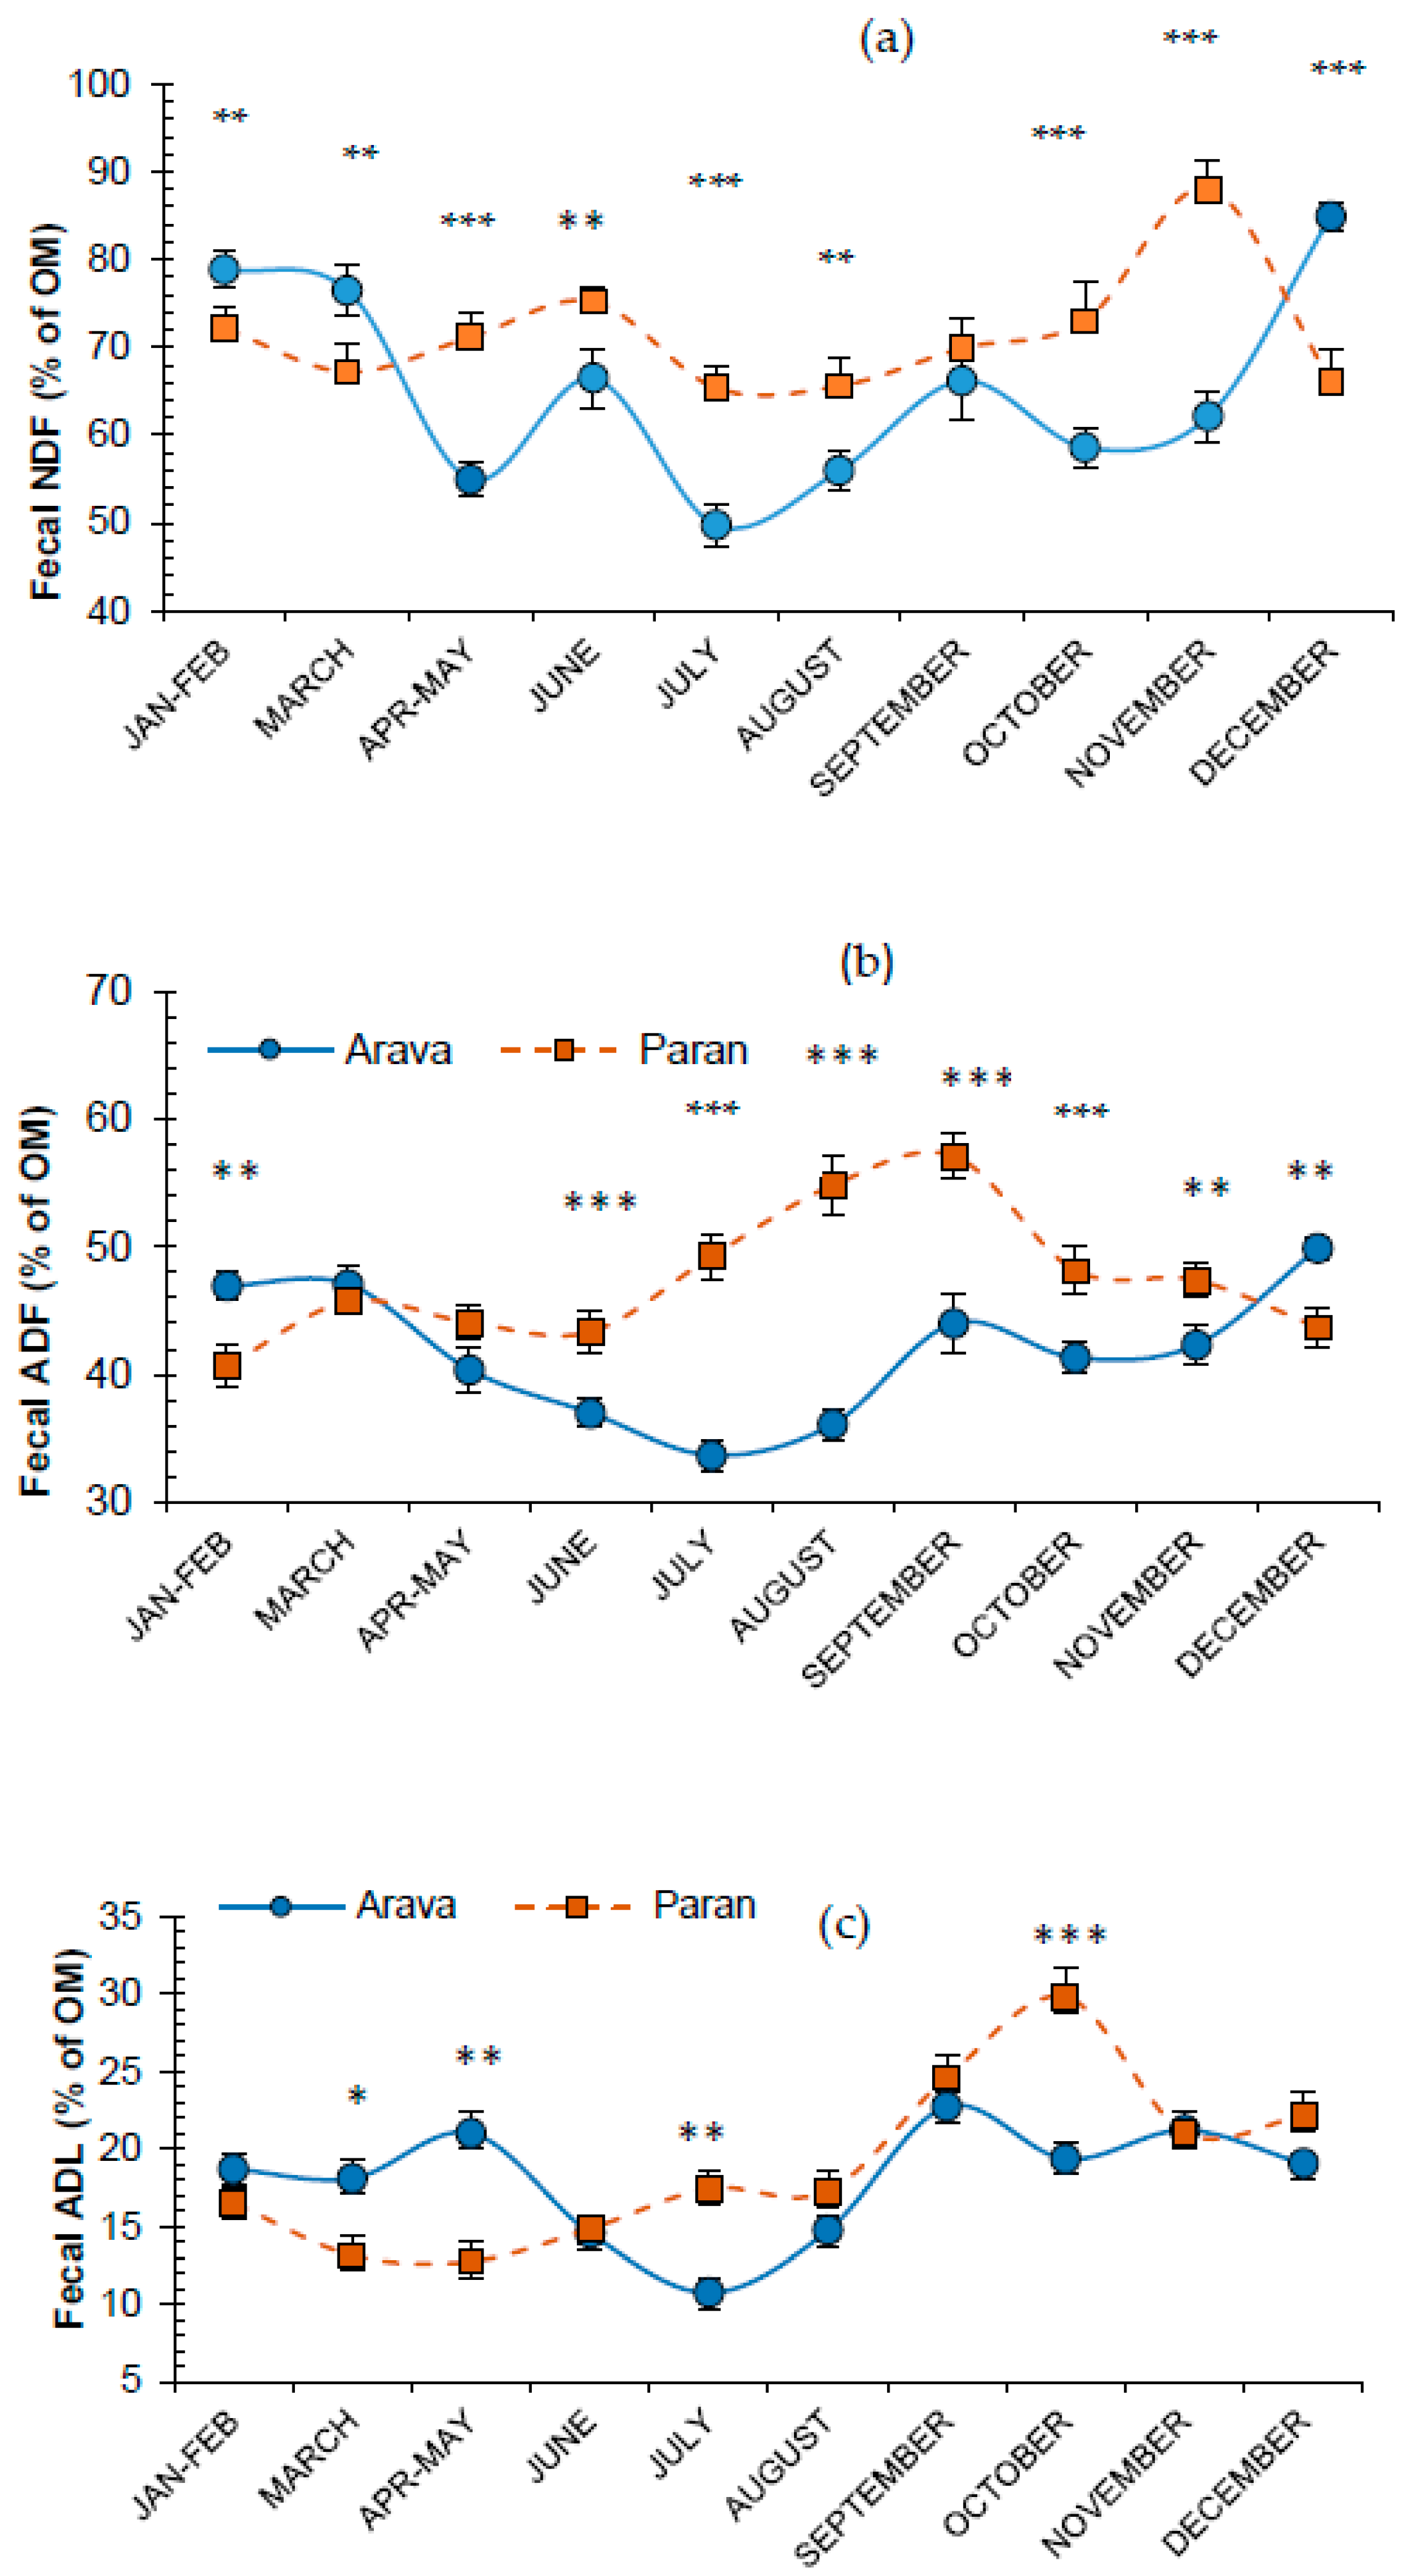
3.4. Fecal Fiber Attributes

FNDF variation patterns (Figure 6a) differed between sites: bimodal in Paran with maxima in June and November and fluctuating in a bi-monthly mode in the Arava.
The FADF curves (Figure 6b) in both regions peaked in September, and almost paralleled each other from April–May to December. Fecal ADL in Paran peaked in October and showed a bi-modal pattern in the Arava, with peaks in April and September.
At the exception of September, higher values (p < 0.001) were noted for FNDF at Paran than in the Arava from April–May through November, and the opposite in January–March (p < 0.01).
As to FADF, no difference was found between locations from March to May; FADF was higher (p < 0.001) in the Arava than at Paran from December to February and higher in Paran than in the Arava during the remainder of the year.
We noted higher FADL contents (Figure 6c) at Paran than in the Arava from March (p < 0.05) through May (p < 0.01) and higher at Paran in July (p < 0.01) and October (o < 0.001).

3.5. Chemical Composition of Vegetation

The chemical composition of the most frequent forbs and browse species is shown in Table 2.
Surprisingly, except for Tamarix nilotica (Ehrenb.), all samples contained medium (>8%) to high contents of CP. In particular, acacia samples were rich in crude protein (CP; 10.1–21.1%, on DM matter). Tamarix spp., Nitraria retusa, and Plicosepalus acaciae also featured high CT contents. All grass samples had a non-detectable level of CT.
The foliage of A. pachyceras contained more tannins and lignin and was less digestible in vitro than that of the other Acacia spp. In addition, because the seeds of A. pachyceras dropped before the pods, fruits found on the ground contained less protein and were more lignified and, therefore, less digestible than in the other Acacias. In other words, we found A. pachyceras potentially less nutritious than the other Acacias. We found that Plicosepalus acaciae foliage, anecdotally reported to be consumed by oryx, exhibited extremely low in vitro digestibility and high tannin concentration. In contrast, the fruits of Ochradenus baccatus and twigs of Atriplex halimus, both very commonly occurring, exhibited high in vitro DM digestibility, above 60%. All Tamarix samples showed low digestibility of about 40%. Ash, CP, and IVDMD decreased as grasses became more mature and the opposite was found for fiber attributes.

4. Discussion

4.1. Fecal Nitrogen as an Estimate of Nutritional Status

Looking at the Arava and Paran curves of FN (Figure 4b), the difference between them is striking. The amplitude of the fluctuations was much greater in Paran, suggesting less stable nutrition than in the Arava. We identified three main periods during the year, characterized by differing flood opportunities and nutrient availability for the oryx: winter and spring (January through June), summer (July through October), and autumn (November and December); however, before conclusions can be reached, one must discuss the limitations of using fecal indices, and, in particular, FN in identifying nutritional status.
First, the analysis of spectral distances between the two populations of fecal samples corroborates the spectral closeness of populations. Figure 5a demonstrates that condensed tannins were strongly correlated with FN, which might be a concern, relative to the adequacy of FN to serve as an estimate of nutritional status, as stated by Leslie and Bowyer [13]; overall, CT affected fecal N more in Paran than the Arava (Figure 5b). A more in-depth analysis of the curves evidence two populations of points, differing in their association of FCT with FN: where FCT was less than 5%, at Paran, it was not associated with increased FN. In other words, FN can truly be regarded as an estimate of protein/energy availability on the range, in times of borderline N availability, where FCT is also low. Moreover, from July to October, similar FCT in the two release sites justified the comparison of FN between them according to the criteria “comparable study units and within a species” defined by Leslie and Bowyer [13]. As FN was consistently significantly higher in the Arava than in Paran, it infers that nutritional status was more propitious for the oryx in the former, with the possible exception of December, where FCT and FN were similar in both sites.

4.2. Grass versus Browse: The Versatility of Oryx Feeding Behavior

There is no data of fecal N in oryx in the literature, but general comparisons can be made with other ruminants kept on arid rangelands. The lowest monthly FN values recorded at Paran in spring (approximately 2% on OM basis) were two-fold higher than FN in cattle feeding on depleted mature grass in Northern Israel [18] and equaled the lowest monthly value for Nubian Ibex in the Negev mountain of Israel [21]. A low FN in itself would not necessarily indicate an impaired nutritional status as desert animals benefit from improved urea-recycling via the saliva, as shown in Bedouin goats [34], Nubian Ibex [35], and dik-dik antelopes [36]. However, the monthly trend is meaningful: FN did not increase in Paran from February to June, a period of potential availability of grass, in contrast with the Arava (Figure 4b) presumably because of the overall little precipitation (Figure 2b). Fecal ash values decreased in Paran one month before it did in the Arava (Figure 4a), as ash contents are highest in young grass; higher fecal ash in the Arava in spring may infer higher dietary contribution of young grass, as shown in grazing cattle in semi-arid conditions [18]. Finally, FCT increased after this period in Paran, a sign of increasing dependence on browse, probably after grass depletion in late spring (Figure 4c). These results globally infer that the two-day rain event of early November and the following events, which poured 39 mm of rainfall in the Arava (Figure 2a) and 7 mm in Paran (Figure 2b), plus the concomitant floods, were presumably sufficient to trigger significant germination and growth of grass in early winter in the Arava and less in Paran.
The lignin contents of feces that result from ingestion of lush green grass (which contains <3% lignin) are 10%, compared with 20% in those resulting from the ingestion of mature herbaceous forage, which contains approximately 10% lignin [37]. As FADL exceeded 10% in both sites (Figure 6c), it infers that grass was never the sole or even a major dietary component in either site either in the Arava or in Paran
During the summer period, FNDF and FADF values increased more in Paran than in the Arava, indicating increased dietary fiber [16], and/or reduced fiber digestibility, indicative of grass maturation, use of coarser roughage, or both. It may be related to the April rainfall event that triggered late germination of regrowth of annuals.
On average, FCT in the Arava and Paran plateaued at 8.6% and 7.2%. Based on the lignin contents [37] and IVDMD presented in Table 2, the average digestibility did not exceed 50% for most of the year. On the assumption of whole-diet digestibility of 50%, FCT values in the Arava and Paran suggest a dietary CT content of 4.3% and 3.6% of OM, compared with an average of 8.5% for all Acacia samples. As the CT content of annuals is negligible, we calculated that, in the Arava and Paran, browse would represent approximately almost 50% and 40% of OM intake in summer, respectively. This seasonal peak intake of tannin-rich browse corresponds to the period of availability of pods of A. raddiana trees, that are found in both regions.
As fecal ash increases gradually from July, when no young grass is available, we consider that the proportions of ash-rich saltbush in Paran and of saltbush and Lycium shawii (Roemer and Schultes) in the Arava (Table 2) increased during this period and functionally replaced grass. Moreover, the source of fecal ash in summer can be geophagy: the clay minerals protect the animals against deleterious effects of high-tannin ingestion as shown in the Kalahari [38]. Finally, in Autumn (November–December), we found at Paran a transient decrease in FN in November to the low level of 2.0%, concurrent with an FCT level of 4.7%. The reason for decreased browsing is not clear and deserves further research; the most likely cause would be depletion of the Acacia browse sources with no renewal due to the low precipitation. This decrease in browse is concomitant with high FNDF, indicating the use of coarse roughage. Thus, our findings suggest that November was a period of nutritional stress for the oryx at Paran.
Integrating data from fecal N, CT, ash, and fiber attributes, it seems that browse was steadily consumed in the Arava throughout the year (fecal CT, Figure 4c) and represented half of the diet consumed in summer. More grass was available in the Arava in winter and early spring (higher fecal ash and N), but more mature grass was consumed at Paran in summer, where the share of browse in diet increased gradually after grass maturated and depleted.

4.3. Migration or Browsing as Means to Mitigate Food Depletion

In the southernmost, arid part of Israel, almost 100% of precipitations (only 35 mm/y) occur from October to April [39] and, from 1970 to 2002, the decline in rainfall averaged 0.961 mm/year. In addition to increasing aridity, more than half of the total rainfall was of a highly localized type, coming mostly from small convective cells [40], with a typical diameter of about 5 km [41]. Indeed, data in Figure 2 show that some rainfall events that were significant in the Arava were hardly felt in Paran, and reciprocally, at a mean distance of only 40 km.
In Oman, localized rainfall caused oryx to move to areas of new rain that fell 20 km from their core areas [42]. Arabian oryx populations consist of herds that adjust the size of their home ranges depending on availability of vegetation which is directly related to rainfall [42,43,44]; in the Arabian Peninsula, most migration occurs during winter. Where herd home ranges may encompass several thousand square kilometers, a herd might not return to a previously grazed range. Using a simulation based on Oman data, it was hypothesized that if the population at a given site in Israel was above carrying capacity, in addition to its background roaming, up to 70% of the excess population at the site would migrate, provided that this number is smaller than the combined carrying capacities of the corridors leaving the site [6]. The response of the oryx in Israel to depleted grass supply can be even more acute, because the rainfall pattern allows mainly annual grasses, in contrast to the Arabian oryx Sanctuary of Oman, where summer monsoons occur in June and July [42] and sustain perennials.
As the frequency of floods in a wadi depends on its drainage area and its geographical location, the Arava site, located at the bottom of the watershed, has a greater likelihood of floods and, therefore, of germination of annuals than the Paran site. Depleted grass in Paran and limited annual growth of perennials following an extremely dry year could trigger a migration from Paran to the Arava. However, this did not happen.
An alternative to migration is modifying foraging decisions: as time elapsed after release, a lowering of the acceptability threshold for low-quality Stipagrostis grass, and a concomitant increase in browse intake were reported [43]. Others have shown that foliage and pods of A. tortilis are consumed [7] and seeds are disseminated by the oryx [3]. Globally, our data demonstrate the strategic importance of tannin-rich browse for oryx survival in a hyper-arid environment where rainfall is erratic, and annual grass germination is uncertain. Indeed, our calculations showed that browse formed more than 40% of feed in reintroduced oryx in summer. In the oryx nucleus site in Southern Arava, acacia pods containing 9.6% of CT formed up to 60% of the diets ingested by oryx [25].
When large-mammal herbivory, in particular that of camels and small ruminants, is eliminated, 95% of Acacia seeds are predated by bruchid beetles [45]. Browsing, in particular by oryx, is needed for seed dissemination and recruitment of Acacia trees, pleading for an ecological role of oryx in their hyper-arid ecosystems [46]. Even though all acacias in southern Israel are evergreen, not all species are of equal value for the oryx: all of them shed some of their leaves in winter, but only in the Arava does the climate allow immediate re-growth, which may explain the difference in FCT between the Arava and Paran (Figure 3) in winter, when the two groups differed in their propensity to browse, when most fruit had been eaten, and acacia leaves were more abundant in the Arava than in Paran.
The browsing rate is probably the highest for A. raddiana, which bears the largest leaves among the Negev acacias. In addition, the three Acacia species differ in their patterns of fruit availability (Table 2). A. raddiana, found both in the Arava and in Paran, bears pods from June to August [19]; A. tortilis is found only in the Arava and its pods are available from July; and A. pachyceras, which is found only in Paran, sheds seeds and later, empty pods from June through September. As oryx cannot compete with rodents with regard to seed collection, we believe that A. pachyceras has a lesser nutritional value than the two other Acacia trees. Pods, and especially pods with seeds, are more important than leaves, because acacia leaves are extremely small and are embedded in a thicket of spines and thorns, particularly when the trees are heavily browsed [19]. In addition, we believe that the observed summer differences in FCT between the release locations reflected differences in fruit availability rather than in dietary preferences. All oryx, both at Paran and in the Arava ingested large amounts of tannins from July through October, a period when acacia pods were abundant, and showed a propensity for browse when and where it was available. As the successful population of the Arava showed high propensity for browse—as indicated by the relatively high levels of FCT—even when they could graze herbaceous species, we deduce that if more acacia forage were available in winter and spring in Paran, the oryx there would increase their browsing in these seasons. Our study also sheds light on the value of bushes, such as saltbush and O. baccatus, which exhibit high resilience to grazing and good nutritional value. Even though saltbush intake is limited and imposes an energy cost because of excessive excretion of minerals in sheep [47], salt licking is a well-observed behavior in desert animals [38].
Significant ecological changes in the Negev of Israel have taken place since the oryx went extinct there in the late nineteenth century. Most important of these with regard to the present study is that large areas have been closed to grazing by Bedouin domestic flocks. As herbivory improves the germination of Acacia seeds and recruitment [45,46], and high mortality rates of A. raddiana may indicate the severity of climatic changes during the last few decades, one cannot exclude the possibility that Acacia browse was more abundant before oryx went extinct, 120 years ago, than it is today.

4.4. Nutritional Status and Population Dynamics

We hypothesized that differences in nutrition could be associated with reproductive performance. Overall, we found no fecal sign of extreme malnutrition, and oryx sighted in the study area appeared to be in good condition. However, there was some indication of suboptimal nutrition of the Paran oryx in autumn, when FN was low, FNDF was high and FCT was at a medium level, which indicated the use of extremely coarse fibrous material at a time of declining browse availability. No seasonality in calving was reported for oryx in Saudi Arabia [10], and in Oman [8,9], where conception rates peaked following good nutritional conditions. In Oman, the proportion of newborns in each month was correlated to dietary CP in the 60 days preceding and the 30 days following parturition, and the proportion of an oryx being fecund in any year of its life decreased at low levels of dietary crude protein in the preceding year of its life [8]. In Saudi Arabia, drought was associated with a 76% decrease in reproductive behavior and a 67% reduction in conception rate [10]. Empirically, annual rainfall less than 40 mm results in little to no annual germination and has been shown to impact reproduction in other ungulate species [48].
Even though plant species consumed probably varied considerably throughout the year, the dietary status in the Arava, as estimated by FN was steady, therefore, the outcome of matings could be successful throughout the year. In contrast, in Paran, the best nutritional conditions were prevalent in July–September, i.e., these were the more propitious months for rearing calves and July was optimal for calving. As gestation lasts 240 days, mating should occur in November, a month of borderline nutritional status, which could prevent oestrous behavior and conception [8]. In addition, browsing tannin-rich Acacia can have effects that are not strictly nutritional. As oryx do not seem to use spatially localized defecation sites, the risk of nematode parasitism is high [49], and oryx indeed were found more sensitive to worm burden than other ruminants in captivity [50]. As browse tannins exhibit anthelminthic activity [51], increased consumption of dietary browse could have positive effects on health and reproductive fitness.

5. Conclusions

The dietary versatility of desert animals is germane to survival in hyperarid regions subject to increasingly unpredictable climatic conditions; release sites must be planned in a way that ensures access to a variety of plants that ensure acceptable food provision.
Hence, the nutrition of reintroduced oryx cannot be based on rain-dependent grass only, and browse is a major component of food security. As a result, the release of oryx must be carried out in areas that are relatively rich in available browse, with a focus on Acacias that can be regarded as a food insurance for released oryx.

Author Contributions

Conceptualization, D.S., I.I. and S.Y.L.; methodology, D.S. and S.Y.L.; software, S.Y.L.; validation, I.I., L.D. and B.S.; formal analysis, S.Y.L.; investigation, I.I. and B.S.; resources, D.S.; data curation, L.D.; writing—original draft preparation, S.Y.L.; writing—review and editing, D.S., I.I., B.S. and A.A.; visualization, A.A.; supervision, D.S.; project administration, D.S.; funding acquisition, D.S. All authors have read and agreed to the published version of the manuscript.

Funding

This research was funded by the Israel Nature and Parks Authority.

Institutional Review Board Statement

Ethical review and approval were waived for this study, because no component in oryx management (nutrition, handling) differed from routine procedures at the Hai-Bar.

Informed Consent Statement

Not applicable.

Acknowledgments

We are indebted to Hillary Voet for her excellent assistance with statistics.

Conflicts of Interest

The authors declare no conflict of interest.

References

  1. IUCN SSC Antelope Specialist Group. Oryx Leucoryx. The IUCN Red List of Threatened Species. 2017. Available online: http://dx.doi.org/10.2305/IUCN.UK.2017-2.RLTS.T15569A50191626.en (accessed on 9 March 2021).
  2. Kleiman, D.G.; Stanley Price, M.R.; Beck, B.B. Criteria for reintroductions. In Creative Conservation: Interactive Management of Wild and Captive Animals; Onley, P.J.S., Mace, G.M., Feistner, A.T.C., Eds.; Springer: Dordrecht, The Netherlands, 1994; pp. 287–303. [Google Scholar]
  3. Mésochina, P.; Bedin, E.; Ostrowski, S. Reintroducing antelopes into arid areas: Lessons learnt from the oryx in Saudi Arabia. Comptes Rendus Biol. 2003, 326, 158–165. [Google Scholar] [CrossRef]
  4. Ginat, H.; Shlomi, Y.; Batarseh, S.; Vogel, J. Reduction in precipitation levels in the Arava Valley (southern Israel and Jordan), 1949–2009. J. Dead Sea Arava Res. 2011, 1, 1–7. Available online: http://www.adssc.org/sites/default/files/Journal2011.pdf (accessed on 9 March 2021).
  5. Saltz, D. A long-term systematic approach to reintroductions: The Persian fallow deer and Arabian oryx in Israel. Anim. Conserv. 1998, 1, 245–252. [Google Scholar]
  6. Gilad, O.; Grant, W.E.; Saltz, D. Simulated dynamics of Arabian oryx (Oryx leucoryx) in the Israeli Negev: Effects of migration corridors and post-reintroduction changes in natality on population viability. Ecol. Model. 2008, 210, 169–178. [Google Scholar]
  7. Maoz, N. Impact of Repeated Release on the Space Use Patterns and Social Organization of Arabian Oryx (Oryx leucoryx) Reintroduced in the Central Negev, Israel. Master’s Thesis, Ben-Gurion University of the Negev, Beer Sheva, Israel, 2003. [Google Scholar]
  8. Stanley Price, M.R. Animal Re-Introductions: The Arabian Oryx in Oman. Ph.D. Thesis, University of Aberdeen, Cambridge, UK, 1989. [Google Scholar]
  9. Spalton, J.A. Effects of Rainfall on the Reproduction and Mortality of the Arabian oryx Oryx leucoryx (Pallas) in the Sultanate of Oman. Ph.D. Thesis, University of Aberdeen, Aberdeen, UK, 1995. [Google Scholar]
  10. Ismail, K.; Kamal, K.; Plath, M.; Wronski, T. Effects of an exceptional drought on daily activity patterns, reproductive behaviour, and reproductive success of reintroduced Arabian oryx (Oryx leucoryx). J. Arid Environ. 2011, 75, 125–131. [Google Scholar] [CrossRef]
  11. Spalton, J.A. The food supply of Arabian oryx (Oryx leucoryx) in the desert of Oman. J. Zool. 1999, 248, 433–441. [Google Scholar]
  12. Lancaster, R.J. Estimation of digestibility of grazed pasture from faeces nitrogen. Nature 1949, 163, 330–331. [Google Scholar]
  13. Leslie, D.M.; Bowyer, R.T. Facts from feces: Nitrogen still measures up as a nutritional index for mammalian herbivores. J. Wildl. Manag. 2008, 72, 1420–1433. [Google Scholar] [CrossRef]
  14. Wehausen, J.D. Fecal measures of diet quality in wild and domestic ruminants. J. Wildl. Manag. 1995, 59, 816–823. [Google Scholar]
  15. Floate, M.J.S. Decomposition of organic materials from hill soils and pastures: IV. The effects of moisture content on the mineralization of carbon, nitrogen and phosphorus from plant materials and sheep faeces. Soil Biol. Biochem. 1970, 2, 275–283. [Google Scholar]
  16. Jianzhang, M.; Junsheng, L.; Zhaowen, J.; Mingbo, G. Nitrogen and fiber concentration in rumen contents and feces contents of Mongolian gazelles. J. For. Res. 1999, 10, 103–106. [Google Scholar] [CrossRef]
  17. Jean, P.O.; Bradley, R.L.; Giroux, M.A.; Tremblay, J.P.; Côté, S.D. Near infrared spectroscopy and fecal chemistry as predictors of the diet composition of white-tailed deer. Rangel. Ecol. Manag. 2014, 67, 154–159. [Google Scholar]
  18. Landau, S.Y.; Dvash, L.; Yehuda, Y.; Muklada, H.; Peleg, G.; Henkin, Z.; Voet, H.; Ungar, E.D. Impact of animal density on cattle nutrition in dry Mediterranean rangelands: A faecal near-IR spectroscopy-aided study. Animal 2018, 12, 265–274. [Google Scholar] [CrossRef] [PubMed]
  19. Rohner, C.; Ward, D. Chemical and mechanical defenses against herbivory in two sympatric species of desert Acacia. J. Veg. Sci. 1997, 8, 717–726. [Google Scholar] [CrossRef]
  20. Terrill, T.H.; Waghorn, G.C.; Woolley, D.J.; McNabb, W.C.; Barry, T.N. Assay and digestion of 14C-labelled condensed tannins in the gastro-intestinal tract of sheep. Br. J. Nutr. 1994, 72, 467–477. [Google Scholar] [CrossRef] [Green Version]
  21. Landau, S.Y.; Dvash, L.; Ryan, P.; Saltz, D.; Deutch, T.; Rosen, S.A. Faecal pellets, rock shelters, and seasonality: The chemistry of stabling in the Negev of Israel in late prehistory. J. Arid Environ. 2020, 181, 104219. [Google Scholar] [CrossRef]
  22. Purnomoadi, A.; Kurihara, M.; Nishida, T.; Shibata, M.; Abe, A.; Kameoka, K. Application of near infrared reflectance spectroscopy to predict faecal composition and its use for digestibility estimation. Anim. Sci. Technol. 1996, 67, 851–862. [Google Scholar]
  23. Dixon, R.; Coates, D. Near infrared spectroscopy of faeces to evaluate the nutrition and physiology of herbivores. J. Near Infrared Spectr. 2009, 17, 1–31. [Google Scholar] [CrossRef]
  24. Shmida, A.; Aronson, J.A. Sudanian elements in the flora of Israel. Ann. Mo. Bot. Garden 1986, 73, 1–28. [Google Scholar] [CrossRef]
  25. Isler, I. Using Fecal Analysis to Assess Nutritional Differences between Three Herds of Arabian Oryx (Oryx leucoryx) Reintroduced in Different Areas. Master’s Thesis, Ben-Gurion University of the Negev, Beer Sheva, Israel, 2007. [Google Scholar]
  26. AOAC. Official Methods of Analysis, 16th ed.; AOAC International: Arlington, MA, USA, 1995. [Google Scholar]
  27. Goering, H.K.; Van Soest, P.J. Forage Fiber Analyses (Apparatus, Reagents, Procedures, and Some Applications); Agriculture Handbook No. 379; ARS-USDA: Washington, DC, USA, 1970.
  28. Landau, S.; Dvash, L.; Decandia, M.; Cabiddu, A.; Shapiro, F.; Molle, G.; Silanikove, N. Determination of poly(ethylene glycol)-binding to browse foliage, as an assay of tannin, by near-infrared reflectance spectroscopy. J. Agric. Food Chem. 2004, 52, 638–642. [Google Scholar] [CrossRef]
  29. Makkar, H.P. Quantification of Tannins in Tree and Shrub Foliage: A Laboratory Manual; Springer Science & Business Media, Kluwer Academic Pub: Dordrecht, The Netherlands, 2003. [Google Scholar]
  30. Tilley, J.M.A.; Terry, R.A. A two-stage technique for the in vitro digestion of forage crops. J. Br. Grassl. Soc. 1963, 18, 104–111. [Google Scholar] [CrossRef]
  31. Landau, S.; Glasser, T.; Dvash, L. Monitoring nutrition in small ruminants with the aid of near infrared reflectance spectroscopy (NIRS) technology: A review. Small Rumin. Res. 2006, 61, 1–11. [Google Scholar] [CrossRef]
  32. Shenk, J.S.; Westerhaus, M.O. Population definition, sample selection, and calibration procedures for near-infrared reflectance spectroscopy. Crop Sci. 1991, 31, 469–474. [Google Scholar] [CrossRef]
  33. SAS. SAS/STAT Guide; Version 6.12; SAS Institute: Cary, NC, USA, 1989. [Google Scholar]
  34. Silanikove, N.; Tagari, H.; Shkolnik, A. Gross energy digestion and urea recycling in the desert black Bedouin goat. Comp. Biochem. Physiol. Part A Physiol. 1980, 67, 215–218. [Google Scholar] [CrossRef]
  35. Choshniak, I.; Arnon, H.; Shkolnik, A. Digestive efficiency in a wild goat: The Nubian ibex. Can. J. Anim. Sci. 1984, 64, 160–162. [Google Scholar] [CrossRef]
  36. Maloiy, G.M.O.; Rugangazi, B.M.; Clemens, E.T. Nitrogen metabolism and renal function in the dik-dik antelope (Rhynchotragus kirkii). Small Rumin. Res. 2000, 37, 243–248. [Google Scholar] [CrossRef]
  37. Van Soeste, P.J. Nutritional Ecology of the Ruminant; O&B Books: Corvallis, OR, USA, 1982. [Google Scholar]
  38. Knight, M.H. Ecology of the Gemsbok Oryx Gazella Gazella (Linnaeus) and Blue Wildebeest Connochaetes Taurinus (Burchell) in the Southern Kalahari. Ph.D. Thesis, University of Pretoria, Pretoria, South Africa, 2008. Available online: https://repository.up.ac.za/bitstream/handle/2263/24345/11appendices.pdf?sequence=12 (accessed on 9 May 2021).
  39. Goldreich, Y.; Karni, O. Climate and precipitation regime in the Arava Valley, Israel. Israel J. Earth Sci. 2001, 50, 53–59. [Google Scholar] [CrossRef]
  40. Kafle, H.K.; Bruins, H.J. Climatic trends in Israel 1970–2002: Warmer and increasing aridity inland. Clim. Chang. 2009, 96, 63–77. [Google Scholar] [CrossRef]
  41. Sharon, D. The spottiness of rainfall in a desert area. J. Hydrol. 1972, 17, 161–175. [Google Scholar] [CrossRef]
  42. Corp, N.; Spalton, A.; Golrman, M.L. The influence of rainfall in a female desert ungulate: The Arabian oryx (Oryx leucoryx) in the Sultanate of Oman. J. Zool. Lond. 1998, 246, 369–377. [Google Scholar] [CrossRef]
  43. Van Heezik, Y.; Ismail, K.; Seddon, P.J. Shifting spatial distribution of Arabian Oryx in relation to sporadic water provision and artificial shade. Oryx 2003, 37, 295–303. [Google Scholar] [CrossRef] [Green Version]
  44. Tear, T.H.; Mosley, J.C.; Ables, E.D. Landscape-scale foraging decisions by re-introduced Arabian oryx. J. Wildl. Manag. 1997, 61, 1142–1154. [Google Scholar] [CrossRef]
  45. Rohner, C.; Ward, D. Large mammalian herbivores and the conservation of arid Acacia stands in the Middle East. Conserv. Biol. 1999, 13, 1162–1171. [Google Scholar] [CrossRef]
  46. Stavi, I.; Zinnes, T.A.; Joseph, A.; Solowey, E.; Groner, E. The role of large herbivores in recruitment of Acacia trees via endozoochory in the Arava Valley, Israel. Eur. J. Wildl. Res. 2015, 61, 775–781. [Google Scholar] [CrossRef]
  47. Arieli, A.; Naim, E.; Benjamin, R.W.; Pasternak, D. The effect of feeding saltbush and sodium chloride on energy metabolism in sheep. Anim. Prod. 1989, 49, 451–457. [Google Scholar] [CrossRef]
  48. Saltz, D.; White, G.C.; Rubenstein, D. Does increased variance from global change threaten wildlife? Predicting the future dynamics of Asiatic wild ass under environmental stochasticity. Conserv. Biol. 2006, 20, 1403–1409. [Google Scholar] [CrossRef] [PubMed]
  49. Gunn, A.; Irvine, R.J. Subclinical parasitism and ruminant foraging strategies—A review. Wildl. Soc. Bul. 2003, 31, 117–126. [Google Scholar]
  50. Goossens, E.; Dorny, P.; Vercammen, F.; Vercruysse, J. Field evaluation of the efficacy of fenbendazole in captive wild ruminants. Vet. Rec. 2005, 157, 582–586. [Google Scholar] [CrossRef]
  51. Githiori, J.B.; Athanasiadou, S.; Thamsborg, S.M. Use of plants in novel approaches for control of gastrointestinal helminths in livestock with emphasis on small ruminants. Vet. Parasitol. 2006, 139, 308–320. [Google Scholar] [CrossRef] [PubMed]
Figure 1. A map of Israel showing the release sites of the Arava and Paran.
Remotesensing 13 01876 g001
Figure 2. Rainfall during the project in the Arava (a) and Paran (b) sites: arrows indicate the initiation and end of fecal sampling period.
Remotesensing 13 01876 g002
Figure 3. Untransformed NIR fecal spectra sampled from reintroduced oryx (n = 228).
Remotesensing 13 01876 g003
Figure 4. Fecal concentrations of (a) ash (% of dry matter); (b) N (% of organic matter); and (c) condensed tannins (% of organic matter) in Oryx released at the Arava and Paran sites: monthly averages and SE. *** p < 0.001; ** p < 0.01; * p < 0.05.
Remotesensing 13 01876 g004
Figure 5. The relationship between monthly averages of fecal N and condensed tannins in (a) the whole oryx population (♦) or (b) analysed separately by release site: Paran (, ---) and Arava (, ).
Remotesensing 13 01876 g005
Figure 6. Concentrations of (a) neutral detergent fiber (NDF; % of organic matter); (b) acid detergent fiber (ADF, % of organic matter); and (c) acid detergent lignin (c; % of organic matter) in the feces of oryx released at the Arava and Paran sites: monthly averages and SE. *** p < 0.001; ** p < 0.01; * p < 0.05.
Remotesensing 13 01876 g006
Table 1. Near-infrared spectrometry (NIRS) calibration performance for the prediction of the chemical composition of oryx feces and browse available on the range, including the number of samples used in calibrations (N), mathematical treatment (DER, 1st or 2nd derivative), standard error of calibration (SEC) and cross-validation (SECV), and the coefficients of determination of calibration (R2cal) and cross-validation (R2CV).
ConstituentNMeanSDSECR2calSECVR2cvSD/SECVDER
Feces
FN1032.180.460.0880.960.100.954.601
FNDF5952.47.372.290.902.870.852.572
FADF5535.15.311.260.941.620.913.281
FADL5813.13.831.310.881.680.812.282
FASH10021.78.101.060.981.510.975.361
Forage
N4252.110.800.170.950.200.944.001
NDF42245.7112.673.690.924.350.882.911
ADF41829.007.632.590.882.880.862.651
ADL2042.581.530.480.900.790.851.941
IVDMD14566.0914.032.460.972.970.964.721
Feces and forage
CT1007.935.641.100.861.330.844.241
Table 2. The contents (% of dry matter) of ash, crude protein (CP), condensed tannins (CT), neutral detergent fiber (NDF), acid detergent fiber (ADF), lignin (ADL), and the dry matter in vitro digestibility of plants collected in the Arava and Paran release sites.
SpeciesTypePartMonthPercentage of Dry Matter
AshCPCTNDFADFADLIVDMD
Acacia pachycerastreeleavesAYR *6.513.511.237.826.513.043.9
treeseedless podsAYR *6.710.18.642.927.47.845.3
Acacia raddianatreeleavesAYR *8.815.68.732.319.55.856.7
treepods on treeJune–August6.217.28.738.524.87.661.4
treepods on groundAYR *9.215.67.138.525.65.360.4
Acacia tortilistreeleavesAYR *6.621.111.334.924.57.853.3
treepods on groundJuly-August10.516.56.739.627.75.258.1
Atriplex halimusbushtwigAYR *11.99.01.148.620.95.767.2
Lycium shawiibushleavesAYR *14.512.32.237.118.54.272.1
Nitraria retusabushleavesAYR *8.516.57.240.725.67.154.1
Ochradenus baccatusbushfruitMay–July, October, December6.48.45.552.129.17.462.2
bushtwigAYR *5.911.92.457.836.39.347.5
Plicosepalus acaciaeparasiteleavesAYR *2.77.621.739.822.711.328.4
Tamarix niloticabushtwigAYR *7.46.013.938.826.410.338.1
Tamarix aphyllabushtwigAYR *9.310.411.040.624.56.343.9
Zilla spinosabushleavesAYR *7.99.51.759.837.67.944.3
Annual herbaceous
(young)grassWhole plantDecember–January13.022.4<144.624.82.272.1
(pre-bloom)grassWhole plantFebruary–March11.015.5<157.831.92.567.3
(dry)grassWhole plantApril9.35.6<173.446.44.037.4
* Availability AYR: All year-round.
Publisher’s Note: MDPI stays neutral with regard to jurisdictional claims in published maps and institutional affiliations.

