Abstract
Rapid urban growth processes give rise to impervious surfaces and are regarded as the primary cause of urban flooding or waterlogging in urban areas. The high rate of urbanization has caused waterlogging and urban flooding in many parts of Dhaka city. Therefore, the study is undertaken to quantify the changes in land use/land cover (LULC) and urban runoff extent based on the Natural Resources Conservation Service (NRCS) Curve Number (CN) during 1978–2018. The five-decadal LULC has been analyzed using three-generation Landsat time-series data considering six different classes, namely agriculture, built-up, wetland, open land, green spaces, and water bodies for the years 1978, 1988, 1998, 2007, and 2018. Significant changes in LULC for the study area from 1978–2018 are observed as 13.1%, 4.8%, and 7.8% reduction in agricultural land, green spaces, and water bodies, respectively, and a 22.1% increase in the built-up area is estimated. Within Dhaka city, 14.6%, 16.0%, and 12.3% reduction in agricultural land, green spaces, and water bodies, respectively, and a radical increase of 41.9% in built-up area are reckoned. The decadal runoff assessment has been carried out using the NRCS-CN method, considering an extreme rainfall event of 341 mm/day (13 September 2004). The catchment area under very high runoff category is observed as 159.5 km2 (1978) and 318.3 km2 (2018), whereas, for Dhaka city, the setting is dynamic as the area under the very high runoff category has increased from 74.24 km2 (24.44%) to 174.23 km2 (57.36%) in years 1978 and 2018, respectively, and, mostly, the very high runoff potential areas correspond to the dense built-up surfaces.
1. Introduction
In recent decades, enormous urban expansion has given pace to massive land use/land cover (LULC) changes, which significantly interrupts the territorial, regional, national, and global environment along with its ecosystem [1,2,3,4,5,6,7,8,9]. This also has diverse impacts on an urban settlement [7,10], urban hydrology and urban flood [11,12,13], arable land [14], deforestation, and its rapid transformation into a habitation, cropland, and others [1,15], environmental degradation [16] including climate change at the local scale as well as globally [17,18]. The global urban population is estimated to nearly double by 2050 [19] with an expected 1.8–2.4% increase by 2030, which may cost 80% global cropland deterioration in Africa and Asia [20]. Like other continents, Asia has also undergone rapid LULC changes in the 21st century [21] and resulted in the land-use change of 6 million ha/year at the expense of forest cover during 2000–2005 as compared to the year 1990–2000 [22]. Bangladesh is currently experiencing drastic urban growth in recent decades and ranked as 4th within Asian countries with a rate of 4.8% during 2000–2011 [23]. Dhaka is the 3rd largest megacity of the world in 2020 as it was predicted by World Bank, 2007 and so the city is expanding rapidly [24]. The resultant runoff inundates dense inner-city areas, affecting a large number of urban dwellers living within the megacity, Dhaka. Thus, the rampant urban sprawl and the consequent rise in rainfall–runoff [12,25,26,27,28,29,30,31,32,33,34,35,36,37,38,39], causes soil degradation [40,41], loss of biodiversity [40,41], loss to agriculture activity, and tourism industry [42], marked variation in biogeochemical and hydrological cycles [43,44,45], and a gradual decline in ecosystem services [46]. It has been demonstrated that LULC changes result in an unexpected impact on the global environment and runoff extent [12,29,47,48,49,50,51].
Rainfall-runoff modeling is a complex real-world phenomenon in the field of hydrologic engineering where LULC classes, soil types, water safeguarding, sedimentation reduction, rainfall intensity, flood hazard zonation, and storm water runoff play the vital role [52,53,54]. There are several hydrological models (e.g., variable infiltration capacity (VIC) hydrological model, water flow and balance simulation model (WaSiM), soil and water assessment tool (SWAT) hydrological model, hydrologic engineering center–hydrological modeling system (HEC-HMS) model, MIKE URBAN, etc.) available to estimate direct runoff potential from storm rainfall. Most of these models are data intensive, need calibration and have site specific applicability. In its initial phase, the physical laws are governed on the designed conceptual models for simulating the dynamics of the chosen area [55,56]. These laws are represented by governing equations, which are solved mathematically using a set of variables in space and time. The conceptual models have prerequisite significant hydrological and meteorological data requirements. Most of the data required are costly, time-intensive, and have challenging processes to collect, manage, and analyze them [57]. Therefore, the preferred model should be simple, minimal data requirement, static assumptions, and unpretentious [58]. The Natural Resource Conservation Service-Curve Number (NRCS-CN) technique is globally used to derive direct runoff with respect to rainfall event(s) for catchments across the globe [59,60,61]. The model’s characteristics extend to land use, soil type, hydrological condition, and antecedent moisture condition (AMC) and work efficiently for catchments of smaller dimensions [62,63]. The slope and watershed area largely affect the storm water runoff generation [64,65,66]. In the present century, it has become necessary to assess storm water runoff potential at various scale, from basin to nation, nation to region, and region to global, to address future essentials and sustainable development [12,67,68,69,70]. Thus, remote sensing augments the models’ input parameters by providing information for inaccessible areas and high spatio-temporal variability [71,72,73,74]; and geographic information system (GIS) by providing high storage, handling, data processing, analysis and manipulation capabilities which are strongly required for the hydrological model [56,75,76]. Moreover, archived remote sensing data enable the opportunity for studying historical LULC dynamics.
The present study is undertaken to assess the decadal LULC change and storm water runoff assessment in Dhaka city and surroundings during 1978–2018, which are derived by the coupling of temporal remotely sensed Landsat time-series data, in-situ measurements, and ancillary data using the NRCS-CN model in the geospatial platform.
2. Materials and Methods
2.1. Study Area
Dhaka, the capital of the People’s Republic of Bangladesh, is the center of all development activities of the country, the home to numerous state and diplomatic institutions. The watershed area considered in this study encompasses Dhaka city and surroundings and lies between 23°36′5″N to 23°55′49″N latitude and 90°8′36″E to 90°34′46″E longitude (Figure 1a). The study area is spread over 846 km2, which is 0.57% of the entire geographical area of Bangladesh. The greater Dhaka city is surrounded by the Buriganga river to the southwest; the Turag river to the northwest; the Balu river to the northeast, and the Shitalakshya river to the south. The Dhaka district is bounded by Gazipur, Tangail, Munshiganj, Rajbari, Narayanganj, and Manikganj districts [77]. Tropical vegetation and moist soils characterize the land, which is flat and close to sea level. Topographically, the catchment area is flat with surface elevation ranging from 1 m to 22 m, and, for Dhaka city, it varies between 1 m to 14 m [78]. This leaves Dhaka city susceptible to flooding during the monsoon seasons owing to heavy rainfall and cyclones. Dhaka is one of the most densely populated megacities in the world, with a density of 68,561 people per km2 [79]. The 400 years of urban growth scenario for Dhaka have been shown by Kabir and Parolin, 2012 (Figure 1b) [80].
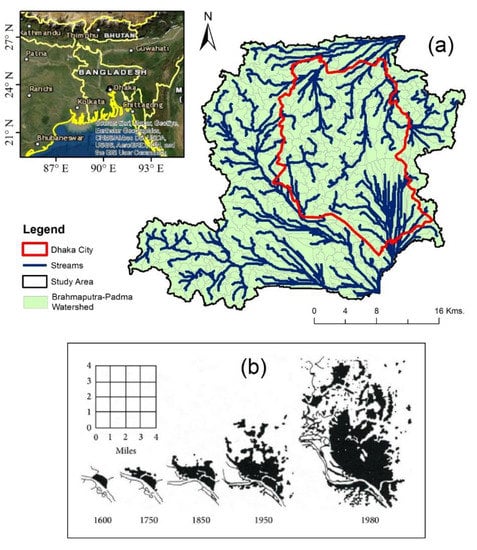
Figure 1.
(a) study area location map; (b) 400 years of urban growth scenario of Dhaka city [80].
The temporal Landsat images at a decadal time interval (1978, 1988, 1998, 2007, and 2018) covering the entire watershed were used along with the Shuttle Radar Topography Mission (SRTM) 30 m digital elevation model (DEM) in the present study. The specifications of the satellite data used are given in Table 1. In addition, a variety of other datasets are used for demographic (population), rainfall analysis and soil map for hydrologic soil group preparation (Table 2).

Table 1.
Specifications of satellite data used.
Table 2.
Specifications of other data used.
SRTM 30 m spatial resolution DEM is used for the watershed delineation for the study area using hydro-processing techniques with an area threshold of 3 km2. The methodology flow chart (Figure 2) describes the entire workflow sequentially to the quantification of the final runoff potential produced from the catchment.
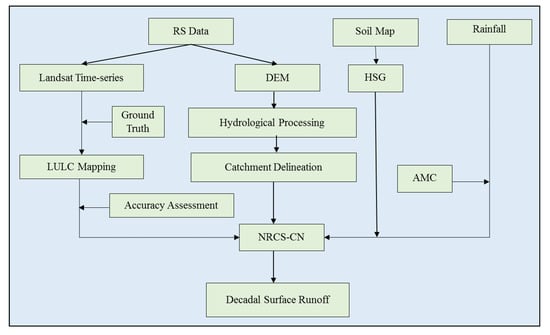
Figure 2.
Methodological flow chart.
2.2. Land Use/Land Cover (LULC)
LULC plays a dominating role in direct runoff estimation and affects infiltration mechanisms, hence considered as the fundamental input for the NRCS-CN method [51,60,63,81,82]. Landsat cloud-free time-series imagery were selected for preparing five decadal LULC layers for the years 1978, 1988, 1998, 2007, and 2018 due to its long-term availability and cost-effectiveness. All the images were obtained from the United States Geological Survey website [83]. The acquisition dates of the collected data vary in-between late January to late February because of seasonality, cloud, and fog-free data and finally to ensure data for maximum closest dates. The supervised classification technique was used for LULC classification using the maximum likelihood classification algorithm. Contextual refinement was carried out manually for each classified map. LULC classes have been categorized into six different classes (Table 3) for the study area as follows: agriculture, built-up, wetland, open land, green spaces, and water bodies [7,8,72,84,85].
Table 3.
LULC and their corresponding CN values assigned [86,87,88,89].
The accuracy assessment was performed on a GIS platform. Firstly, a total of 600 random points was generated for all six classes. Afterwards, with the help of training samples, very high resolution Google images (using Google Earth Pro platform), and various secondary sources, the ground truth points were finalized for each year from 1978–2018. Finally, the classification accuracies were assessed as 87.17, 89.07, 91.20, 86.67, and 92.53 percent and kappa coefficients as 0.82, 0.84, 0.88, 0.82, and 0.89 for the years 1978, 1988, 1998, 2007, and 2018, respectively (Table 4).
Table 4.
Accuracy assessment.
2.3. Hydrologic Soil Group
Soil Resources Development Institute has recognized a total of 500 soil series in Bangladesh and further reclassified into 21 general soil types. The different soil textures present in the study area are peaty, loamy fine sand, sandy loam, clay loam, loam, mucky clay, silt, and silty clay loam. However, most of the area are surrounded by clay and loamy soil. The hydrologic soil group (HSG) is an essential input for the NRCS-CN model. According to United States Department of Agriculture (2009) [88] and Musgrave (1955) [86], soil reclassification has been done to produce the HSG layer considering soil characteristics and their potential towards surface runoff (Table 5). It is seen that Dhaka city contains all the four types of HSG classes, i.e., A, B, C, and D, where the soil type ‘D’ denotes high runoff potential, type ‘C’ as high to moderate runoff potential soil group, type ‘B’ as moderate to low runoff potential and type ‘A’ as low runoff potential (Figure 3). The study area is dominantly under HSG class ‘C’, followed by class ‘B’ and ‘D’. It is observed that most of the urbanization has happened along the HSG class ‘D’ (Figure 3), which also signifies high runoff potential. Cronshey (1986) has suggested a list of curve numbers that can be assigned to different types of land uses with varying HSG classes [87].
Table 5.
Hydrological Soil Group (HSG) characteristics [87,89].
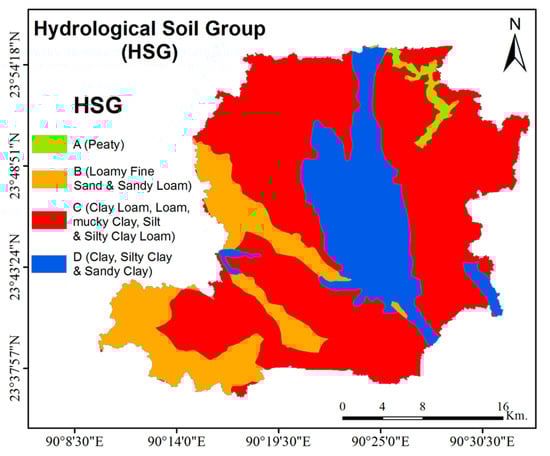
Figure 3.
Classified HSG soil map; e.g., various HSG type soils (A, B, C and D) represent the infiltration and runoff generations characteristics, HSG-A (sandy soils) having highest infiltration, thus least runoff potential, whereas HSG-D (clay type) has the least infiltration and highest runoff potential.
These LULC and HSG maps along with the look up table of CN-II (Table 3) [61,87,88,89] values were used to derive the CN-II map (Figure 4). However, the selection of CN-II values is based on the standard table; they can be subjective and usually calibrated when we use them in an event based rainfall-runoff or a daily time scale hydrological model. This study has not performed full scale hydrological or flood modeling, but has attempted to estimate changes in runoff potential using CN-II based runoff values. The detailed calibration of surface runoff can be taken as a separate study, where observed river flow data can be used for calibration of CN values.
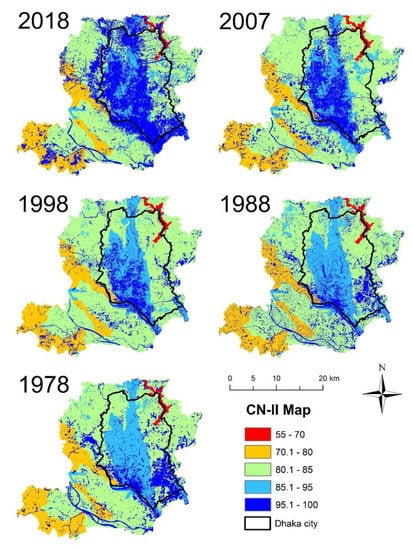
Figure 4.
CN-II map.
2.4. Antecedent Moisture Condition (AMC)
Antecedent moisture condition (AMC) refers to the moisture content present in the soil at the beginning of the rainfall-runoff event under consideration [89]. It is well known that AMC governs initial absorption and infiltration. The AMC of a particular watershed is taken under consideration, so that the already present moisture content in the soil, which plays a significant role in generating runoff can be estimated. There are three levels of AMC, as recognized by NRCS, as shown in Table 6 [89]. In the present study, the AMC-II condition has been applied to estimate runoff extent.
Table 6.
Antecedent Moisture Condition (AMC) conditions.
2.5. Overview of NRCS-CN
The NRCS-CN (Natural Resource Conservation Service-Curve Number) is a very popular and widely used method of estimating rainfall excess from rainfall [90] and relies on only one parameter, i.e., curve number (CN) [89]. The NRCS-CN model has been used in this study to estimate the urban runoff potential using Landsat time-series (1978–2018) data. The model presents a simplified procedure for estimating runoff potential in small watersheds, which have been presented by using the CN method (Table 3), where the CN values are assigned to various LULC classes. Thus, it has become very useful for urban areas as the runoff potential is very high even in very small watersheds [63,91,92,93,94,95]. Therefore, after integrating all parameters, i.e., LULC, CNII map, and rainfall, the runoff is calculated for the entire watershed area as given in Equation (1):
Where Q is the runoff, P is rainfall, Ia is the initial abstraction, and S = maximum retention capacity as given in Equation (2):
Here, the rainfall P was taken from the maximum daily rainfall measured by the Bangladesh Meteorological Department. Two different maximum rainfall events have been used to quantify the surface runoff based on the observed rainfall data starting from year 1953. Therefore, until 1978, 326 mm/day was observed as a maximum daily rainfall event. In addition, for the next two decades, it remained as the maximum rainfall; therefore, 326 mm/day rainfall was used as input also for the years 1988 and 1998. The next decade onwards, 341 mm/day rainfall was observed in the year 2004, which was used as input for the next two years, i.e., 2007 and 2018.
3. Results and Discussion
3.1. Rainfall Data Analysis
In the present study, daily rainfall data for 65 years (1953–2018) from the Bangladesh Meteorological Department for Dhaka station have been used to analyze the rainfall trend. It is found that maximum daily rainfall of 341 mm/day has occurred on 13 September 2004. The annual maximum rainfall variation in a day (1953–2018) is shown in Figure 5, and it should also be noted that, for the year 1974, the data were not available. The rainfall analysis has been performed based on maximum daily rainfall of the past 65 year’s rainfall patterns to know the return period of such high-intensity rain events so that the corresponding flood hazard can be estimated. The climate change impact on flood frequency, magnitude, and runoff variability has been assessed by a number of researchers. Mohammed et al. observed that floods (extreme discharges) and hydrological droughts (low flows) will become more frequent and severe in terms of incidence and extent in the coming days due to climate change [96]. Kirby et al. [97] also provided climate change has a greater impact on runoff and evapotranspiration as compared to irrigation development.
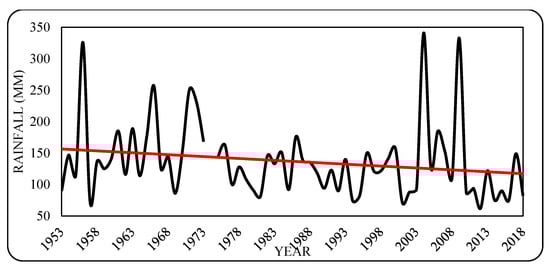
Figure 5.
Annual daily maximum rainfall distribution in Dhaka during 1953–2018.
3.2. Decadal LULC Change Analysis
LULC changes have been investigated for the years 1978, 1988, 1998, 2007, and 2018, using three-generation Landsat time-series data considering six different classes, namely agriculture, built-up, wetland, open land, green spaces, and water bodies. The classified LULC maps for corresponding years are shown in Figure 6. The change matrix among inter-class and intra-class following the considered time-series has been performed.
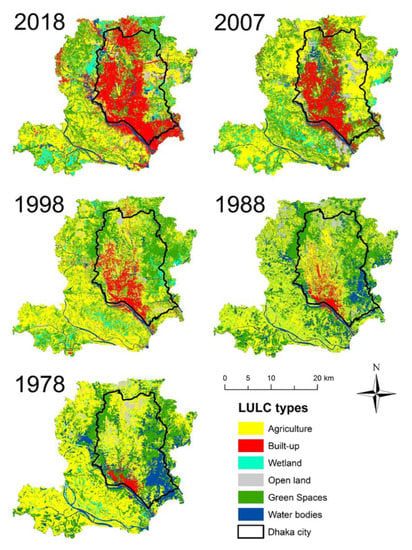
Figure 6.
Decadal land use/land cover maps (classified).
Table 7 and Figure 7a illustrate the decadal LULC change analysis for the entire study area for the chosen years. In addition, the LULC changes over the decades, i.e., 1978–2018, 1978–1988, 1988–1998, 1998–2007, and 2007–2018 have been performed. It has been found that agricultural land has the largest share among all LULC classes, i.e., 41961.6 ha (49.57%) and 30890.8 ha (36.51%) during the years 1978 and 2018, respectively. It has declined at the rate of 13.1%, 6.6%, 4.3%, and 6.6% in the years 1978–2018, 1978–1988, 1998–2007, and 2007–2018, respectively, whereas a sudden rise of 4.44% was observed in the year 1988–1998. Overall, 11,070.8 ha of agricultural land has diminished during the years 1978–2018. During the years 1978 to 2018, the built-up area has increased from 1458.36 ha (1.7%) to 20,142.5 ha (23.8%), respectively; wetland has increased from 2686.68 ha (3.2%) to 5093.01 ha (6.0%), respectively due to possible paddy field (Aman–Boro rice cultivation season) mixing with wetland pixels. A significant increasing trend for built-up areas is noticed for the years 1988, 1998, 2007, and 2018 at the rate of 3.46%, 7.37%, 12.31%, and 23.8%, respectively, which is a clear indication of the impact of physical development, rapid urbanization, industrialization boost-up, and rural-urban migration. In the case of wetlands, an insignificant trend is observed for the years 1988, 1998, 2007, and 2018. Similarly, the open land has insignificantly increased by 671.94 ha (0.08% of total area) during the years 1978–2018. The green spaces have diminished by 4076.0 ha (4.8% of the total area) due to urbanization in the megacity, Dhaka, with a population density of 68,561 per km2. Though the increase is observed only during 1978–1988 decade by 5.4% and for the rest of the decades (1988–1998, 1998–2007, and 2007–2018), the decreasing trend with 277.5 ha, 2707.3 ha, and 5615.8 ha, respectively, are noticed. During 1978–2018, 6628.1 ha (7.8%) of water bodies have diminished, wherein, during the decades (1978–1988, 1988–1998, and 1998–2007), the decline is at the rate of 2.1%, 7.7%, and 1.6%, respectively. However, during the decade 2007–2018, it has increased at the rate of 3.6% due to various initiatives undertaken by the Government to revitalize rivers.
Table 7.
Decadal LULC classes area (ha) and percentage (%) distribution along with the change matrix for the catchment area.
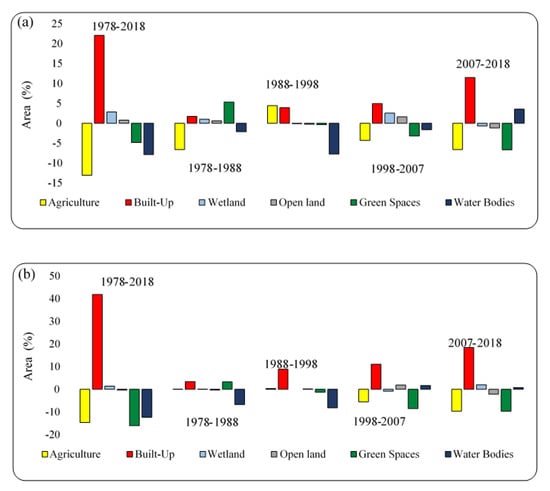
Figure 7.
Relative LULC changes; (a) for entire catchment area; (b) for Dhaka city area during 1978–2018.
Decadal LULC Change Scenario of Dhaka City
Table 8 and Figure 7b show the LULC change scenario of Dhaka city with their areal contribution and percentage with respect to the city, and inter-decadal change assessment. During the period 1978–2018, the agricultural land has declined by 4300.5 ha (14.6%); the recorded maximum extent of 11058.48 ha (37.6%) during 1978, whereas, for the years 1988, 1998, and 2007, the insignificant trend is observed with a massive reduction in the year 2018. It is observed that the built-up area has followed an increasing trend over the decades. During the year 1978, the areal extent of built-up was 1307.52 ha (4.4%), which has increased by 7.9%, 16.8%, 27.9%, and 46.4% during the years 1988, 1987, 2007, and 2018, respectively. From the early 21st century, the built-up areal extent in Dhaka city and surroundings has been triggered by the influence of urbanization, industrialization, and development trend, which has resulted in an overall 41.9% (12345.5 ha) increase in built-up area. The wetland and open land have demonstrated insignificant changes with both increasing and decreasing trends during the period (1978–2018). During 1978–2018, the vegetation/ green spaces and water bodies have shown significant changes in Dhaka city, with their area declining by 4723.7 ha and 3635.7 ha (16% and 12.3%), respectively. In the year 1978, both the classes shared 32.3% and 18.3%, which was the second and third largest share, respectively, of the city area.
Table 8.
Decadal LULC classes area (ha) and percentage (%) distribution along with change matrix for the Dhaka city area.
3.3. Decadal Runoff Assessment
The entire catchment is much larger as compared to the Dhaka city, which contains natural flow from the upstream region and encompasses the city area. Thus, runoff potential analysis has been performed for the entire catchment to identify the vulnerable section of urban areas based on rainfall–runoff analysis and hydrological soil cover variability. The NRCS Curve Number method has been used for estimating the runoff potential and carried out for daily maximum rainfall observed as 341 mm/day on 13 September 2004, for the hydrologic-soil-cover complex scenario of years 2007 and 2018; and 326 mm/day on 14 July 1956, for the years 1978, 1988, and 1998.
Figure 8 shows that the decadal storm water runoff-based inundation is relatively high in most urbanized parts of the entire catchment. The runoff potential varies from 164 mm/day to 341 mm/day and classified into five classes as follows: very high (315–341 mm/day), high (275–315 mm/day), moderate (240–275 mm/day), low (210–240 mm/day) and very low (164–210 mm/day). Table 9 is showing the areal extent in square km and the percentage of five distinct runoff classes for the entire catchment. The inundation area under the very low runoff category is found to be varying between 0.2–1% of the total area during 1978–2018, whereas the area under low category ranges between 0.4–4.6% with a sudden increase in area by 40 km2 and 37.6 km2 in 1988 and 1998, respectively. Contrarily, the very high runoff potential area has increased from 159.5 km2 (18.3%) to 318.3 km2 (36.5%) for the year 1978 and 2018, respectively. It is also observed that the inundated area has mostly occupied the built-up surfaces. The area under the high runoff class has also increased throughout the period except a sudden drop noticed in the year 1998. It is observed that the high runoff potential area (km2) and mean runoff of the study area is increasing with respect to the built-up area (%) (Figure 9). In addition, the mean runoff has increased from 277 to 301 mm/day during the year 1978 to 2018, and the built-up area has increased by 22.1% of the total area during this period.
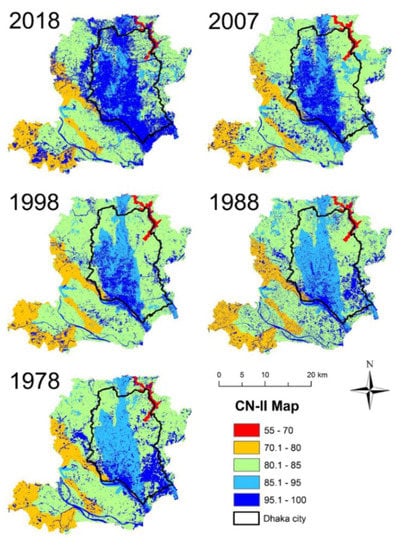
Figure 8.
Surface runoff computed using NRCS-CN method for the catchment area.
Table 9.
Decadal runoff classes with inundation area (km2) and percentage (%) respect to the catchment area.
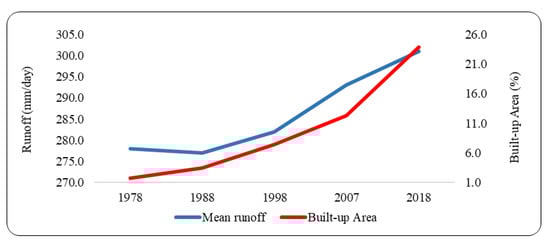
Figure 9.
Relationship between built-up area and mean runoff during 1978–2018.
Decadal Runoff Scenario of Dhaka City
Table 10 shows that Dhaka city has experienced very high urban runoff over the decades, mostly inundating the built-up areas as shown in Figure 10, covering 174.23 km2 area in the year 2018 (57.36% of total area), whereas area under very high runoff covered 74.24 km2 area (3rd largest, with a share of 24.44% of total area) in the year 1978. In the years 1998 and 2007, the area under the very high runoff category has increased rapidly by 69.40 km2 and 126.05 km2, with a share of 22.85% and 41.50%, respectively. Similarly, the high runoff potential area covers 126.35 km2 area (41.59%, second largest) in the year 2018, whereas the area under high runoff covered 113.96 km2 area (37.52% of total area) in the year 1978. The inundated area under the moderate runoff category is found to be insignificant for the years 2018 and 2007. However, moderate runoff is found in the years 1998, 1988, and 1978 covering 45.54% area, i.e., second largest covering 39.70% and similarly 36.81% of the city, respectively. Low and very low runoff contributing area is recorded insignificantly over the study period.
Table 10.
Decadal runoff classes for Dhaka city with inundation area (km2) and percentage (%) with respect to the city area.
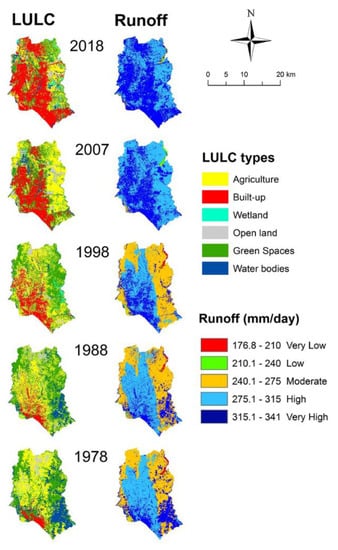
Figure 10.
Comparison of surface runoff with land use/land cover for Dhaka city.
3.4. Validation
The study has been undertaken for the quantification of urban runoff over five decades. Dewan and Yamaguchi [78] have reported that flood inundation of the greater Dhaka for the years 1988, 1998, and 2004 were 47.1%, 53%, and 43%, respectively. It is also revealed that rapid LULC change plays a vital role in escalating the flood processes, which also signifies the findings of the present study. Barua and Ast have also shown the monsoon flood inundation for the year 1998 [98]. Similarly, Sayed and Haruyama 2016 have reported that 70% of the Greater Dhaka area is under moderate to very high flood hazard zone [99]. Several national and international electronic media have also shown the on-street historic flood scenario due to sudden and extreme rainfall events every year (Figure 11). Furthermore, to understand the efficacy of the storm water drainage network for Dhaka city, a study using a Storm Water Management Model (SWMM) can be undertaken.
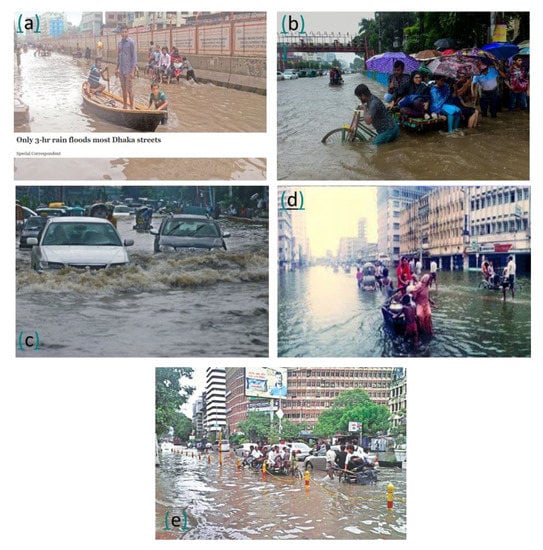
Figure 11.
Ground scenario of Dhaka storm flood (a) The inundation occurred due to only 81 mm of rains between 6:00–9:00 a.m., 1 June 2018 [100]; (b) Dhaka flood inundation, 21 March 2018 [101] (c) Dhaka flood, 14 September 2007 [102]; (d) flooded Dhaka city [103], and (e) near Sonargaon hotel, 2 September 2015 [104].
4. Conclusions
The present study aimed to analyze the spatio-temporal variability of urban runoff characteristics in parts of Dhaka city corresponding to extreme rainfall events in comparison to decadal LULC changes from 1978–2018. It is observed that within catchment area during 1978–2018, 11,070.8 ha of agricultural land has diminished (13.1%); 18684.1 ha of built-up area has increased (22.1%); 2406.3 ha of the wetland has increased (2.8%); 671.9 ha of open land has increased (0.8%); 4076.0 ha of vegetation/ green spaces has diminished (4.8%), and 6628.1 ha of water bodies has diminished (7.8%). On the other hand, the LULC change scenario observed for the Dhaka city over the period 1978–2018 reveals that 4300.5 ha of agricultural land has diminished (14.6%); 12,345.5 ha of built-up area has drastically increased (41.9%); 406.4 ha of the wetland has increased (1.4%); 95.7 ha of open land has decreased (0.3%); 4723.7 ha of vegetation/ green spaces has diminished (16.0%), and 3635.7 ha of water bodies has diminished (12.3%), which is more alarming for the city to tackle current urban storm water runoff.
As it is evident from the current analysis of rainfall, urban growth, and LULC change of the last 40 years, the number of very high rainfall events have increased (one event of daily rainfall >300 mm during 1953–2001; two events >300 mm rainfall from 2002–2018) (Figure 5) as well as exponential urban and population growth. In the future, due to increasing build up land use and the chance of occurring more high rainfall events, the urban flooding is bound to increase.
The runoff assessment using NRCS-CN reveals the significant increase during the above period and mostly in the urbanized areas. The very high and high runoff areas have increased within catchment from 159.5 km2 (18.3%) and 144.2 km2 (16.6%) in the year 1978, to 318.3 km2 (36.5%) and 439.1 km2 (50.4%) in the year 2018, respectively, which is spread throughout the urban and peri-urban areas; and very low and low runoff area reveal insignificant trend along with the significant contribution of moderate runoff area i.e., 527 km2 (60.6%), 510.1 km2 (58.5%) and 564.3 km2 (64.7%) for the year 1978, 1988, and 1998, respectively. In Dhaka city, the scenario is found to be very alarming as very high runoff has increased from 74.24 km2 to 174.23 km2 sharing 24.44% and 57.36% of the city area for the year 1978 and 2018, respectively, which mainly coincide with dense built-up surfaces; on the contrary, low and very low runoff area reveals an insignificant trend sharing a very small area, similar to catchment area; the high runoff area is found to be almost the same in years 1978 and 1988, whereas, from 1998 to 2018, the inundation area has significantly increased from 91.93 km2 to 126.35 km2, sharing 30.27%, 41.59%, respectively; and moderate runoff area exhibited an increasing trend in the year 1978–1998 and an insignificant trend in the year 2007–2018.
Therefore, the study demonstrates the urban storm water runoff scenario in parts of Dhaka city and its surrounding area based on the NRCS-CN model considering LULC change analysis over the decades. One of the limitations of the present work is considering a single urban built-up LULC class, which has resulted in very high CN value. This class can be improved with level 3 or 4 urban LULC classes using high-resolution remote sensing data, giving better control over CN values in this area. Therefore, it is recommended that further studies can be undertaken with improved datasets such as high-resolution remote sensing data and DEM, high temporal rainfall data (15 minutes’ interval rainfall data is recommended). Additionally, the storm water modeling software, such as SWMM or MIKE URBAN, and other modeling techniques can be used for comparison.
Author Contributions
M.M. proposed the topic, and contributed to the data processing and analysis. The authors, M.M., P.K.T., P.K., M.A.A., and V.G. contributed to the research design and wrote the manuscript. M.M., P.K.T., P.K., M.A.A., V.G., I.R., and H.O. helped to enhance the research design, analysis, interpretation, and manuscript writing. P.K.T. and H.O. finalized the manuscript. All authors have read and agreed to the published version of the manuscript.
Funding
This work was supported by Vedurfelagid, Rannis, and Rannsoknastofa i vedurfraedi.
Acknowledgments
M.M. is deeply grateful to his supervisors (P.K.T., P.K., Indian Institute of Remote Sensing (ISRO), Dehradun, India; and M.A.A., Urban and Rural Planning Discipline, Khulna University, Bangladesh), for their great support, specific guidance, and encouragement. M.M. is also thankful to H.O., Institute for Atmospheric Sciences—Weather and Climate and Department of Physics, University of Iceland and Icelandic Meteorological Office (IMO), Reykjavik, Iceland for his great support. M.M. would like to acknowledge the Center for Space Science and Technology in Asia and the Pacific (CSSTEAP) (Headquarters) and Indian Institute of Remote Sensing (ISRO), 4-Kalidas Road, Dehradun for their support in conducting this study.
Conflicts of Interest
The authors declare no conflict of interest.
References
- Lambin, E.F.; Turner, B.L.; Geist, H.J.; Agbola, S.B.; Angelsen, A.; Bruce, J.W.; Coomes, O.T.; Dirzo, R.; Fischer, G.; Folke, C. The causes of land-use and land-cover change: Moving beyond the myths. Glob. Environ. Change 2001, 11, 261–269. [Google Scholar] [CrossRef]
- Weng, Q. A remote sensing? GIS evaluation of urban expansion and its impact on surface temperature in the Zhujiang Delta, China. Int. J. Remote Sens. 2001, 22, 1999–2014. [Google Scholar]
- Stow, D.A.; Chen, D.M. Sensitivity of multitemporal NOAA AVHRR data of an urbanizing region to land-use/land-cover changes and misregistration. Remote Sens. Environ. 2002, 80, 297–307. [Google Scholar] [CrossRef]
- Mahmood, R.; Pielke Sr, R.A.; Hubbard, K.G.; Niyogi, D.; Bonan, G.; Lawrence, P.; McNider, R.; McAlpine, C.; Etter, A.; Gameda, S. Impacts of land use/land cover change on climate and future research priorities. Bull. Am. Meteorol. Soc. 2010, 91, 37–46. [Google Scholar] [CrossRef]
- Mitsuda, Y.; Ito, S. A review of spatial-explicit factors determining spatial distribution of land use/land-use change. Landsc. Ecol. Eng. 2011, 7, 117–125. [Google Scholar] [CrossRef]
- Yu, W.; Zang, S.; Wu, C.; Liu, W.; Na, X. Analyzing and modeling land use land cover change (LUCC) in the Daqing City, China. Appl. Geogr. 2011, 31, 600–608. [Google Scholar] [CrossRef]
- Moniruzzaman, M.; Roy, A.; Bhatt, C.; Gupta, A.; An, N.; Hassan, M. Impact Analysis of Urbanization on Land Use Land Cover Change for Khulna City, Bangladesh Using Temporal Landsat Imagery. Int. Arch. Photogramm. Remote Sens. Spat. Inf. Sci. 2018, 42, 5. [Google Scholar]
- Rousta, I.; Sarif, M.O.; Gupta, R.D.; Olafsson, H.; Ranagalage, M.; Murayama, Y.; Zhang, H.; Mushore, T.D. Spatiotemporal analysis of land use/land cover and its effects on surface urban heat island using Landsat data: A case study of Metropolitan City Tehran (1988–2018). Sustainability 2018, 10, 4433. [Google Scholar] [CrossRef]
- Rousta, I.; Olafsson, H.; Moniruzzaman, M.; Zhang, H.; Liou, Y.-A.; Mushore, T.D.; Gupta, A. Impacts of drought on vegetation assessed by vegetation indices and meteorological factors in Afghanistan. Remote Sens. 2020, 12, 2433. [Google Scholar] [CrossRef]
- Alphan, H. Land-use change and urbanization of Adana, Turkey. Land Degrad. Dev. 2003, 14, 575–586. [Google Scholar] [CrossRef]
- Sanders, B.F.; Schubert, J.E.; Gallegos, H.A. Integral formulation of shallow-water equations with anisotropic porosity for urban flood modeling. J. Hydrol. 2008, 362, 19–38. [Google Scholar] [CrossRef]
- Garg, V.; Khwanchanok, A.; Gupta, P.; Aggarwal, S.; Kiriwongwattana, K.; Thakur, P.; Nikam, B. Urbanisation effect on hydrological response: A case study of Asan River watershed, India. J. Environ. Earth Sci. 2012, 2, 39–50. [Google Scholar]
- Chen, Y.; Zhou, H.; Zhang, H.; Du, G.; Zhou, J. Urban flood risk warning under rapid urbanization. Environ. Res. 2015, 139, 3–10. [Google Scholar] [CrossRef] [PubMed]
- López, E.; Bocco, G.; Mendoza, M.; Duhau, E. Predicting land-cover and land-use change in the urban fringe: A case in Morelia city, Mexico. Lands Urban Plan. 2001, 55, 271–285. [Google Scholar] [CrossRef]
- Paudel, B.; Zhang, Y.-L.; Li, S.-C.; Liu, L.-S.; Wu, X.; Khanal, N.R. Review of studies on land use and land cover change in Nepal. J. Mt. Sci. 2016, 13, 643–660. [Google Scholar] [CrossRef]
- Holdgate, M.W. The sustainable use of tropical coastal resources-a key conservation issue. Ambio 1993, 22, 481–482. [Google Scholar]
- Liu, X.; Lathrop, R., Jr. Urban change detection based on an artificial neural network. Int. J. Remote Sens. 2002, 23, 2513–2518. [Google Scholar] [CrossRef]
- Herold, M.; Goldstein, N.C.; Clarke, K.C. The spatiotemporal form of urban growth: Measurement, analysis and modeling. Remote Sens. Environ. 2003, 86, 286–302. [Google Scholar] [CrossRef]
- Unated Nation. Report of the meeting-urbanization: A global perspective. In Proceedings of the Expert Group Meeting on Population Distribution, Urbanization, Internal Migration and Development, New York, NY, USA, 21–23 January 2008. [Google Scholar]
- D’Amour, C.B.; Reitsma, F.; Baiocchi, G.; Barthel, S.; Güneralp, B.; Erb, K.-H.; Haberl, H.; Creutzig, F.; Seto, K.C. Future urban land expansion and implications for global croplands. Proc. Natl. Acad. Sci. USA 2017, 114, 8939–8944. [Google Scholar] [CrossRef]
- Lambin, E.F.; Geist, H.J.; Lepers, E. Dynamics of land-use and land-cover change in tropical regions. Annu. Rev. Environ. Resour. 2003, 28, 205–241. [Google Scholar] [CrossRef]
- Lindquist, E.J.; D’Annunzio, R.; Gerrand, A.; MacDicken, K.; Achard, F.; Beuchle, R.; Brink, A.; Eva, H.D.; Mayaux, P.; San-Miguel-Ayanz, J. Global Forest Land-Use Change 1990–2005; Food and Agriculture Organization of the United Nations (FAO): Rome, Italy, 2012. [Google Scholar]
- Konuma, H.; Genarri, P. FAO Statistical Yearbook; Asia and the Pasific Food and Agriculture; Food and agriculture organization of the United Nations regional office for Asia and the Pacific: Bangkok, Thailand, 2014. [Google Scholar]
- Bank, W. Improving Living Conditions for the Urban Poor; The World Bank Office: Dhaka, Bangladesh, 2007. [Google Scholar]
- Bhatta, B. Analysis of urban growth pattern using remote sensing and GIS: A case study of Kolkata, India. Int. J.Remote Sens. 2009, 30, 4733–4746. [Google Scholar] [CrossRef]
- Bhatta, B.; Saraswati, S.; Bandyopadhyay, D. Urban sprawl measurement from remote sensing data. Appl. Geogr. 2010, 30, 731–740. [Google Scholar] [CrossRef]
- Das, P.; Behera, M.D.; Patidar, N.; Sahoo, B.; Tripathi, P.; Behera, P.R.; Srivastava, S.; Roy, P.S.; Thakur, P.; Agrawal, S. Impact of LULC change on the runoff, base flow and evapotranspiration dynamics in eastern Indian river basins during 1985–2005 using variable infiltration capacity approach. J. Earth Syst. Sci. 2018, 127, 19. [Google Scholar] [CrossRef]
- Deng, J.S.; Wang, K.; Hong, Y.; Qi, J.G. Spatio-temporal dynamics and evolution of land use change and landscape pattern in response to rapid urbanization. Landsc. Urban Plan. 2009, 92, 187–198. [Google Scholar] [CrossRef]
- Garg, V.; Nikam, B.R.; Thakur, P.K.; Aggarwal, S.P.; Gupta, P.K.; Srivastav, S.K. Human-induced land use land cover change and its impact on hydrology. HydroResearch 2019, 1, 48–56. [Google Scholar] [CrossRef]
- Jat, M.K.; Garg, P.K.; Khare, D. Monitoring and modelling of urban sprawl using remote sensing and GIS techniques. Int. J. Appl. Earth Obs. Geoinf. 2008, 10, 26–43. [Google Scholar] [CrossRef]
- Martinuzzi, S.; Gould, W.A.; Gonzalez, O.M.R. Land development, land use, and urban sprawl in Puerto Rico integrating remote sensing and population census data. Landsc. Urban Plan. 2007, 79, 288–297. [Google Scholar] [CrossRef]
- Mundia, C.N.; Aniya, M. Dynamics of landuse/cover changes and degradation of Nairobi City, Kenya. Land Degrad. Dev. 2006, 17, 97–108. [Google Scholar] [CrossRef]
- Roshan, G.; Rousta, I.; Ramesh, M. Studying the effects of urban sprawl of metropolis on tourism-climate index oscillation: A case study of Tehran city. J. Geogr. Reg. Plan. 2009, 2, 310–321. [Google Scholar]
- Sudhira, H.; Ramachandra, T.; Jagadish, K. Urban sprawl: Metrics, dynamics and modelling using GIS. Int. J. Appl. Earth Obs. Geoinf. 2004, 5, 29–39. [Google Scholar] [CrossRef]
- Taubenböck, H.; Wegmann, M.; Roth, A.; Mehl, H.; Dech, S. Urbanization in India–Spatiotemporal analysis using remote sensing data. Comput. Environ. Urban Syst. 2009, 33, 179–188. [Google Scholar] [CrossRef]
- Wu, K.-Y.; Zhang, H. Land use dynamics, built-up land expansion patterns, and driving forces analysis of the fast-growing Hangzhou metropolitan area, eastern China (1978–2008). Appl. Geogr. 2012, 34, 137–145. [Google Scholar] [CrossRef]
- Yu, X.J.; Ng, C.N. Spatial and temporal dynamics of urban sprawl along two urban-rural transects: A case study of Guangzhou, China. Landsc. Urban Plan. 2007, 79, 96–109. [Google Scholar] [CrossRef]
- Yuan, F. Urban growth monitoring and projection using remote sensing and geographic information systems: A case study in the twin cities metropolitan area, Minnesota. Geocarto Int. 2010, 25, 213–230. [Google Scholar] [CrossRef]
- Rahman, A.; Aggarwal, S.P.; Netzband, M.; Fazal, S. Monitoring urban sprawl using remote sensing and GIS techniques of a fast growing urban centre, India. IEEE J. Sel. Top. Appl. Earth Obs. Remote Sens. 2010, 4, 56–64. [Google Scholar] [CrossRef]
- De Koning, G.; Benítez, P.; Munoz, F.; Olschewski, R. Modelling the impacts of payments for biodiversity conservation on regional land-use patterns. Lands Urban Plan. 2007, 83, 255–267. [Google Scholar] [CrossRef]
- Yamaura, Y.; Amano, T.; Koizumi, T.; Mitsuda, Y.; Taki, H.; Okabe, K. Does land-use change affect biodiversity dynamics at a macroecological scale? A case study of birds over the past 20 years in Japan. Anim. Conserv. 2009, 12, 110–119. [Google Scholar] [CrossRef]
- Shalaby, A.; Tateishi, R. Remote sensing and GIS for mapping and monitoring land cover and land-use changes in the Northwestern coastal zone of Egypt. Appl. Geogr. 2007, 27, 28–41. [Google Scholar] [CrossRef]
- Meyer, W.B.; Meyer, W.B.; BL Turner, I. Changes in Land Use and Land Cover: A Global Perspective; Cambridge University Press: Cambridge, UK, 1994; Volume 4. [Google Scholar]
- Ojima, D.; Galvin, K.; Turner, B. The global impact of land-use change. BioScience 1994, 44, 300–304. [Google Scholar] [CrossRef]
- Foley, J.A.; DeFries, R.; Asner, G.P.; Barford, C.; Bonan, G.; Carpenter, S.R.; Chapin, F.S.; Coe, M.T.; Daily, G.C.; Gibbs, H.K. Global consequences of land use. Science 2005, 309, 570–574. [Google Scholar] [CrossRef]
- Quétier, F.; Lavorel, S.; Thuiller, W.; Davies, I. Plant-trait-based modeling assessment of ecosystem-service sensitivity to land-use change. Ecol. Appl. 2007, 17, 2377–2386. [Google Scholar] [CrossRef] [PubMed]
- Dixon, R.K.; Solomon, A.; Brown, S.; Houghton, R.; Trexier, M.; Wisniewski, J. Carbon pools and flux of global forest ecosystems. Science 1994, 263, 185–190. [Google Scholar] [CrossRef] [PubMed]
- Alves, D.S.; Skole, D.L. Characterizing land cover dynamics using multi-temporal imagery. Int. J. Remote Sens. 1996, 17, 835–839. [Google Scholar] [CrossRef]
- Abdullah, S.A.; Nakagoshi, N. Changes in landscape spatial pattern in the highly developing state of Selangor, peninsular Malaysia. Landsc. Urban Plan. 2006, 77, 263–275. [Google Scholar] [CrossRef]
- Guan, D.; Li, H.; Inohae, T.; Su, W.; Nagaie, T.; Hokao, K. Modeling urban land use change by the integration of cellular automaton and Markov model. Ecol. Model. 2011, 222, 3761–3772. [Google Scholar] [CrossRef]
- Garg, V.; Aggarwal, S.; Nikam, B.; Thakur, P. Hypothetical scenario-based impact assessment of climate change on runoff potential of a basin. ISH J. Hydraul. Eng. 2013, 19, 244–249. [Google Scholar] [CrossRef]
- Shi, Z.-H.; Chen, L.-D.; Fang, N.-F.; Qin, D.-F.; Cai, C.-F. Research on the SCS-CN initial abstraction ratio using rainfall-runoff event analysis in the Three Gorges Area, China. Catena 2009, 77, 1–7. [Google Scholar] [CrossRef]
- Aggarwal, S.; Garg, V.; Gupta, P.K.; Nikam, B.R.; Thakur, P.K.; Roy, P. Run-off potential assessment over Indian landmass: A macro-scale hydrological modelling approach. Curr. Sci. 2013, 950–959. [Google Scholar]
- Aggarwal, S.; Thakur, P.K.; Nikam, B.R.; Garg, V. Integrated approach for snowmelt run-off estimation using temperature index model, remote sensing and GIS. Curr. Sci. 2014, 106, 397–407. [Google Scholar]
- Beven, K.J.; Kirkby, M.J. A physically based, variable contributing area model of basin hydrology/Un modèle à base physique de zone d’appel variable de l’hydrologie du bassin versant. Hydrol. Sci. J. 1979, 24, 43–69. [Google Scholar] [CrossRef]
- Thakur, P.K.; Nikam, B.R.; Garg, V.; Aggarwal, S.P.; Chouksey, A.; Dhote, P.R.; Ghosh, S. Hydrological parameters estimation using remote sensing and GIS for Indian region: A review. Proc. Nat. Acad. Sci. India Sect. Phys. Sci. 2017, 87, 641–659. [Google Scholar] [CrossRef]
- Nayak, T.; Jaiswal, R. Rainfall-runoff modelling using satellite data and GIS for Bebas river in Madhya Pradesh. J. Inst. Eng. India. Civ. Eng. Div. 2003, 84, 47–50. [Google Scholar]
- Grayson, R.B.; Moore, I.D.; McMahon, T.A. Physically based hydrologic modeling: 2. Is the concept realistic? Water Res. Res. 1992, 28, 2659–2666. [Google Scholar] [CrossRef]
- Tiwari, K.; Kumar, P.; Sebastian, M.; Pal, D. Hydrologic modelling for runoff determination: Remote sensing techniques. Int. J. Water Res. Dev. 1991, 7, 178–184. [Google Scholar] [CrossRef]
- Kumar, P.; Tiwart, K.; Pal, D. Establishing SCS runoff curve number from IRS digital data base. J. Indian Soc. Remote Sens. 1991, 19, 245–252. [Google Scholar] [CrossRef]
- Psomiadis, E.; Soulis, K.X.; Efthimiou, N. Using SCS-CN and Earth observation for the comparative assessment of the hydrological effect of gradual and abrupt spatiotemporal land cover changes. Water 2020, 12, 1386. [Google Scholar] [CrossRef]
- Sharpley, A.N.; Williams, J.R. I: Model documentation. II: User manual. In EPIC-Erosion/Productivity Impact Calculator; Technical Bulletin Number 1768; United States Department of Agriculture: Washington, DC, USA, 1990. [Google Scholar]
- Garg, V.; Nikam, B.R.; Thakur, P.K.; Aggarwal, S. Assessment of the effect of slope on runoff potential of a watershed using NRCS-CN method. Int. J. Hydrol. Sci. Technol. 2013, 3, 141–159. [Google Scholar] [CrossRef]
- Haggard, B.; Moore, P.; Delaune, P.; Smith, D.; Formica, S.; Kleinman, P.; Daniel, T. Effect of slope, grazing and aeration on pasture hydrology. In Proceedings of the ASAE Annual International Meeting/CIGR XVth World Congress, Hyatt Regency. Chicago, IL, USA, 28–31 July 2002. [Google Scholar]
- Chaplot, V.A.; Le Bissonnais, Y. Runoff features for interrill erosion at different rainfall intensities, slope lengths, and gradients in an agricultural loessial hillslope. Soil Sci. Soc. Am. J. 2003, 67, 844–851. [Google Scholar] [CrossRef]
- Akbarimehr, M.; Naghdi, R. Assessing the relationship of slope and runoff volume on skid trails (Case study: Nav 3 district). J. For. Sci. 2012, 58, 357–362. [Google Scholar] [CrossRef]
- Aggarwal, S.; Garg, V.; Gupta, P.K.; Nikam, B.R.; Thakur, P.K. Climate and LULC change scenarios to study its impact on hydrological regime. Int. Arch. Photogramm. Remote Sens. Spat. Inf. Sci. 2012, 39, B8. [Google Scholar] [CrossRef]
- Van Ty, T.; Sunada, K.; Ichikawa, Y.; Oishi, S. Scenario-based impact assessment of land use/cover and climate changes on water resources and demand: A case study in the Srepok River Basin, Vietnam—Cambodia. Water Res. Manag. 2012, 26, 1387–1407. [Google Scholar]
- Wu, F.; Zhan, J.; Su, H.; Yan, H.; Ma, E. Scenario-based impact assessment of land use/cover and climate changes on watershed hydrology in Heihe River Basin of northwest China. Adv. Meteorol. 2015, 2015, 12. [Google Scholar] [CrossRef]
- Nikam, B.R.; Garg, V.; Jeyaprakash, K.; Gupta, P.K.; Srivastav, S.K.; Thakur, P.K.; Aggarwal, S.P. Analyzing future water availability and hydrological extremes in the Krishna basin under changing climatic conditions. Arab. J. Geosci. 2018, 11, 581. [Google Scholar] [CrossRef]
- Gupta, K.; Kumar, P.; Pathan, S.K.; Sharma, K.P. Urban neighborhood green index–A measure of green spaces in urban areas. Landsc. Urban Plan. 2012, 105, 325–335. [Google Scholar] [CrossRef]
- Siddiqui, A.; Siddiqui, A.; Maithani, S.; Jha, A.; Kumar, P.; Srivastav, S. Urban growth dynamics of an Indian metropolitan using CA Markov and Logistic Regression. Egypt. J. Remote Sens. Space Sci. 2018, 21, 229–236. [Google Scholar] [CrossRef]
- Kumar, P.; Siddiqui, A.; Gupta, K.; Jain, S.; Bharath, B.; Maithani, S. Understanding urban environment in Northwest Himalaya: Role of geospatial technology. In Remote Sensing of Northwest Himalayan Ecosystems; Springer: Singapore, 2019; pp. 403–431. [Google Scholar]
- Rousta, I.; Olafsson, H.; Moniruzzaman, M.; Ardö, J.; Zhang, H.; Mushore, T.D.; Shahin, S.; Azim, S. The 2000–2017 drought risk assessment of the western and southwestern basins in Iran. Model. Earth Syst. Environ. Res. 2020, 6, 1201–1221. [Google Scholar] [CrossRef]
- Thakur, P.K.; Aggarwal, S.; Aggarwal, S.; Jain, S. One-dimensional hydrodynamic modeling of GLOF and impact on hydropower projects in Dhauliganga River using remote sensing and GIS applications. Nat. Hazards 2016, 83, 1057–1075. [Google Scholar] [CrossRef]
- Kaushik, S.; Dhote, P.R.; Thakur, P.K.; Nikam, B.R.; Aggarwal, S.P. An integrated approach for identification of waterlogged areas using RS and GIS technique and groundwater modelling. Sustain. Water Resour. Manag. 2019, 5, 1887–1901. [Google Scholar] [CrossRef]
- Mamun, A.A.; Mahmood, A.; Rahman, M. Identification and monitoring the change of land use pattern using remote sensing and GIS: A case study of Dhaka City. IOSR J. Mech. Civ. Eng. 2013, 6, 20–28. [Google Scholar] [CrossRef]
- Dewan, A.M.; Yamaguchi, Y. Land use and land cover change in Greater Dhaka, Bangladesh: Using remote sensing to promote sustainable urbanization. Appl. Geogr. 2009, 29, 390–401. [Google Scholar] [CrossRef]
- World Population Review. Available online: https://worldpopulationreview.com/world-cities/dhaka-population/ (accessed on 4 May 2020).
- Kabir, A.; Parolin, B. Planning and development of Dhaka—A story of 400 years. In Proceedings of the 15th International Planning History Society Conference, São Paulo, Brasil, 15–18 July 2012; pp. 1–20. [Google Scholar]
- Bronstert, A.; Bürger, G.; Heidenreich, M.; Katzenmaier, D.; Köhler, B. Effects of climate change influencing storm runoff generation: Basic considerations and a pilot study in Germany. In Impact of Climate Change on Flooding and Sustainable River Management. Proceedings of the 2. International RIBAMOD Workshop, Wallingford, UK, 26–27 Februar 1998; Casale, R., Bronstert, A., Samuels, P., Eds.; John Wiley & Sons, Ltd.: Hoboken, NJ, USA, 1999. [Google Scholar]
- Dunjó, G.; Pardini, G.; Gispert, M. The role of land use-land cover on runoff generation and sediment yield at a microplot scale, in a small Mediterranean catchment. J. Arid Environ. 2004, 57, 239–256. [Google Scholar] [CrossRef]
- United States Geological Survey. Available online: http://earthexplorer.usgs.gov/ (accessed on 13 June 2018).
- Ahmed, B.; Ahmed, R. Modeling urban land cover growth dynamics using multitemporal satellite images: A case study of Dhaka, Bangladesh. ISPRS Int. J. Geo Inf. 2012, 1, 3–31. [Google Scholar] [CrossRef]
- Hussain, M.; Alak, P.; Azmz, I. Spatio-temporal analysis of land use and land cover changes in Chittagong city corporation, Bangladesh. Int. J. Adv. Remote Sens. GIS Geogr 2016, 4, 56–72. [Google Scholar]
- Musgrave, G. How much of the rain enters the soil. In Yearbook od Agriculture; United States Department of Agriculture: Washington, DC, USA, 1955; pp. 151–159. [Google Scholar]
- Cronshey, R. Urban Hydrology for Small Watersheds; United States Department of Agriculture: Washington, DC, USA, 1986.
- U.S. Department of Agriculture (USDA). Natural Resources Conservation Service (USDA-NRCS) National Engineering Handbook; US Deptartment of Agriculture, Soil Conservation Service, Engineering Division: Washington, DC, USA, 2009; Chapter 7: Hydrologic Soil Groups; p. 13.
- Subramanya, K. Engineering Hydrology, 4th ed.; Tata McGraw-Hill Education: New York, NY, USA, 2013. [Google Scholar]
- Hjelmfelt Jr, A.T. Investigation of curve number procedure. J. Hydraul. Eng. 1991, 117, 725–737. [Google Scholar] [CrossRef]
- Kumar, S.; Ranta, M.; Praveen, T. Analysis of the run off for watershed using SCS-CN method and geographic information systems. Int. J. Eng. Sci. Technol. 2010, 2, 3947–3954. [Google Scholar]
- Soulis, K.; Valiantzas, J. SCS-CN parameter determination using rainfall-runoff data in heterogeneous watersheds-the two-CN system approach. Hydrol. Earth Syst. Sci. 2012, 16, 1001. [Google Scholar] [CrossRef]
- Askar, M.K. Rainfall-runoff model using the SCS-CN method and geographic information systems: A case study of Gomal River watershed. WIT Trans. Ecol. Environ. 2013, 178, 159–170. [Google Scholar]
- Hernández-Guzmán, R.; Ruiz-Luna, A. SARA—An enhanced curve number-based tool for estimating direct runoff. J. Hydroinf. 2013, 15, 881–887. [Google Scholar] [CrossRef]
- Satheeshkumar, S.; Venkateswaran, S.; Kannan, R. Rainfall–runoff estimation using SCS-CN and GIS approach in the Pappiredipatti watershed of the Vaniyar sub basin, South India. Model. Earth Syst. Environ. Res. 2017, 3, 24. [Google Scholar] [CrossRef]
- Mohammed, K.; Saiful Islam, A.; Tarekul Islam, G.; Alfieri, L.; Bala, S.K.; Uddin Khan, M.J. Impact of high-end climate change on floods and low flows of the Brahmaputra River. J. Hydrol. Eng. 2017, 22, 04017041. [Google Scholar] [CrossRef]
- Kirby, J.; Mainuddin, M.; Mpelasoka, F.; Ahmad, M.; Palash, W.; Quadir, M.; Shah-Newaz, S.; Hossain, M. The impact of climate change on regional water balances in Bangladesh. Clim. Chang. 2016, 135, 481–491. [Google Scholar] [CrossRef]
- Barua, S.; van Ast, J.A. Towards interactive flood management in Dhaka, Bangladesh. Water Policy 2011, 13, 693–716. [Google Scholar] [CrossRef]
- Sayed, M.B.; Haruyama, S. Evaluation of flooding risk in greater Dhaka District using satellite data and geomorphological land classification map. J. Geosci. Environ. 2016, 4, 110. [Google Scholar] [CrossRef][Green Version]
- The Independent, 1 June 2018. Available online: http://www.theindependentbd.com/post/152309 (accessed on 15 April 2020).
- Zaman, M.U. The Guardian, 21 March 2018. Available online: https://www.theguardian.com/cities/2018/mar/21/people-pouring-dhaka-bursting-sewers-overpopulation-bangladesh (accessed on 15 April 2020).
- Tarafdar, M.R. The Daily Star, 14 September 2007. Available online: https://www.thedailystar.net/news-detail-3883 (accessed on 15 April 2020).
- Hossain, M.M. The Flood Problem and Mitigation Methods in Bangladesh. Available online: http://www.ifi-home.info/isfd4/docs/May7/Session_11am/Room_A_11am/Flood-Monowar.pdf (accessed on 15 April 2020).
- Haq, S.K.; Hossain, L.; Shumon, R.; Khan, P.; Das, P. The Daily Star, 2 September 2015. Available online: https://www.thedailystar.net/frontpage/dhaka-deluged-136426 (accessed on 15 April 2020).
Publisher’s Note: MDPI stays neutral with regard to jurisdictional claims in published maps and institutional affiliations. |
© 2020 by the authors. Licensee MDPI, Basel, Switzerland. This article is an open access article distributed under the terms and conditions of the Creative Commons Attribution (CC BY) license (http://creativecommons.org/licenses/by/4.0/).