Spatiotemporal Characteristics of Drought and Driving Factors Based on the GRACE-Derived Total Storage Deficit Index: A Case Study in Southwest China

Abstract
1. Introduction
2. Study Area and Data
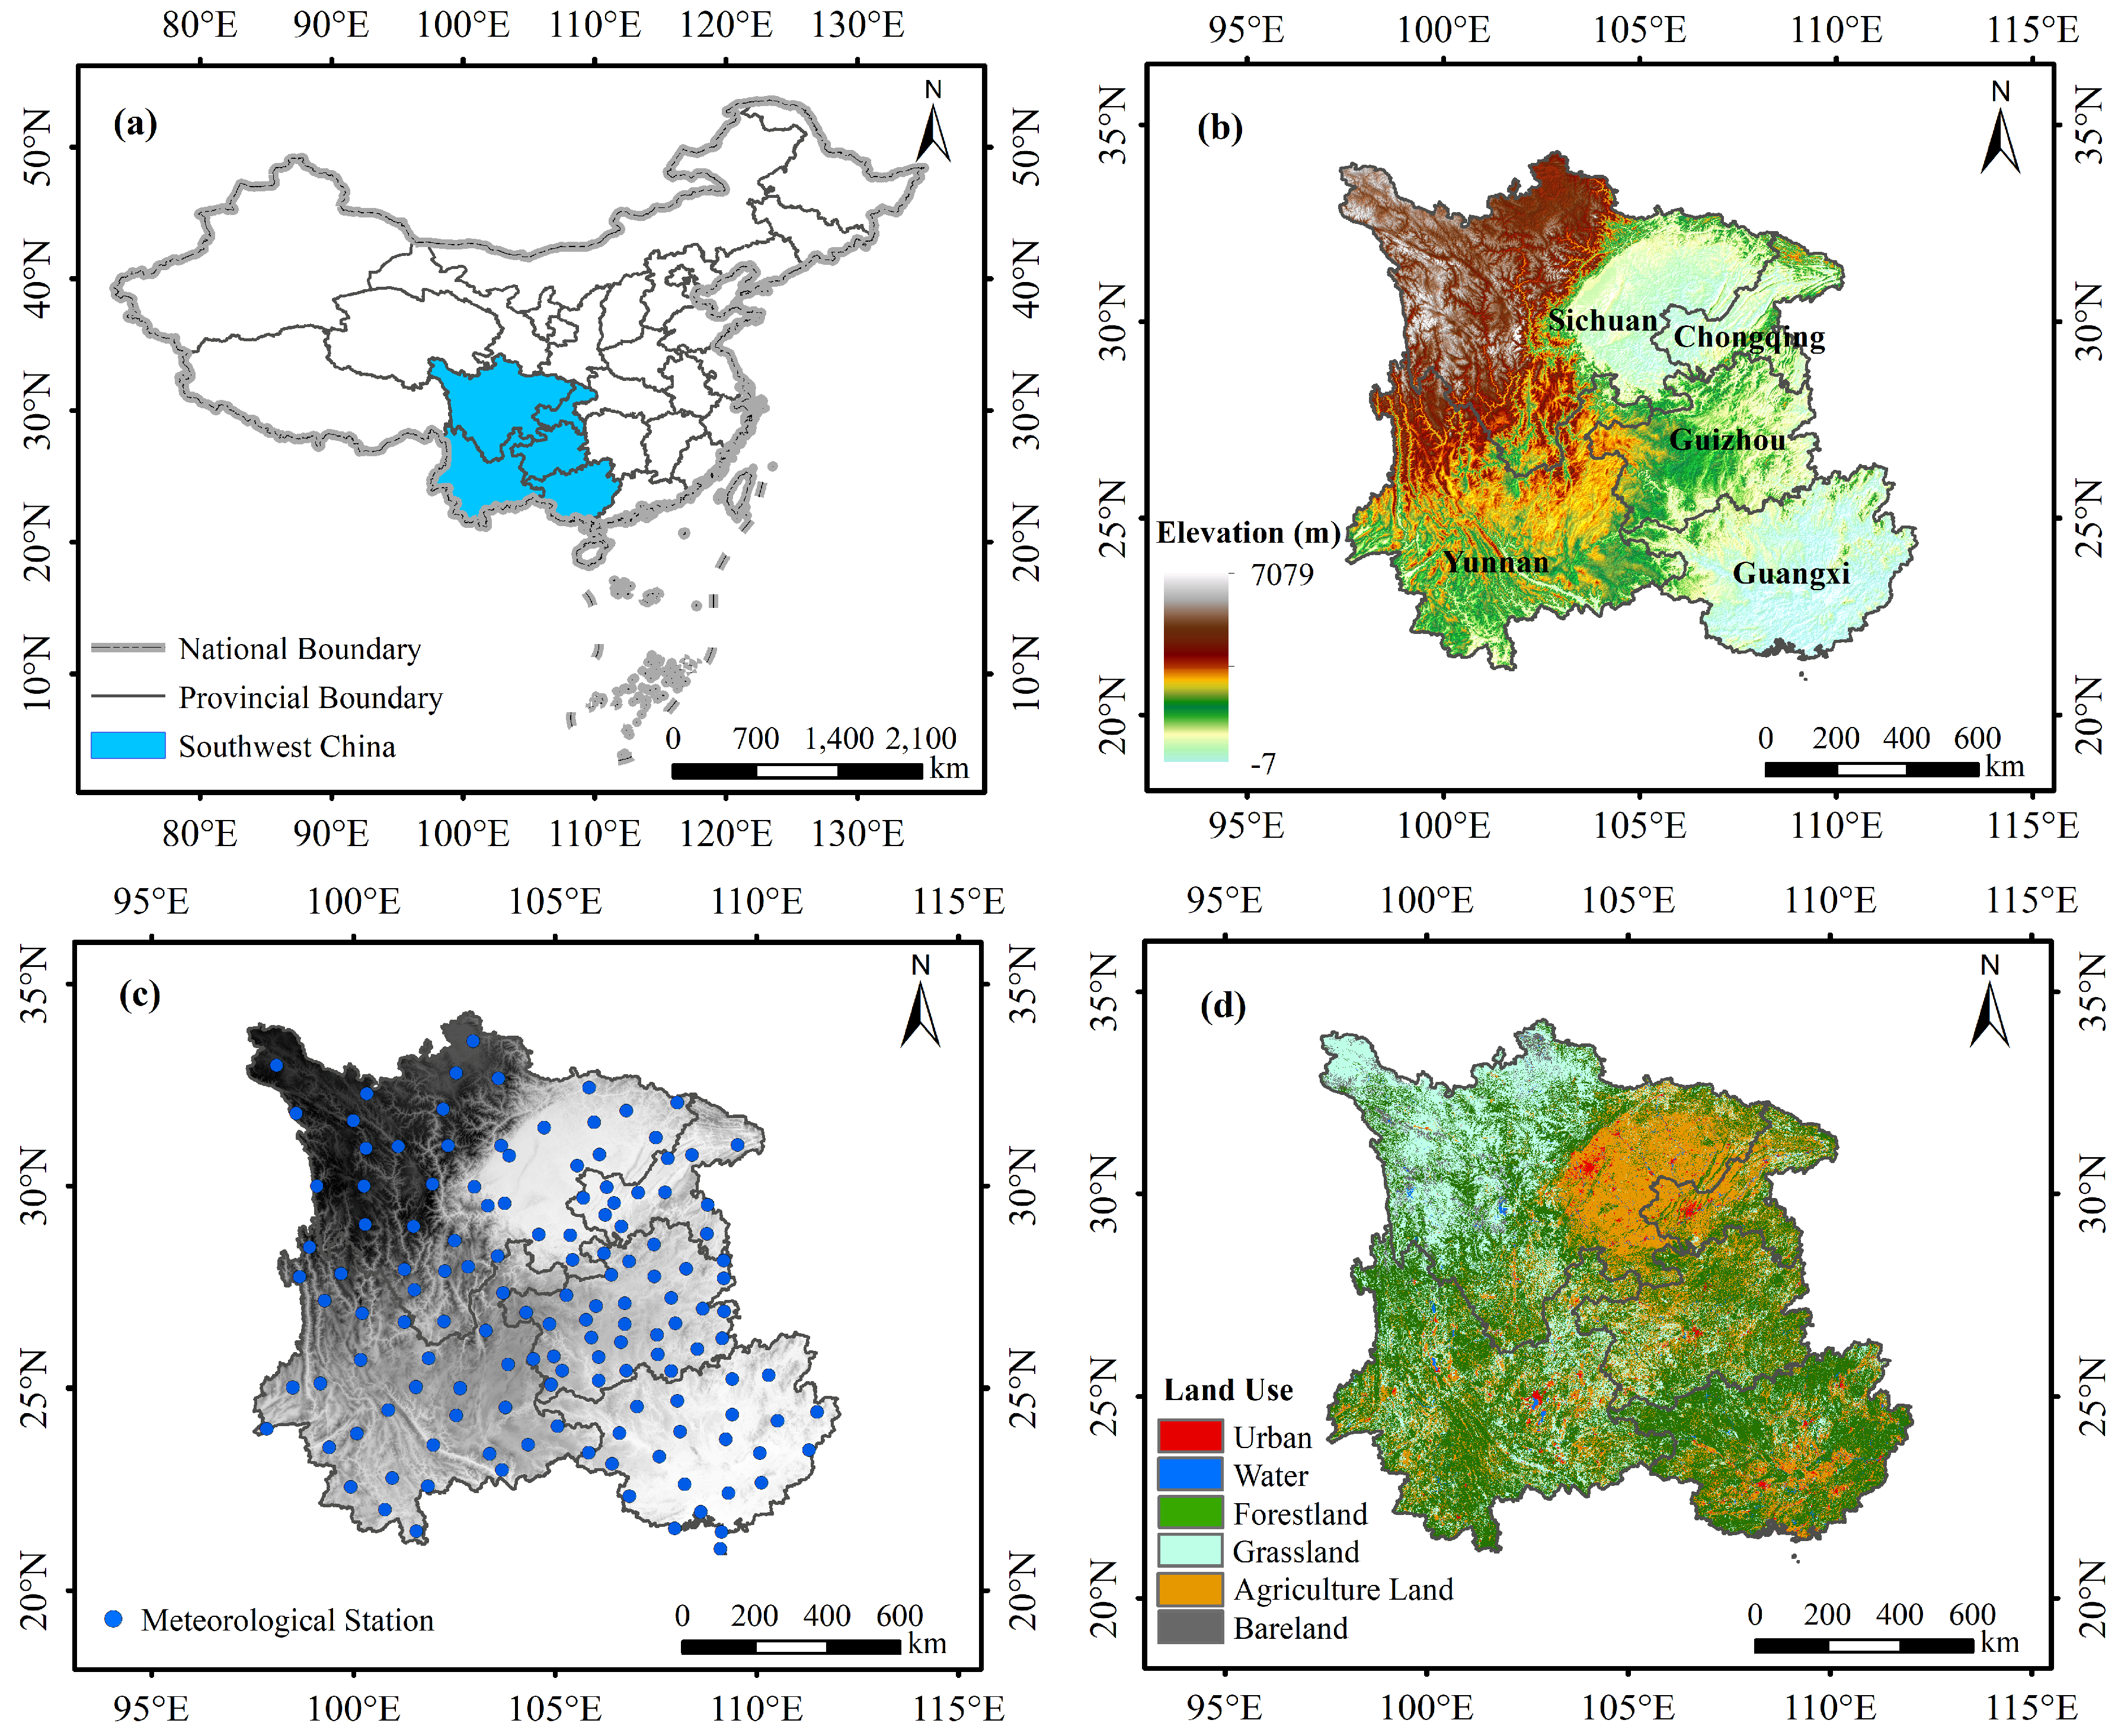
2.1. Study Area
2.2. Data
2.2.1. GRACE Data
2.2.2. Meteorological Data
3. Methods
3.1. GRACE-Based TSDI
3.2. Other Methods
3.2.1. Standardized Drought Indices
3.2.2. Seasonal-trend Decomposition by Loess Method
3.2.3. The Partial Least Square Regression Model
4. Results
4.1. Drought Events Detected by TSDI
4.2. Spatiotemporal Characteristics of Drought
4.2.1. Temporal Evolution of Drought
4.2.2. Spatial Distribution of Drought
4.3. The Links between TSDI and Climate Factors
5. Discussion
5.1. Drought Severity Evaluation
5.2. Influence Factors of Drought
5.3. The Sources of Uncertainties
5.4. Future Direction
6. Conclusions
- (1)
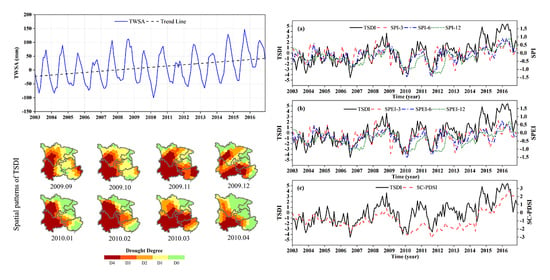
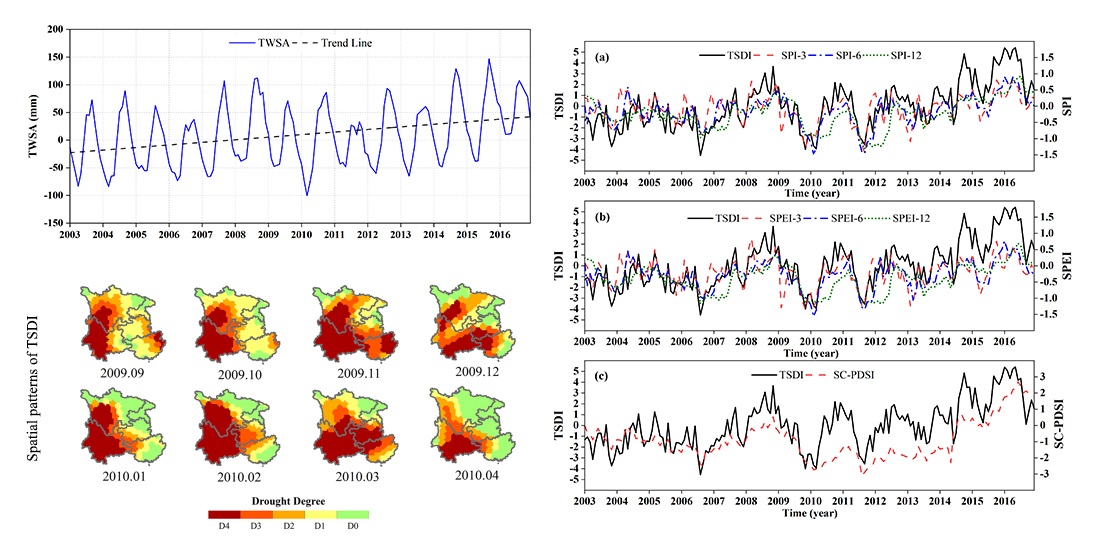
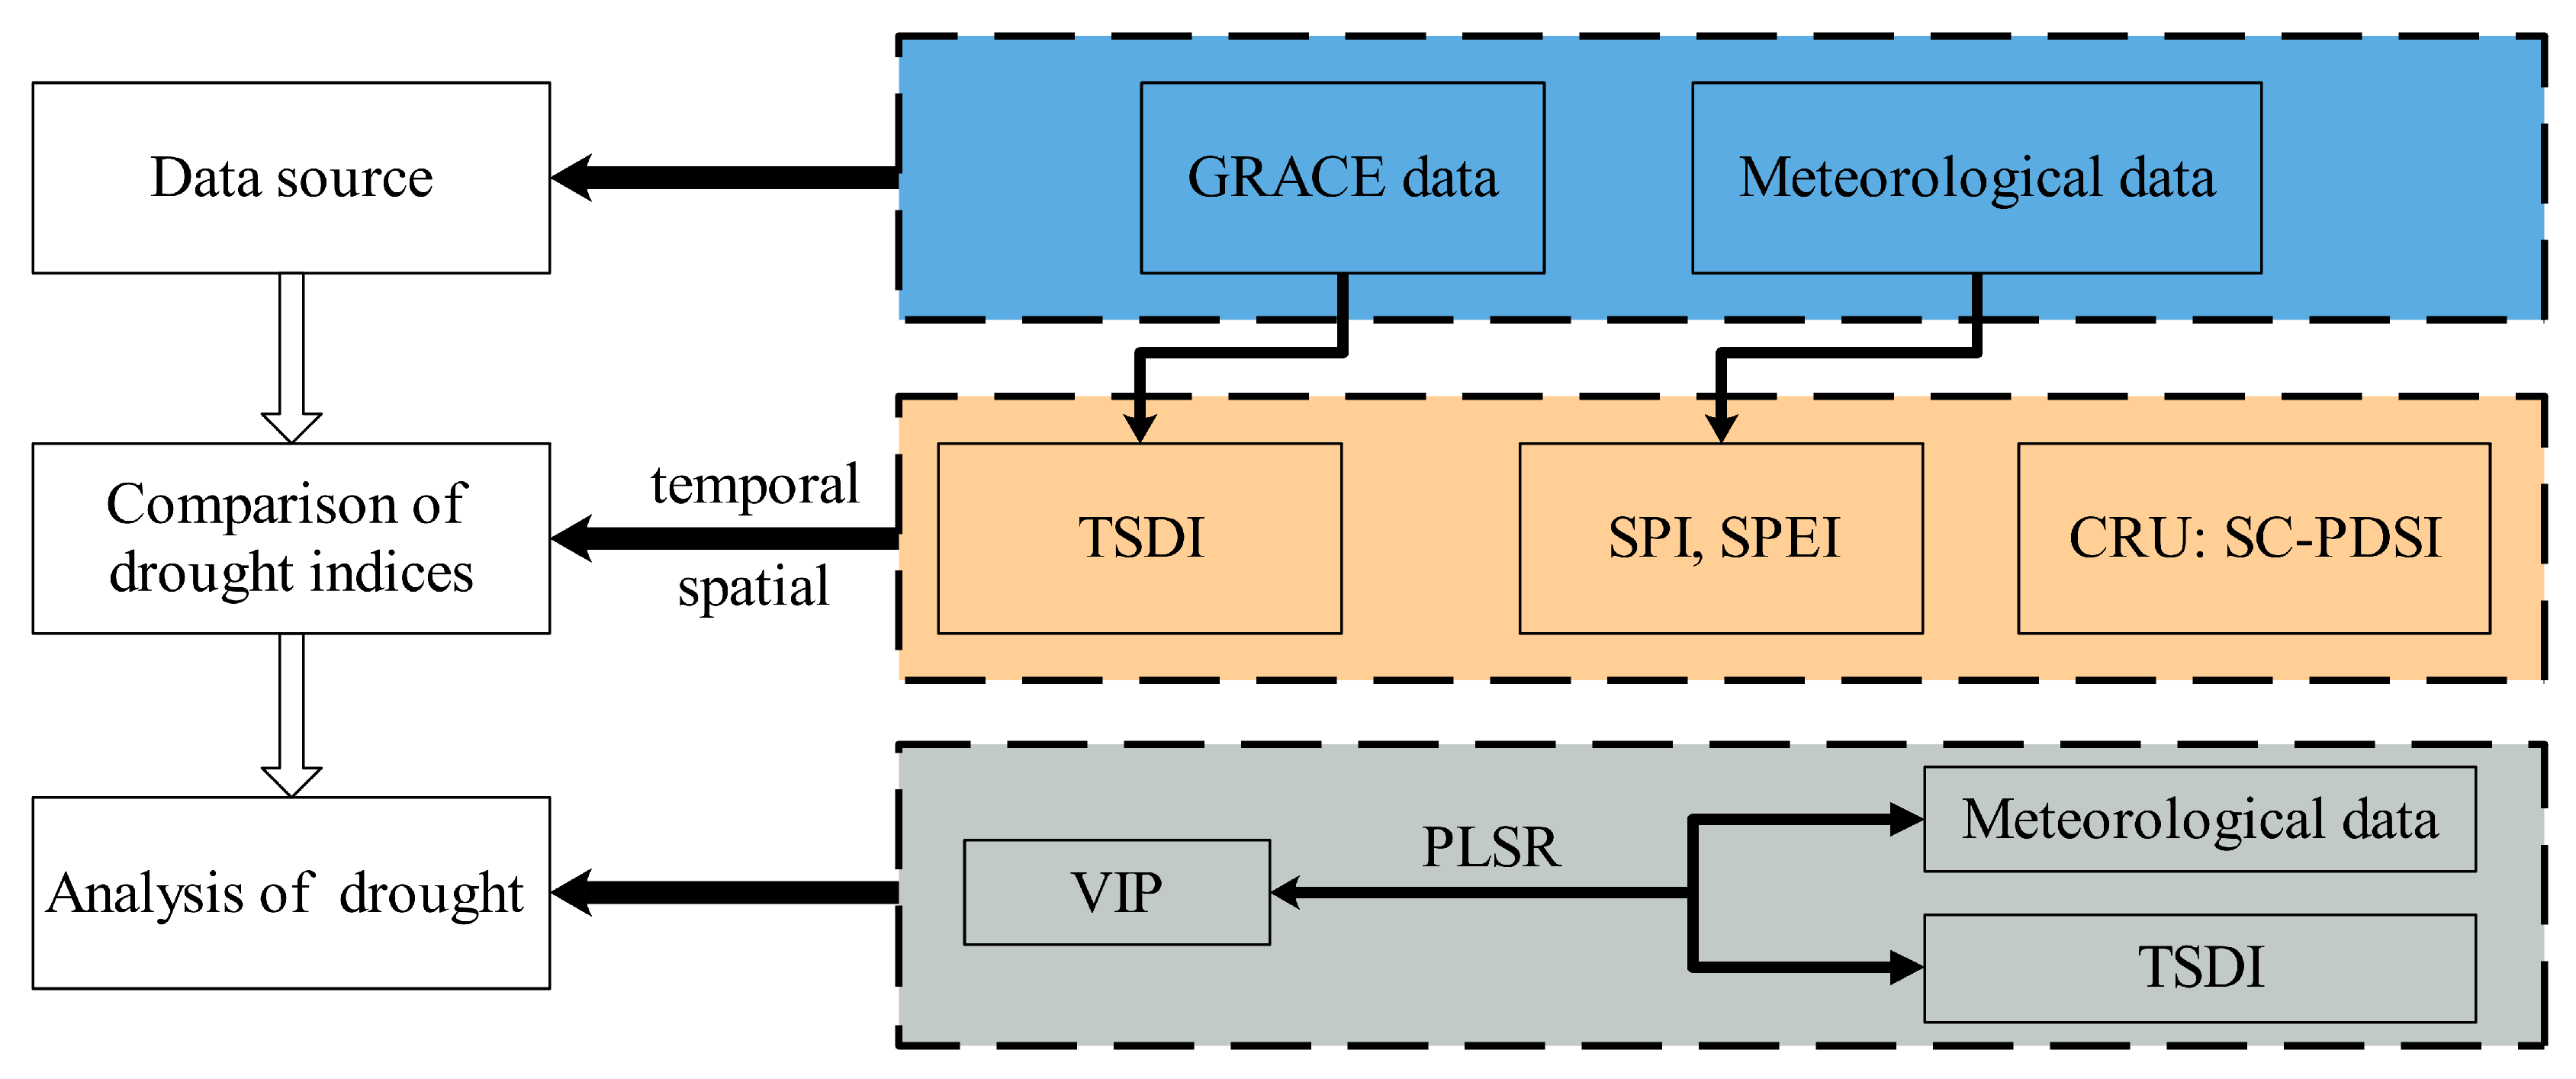
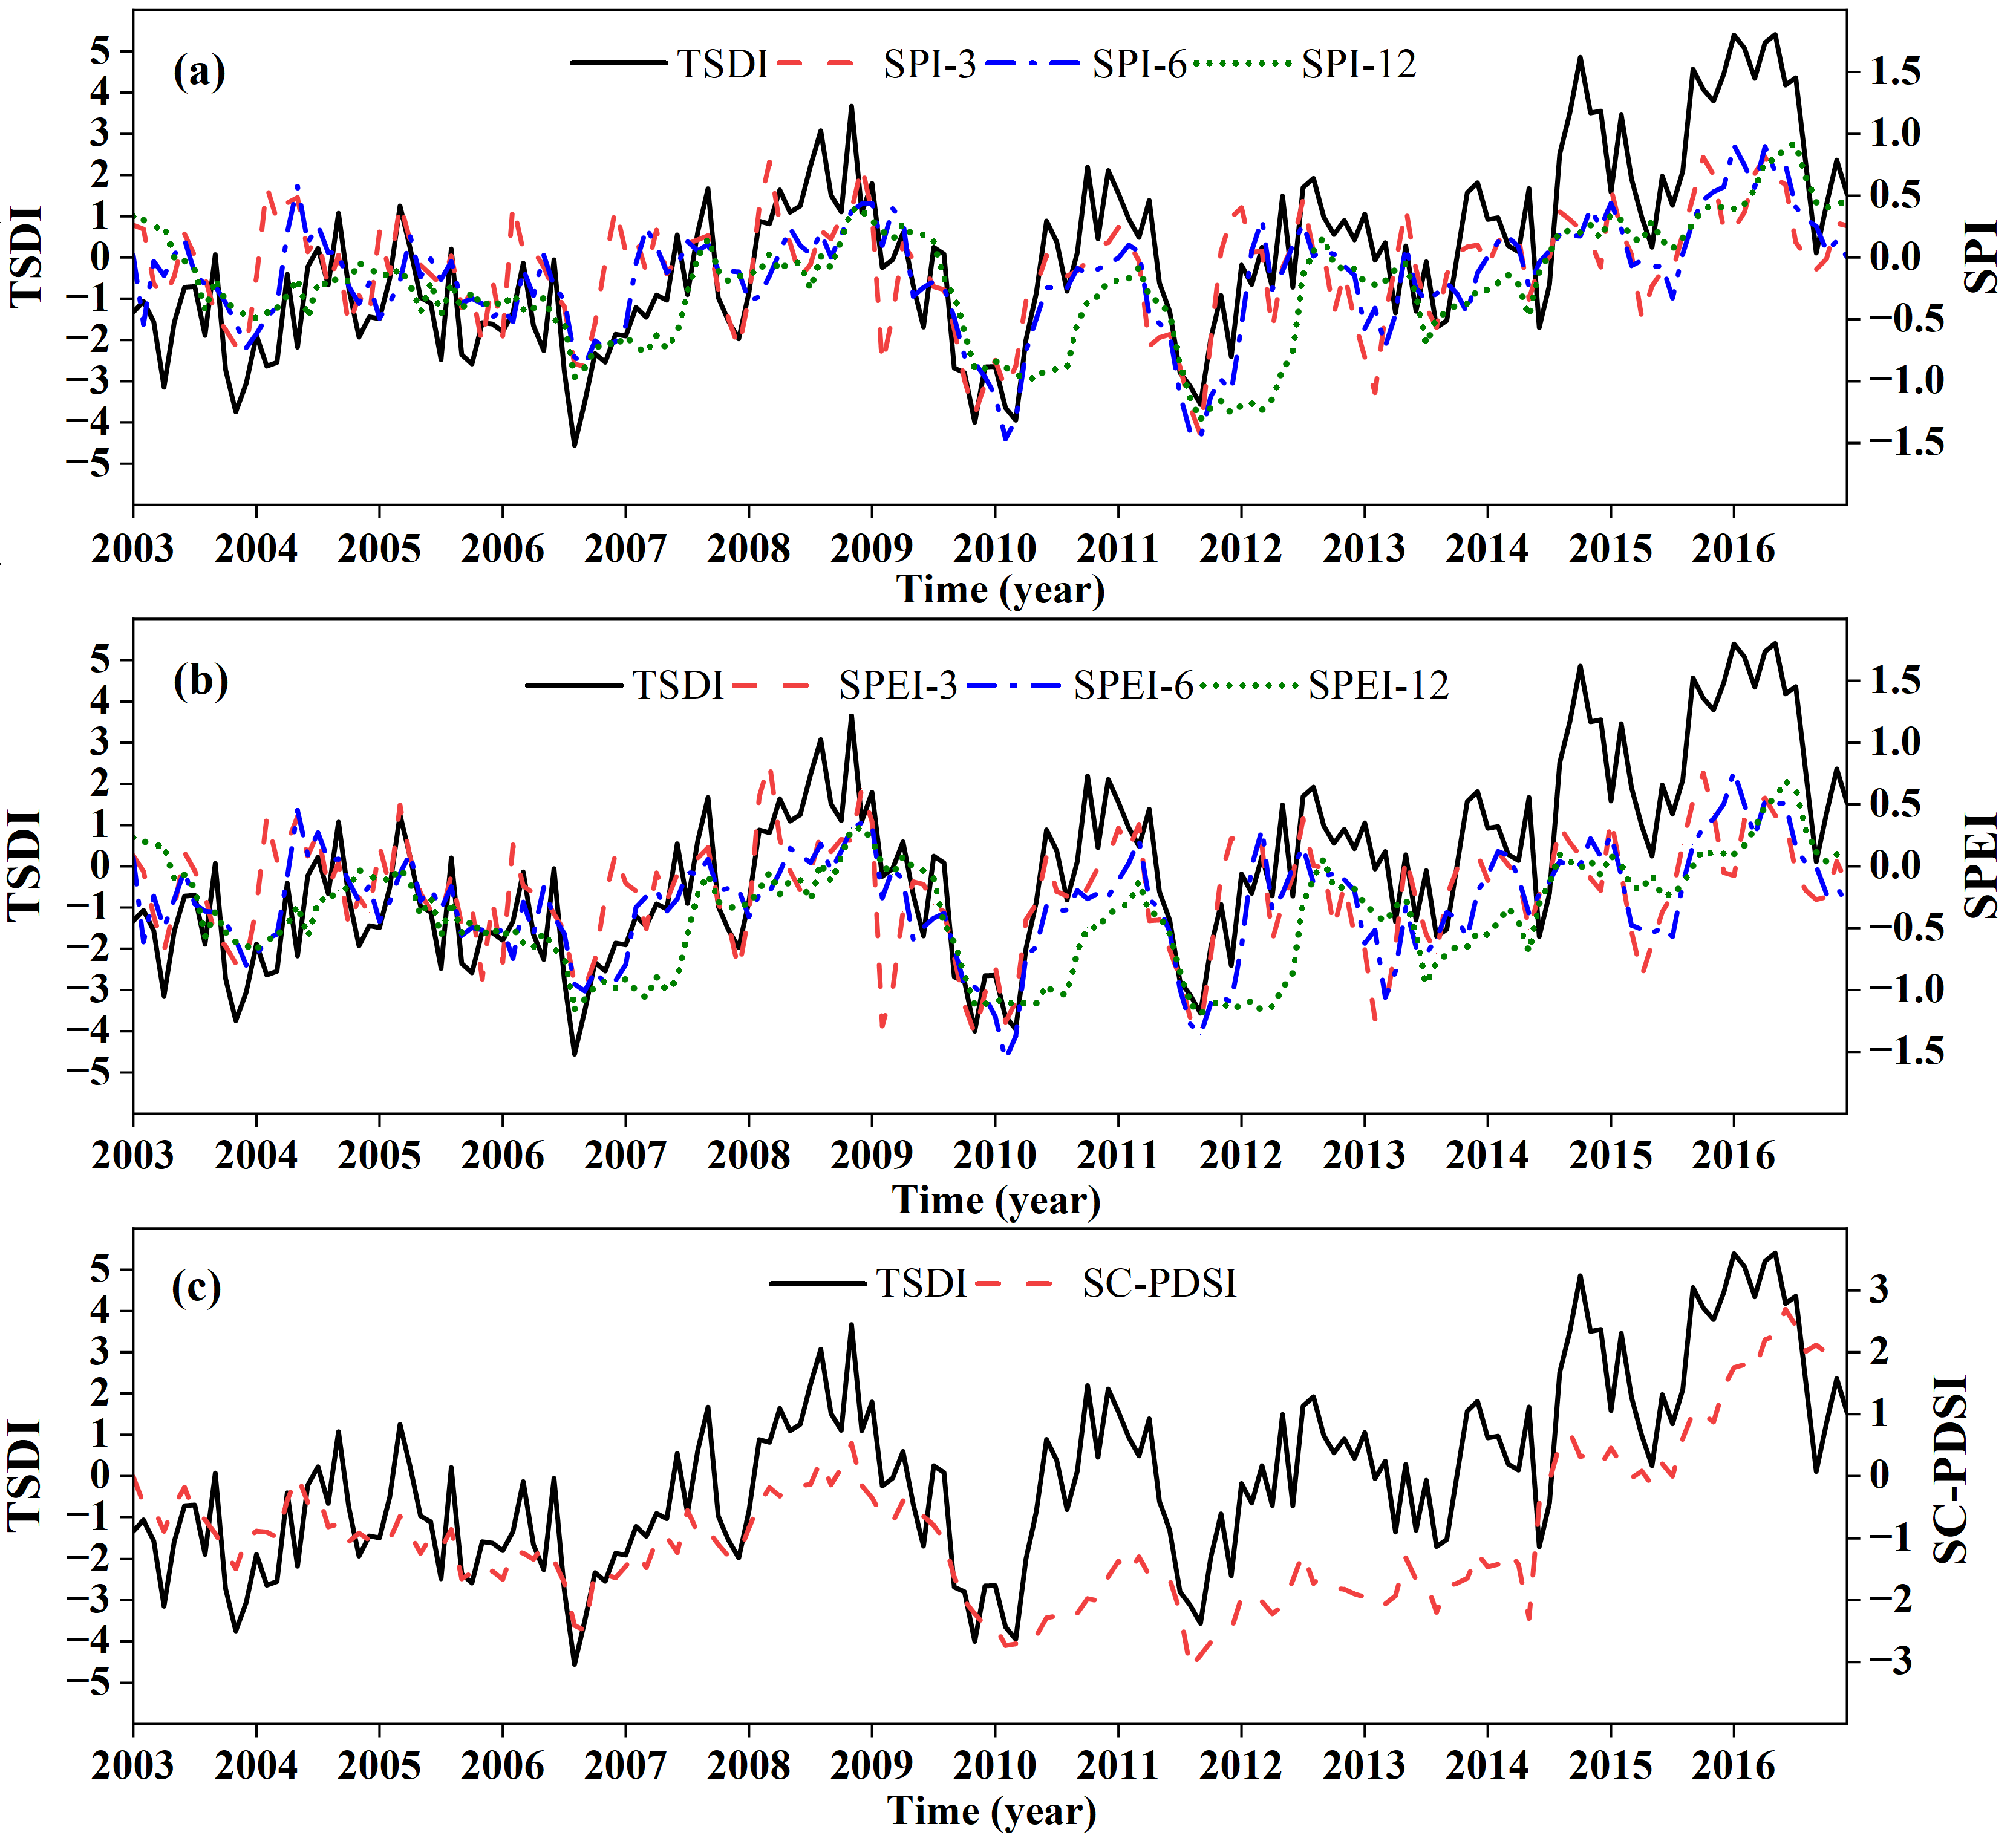
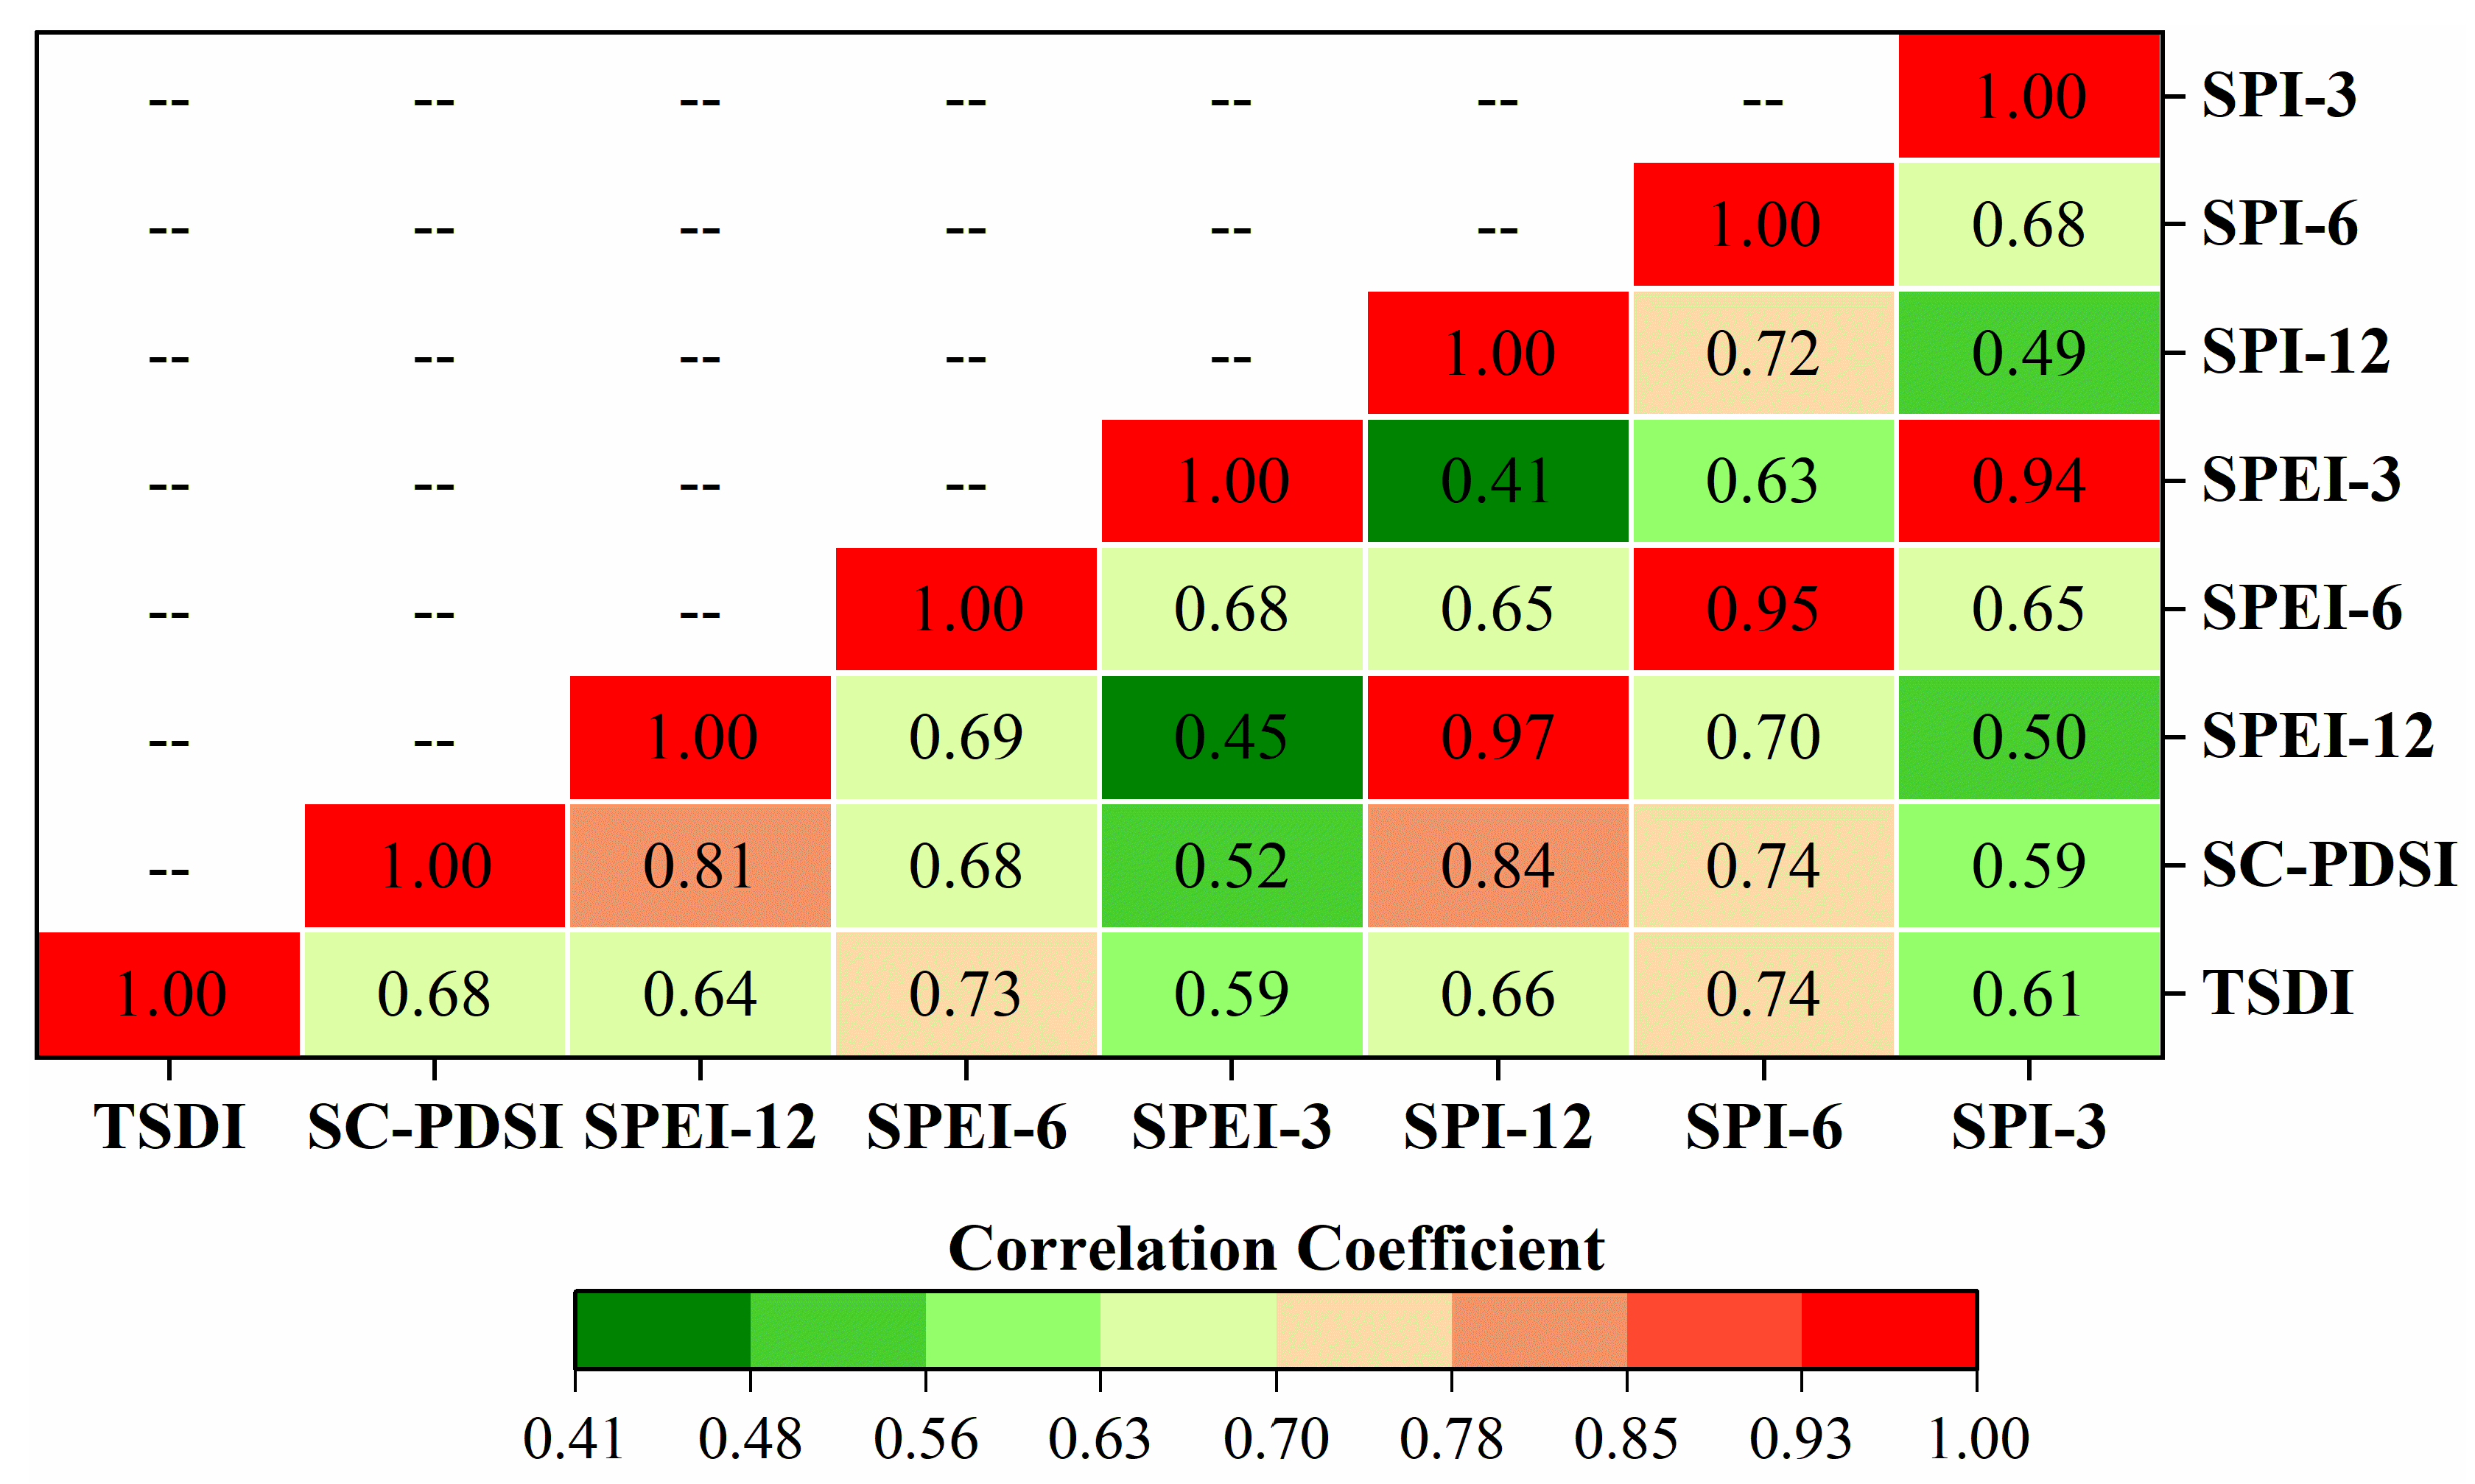
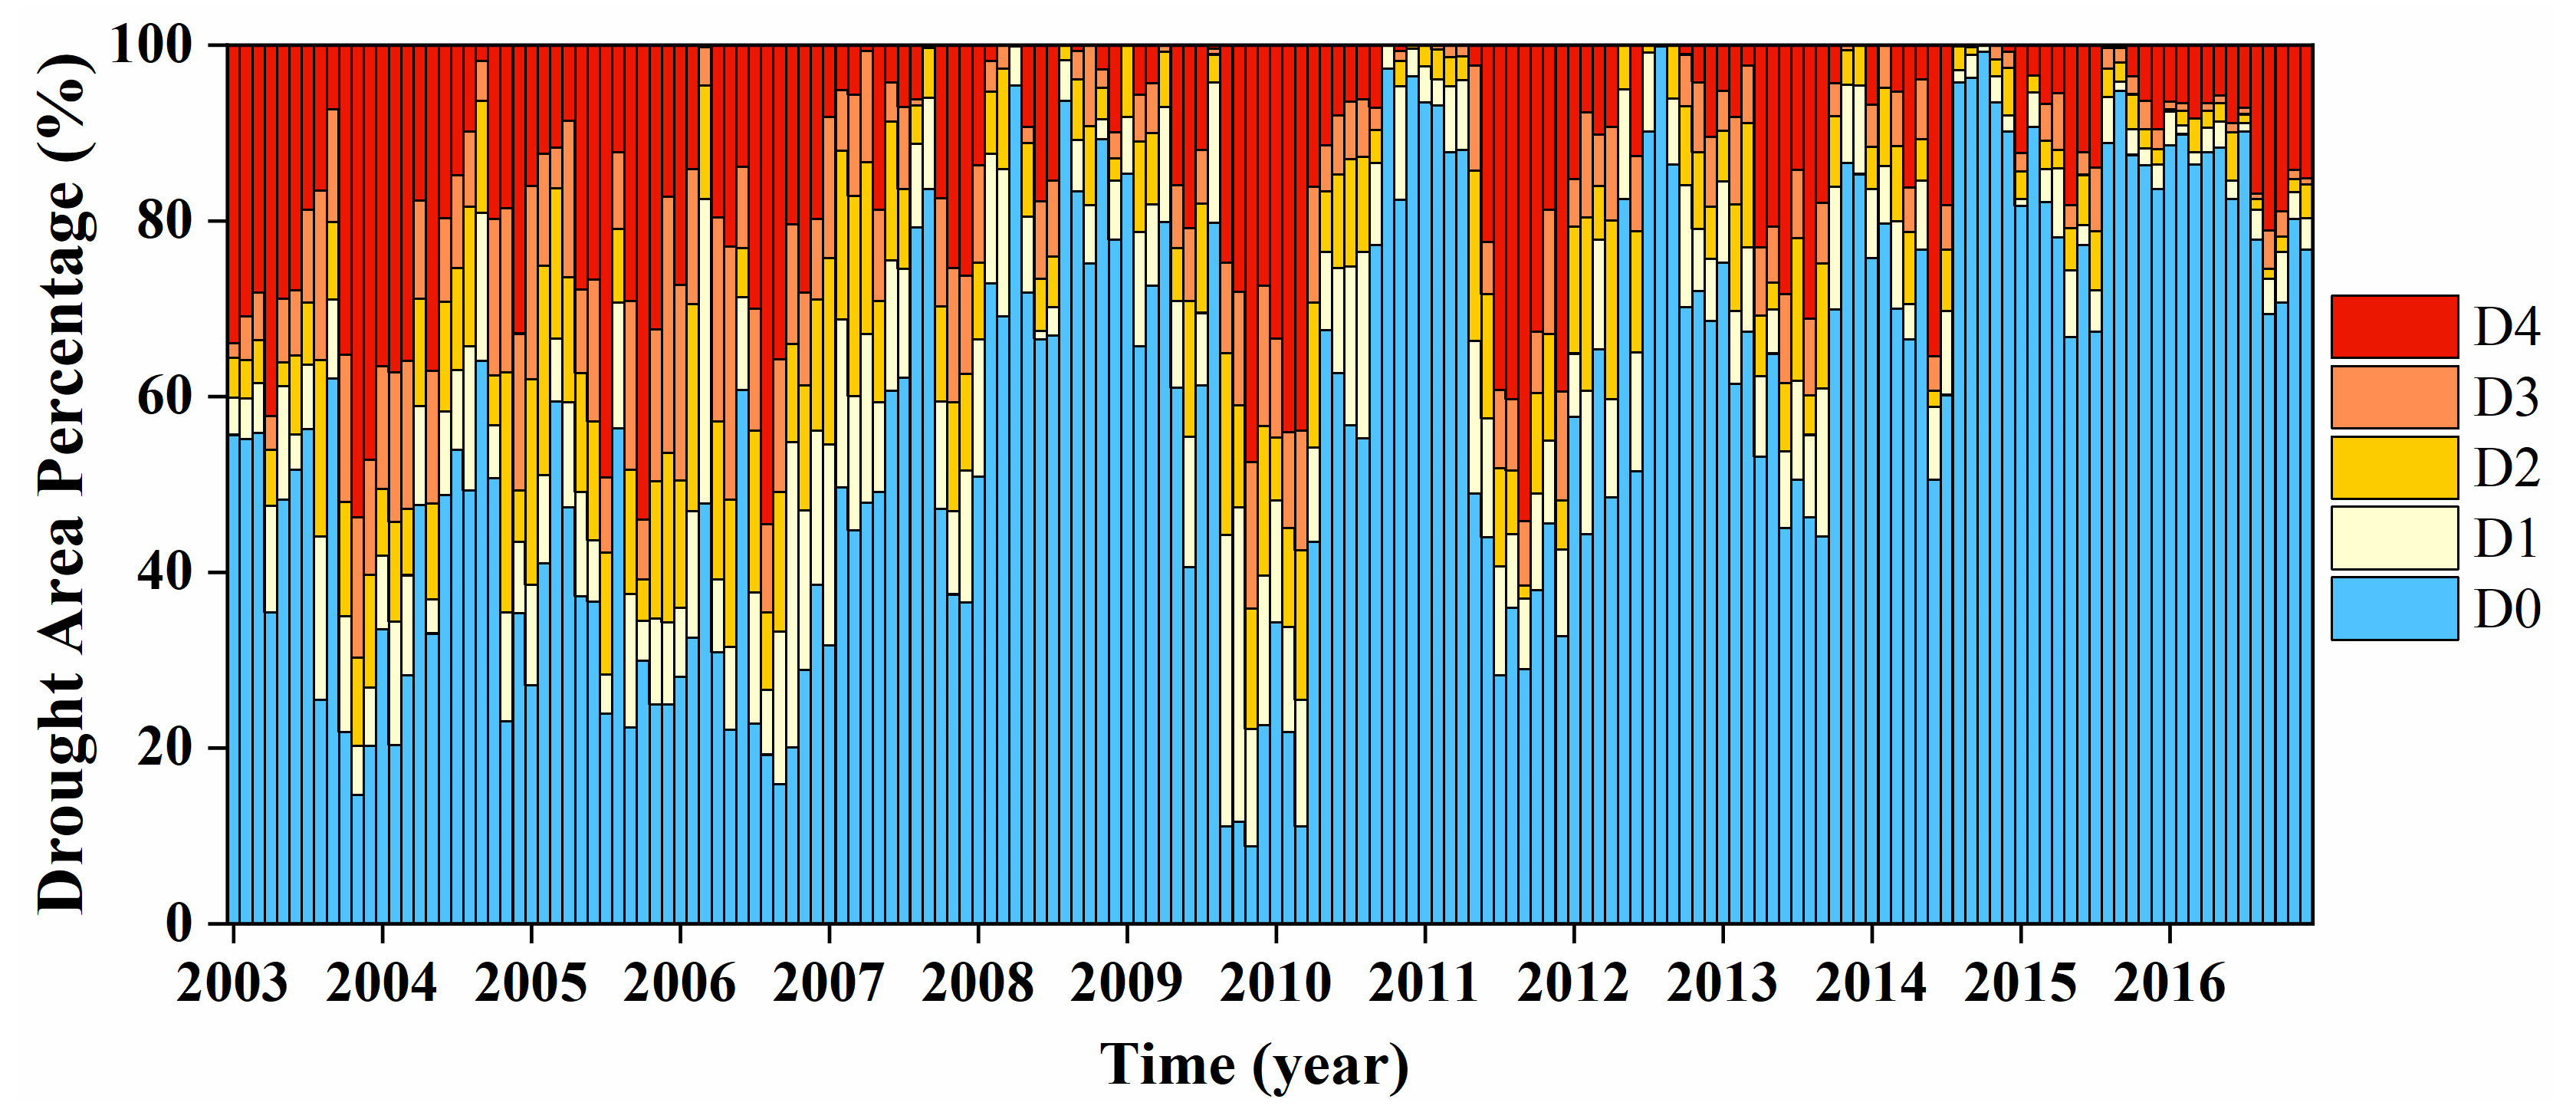
- GRACE-based TSDI identified 7 drought events in Southwest China during 2003–2016, and the frequency of drought from 2003 to 2011 was significantly higher than that from 2012 to 2016. Moreover, TSDI was consistent with other Standardized drought indices (SPI, SPEI, and SC-PDSI) in drought monitoring over Southwest China, which confirmed the reliability of GRACE-based TSDI.
- (2)
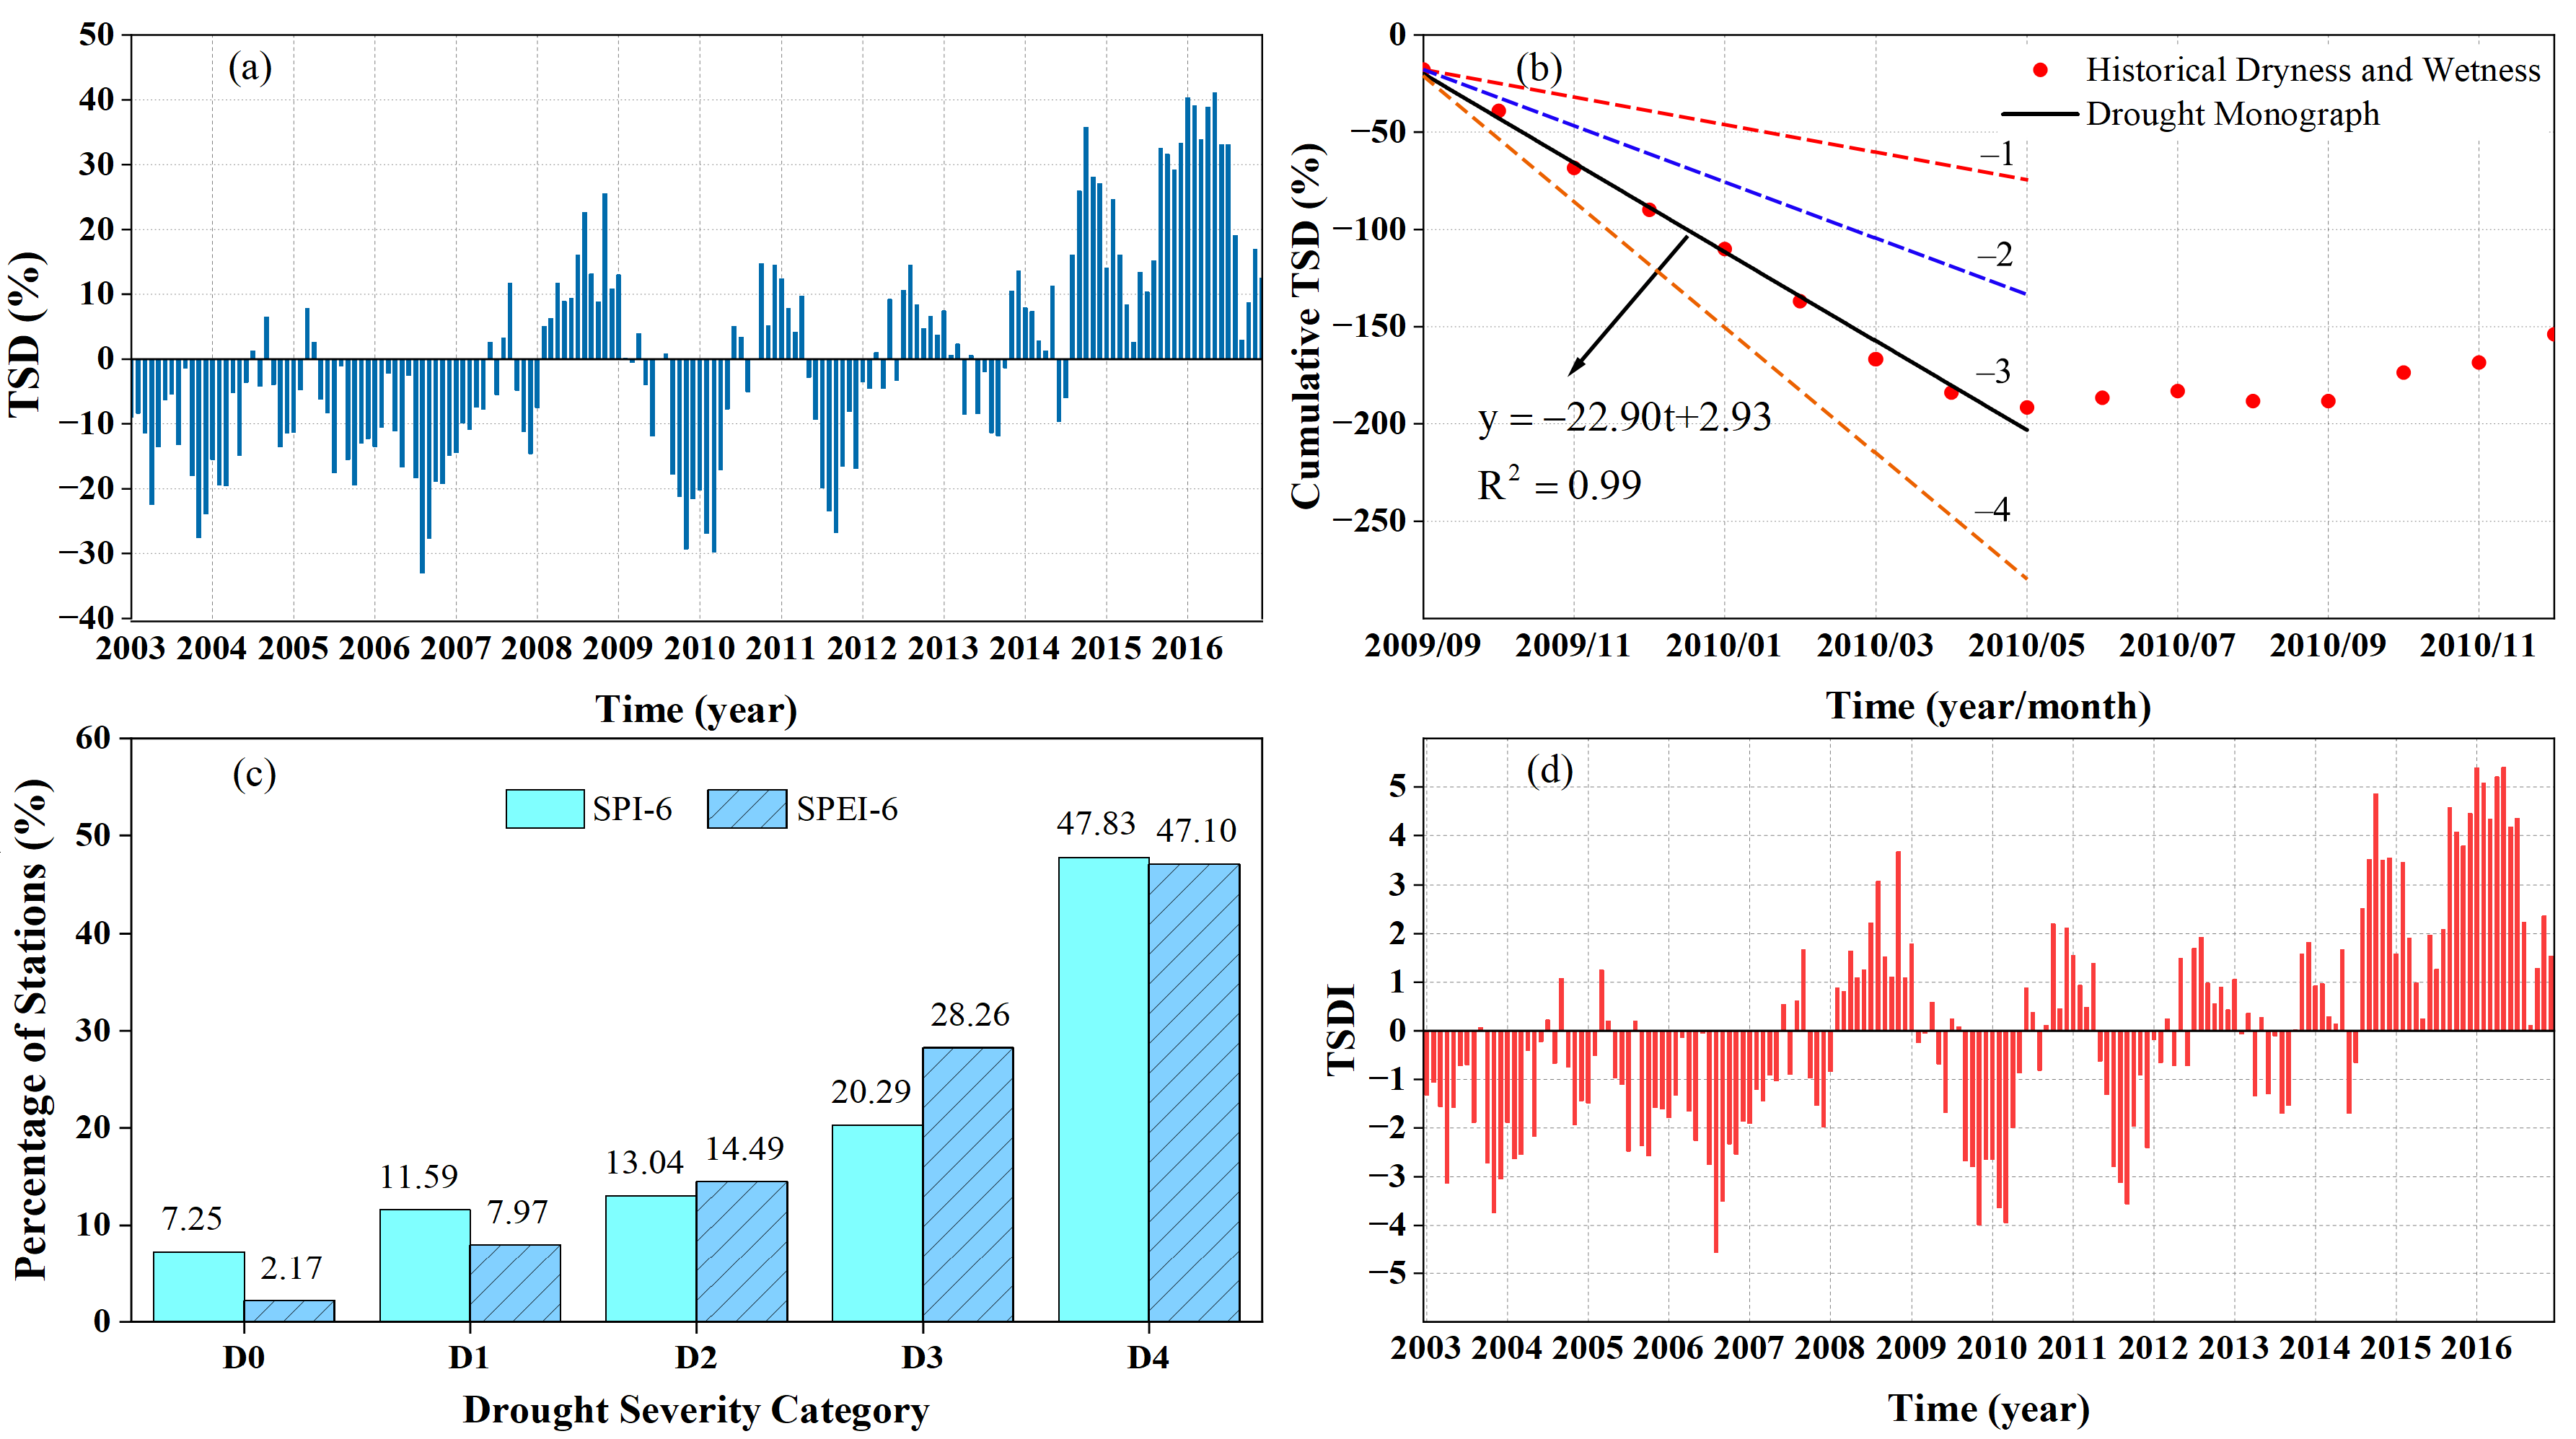
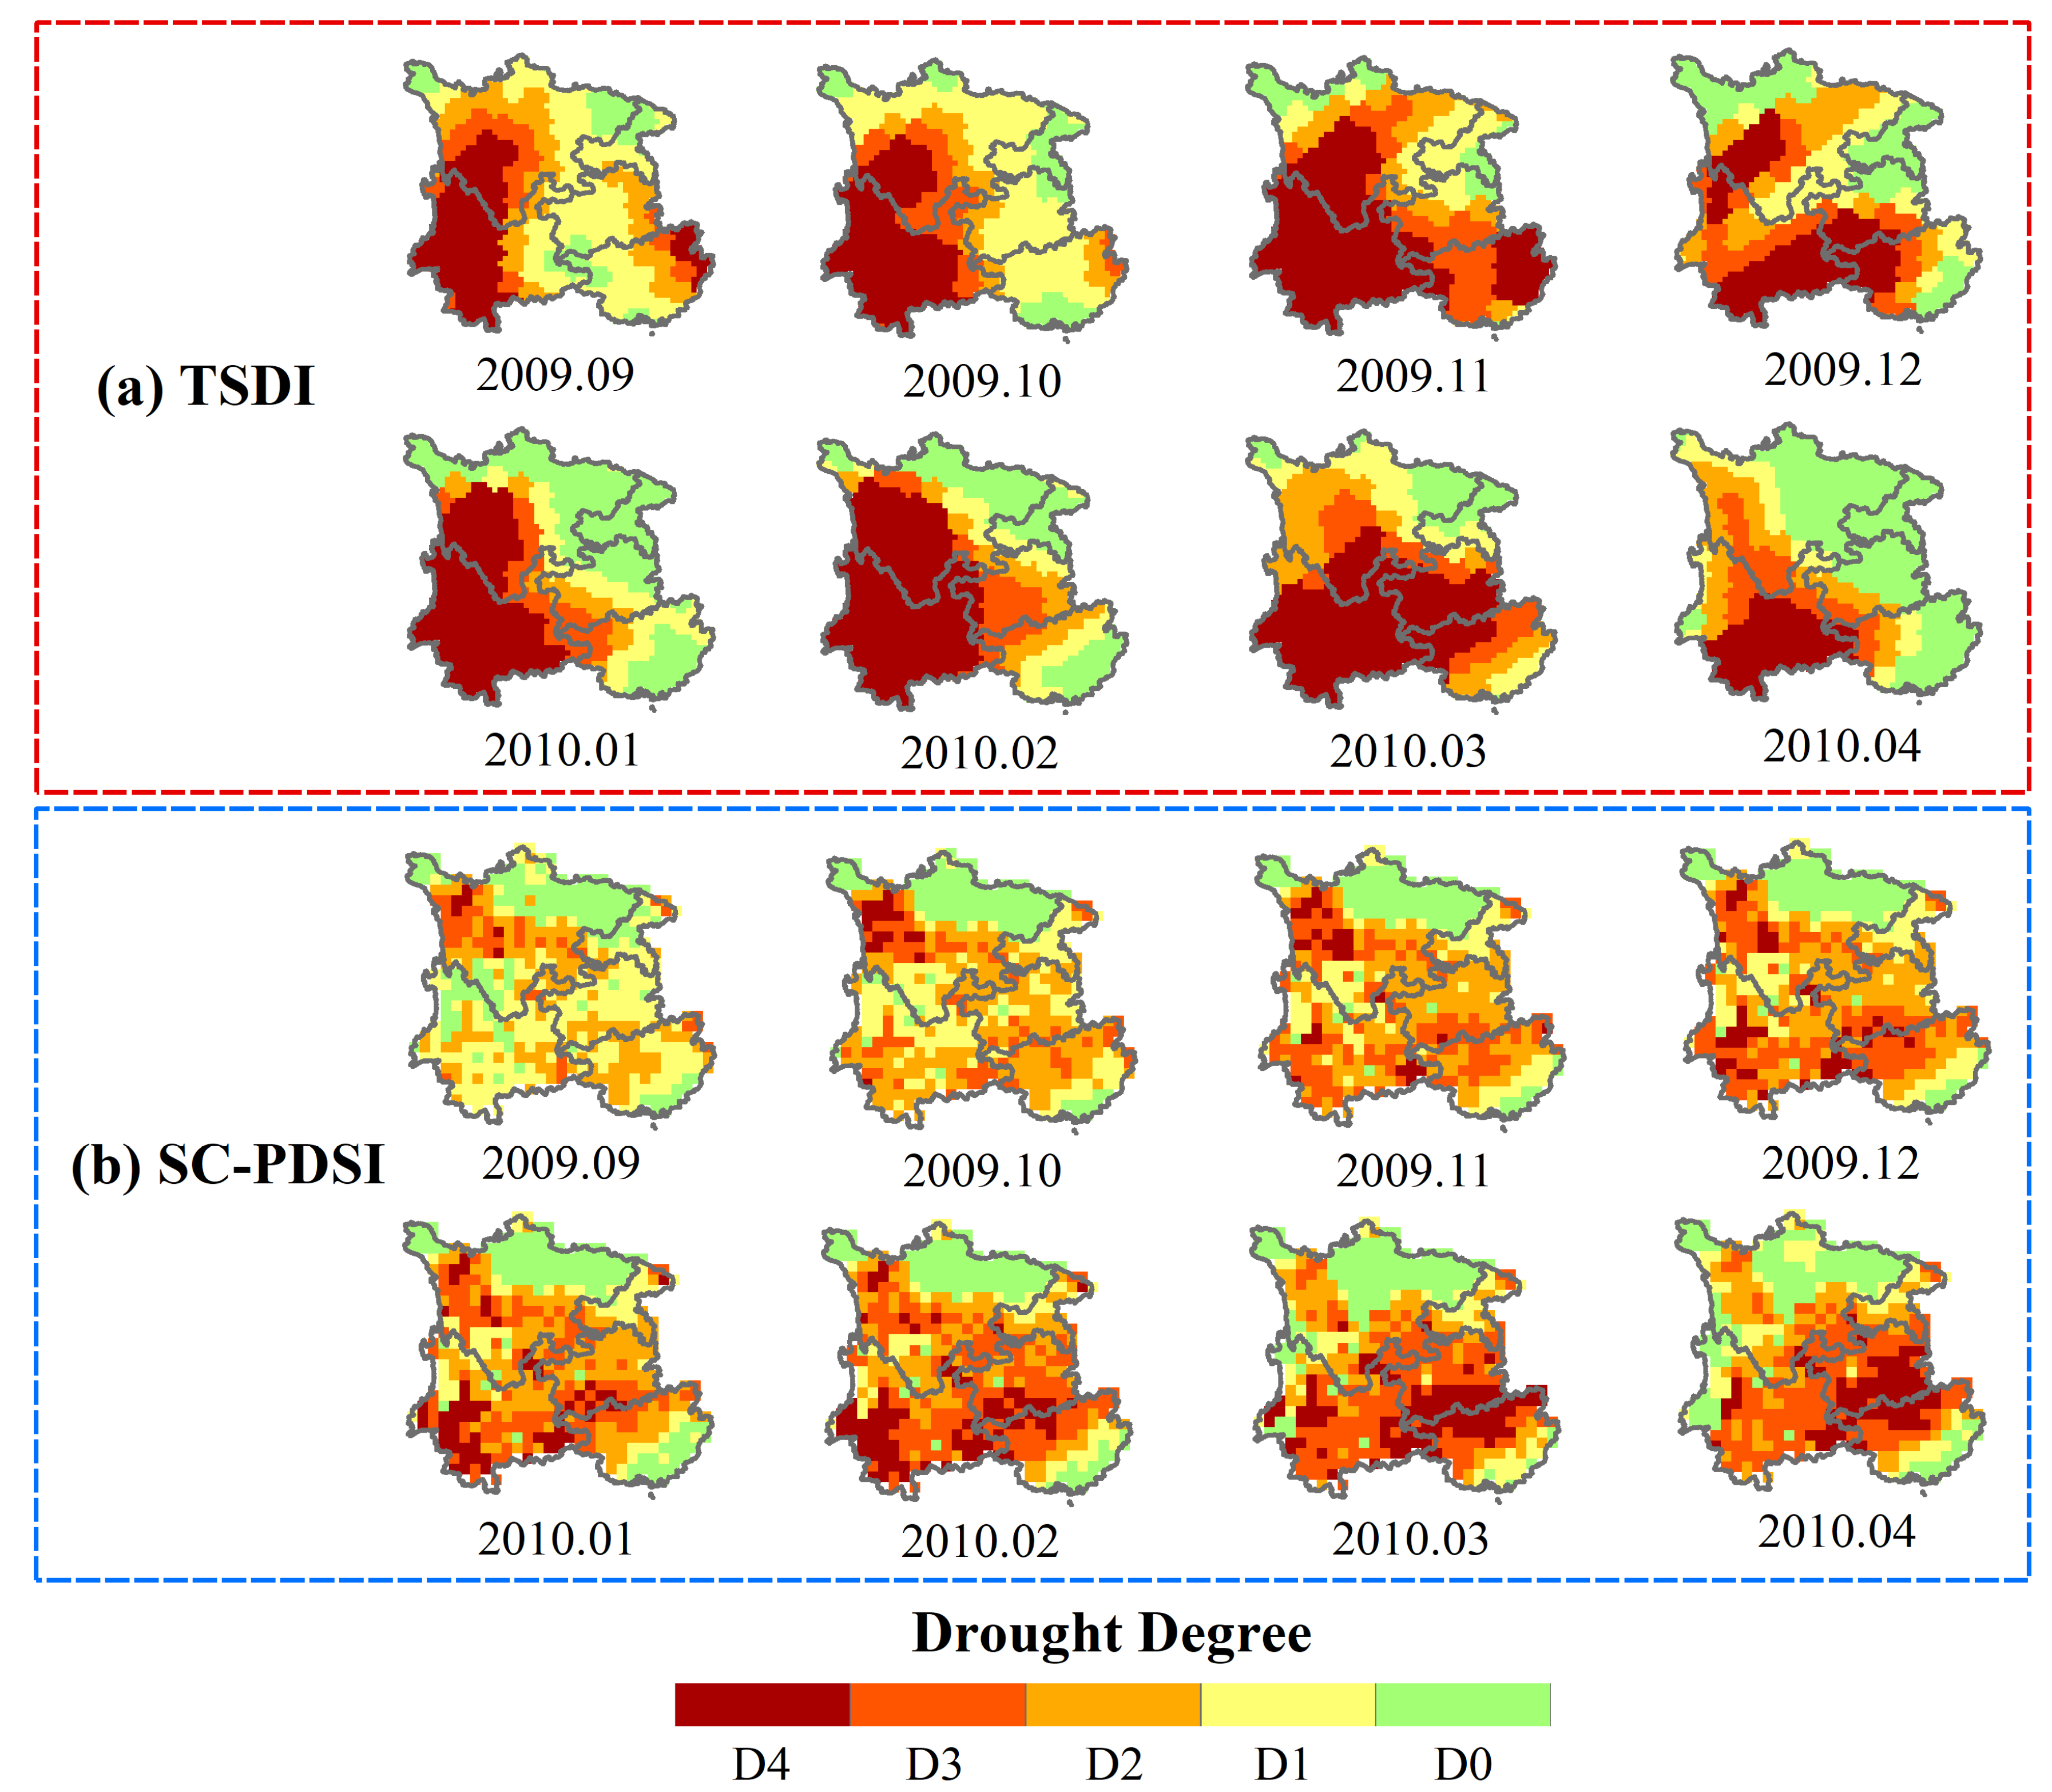
- TSDI can effectively monitor the spatial distribution of drought. In the most severe drought event during 2009.09–2010.04, the spatial distribution of drought extended from Yunnan to other regions. Yunnan has suffered from severe and extreme drought, while Chongqing suffered slight damage from drought. In November 2009, the average values of TSDI in Yunnan and Chongqing were –5.98 and –1.22, respectively. The spatial distribution of TSDI was more consistent with the government report than SC-PDSI.
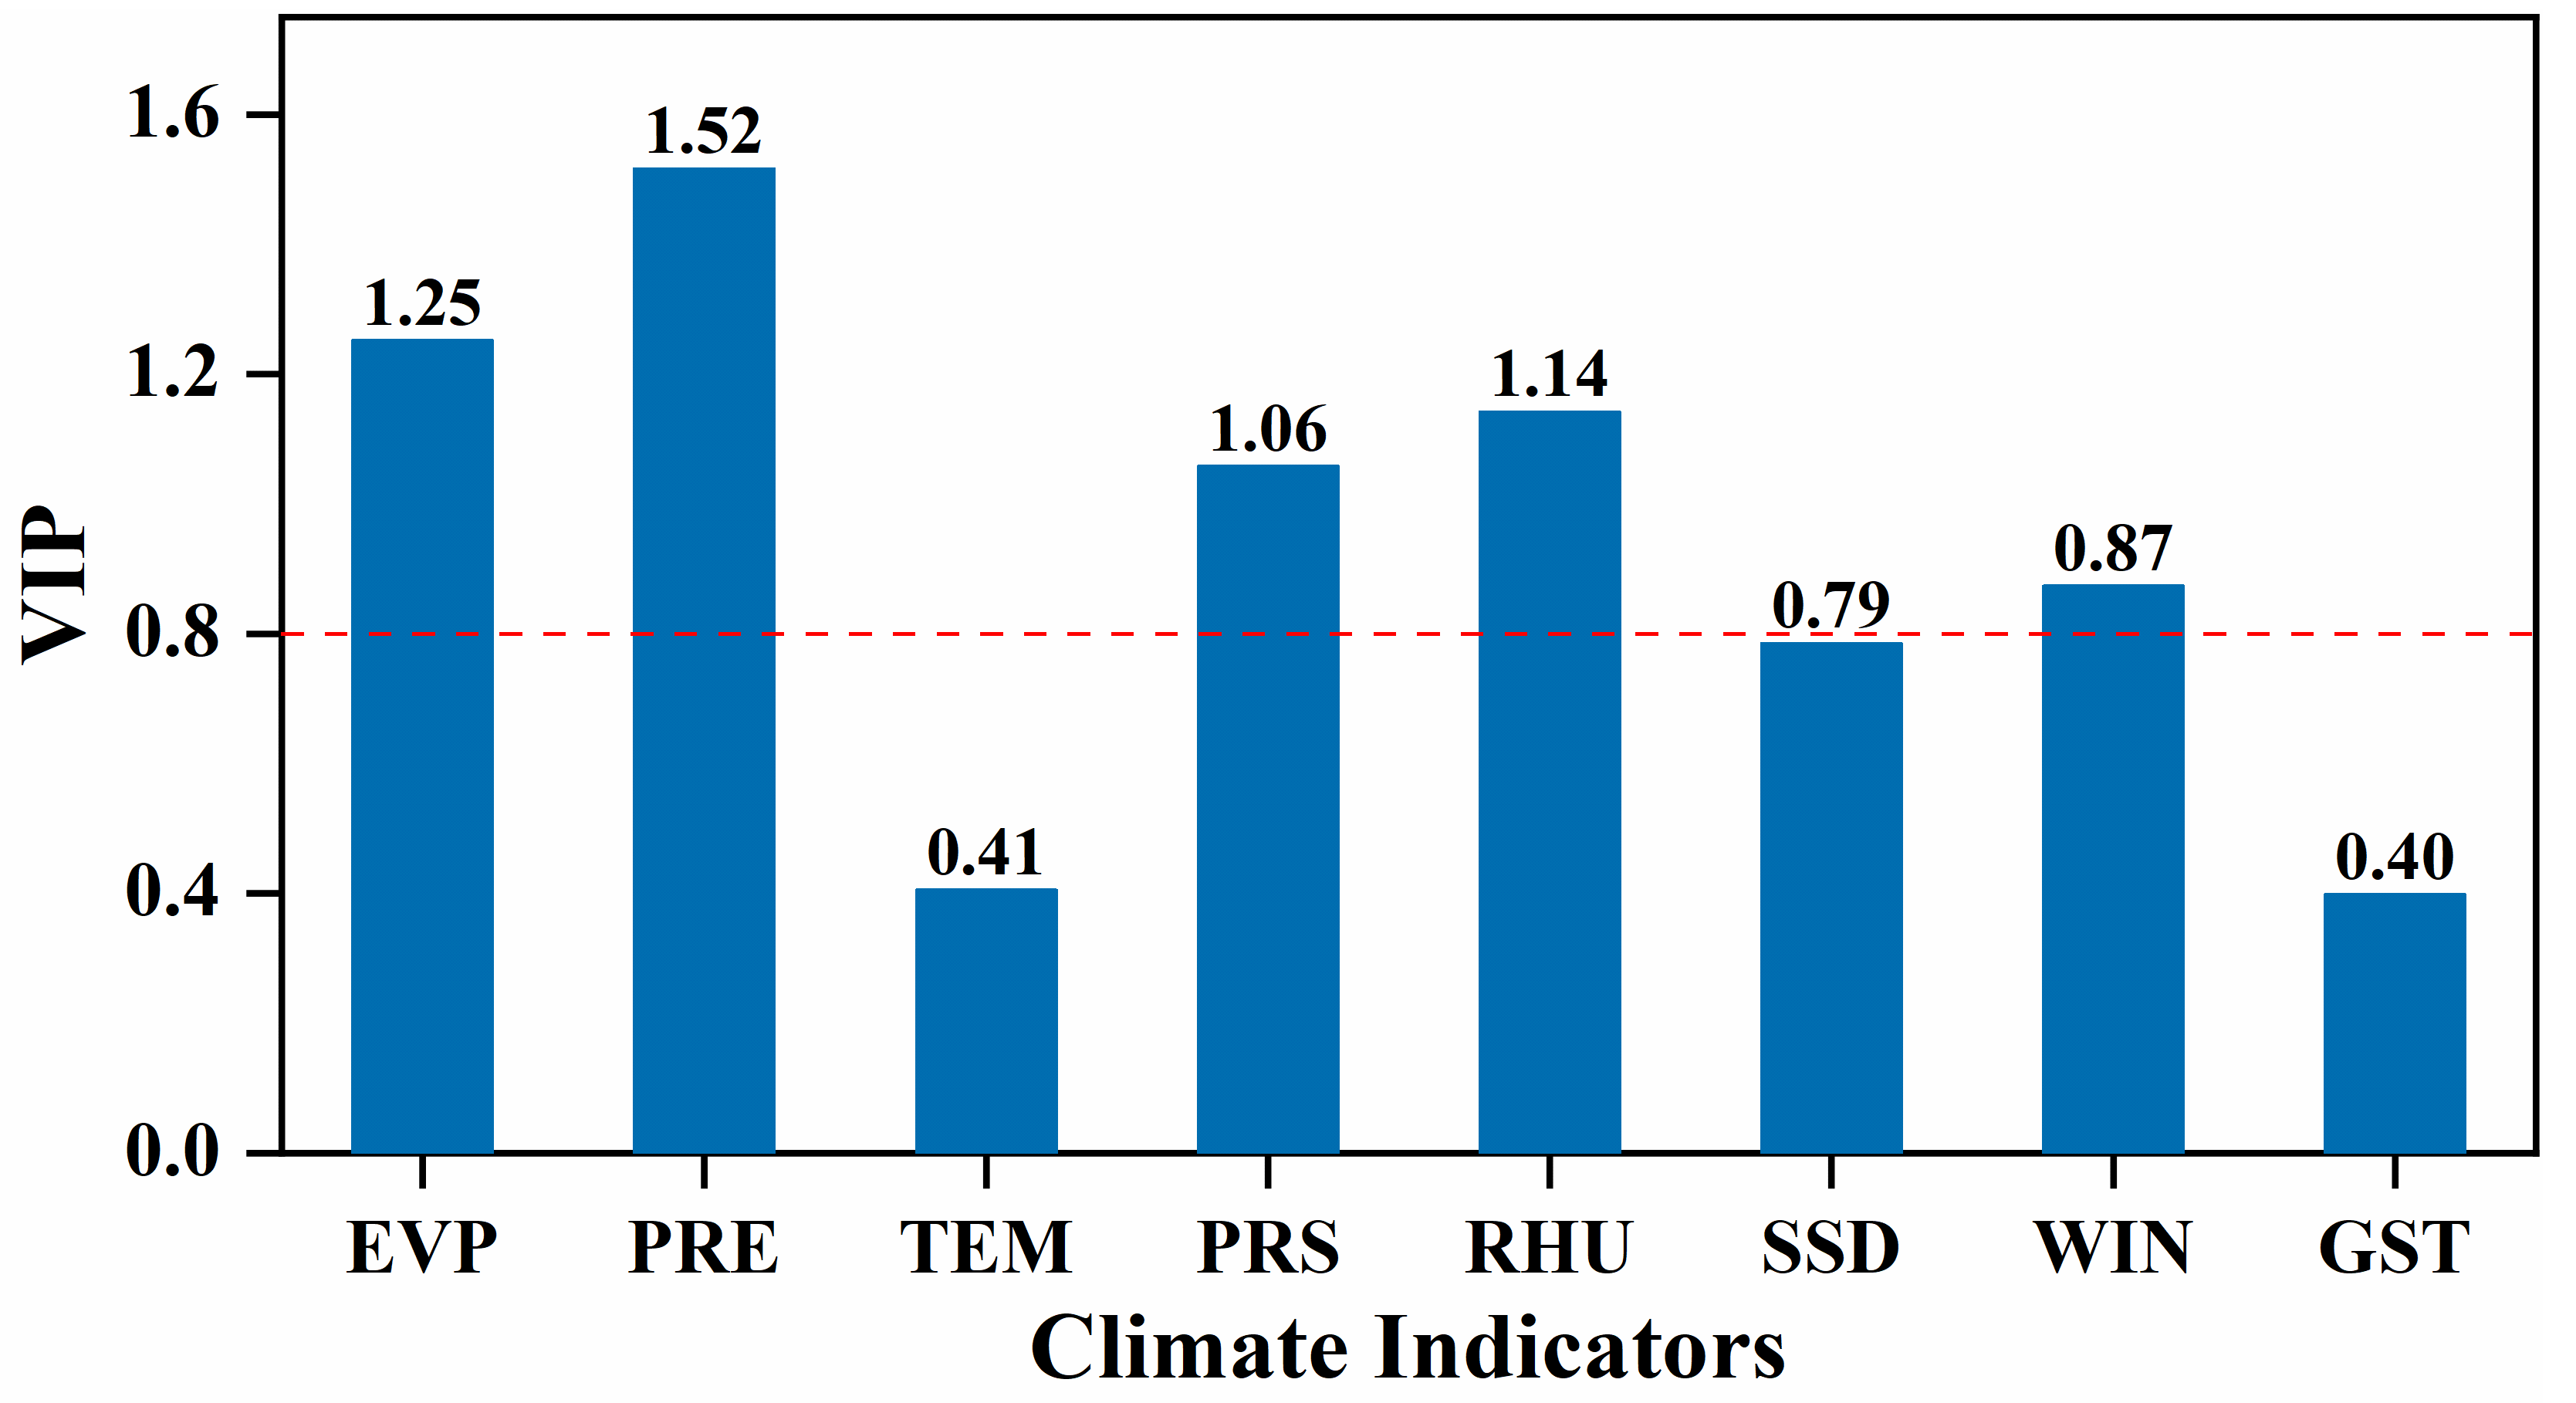
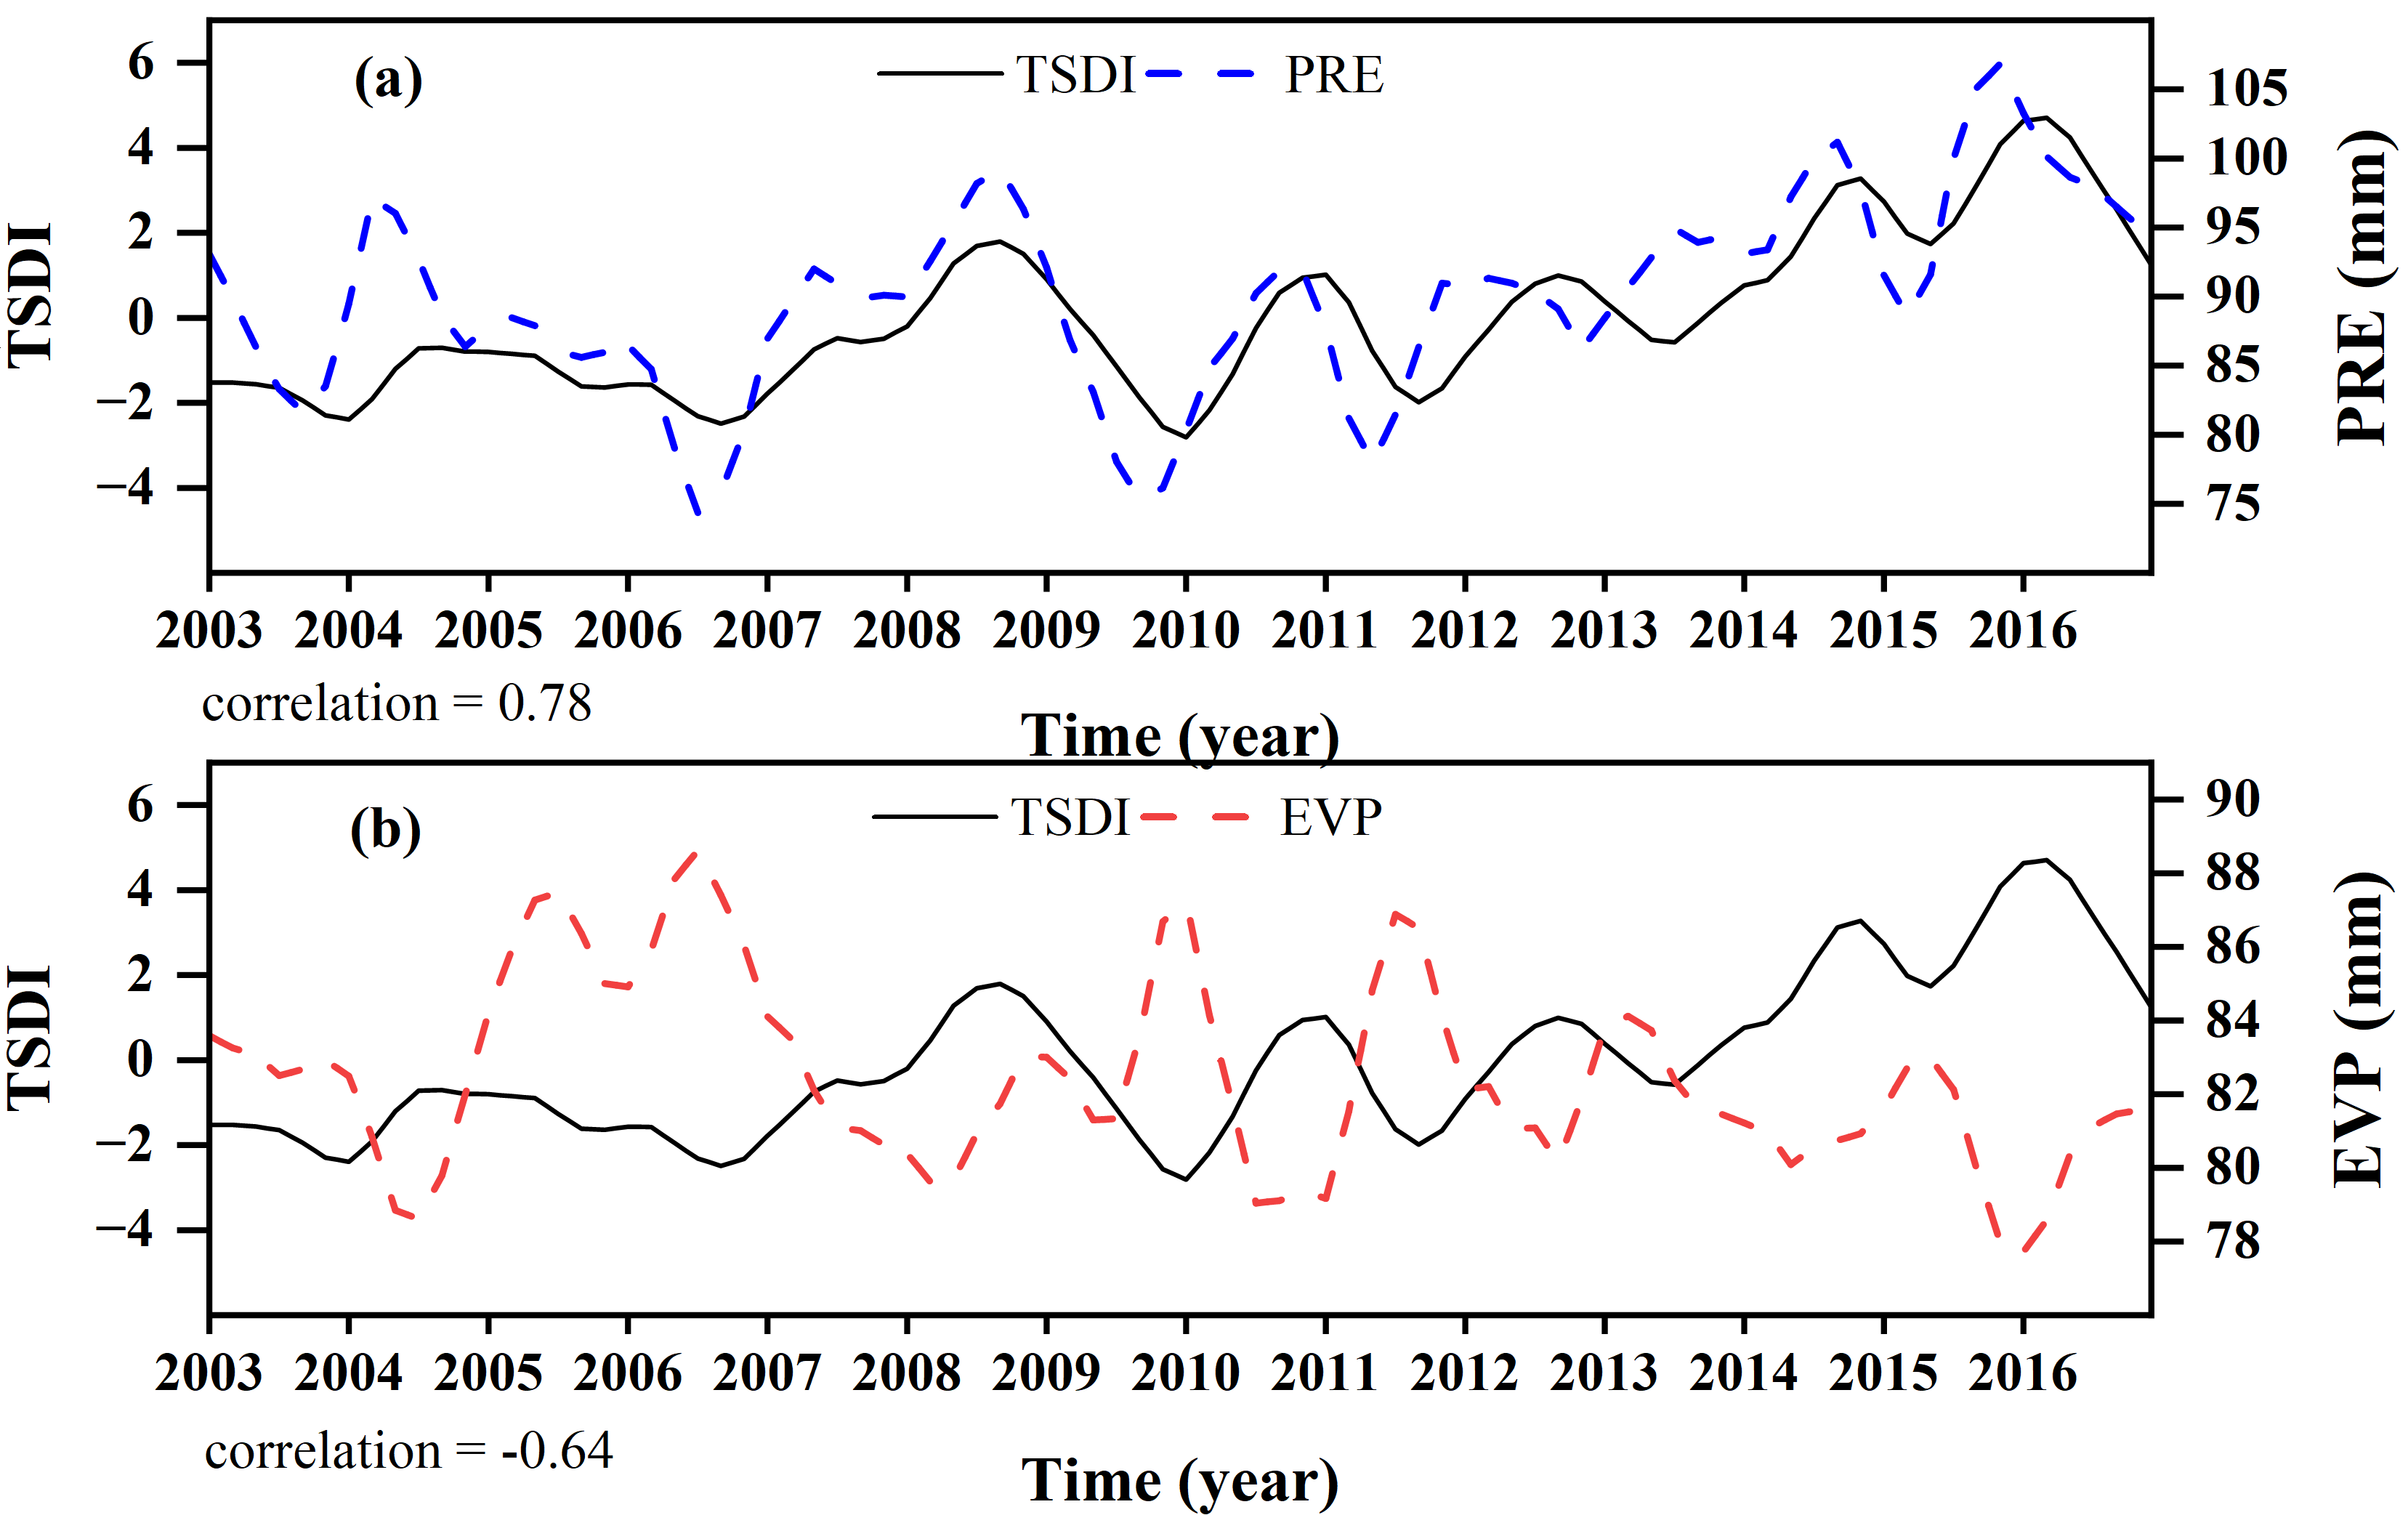
- (3)
- The PLSR model can reveal the links between drought and climate indicators. The VIP results based on the PLSR model indicate that insufficient precipitation has the most significant impact on drought in Southwest China, followed by excessive evaporation. There is a significant positive correlation between precipitation and TSDI (correlation coefficient = 0.78), while a significant negative correlation between evaporation and TSDI (correlation coefficient = –0.64), which further indicates that the decrease of precipitation and excessive evaporation are the causes of drought. In addition, the change trend comparison of precipitation and evaporation with TSDI also verified the results of the PLSR model.
Supplementary Materials
Author Contributions
Funding
Institutional Review Board Statement
Informed Consent Statement
Data Availability Statement
Acknowledgments
Conflicts of Interest
Abbreviations
| Acronym | Full Name |
| GRACE | Gravity Recovery and Climate Experiment |
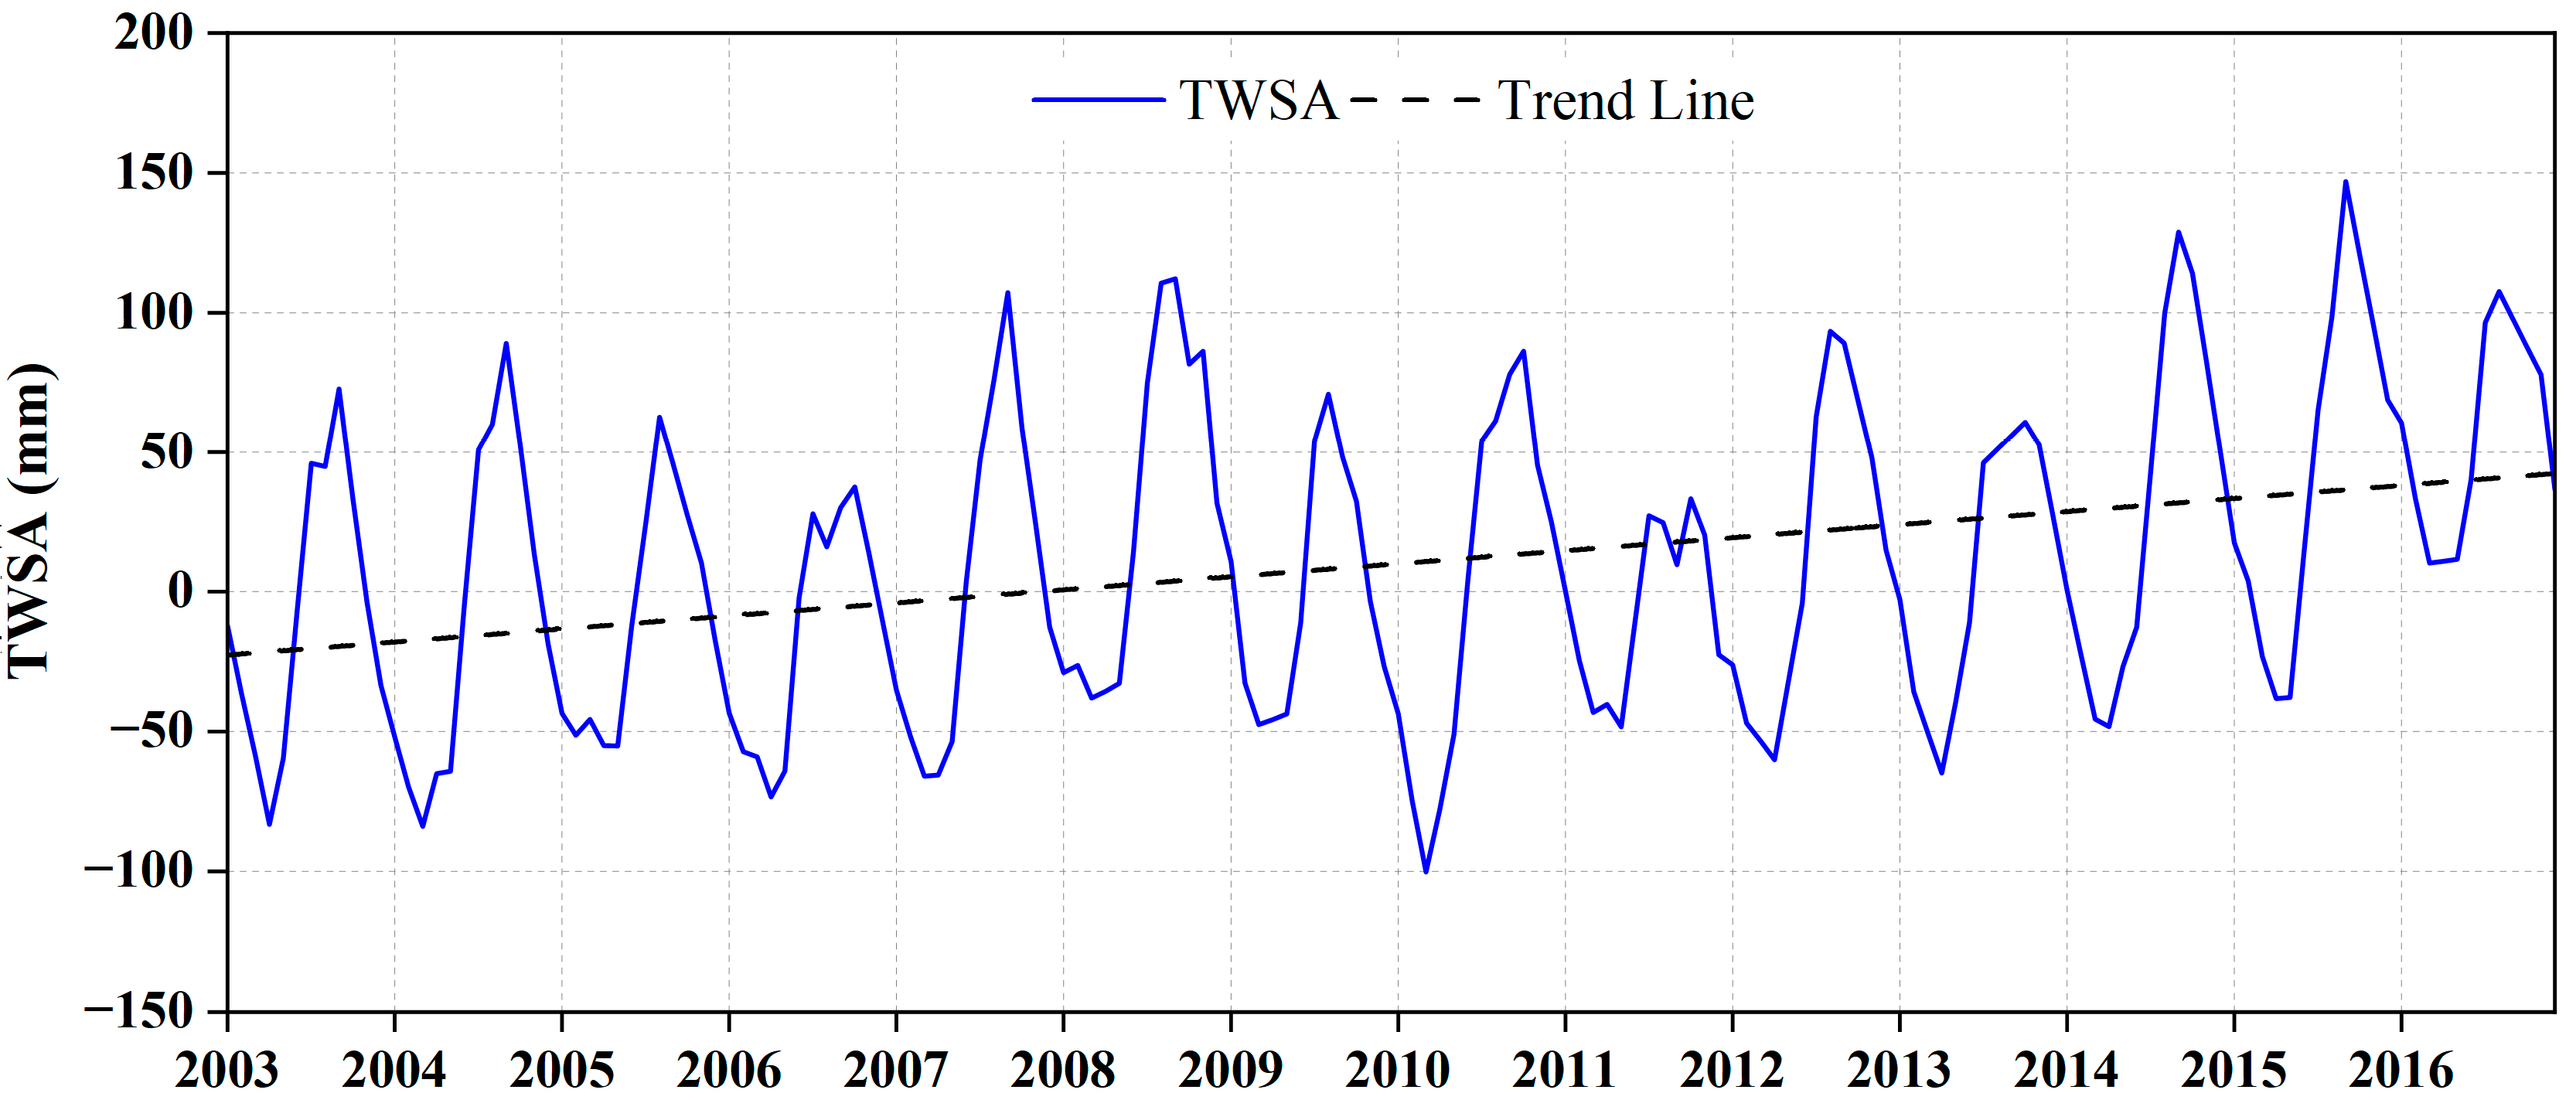
| TWSA | Terrestrial Water Storage Anomalies |
| NASA | National Aeronautics and Space Administration |
| TSDI | Total Storage Deficit Index |
| PLSR | Partial Least Square Regression |
| UTCSR | The University of Texas at Austin, Center for Space Research |
| EVP | Evaporation |
| PRE | Precipitation |
| TEM | Air Temperature |
| PRS | Air Pressure |
| RHU | Relative Humidity |
| SSD | Sunshine Duration |
| WIN | Wind Speed |
| GST | Ground Temperature |
| SPEI | Standardized Precipitation Evapotranspiration Index |
| SPI | Standardized Precipitation Index |
| CRU | Climatic Research Unit |
| VIP | Variable Importance of the Projection |
| SC-PDSI | Self-Calibrating Palmer Drought Severity Index |
| STL | Seasonal-Trend Decomposition by Loess |
| TSA | Total Storage Anomaly |
| TSD | Total Storage Deficit |
| RMS | Root Mean Square |
References
- Heim, R.R. A review of twentieth-century drought indices used in the United States. Bull. Am. Meteorol. Soc. 2002, 83, 1149–1165. [Google Scholar] [CrossRef]
- Schwalm, C.R.; Anderegg, W.R.L.; Michalak, A.M.; Fisher, J.B.; Biondi, F.; Koch, G.; Litvak, M.; Ogle, K.; Shaw, J.D.; Wolf, A.; et al. Global patterns of drought recovery. Nature 2017, 548, 202–205. [Google Scholar] [CrossRef] [PubMed]
- Masson-Delmotte, V.; Zhai, P.; Pörtner, H.-O.; Roberts, D.; Skea, J.; Shukla, P.; Pirani, A.; Moufouma-Okia, W.; Péan, C.; Pidcock, R. Global Warming of 1.5 OC: An IPCC Special Report on the Impacts of Global Warming of 1.5 °C Above Pre-Industrial Levels and Related Global Greenhouse Gas Emission Pathways, in the Context of Strengthening the Global Response to the Threat of Climate Change, Sustainable Development, and Efforts to Eradicate Poverty; World Meteorological Organization: Geneva, Switzerland, 2018. [Google Scholar]
- Cook, B.I.; Ault, T.R.; Smerdon, J.E. Unprecedented 21st century drought risk in the American Southwest and Central Plains. Sci. Adv. 2015, 1, e1400082. [Google Scholar] [CrossRef] [PubMed]
- Trenberth, K.E.; Dai, A.; van der Schrier, G.; Jones, P.D.; Barichivich, J.; Briffa, K.R.; Sheffield, J. Global warming and changes in drought. Nat. Clim. Chang. 2014, 4, 17–22. [Google Scholar] [CrossRef]
- Wang, F.; Wang, Z.; Yang, H.; Di, D.; Zhao, Y.; Liang, Q. Utilizing GRACE-based groundwater drought index for drought characterization and teleconnection factors analysis in the North China Plain. J. Hydrol. 2020, 124849. [Google Scholar] [CrossRef]
- Alizadeh, M.R.; Nikoo, M.R. A fusion-based methodology for meteorological drought estimation using remote sensing data. Remote Sens. Environ. 2018, 211, 229–247. [Google Scholar] [CrossRef]
- Long, D.; Shen, Y.; Sun, A.; Hong, Y.; Longuevergne, L.; Yang, Y.; Li, B.; Chen, L. Drought and flood monitoring for a large karst plateau in Southwest China using extended GRACE data. Remote Sens. Environ. 2014, 155, 145–160. [Google Scholar] [CrossRef]
- Scanlon, B.R.; Longuevergne, L.; Long, D. Ground referencing GRACE satellite estimates of groundwater storage changes in the California Central Valley, USA. Water Resour. Res. 2012, 48, W04520. [Google Scholar] [CrossRef]
- Tapley, B.D.; Bettadpur, S.; Ries, J.C.; Thompson, P.F.; Watkins, M.M. GRACE measurements of mass variability in the Earth system. Science 2004, 305, 503–505. [Google Scholar] [CrossRef]
- Rodell, M.; Famiglietti, J.S. An analysis of terrestrial water storage variations in Illinois with implications for the Gravity Recovery and Climate Experiment (GRACE). Water Resour. Res. 2001, 37, 1327–1339. [Google Scholar] [CrossRef]
- Rodell, M.; Velicogna, I.; Famiglietti, J.S. Satellite-based estimates of groundwater depletion in India. Nature 2009, 460, 999–1002. [Google Scholar] [CrossRef] [PubMed]
- Yirdaw, S.Z.; Snelgrove, K.R.; Agboma, C.O. GRACE satellite observations of terrestrial moisture changes for drought characterization in the Canadian Prairie. J. Hydrol. 2008, 356, 84–92. [Google Scholar] [CrossRef]
- Yi, H.; Wen, L. Satellite gravity measurement monitoring terrestrial water storage change and drought in the continental United States. Sci. Rep. 2016, 6, 19909. [Google Scholar] [CrossRef] [PubMed]
- Thomas, B.F.; Famiglietti, J.S.; Landerer, F.W.; Wiese, D.N.; Molotch, N.P.; Argus, D.F. GRACE Groundwater Drought Index: Evaluation of California Central Valley groundwater drought. Remote Sens. Environ. 2017, 198, 384–392. [Google Scholar] [CrossRef]
- Yu, W.; Li, Y.; Cao, Y.; Schillerberg, T. Drought assessment using GRACE terrestrial water storage deficit in Mongolia from 2002 to 2017. Water 2019, 11, 1301. [Google Scholar] [CrossRef]
- Wang, L.; Chen, W.; Zhou, W.; Huang, G. Understanding and detecting super-extreme droughts in Southwest China through an integrated approach and index. Q. J. R. Meteorol. Soc. 2016, 142, 529–535. [Google Scholar] [CrossRef]
- Ministry of Water Resources (MWR). Drought Disasters. Bulletin of Flood and Drought Disasters in China 2006; China Water Power Press: Beijing, China, 2006; pp. 1–40.
- Ministry of Water Resources (MWR). Drought Disasters. Bulletin of Flood and Drought Disasters in China 2010; China Water Power Press: Beijing, China, 2010; pp. 1–43.
- Huang, Y.; Xu, C.; Yang, H.; Wang, J.; Jiang, D.; Zhao, C. Temporal and spatial variability of droughts in Southwest China from 1961 to 2012. Sustainability 2015, 7, 13597–13609. [Google Scholar] [CrossRef]
- Qin, N.; Chen, X.; Fu, G.; Zhai, J.; Xue, X. Precipitation and temperature trends for the Southwest China: 1960–2007. Hydrol. Process. 2010, 24, 3733–3744. [Google Scholar] [CrossRef]
- Zhao, C.; Huang, Y.; Li, Z.; Chen, M. Drought monitoring of Southwestern China using insufficient GRACE data for the long-term mean reference frame under global change. J. Clim. 2018, 31, 6897–6911. [Google Scholar] [CrossRef]
- Tapley, B.D.; Watkins, M.M.; Flechtner, F.; Reigber, C.; Bettadpur, S.; Rodell, M.; Sasgen, I.; Famiglietti, J.S.; Landerer, F.W.; Chambers, D.P.; et al. Contributions of GRACE to understanding climate change. Nat. Clim. Chang. 2019, 5, 358–369. [Google Scholar] [CrossRef]
- Save, H.; Bettadpur, S.; Tapley, B.D. High-resolution CSR GRACE RL05 mascons. J. Geophys. Res. Solid Earth 2016, 121, 7547–7569. [Google Scholar] [CrossRef]
- Scanlon, B.R.; Zhang, Z.; Save, H.; Wiese, D.N.; Landerer, F.W.; Long, D.; Longuevergne, L.; Chen, J. Global evaluation of new GRACE mascon products for hydrologic applications. Water Resour. Res. 2016, 52, 9412–9429. [Google Scholar] [CrossRef]
- Narasimhan, B.; Srinivasan, R. Development and evaluation of Soil Moisture Deficit Index (SMDI) and Evapotranspiration Deficit Index (ETDI) for agricultural drought monitoring. Agr. For. Meteorol. 2005, 133, 69–88. [Google Scholar] [CrossRef]
- Agboma, C.O.; Yirdaw, S.Z.; Snelgrove, K.R. Intercomparison of the total storage deficit index (TSDI) over two Canadian Prairie catchments. J. Hydrol. 2009, 374, 351–359. [Google Scholar] [CrossRef]
- McKee, T.B.; Doesken, N.J.; Kleist, J. The relationship of drought frequency and duration to time scales. In Proceedings of the 8th Conference on Applied Climatology, Zurich, Switzerland, 13–17 September 2010; Preventionweb: Geneva, Switzerland, 2010; pp. 179–183. [Google Scholar]
- Vicente-Serrano, S.M. Differences in spatial patterns of drought on different time scales: An analysis of the Iberian Peninsula. Water Resour. Manag. 2006, 20, 37–60. [Google Scholar] [CrossRef]
- Vicente-Serrano, S.M.; Beguería, S.; López-Moreno, J.I. A multiscalar drought index sensitive to global warming: The Standardized Precipitation Evapotranspiration Index. J. Clim. 2010, 23, 1696–1718. [Google Scholar] [CrossRef]
- Palmer, W.C. Meteorological Drought; US Department of Commerce, Weather Bureau: Washington, DC, USA, 1965.
- Yang, P.; Xia, J.; Zhang, Y.; Zhan, C.; Qiao, Y. Comprehensive assessment of drought risk in the arid region of Northwest China based on the global palmer drought severity index gridded data. Sci. Total Environ. 2018, 627, 951–962. [Google Scholar] [CrossRef]
- Wells, N.; Goddard, S.; Hayes, M.J. A self-calibrating Palmer Drought Severity Index. J. Clim. 2004, 17, 2335–2351. [Google Scholar] [CrossRef]
- Sun, Z.; Zhu, X.; Pan, Y.; Zhang, J.; Liu, X. Drought evaluation using the GRACE terrestrial water storage deficit over the Yangtze River Basin, China. Sci. Total Environ. 2018, 634, 727–738. [Google Scholar] [CrossRef]
- Cleveland, R.B.; Cleveland, W.S.; McRae, J.E.; Terpenning, I. STL: A seasonal-trend decomposition. J. Off. Stat. 1990, 6, 3–73. [Google Scholar]
- Bergmann, I.; Ramillien, G.; Frappart, F. Climate-driven interannual ice mass evolution in Greenland. Glob. Planet Chang. 2012, 82–83, 1–11. [Google Scholar] [CrossRef]
- Yin, W.; Hu, L.; Zhang, M.; Wang, J.; Han, S.-C. Statistical downscaling of GRACE-derived groundwater storage using ET data in the North China Plain. J. Geophys. Res. Atmos. 2018, 123, 5973–5987. [Google Scholar] [CrossRef]
- Humphrey, V.; Gudmundsson, L.; Seneviratne, S.I. A global reconstruction of climate-driven subdecadal water storage variability. Geophys. Res. Lett. 2017, 44, 2300–2309. [Google Scholar] [CrossRef]
- Li, F.; Kusche, J.; Rietbroek, R.; Wang, Z.; Forootan, E.; Schulze, K.; Lück, C. Comparison of data-driven techniques to reconstruct (1992–2002) and predict (2017–2018) GRACE-like gridded total water storage changes using climate inputs. Water Resour. Res. 2020, 56. [Google Scholar] [CrossRef]
- Woldesenbet, T.A.; Elagib, N.A.; Ribbe, L.; Heinrich, J. Hydrological responses to land use/cover changes in the source region of the Upper Blue Nile Basin, Ethiopia. Sci. Total Environ. 2017, 575, 724–741. [Google Scholar] [CrossRef] [PubMed]
- Abdi, H. Partial least squares regression and projection on latent structure regression (PLS Regression). WIREs Comput. Stat. 2010, 2, 97–106. [Google Scholar] [CrossRef]
- Yuan, R.-Q.; Chang, L.-L.; Gupta, H.; Niu, G.-Y. Climatic forcing for recent significant terrestrial drying and wetting. Adv. Water Resour. 2019, 133, 103425. [Google Scholar] [CrossRef]
- Farrés, M.; Platikanov, S.; Tsakovski, S.; Tauler, R. Comparison of the variable importance in projection (VIP) and of the selectivity ratio (SR) methods for variable selection and interpretation. J. Chemom. 2015, 29, 528–536. [Google Scholar] [CrossRef]
- Thomas, A.C.; Reager, J.T.; Famiglietti, J.S.; Rodell, M. A GRACE-based water storage deficit approach for hydrological drought characterization. Geophys. Res. Lett. 2014, 41, 1537–1545. [Google Scholar] [CrossRef]
- Yu, M.; Li, Q.; Hayes, M.J.; Svoboda, M.D.; Heim, R.R. Are droughts becoming more frequent or severe in China based on the Standardized Precipitation Evapotranspiration Index: 1951–2010? Int. J. Climatol. 2014, 34, 545–558. [Google Scholar] [CrossRef]
- Zhang, L.; Zhou, T. Drought over East Asia: A Review. J. Clim. 2015, 28, 3375–3399. [Google Scholar] [CrossRef]
- Zhang, S.; Wu, Y.; Sivakumar, B.; Mu, X.; Zhao, F.; Sun, P.; Sun, Y.; Qiu, L.; Chen, J.; Meng, X.; et al. Climate change-induced drought evolution over the past 50 years in the southern Chinese Loess Plateau. Environ. Model. Softw. 2019, 122, 104519. [Google Scholar] [CrossRef]
- Buma, W.G.; Lee, S.-I. Multispectral image-based estimation of drought patterns and intensity around lake Chad, Africa. Remote Sens. 2019, 11, 2534. [Google Scholar] [CrossRef]
- Jiao, D.; Wang, D.; Lv, H. Effects of human activities on hydrological drought patterns in the Yangtze River Basin, China. Nat. Hazards 2020, 104, 1111–1124. [Google Scholar] [CrossRef]
- Sun, Z.; Long, D.; Yang, W.; Li, X.; Pan, Y. Reconstruction of GRACE data on changes in total water storage over the global land surface and 60 basins. Water Resour. Res. 2020, 56, e2019WR026250. [Google Scholar] [CrossRef]


| Category | Description | TSDI | SPI | SPEI | SC-PDSI |
|---|---|---|---|---|---|
| D0 | No Drought | −1.0 < TSDI | −0.5 < SPI | −0.5 < SPEI | −1.0 < SC-PDSI |
| D1 | Mild Drought | −2.0 < TSDI ≤ −1.0 | −1.0 < SPI ≤ −0.5 | −1.0 < SPEI ≤ −0.5 | −2.0 < SC-PDSI ≤ −1.0 |
| D2 | Moderate Drought | −3.0 < TSDI ≤ −2.0 | −1.5 < SPI ≤ −1.0 | −1.5 < SPEI ≤ −1.0 | −3.0 < SC-PDSI ≤ −2.0 |
| D3 | Severe Drought | −4.0 < TSDI ≤ −3.0 | −2.0 < SPI ≤ −1.5 | −2.0 < SPEI ≤ −1.5 | −4.0 < SC-PDSI ≤ −3.0 |
| D4 | Extreme Drought | TSDI ≤ −4.0 | SPI ≤ −2.0 | SPEI ≤ −2.0 | SC-PDSI ≤ −4.0 |
| ID | Period | Duration/Month | Minimum TSDI | The Slope of Cumulative TSDI | Category |
|---|---|---|---|---|---|
| 1 | 2003.01–2003.05 | 5 | −3.15 | −2.20 | D2 |
| 2 | 2003.10–2004.03 | 6 | −3.75 | −2.68 | D2 |
| 3 | 2004.11–2005.01 | 3 | −1.93 | −1.46 | D1 |
| 4 | 2005.09–2006.02 | 6 | −2.58 | −1.74 | D1 |
| 5 | 2006.07–2007.03 | 9 | −4.56 | −2.32 | D2 |
| 6 | 2009.09–2010.04 | 8 | −4.00 | −3.16 | D3 |
| 7 | 2011.06–2011.10 | 5 | −3,56 | −2.96 | D2 |
Publisher’s Note: MDPI stays neutral with regard to jurisdictional claims in published maps and institutional affiliations. |
© 2020 by the authors. Licensee MDPI, Basel, Switzerland. This article is an open access article distributed under the terms and conditions of the Creative Commons Attribution (CC BY) license (http://creativecommons.org/licenses/by/4.0/).
Share and Cite
Wu, T.; Zheng, W.; Yin, W.; Zhang, H. Spatiotemporal Characteristics of Drought and Driving Factors Based on the GRACE-Derived Total Storage Deficit Index: A Case Study in Southwest China. Remote Sens. 2021, 13, 79. https://doi.org/10.3390/rs13010079
Wu T, Zheng W, Yin W, Zhang H. Spatiotemporal Characteristics of Drought and Driving Factors Based on the GRACE-Derived Total Storage Deficit Index: A Case Study in Southwest China. Remote Sensing. 2021; 13(1):79. https://doi.org/10.3390/rs13010079
Chicago/Turabian StyleWu, Tingtao, Wei Zheng, Wenjie Yin, and Hanwei Zhang. 2021. "Spatiotemporal Characteristics of Drought and Driving Factors Based on the GRACE-Derived Total Storage Deficit Index: A Case Study in Southwest China" Remote Sensing 13, no. 1: 79. https://doi.org/10.3390/rs13010079
APA StyleWu, T., Zheng, W., Yin, W., & Zhang, H. (2021). Spatiotemporal Characteristics of Drought and Driving Factors Based on the GRACE-Derived Total Storage Deficit Index: A Case Study in Southwest China. Remote Sensing, 13(1), 79. https://doi.org/10.3390/rs13010079