Article

Underwater Topography Detection and Analysis of the Qilianyu Islands in the South China Sea Based on GF-3 SAR Images

Lab of Marine Physics and Remote Sensing, First Institute of Oceanography, Ministry of Natural Resources, Qingdao 266061, China
*
Author to whom correspondence should be addressed.
Remote Sens. 2021, 13(1), 76; https://doi.org/10.3390/rs13010076
Submission received: 31 October 2020 / Revised: 4 December 2020 / Accepted: 23 December 2020 / Published: 28 December 2020
(This article belongs to the Section Ocean Remote Sensing)

Abstract

:
Shallow sea underwater topography plays an important role in the development of islands and reefs. The Qilianyu Islands, located in Xisha, South China Sea, are a key area for the development and utilization of the South China Sea. Compared with traditional underwater topography detection methods, synthetic aperture radar (SAR) has the advantages of low cost, short time consumption, and the large-scale detection of shallow water topography. The GF-3 satellite is the first SAR satellite launched by China, and its ability to probe shallow sea topography has never been assessed. To detect the underwater topography of the Qilianyu Islands and test the application of GF-3 SAR data in shallow sea underwater topography detection, this paper implements the SAR shallow sea underwater topography detection model, the tidal information corresponding to the imaging time of the SAR image, and six GF-3 SAR images to detect the underwater topography of the Qilianyu island and reefs. The detection results have been analyzed from different imaging times, different water depths and different polarization modes, and the first four SAR images show promising detection results. The average absolute error (MAE) and average relative error (MRE) of the results are 1.5 m and 14.33%, respectively, which demonstrates that GF-3 SAR images have an impressive performance in underwater topography detection of South China Sea island reefs.

Graphical Abstract

1. Introduction

The construction of the South China Sea is an important measure to protect the country’s maritime rights and interests. The Qilianyu Islands are undeveloped islands in the South China Sea. The distances among the islands are short, and the entire reef is shallow, making it suitable for reclamation. Underwater topography is an important environmental parameter that needs to be known for land reclamation projects. Traditional shallow sea underwater topography detection technology mainly includes the on-site measurement of ship platforms, using technologies such as sonar or multibeam scanners [1]. However, this type of method can only obtain water depths of a small area, which is time consuming, labor intensive, and inefficient. For sea areas with very shallow water depths and harsh environments, it is difficult for ships and surveyors to enter, and they cannot enter controversial sea areas, which brings great challenges to the detection of shallow sea underwater topography. With the continuous development of remote sensing technology, the use of synthetic aperture radar (SAR) to detect shallow sea underwater topography has become a research hotspot in recent years. SAR can observe the sea surface all day, with a high spatial resolution, large coverage, low cost and high time efficiency [2]; these advantages overcome the shortcomings of traditional detection methods and provide a new solution for topographic exploration in shallow seas.
In 1987, the Netherlands first implemented research on the “Undersea Topography” project, using X-band and HH-polarized SAR sensors to verify the relationship between the SAR backscatter coefficient and topography [3]. Subsequently, the well-known AH model laid a theoretical foundation for underwater topography imaging in the shallow sea [4]. The model uses continuity equations to describe the interaction between underwater topography and tidal currents, and uses the relaxation time approximation method to qualitatively describe the topographic features in the SAR image. Vogelazang [5] calculated the radar backscattering cross section based on the first-order Bragg and integral equation scattering model, and used the continuity equation to qualitatively explain the modulation effect of sand waves on the tidal current. Shuchman [6] explained and quantified the relationship between the SAR signal and the topography of the ocean bottom, and developed a numerical model of hydrodynamic-electromagnetic waves suitable for SAR imaging of the bottom topography. The abovementioned theory and model of SAR imaging lays a theoretical foundation for further detection of shallow sea topography based on SAR images. Zheng [7] showed that SAR can detect underwater topography when the current is perpendicular to the topographic features. However, recent satellite observations have shown that shallow water topography can also appear on SAR images when currents are parallel to topographic features such as underwater sand ridges, sandbars, or tidal troughs [8,9,10,11]. Zhang [12] used 25 scenes of ASAR and ERS-2 SAR images from 2006 to 2010 to study and count the radar backscatter characteristics of the underwater topography of the Subei Shoal, and combined the relationship between the Ekman current and tidal current, finally proposing two possible SAR underwater topography imaging mechanisms in shallow water. In addition, many scholars have analyzed the optimal radar parameter conditions for topography simulation imaging [13,14,15] (Fan, 2008; Huang, 2000; Wang Jing, 2015) and obtained the optimal SAR parameters for topography inversion under shallow sea conditions. Yang Jungang [16] used five scenes of ERS-2 SAR imagery to analyze the tidal currents in the shallow sea area of Taiwan and obtained the relationship between the shallow sea underwater topography and the tidal currents. This study shows that the tidal field is an important factor in SAR underwater topographic imaging. Yuan Yeli [17] solved the wavenumber spectrum balance equation and obtained the expression of the saturation high-frequency spectrum of the sea surface microscale wave. Jin Meibing [18] established a shallow sea underwater topography SAR image inversion model on the basis of Yuan Yeli’s research, based on tidal current information and shallow water motion equations. Wang [19] performed water depth inversion on the Lingdingyang Bay waterway of the Pearl River Estuary, and the results showed that the water depth in this area increased by 2 m in 4 years. Bi Xiaolei [20] used a RADARSAT-2 fully polarized SAR image to study the Taiwan Shoal, and used the polarization whitening filter method to suppress the coherent speckle of the fully polarized SAR image. The detection accuracy of the filtered fully polarized information is 8.41%. Bian [21] inverted the water depth of the sea near the Hainan Province based on the scattering mechanism method. Research shows that the method based on the scattering mechanism is more suitable for underwater topography detection than single-polarization SAR data. The research areas in previous SAR shallow sea underwater topography detections have mainly been offshore shallow areas. For the remote sensing detection of the island reef topography, the main methods are analysis models, semianalytical semiempirical models and statistical models based on optical remote sensing images [22,23,24]. The detection effect of SAR for the underwater topography of islands and reefs is still unknown.
Based on the SAR shallow sea topography imaging mechanism and radar backscattering theory, combined with tidal current information, this paper establishes a SAR shallow sea underwater topography detection model, and uses GF-3 remote sensing images to conduct underwater topography detection for the Qilianyu Islands in the South China Sea. We test the ability of GF-3 SAR image data to be used for underwater topography detection, and the detection results can provide a data reference for Qilianyu Islands Ocean Engineering construction.

2. Materials and Methods

2.1. Underwater Topography SAR Detection Model

Because microwaves cannot directly penetrate seawater, SAR cannot directly obtain underwater topography information. SAR can identify the topography of the shallow sea because when the tidal currents pass over the underwater topography, the underwater topography will modulate the tidal currents, causing convergence or divergence of the sea surface current. The changed sea surface current interacts with sea surface microscale waves, and changes the spatial distribution of the sea surface micro-scale waves. Finally, the changes in the microscale waves on the sea surface will be recorded by the SAR sensor in the form of backscattered signals to produce an SAR image that characterizes the backscattered intensity of the sea surface. Therefore, SAR images will contain rich underwater topography information. The most commonly used SAR underwater topography imaging model is the AH model proposed by Alpers and Hennings [4]. The theoretical model believes that the divergence and convergence of the flow field are caused by the difference in sea surface velocity between deep water and shallow water. When the sea surface roughness in the divergent zone increases, the Bragg wave amplitude increases, the radar echo signal increases, and then, the brightness of the corresponding position of the SAR image will increase. Correspondingly, the reduction in the sea surface roughness in the divergent zone causes the Bragg wave amplitude to decrease. The radar echo signal weakens, and the brightness of the corresponding position of the SAR image decreases. Therefore, the underwater topography information will be presented in the form of bright and dark stripes on the SAR image. According to previous experiments and studies, SAR underwater topographic imaging in shallow water is mainly divided into the following three processes: (1) the interaction between the topography and tidal current under shallow water; (2) the interaction between tidal current and sea surface microscale waves; and (3) the interaction between sea surface microscale waves and radar waves. The physical process of imaging is shown in Figure 1, which is modified from [4].
The incident angle of SAR to the sea surface is generally between 20° and 70°, which conforms to the Bragg scattering theory, so it can be used to describe the interaction between sea surface microscale waves and incident radar waves. Based on the Bragg scattering theory, Valenzuela expressed the radar backscattering cross section σ 0 as follows [3]:
σ 0 = 4 π κ 4 c o s 4 θ g i j θ 2 ψ k , φ
In Formula (1), κ is the microwave wavenumber, θ is the microwave incident angle, ψ k , φ is the wavenumber spectrum of the sea surface at the microscale, g i j θ is the first-order scattering coefficient, φ represents the direction of the sea wavenumber k angle, and the wavenumber mode k satisfies the following resonance conditions:
k = 2 κ   s i n θ
The first-order scattering coefficient g i j θ has different expressions for different polarization modes.
For horizontal polarization,
g H H θ = ε r 1 c o s θ + ε r s i n 2 θ 1 / 2 2
For vertical polarization,
g V V θ = ε r 1 ε r 1 + s i n 2 θ s i n 2 θ ε r c o s θ + ε r s i n 2 θ 1 / 2 2
where ε r is the relative dielectric constant.
In the process of the SAR imaging of shallow sea topography, the microscale waves that interact with the sea surface flow field are mainly gravitational capillary waves, so the corresponding interaction can be expressed by the wavenumber spectrum balance equation of the sea surface microscale waves. Yuan Yeli [17] solved the wavenumber spectrum balance equation, connected microscale background field with the radar backscattering cross section, and obtained the expression of the sea surface micro-scale wave saturation high-frequency spectrum:
Ψ k = m l 1 m u * c 2 4 v k 2 ω 1 S α β U β x α ω 1 k 4
where m l and m are the dimensionless constants, c is the sea wave phase velocity, v is the sea water motion viscosity coefficient, u * is the wind friction velocity, ω is the angular frequency, k is the wavenumber, S α β is the residual momentum flux, and U β is the velocity component of the flow field. The modulation of the flow field change usually takes
S α β U β x α = 1 2 c o s 2 φ u x + c o s φ s i n φ u y + v x + s i n 2 φ v y
where u , v are the east and north components of the tidal field velocity, respectively, and φ is the sea surface wind direction angle.
Substituting Formulas (5) and (6) into Formula (1) yields:
σ 0 = π 4 c o t 4 θ g i j θ 2 m l 1 m u * c 2 4 v k 2 ω 1 M θ , k G u ¯ , φ
where
M θ , k = π 8 c o t 4 θ g i j θ 2 m l 1 ω 1
G u ¯ , φ = c o s 2 φ u x + c o s φ s i n φ u y + v x + s i n 2 φ v y
M θ , k is a function related to radar parameters such as incident angle and polarization mode, and G u ¯ , φ is a function related to the modulation of large-scale ocean currents on sea surface microscale waves. Formula (9) reflects the relationship between the gray value of the SAR image and the change in tidal current caused by topography, which can be used as the calculation expression of the SAR gray value of the topography simulation.
The topography inversion model for shallow water is composed of tidal current motion equations, appropriate initial boundary conditions, and SAR image gray value expressions. The model is described as follows:
u t + u u x + v u y f v = g ζ x C b u h
v t + u v x + v v y + f u = g ζ y C b v h
ζ t + h u x + h v y = 0
G u , θ = c o s 2 φ u x + c o s φ s i n φ u y + v x + s i n 2 φ v y
where the initial conditions are u | t = t 0 = U 0 , v | t = t 0 = V 0 , ζ | t = t 0 = 0 , and h = H 0 , the water depth at the open boundary is the forced water level, U 0 , V 0 , and ζ are the velocities u and v of the east and north components of the tidal field at the imaging time t 0 corresponding to the SAR image. H 0 is the initial water depth, and C b is the bottom friction coefficient, generally taken as a constant. The closed boundary conditions are set to 0 for u , v , ζ , and h in the vertical boundary direction.
In the shallow sea underwater topography inversion model, the input Formula (13) is the gray value of the SAR image, not the backscatter coefficient of the real SAR image, so it is necessary to convert the backscatter coefficient of the SAR image into gray values in Formula (13). Here, we show the relationship between the SAR backscatter coefficient and the SAR image gray value derived by statistical methods [25]:
G S A R = S G S σ 0 σ 0 σ 0 m + G m
where S G and S σ 0 are the standard deviations of G and σ 0 , respectively, G m and σ 0 m are the mean value of G and σ 0 , respectively.

2.2. Analysis of Detection Result

In this paper, the mean absolute error (MAE), mean relative error (MRE) and correlation coefficient (R) are used to evaluate the accuracy of underwater topography SAR detection results, and three evaluation indicators are calculated. The formula is:
M A E = i = 1 n H i A i n
M R E = i = 1 n H i A i / H i n
R = i = 1 n H i H ¯ A i A ¯ i = 1 n H i H ¯ 2 i = 1 n A i A ¯ 2
where H and A are the inverted water depth and the measured water depth, respectively, i is the i th water depth point, and n is the total number of water depth points.

2.3. Study Area and Data

Qilianyu Islands are located in the Paracel Islands in the South China Sea at 16°55′-17°01′N and 112°12′-112°21′E. The area is composed of Zhaoshu Island, Beidao Island, Zhongdao Island, Nansha Island, Beisha Island, Zhongsha Island, Nanshazhou Island and nearby reefs and sandbars. The Qilianyu reef plate includes two relatively separate sections: the Zhaoshudao Island–Xishazhou Island section in the west, the Beidao Island–Nanshazhou Island section in the east, and the Zhaoshu Door in the middle. The area of the reef is approximately 25 square kilometers. The sea area near Qilianyu Island and the reef is relatively shallow, with a maximum depth of no more than 50 m, which belongs to the range of shallow sea depths detected by SAR. The study area in this paper is the Zhaoshudao Island–Xishazhou Island section, and the latitude and longitude ranges are 16.56′–17°01′N and 112°11′–112°18′E. The geographic location of the research area is shown in Figure 2.
The GF-3 satellite is the first synthetic aperture radar (SAR) satellite in China’s high-score special program. The satellite was launched in August 2016. It is equipped with a C-band multipolarization SAR with a spatial resolution of 1–500 m and width is 10–650 km, which assists global and large-scale resource and environmental surveys, but can also be used for the identification of land and sea targets. The GF-3 satellite is equipped with 12 imaging modes, including the traditional strip imaging mode and scanning imaging mode, as well as the wave imaging mode and global observation imaging mode applied to ocean analysis, which is the spaceborne synthetic aperture radar with the most imaging modes in the world currently. At present, GF-3 data have been used widely in marine monitoring, marine target detection, meteorological monitoring, natural disaster forecasting, and land resource surveys. GF-3 SAR data can be downloaded from the National Satellite Ocean Application Service (http://www.nsoas.org.cn/index.html).
This article uses 6 scenes of GF-3 SAR images and the 6 scenes are numbered. The specific information is shown in Table 1. The scan mode of Image A is Fine Stripmap-I, and the polarization mode is HH polarization and HV polarization. The scanning mode of Images B and C are both Fine Stripmap-II, and the polarization modes are VV polarization and VH polarization, respectively. The SAR image of the study area is shown in Figure 3.
The measured water depth is derived from the chart data published in July 2009, with a total of 1157 water depth points, which are kriging interpolation to grid data with a grid resolution of 0.03′ × 0.03′. Resampling and sparse processing are performed on the chart data points, then the minimum curvature method is used to interpolate the grid data, and the grid data after the resolution is reduced as the initial water depth.

3. Underwater Topography SAR Detection of Qilianyu Islands

SAR detection of the Qilianyu Islands topography is mainly divided into four parts: SAR image preprocessing, calculation and analysis of tidal currents corresponding to SAR imaging time, underwater depth SAR inversion and error analysis of detection results. The detection calculation process is shown in Figure 4.

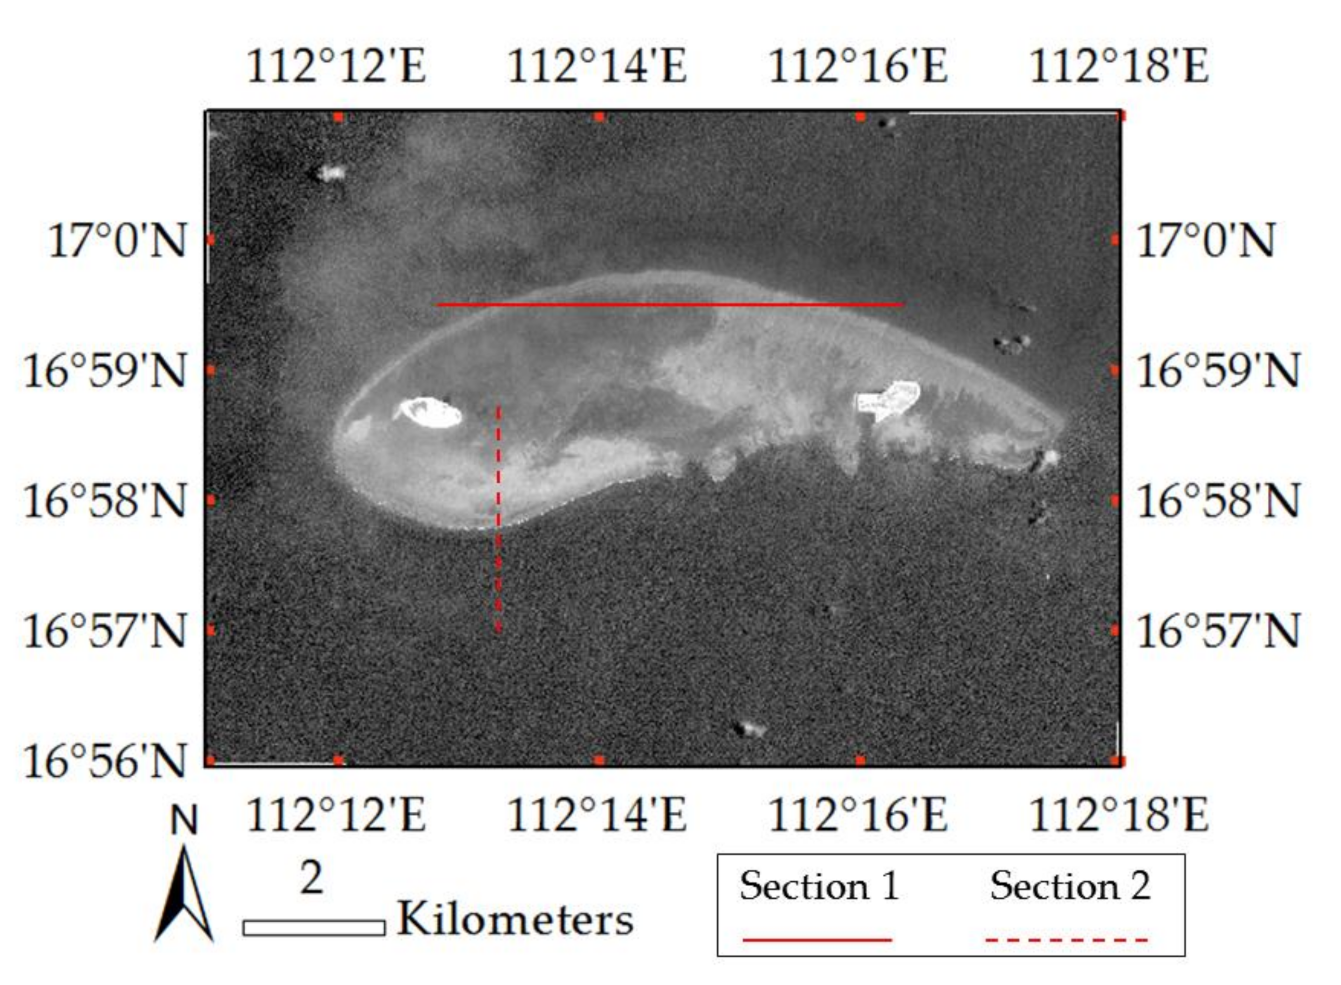
3.1. SAR Image Preprocessing

This article uses L1A level GF-3 data, which require image preprocessing. The GF-3 processing module is used in the PIE-SAR software to sequentially perform multiview processing, complex conversion intensity, EnLee filtering, geocoding, cropping, and output backscatter coefficient processing on the SAR image and, finally, generate the appropriate SAR images for water depth inversion. The preprocessed SAR image of the study area is shown in Figure 4. After pretreatment, the visual effect is good, and the islands and reefs in the study area can be clearly displayed in the image. The topography in Image A is the most obvious, which is mainly because the spatial resolution of Image A is significantly better than that of the other two scene images. In the cross-polarized images of the three scenes, there are bands with large brightness values except for the islands. After analysis, this phenomenon is caused by the breaking of waves. When sea waves rush from the deep sea to the shallow sea area, deformation and refraction will occur due to the influence of seabed topography, the waves will break, and the roughness of the broken waves will be larger, which will produce high brightness value areas on SAR images. By querying the sea surface wind field data of the ASCAT scatterometer (https://manati.star.nesdis.noaa.gov/datasets/ASCATData.php), the wind direction at the corresponding imaging time of Images A and B is southeast, and the wind direction of Image C is northeast, which corresponds to the high brightness area caused by the breaking of the waves in the SAR image. We use the aperiodic denoising method [26] to denoise this area.

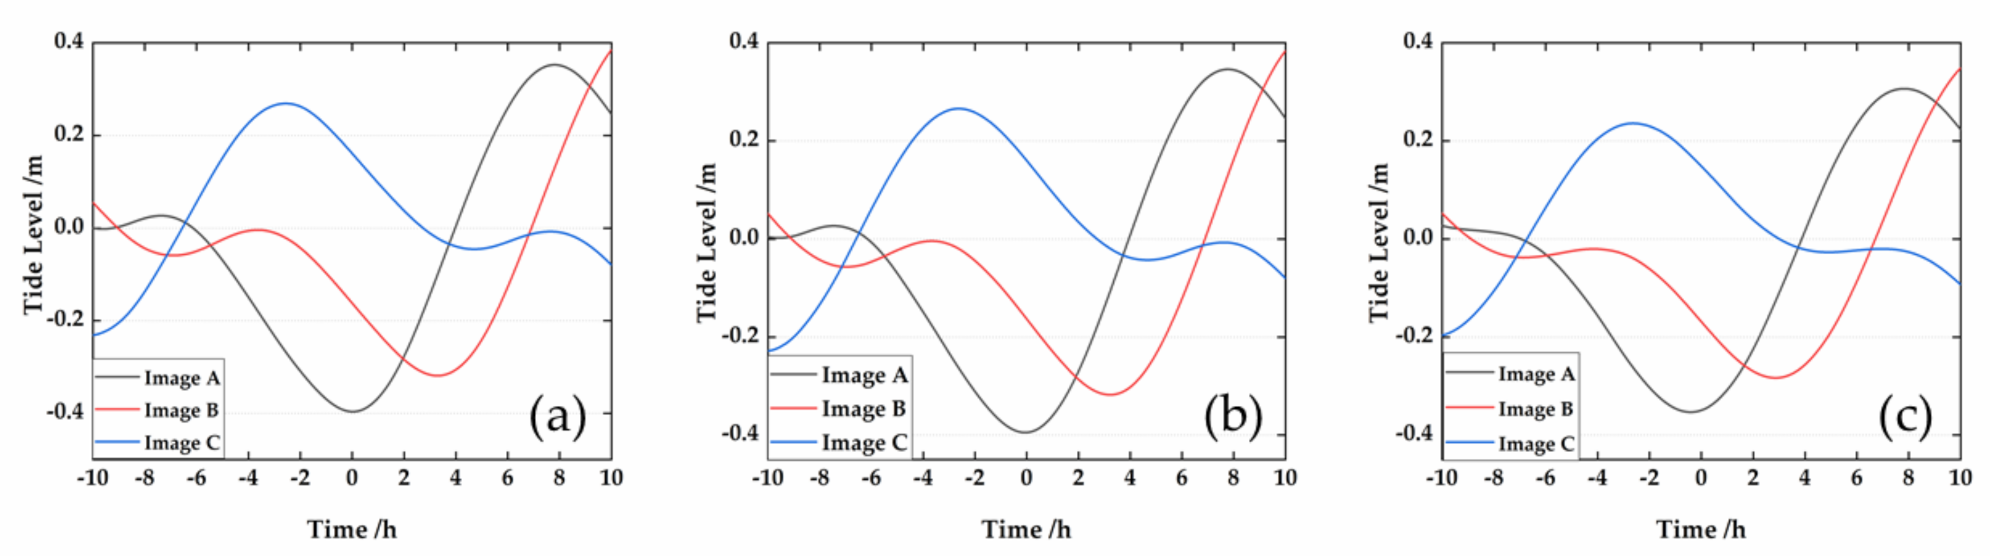
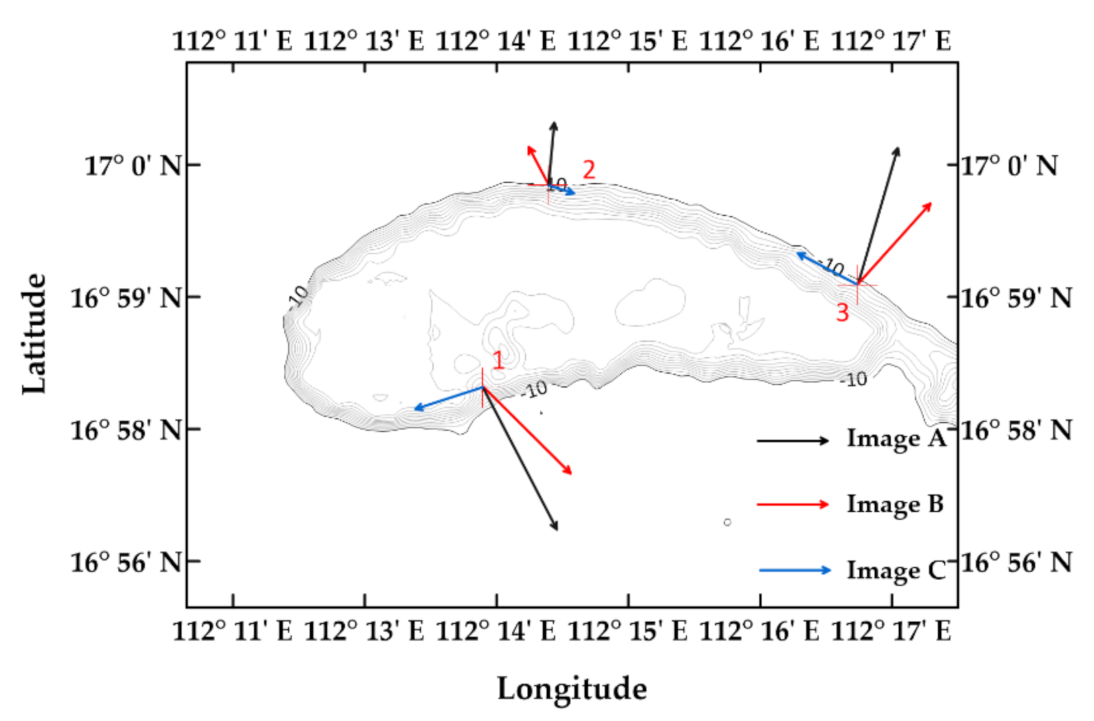
3.2. Calculation and Analysis of Tidal currents at Times of SAR Imaging

The tidal currents have a very important influence on the imaging of shallow sea underwater topography on the SAR. Therefore, for the inversion of shallow sea depth using SAR images, the tidal currents information corresponding to the SAR imaging time must first be determined. SAR has the strongest imaging capability for shallow sea topography when the current flow rate is large and the flow direction is the same or opposite to the topography gradient direction. This can be used as a condition for judging whether the SAR image is applicable.
In this paper, the POM (Princeton Ocean Model) is used to calculate the tidal currents corresponding to the SAR images of the three scenes at different times. The specific calculation range is 16°–17°N, 111°–113°E, the grid resolution is set to 0.3′, and the four tidal components are O 1 , K 1 , S 2 and M 2 . The forced water level in the open boundary condition in the POM is input by the following formula:
ζ = i H i c o s σ i t + v 0 i g i
where, H i , g i ( i = 1 , 2, 3, and 4) are the amplitude and phase of the partial tides O 1 , K 1 , S 2 and M 2 , respectively; σ i is the angular frequency of the four partial tides; and v 0 i is the astronomical initial phase angle.
The initial water depth and open boundary conditions are input to the POM to calculate the tide level ζ , the east component u and the north component v of the tidal current at each time. Three characteristic points with more obvious topography are chosen, namely, point 1 (112°13′50″E, 16°57′52″N), point 2 (112°14′24″E, 17°59′39″N) and point 3 (112°17′8″E, 16°58′46″N). The tidal level changes at this point were recorded 10 h before and after the imaging time and the tidal current component at the imaging time, as shown in Figure 5. As seen in the figure, the imaging time of Image A is low tide, the imaging time of Image B is 4 h after the high tide and 3 h before low tide, which is located in the middle of high and low tide, and the imaging time of Image C is 3 h after high tide and 4 h before low tide. The time is also in the middle of high tide and low tides. Through the tide manual, we find that the tide type of the study area is forward tidal wave [27,28]. By combining the relationship between high and low tide and diverting flow, the imaging time of Image A is the low tide time, and the tidal velocity is relatively large; the imaging moments of Images B and C are at the turning point of high and low tides, and the current is relatively small. Figure 6 shows the tidal current vectors of three SAR images at three feature points. The tidal velocity at the imaging moment of Image A is the largest, that of Image B is the second largest and that of Image C is the smallest. The tidal current flow direction corresponding to the imaging moment of Images A and B is close to the topographic gradient direction at the characteristic point and the tidal current flow direction of Image A is closer to the topographic gradient direction. Therefore, Images A and B are suitable for shallow sea underwater topography inversion; the corresponding tidal current direction of Image C is almost perpendicular to the topographic gradient direction, and the inversion result will be quite different from the actual topography.

3.3. Water Depths Inversion

First, the initial water depth and open boundary conditions are substituted into the POM to calculate the tidal currents corresponding to the imaging time of the six SAR images, and the underwater topography SAR image is simulated according to the tidal currents through Formula (13). Then, the simulated image and the real SAR image are statistically processed to obtain the SAR image used for water depth inversion by Formula (14). Finally, the initial water depth, initial boundary conditions and the SAR image used for water depth inversion are input into the tidal current equations to determine the water depth in the detection area.

4. Results and Discussions

4.1. Results of Topography Detection

Figure 7 is the contour map of the water depth inversion results of 6 GF-3 SAR images. The entire reef in the western Qilianyu Islands is well displayed, which is consistent with the bright and dark stripes on the SAR image. The water depth inside the reef is relatively shallow, ranging from 0–10 m. The area with a water depth of 0–5 m is mainly located on the edge of the reef and some small areas in the inner area of the reef, and the area of 5–10 m is mainly located in the inner area of reef. The underwater topography on the reef is relatively flat and the degree of undulation is small. The water depth at the edge of the reef drops sharply from 5 to 10 m where the water depth changes very obviously, which indicates a steep slope. The water depth around the islands and reefs is mainly 10–15 m, of which there are two deep water areas in the northeast of the islands and reefs and just south of Zhaoshu Island, and the water depth is greater than 15 m.

4.2. Comparison of the Accuracies of Different Imaging Times

Figure 8 is a scatter diagram comparing the detection results of 6 GF-3 SAR images with the actual water depth. The HH polarization and HV polarization of Image A and the VV polarization and VH polarization of Image B have a high correlation with the actual water depth. The correlation between the two polarization detection results of Image C and the actual water depth is low. The average R of the six scene images is 0.86, and the average R of the first four scene images is 0.89, which shows that the model can detect topography. Figure 8 shows that the detection result of the HV polarization of Image A has the highest accuracy, with MAEs and MREs of 1.45 m and 13.91%, respectively; the detection result of Image C VV polarization has the lowest accuracy, with MAEs and MREs of 2.24 m and 21.41%, respectively. The order of accuracy of the inversion results of the other four images is Image A HH polarization, Image B VV polarization, Image B VH polarization, and Image C VH polarization. Among the three images at different imaging times, Table 2 shows that the average inversion accuracy of Image A is the highest, with an MRE of 13.92%, followed by Image B, and Image C has the worst inversion accuracy.
The correlation analysis between the inversion results and the tidal current calculation results shows that the tidal current velocity of Image A is relatively large, and the flow direction is the closest to the topography gradient direction. Thus, the SAR shallow water topography inversion accuracy is shown to be the best. The tidal flow velocity of Image B is smaller than that of Image A, and the flow direction is less consistent with the topography gradient direction, so the inversion accuracy of Image B is worse than that of Image A. The MAE and MRE of the two polarization data detection results of Image C are 2.17 m and 20.67%, respectively. This result is because the flow velocity of the tidal current for Image C is too small and the flow direction is close to vertical to the topographic gradient direction. The above analysis shows that only SAR images with high tidal velocities and flow directions close to topography gradients at corresponding imaging times can be used for SAR underwater topography detection.

4.3. Comparison of Accuracies at Different Water Depths

Four scenes were selected with reasonable topographic detection (Image A HH polarization and HV polarization, Image B VV polarization and VH polarization), segmented at 5 m intervals, and the detection capabilities are analyzed at different depths. Because the water depth of 0–1 m is too shallow, there will be very large abnormal values when calculating the average relative error. This water depth section will not be analyzed here. Figure 9 shows that the MAE of the detection results of the four SAR images is distributed in 0–9 m, but mainly concentrated at 0–4 m. The larger error is caused by the noise points in the SAR image. The three ranges with the highest error frequencies are 0–1, 1–2 and 2–3 m. The sum of the three frequencies exceeds 90%. The error exists at the high frequency range of 0–1 m. As the error range increases, the number of points in the error range is significantly reduced, which also illustrates the reliability of the detection model.
Figure 10a,b show the MAE and MRE curves of the detection result with water depth, respectively. Figure 10a shows that the MAE and the water depth are not simply related, and the curve has multiple peaks. The errors in ranges of 0–10 and 17–20 m are relatively large, and the error within 10–17 m is relatively small. The error at 14 m is the smallest, and the error at 20 m is the largest (the error for the Image B VV polarization at 1 m is as high as 5 m, which is an outlier). Figure 10b shows that the MRE of the detection result and the water depth are roughly negatively correlated. The error in the range of 1–7 m is more than 50%. Combined with Figure 10a, the main reason for this phenomenon is that the water depth itself is too small, when the water depth value is used as the denominator, the average relative error will be too large. The MRE within 10–20 m is less than 30%, and the error is the smallest at 14 m. Table 3 shows the accuracy of the detection results at four different water depths. The MAEs at the four water depths of 1–5, 5–10, 10–15 and 15–20 m are 2.22, 2.50, 1.02 and 1.57 m, respectively, and the MREs are 124%, 35.60%, 8.08% and 9.83%, respectively. The water depth section with the highest detection accuracy is 10–15 m, followed by 15–20 m, and the detection accuracy of 1–5 m is the worst. Combined with the topography detection results in Figure 8, 1–5 m is the main water depth on the reef, and the topographic undulation and reef area are relatively small. It is not easy to recognize this feature by the SAR images, so the detection result has a large error; the water depth of 5–10 m is mainly located on the edge of the reef, the topography gradient changes too sharply, and the detection error is relatively poor. However, the topography gradient at 10–20 m water depth is large and the topography obviously changes, which is conducive to the detection of topography by SAR.

4.4. Comparison of Accuracy in Different Polarization Images

Section 1 (112°12′–112°16′E, 16°59′N) and Section 2 (112°13′E, 16°57′13″–16°58′50″N) are selected in the SAR image as shown by the red solid line in Figure 11. The error analysis is carried out for the water depth detection results, as shown in Figure 12 and Table 4. The change trend of the water depth detection results of Image A and Image B at the two sections is consistent with the actual water depth, but the detection result of Image C changes drastically compared with the actual water depth. The MRE of the detection results of the Image B VV polarization in the two sections is the smallest, which is 0.54 m. By analyzing the detection results of the three SAR images at different imaging moments, we know that the MRE of the Image B inversion results is the smallest, which is 0.65 m, followed by Images A and C.
The correlation between the different polarization modes and the detection results is analyzed in the two sections. Figure 12 shows the distribution curves of the detection water depth along the two sections of the six different polarization images. The error analysis of the detection results is shown in Table 4. The MAEs of the detection results of the HH polarization of Image A at Section 1 and Section 2 are 0.79 and 0.45 m, respectively, and the MAEs of HV polarization are 0.94 and 0.77 m, respectively. The accuracy of the detection result of HH polarization is obviously better than that of the HV polarization. For the four detection results of Images B and C, the detection accuracy of the VH polarization at Section 1 is higher than that of the VV polarization, and the detection accuracy of the VV polarization at Section 2 is higher than that of the VH polarization. However, taking the average detected value of the two sections, the VV polarization effect in Image B is reasonable, and the VH polarization effect in Image C is good.
In previous studies, images with different polarization modes have different imaging capabilities for different topographies. In the case of underwater dune topography, the imaging capability of single polarization is better than that of cross polarization, and the radar sea surface of VV polarization has the strongest backscatter and the best signal-to-noise ratio. This technique is most suitable for the recognition of underwater dune topography [14,29]. For trough topography (such as navigation channels), the HH-polarized radar has the strongest backscattering intensity on the sea surface, and the contrast between bright and dark stripes in the image is the most obvious. The imaging effect of topography is significantly better than that of the VV polarization and cross polarization [30]. In this study, the study area contains island and reef topography, which is different from the topographic types previously studied, and the obtained conclusions are also different from those of previous studies.

5. Conclusions

Based on the SAR shallow sea underwater topography inversion model, this paper uses 6 GF-3 SAR images to carry out research on underwater topography detection in the Qilianyu Islands of the South China Sea, and analyzes the relationship between the tidal field and the underwater topography gradient at the time of SAR image imaging. Studies have shown that the water depth west of the Qilian Islands is mainly 0–20 m. The water depth in the reef is shallower (0–10 m), and the water depth around the reef is deeper, with the deepest part reaching 20 m. The MAE and MRE of the four GF-3 images with reasonable water depth inversion for the sea surrounding Qilianyu Islands are 1.5 m and 14.33%, respectively, and the detection accuracy is high. Specifically, the MRE of the HV polarization detection result of Image A is only 13.91%, and the MAE is 1.45 m, which shows that GF-3 satellite data can be applied effectively to SAR underwater topography detection. In addition, by analyzing the relationship between the tidal currents and the topography gradient, it is verified that a larger flow velocity and a flow direction close to the change direction of the topography gradient are beneficial to the SAR detection of the shallow water topography. By analyzing the detection capabilities of the detection model for different water depths in the sea surrounding Qilianyu Islands, we conclude that the detection ability of topography in the range of 10–15 m is the high, and the topography detection in the range of 1–5 m is the low, which is related to the gradient of water depth. In this paper, dual-polarization SAR data are used, and the imaging time of the data is also different, which makes it difficult to compare the detection ability of SAR images with different polarization modes (HH, HV, VV, and VH) with the reef topography. Further studies using fully polarized SAR data will be required.

Author Contributions

J.M. provided the conceptualization and revised the manuscript. L.H. developed the methodology, performed the experiments and analysis, and wrote the manuscript. J.Y. provided the supports of methodology and revised the manuscript. J.Z. revised the manuscript. All authors have read and agreed to the published version of the manuscript.

Funding

This research was funded by the National Key R&D Program of China under contract No.2016YFC1401001 and the National Natural Science Foundation of China, grant number 51839002.

Acknowledgments

We gratefully acknowledge the National Key R&D Program of China under contract and the National Natural Science Foundation of China that provided the actual water depth data for Qilianyu Islands. Furthermore, we gratefully acknowledge the National Satellite Ocean Application Service (NSOAS) for providing the GF-3 SAR productions. Finally, we also gratefully acknowledge PIESAT Company for the supports of the PIE-SAR application.

Conflicts of Interest

The authors declare no conflict of interest.

References

  1. Liu, Z.; Zhou, X.; Chen, Y.; Hu, G. The development in the latest technique of shallow water multi—Beam sounding system. Hydrogr. Surv. Charting 2005, 25, 67–70. [Google Scholar] [CrossRef]
  2. Guo, H. Theory and Application of Radar Earth Observation; Science Press: Beijing, China, 2000. [Google Scholar]
  3. Valenzuela, R. Theories for the interaction of electromagnetic and oceanic waves—A review. Bound. Layer Meteorol. 1978, 13, 61–85. [Google Scholar] [CrossRef]
  4. Alpers, W.; Hennings, I. A theory of the imaging mechanism of underwater bottom topography by real and synthetic aperture radar. J. Geophys. Res. Ocean. 1984, 89, 10529–10546. [Google Scholar] [CrossRef]
  5. Vogelzang, J. Mapping submarine sand waves with multiband imaging radar: 1. Model development and sensitivity analysis. J. Geophys. Res. Ocean. 1997, 102, 1163–1181. [Google Scholar] [CrossRef]
  6. Shuchman, R.; Lyzenga, D.; Meadows, G. Synthetic aperture radar imaging of ocean-bottom topography via tidal-current interactions: Theory and observations. Int. J. Remote Sens. 1985, 6, 1179–1200. [Google Scholar] [CrossRef]
  7. Zheng, Q.; Li, L.; Guo, X.; Ge, Y.; Zhu, D.; Li, C. SAR imaging and hydrodynamic analysis of ocean bottom topographic waves. J. Geophys. Res. Ocean. 2006, 111. [Google Scholar] [CrossRef] [Green Version]
  8. Li, X.; Li, C.; Xu, Q.; Pichel, W. Sea surface manifestation of along-tidal-channel underwater ridges imaged by SAR. IEEE Trans. Geoence Remote Sens. 2009, 47, 2467–2477. [Google Scholar] [CrossRef]
  9. Zheng, Q.; Zhao, Q.; Yuan, Y.; Xian, L.; Hu, J.; Liu, X.; Yin, L.; Ye, Y. Shear-flow induced secondary circulation in parallel underwater topographic corrugation and its application to satellite image interpretation. J. Ocean Univ. China 2012, 11, 427–435. [Google Scholar] [CrossRef] [Green Version]
  10. Wang, X.; Zhang, H.; Fu, B.; Guan, W. SAR imaging of a topography-induced current front in a tidal channel. Int. J. Remote Sens. 2015, 36, 3563–3574. [Google Scholar] [CrossRef]
  11. Zhang, S.; Xu, Q.; Cheng, Y.; Li, Y.; Huang, Q. Bathymetric features of Subei Bank on ENVISAT ASAR images. In Proceedings of the IEEE Progress in Electromagnetic Research Symposium (PIERS), Shanghai, China, 8–11 August 2016. [Google Scholar]
  12. Zhang, S.; Xu, Q.; Zheng, Q.; Li, X. Mechanisms of SAR imaging of shallow water topography of the Subei Bank. Remote Sens. 2017, 9, 1203–1224. [Google Scholar] [CrossRef] [Green Version]
  13. Fan, K.; Huang, W.; He, M.; Fu, B.; Gan, X. Simulation study on the effect of wind on SAR imaging of shallow water Bathymetry. J. Remote Sens. 2008, 12, 743–749. [Google Scholar] [CrossRef]
  14. Huang, W.; Fu, B.; Zhou, C.; Yang, J.; Shi, A.; Li, D. Simulation of optimal synthetic aperture radar (SAR) parameters for mapping underwater bottom topography. J. Remote Sens. 2000, 4, 172–177. [Google Scholar] [CrossRef]
  15. Wang, J.; Chen, Y.; Li, N.; Xu, Z. Multiple points of view and multiband SAR for underwater simulation research. Radar Sci. Technol. 2015, 13, 375–389. [Google Scholar] [CrossRef]
  16. Yang, J.; Zhang, J.; Meng, J. The correlation analysis of underwater topography SAR imaging and tidal current. Acta Oceanologica Sinica 2012, 34, 53–60. [Google Scholar]
  17. Yuan, Y. Representation of high frequency spectra of ocean waves and the basis for analyzing SAR images. Oceanol. Limnol. Sin. 1997, 28, 1–5. [Google Scholar]
  18. Jin, M.; Yuan, Y. Formulation and solution of the mathematical and physical inverse problem of detecting sea topography by SAR images. Oceanol. Limnol. Sin. 1997, 28, 27–31. [Google Scholar]
  19. Wang, X.; Zhang, H.; Fu, B.; Guan, W.; Shi, A. Simulation and Analysis on SAR Imaging of Channel Topography Changes in the Pearl River Estuary. Mippr: Multispectral Image Acquisition, Processing, & Analysis; International Society for Optics and Photonics: Zhoushan, China, 2013. [Google Scholar]
  20. Bi, X.; Meng, J.; Yang, J.; Liu, Q. Application of SAR polarization information for detection of underwater topography. J. Remote Sens. 2013, 17, 34–45. [Google Scholar] [CrossRef]
  21. Bian, X.; Shao, Y.; Tian, W.; Wang, S.; Zhang, C.; Wang, X.; Zhang, Z. Underwater topography detection in coastal areas using fully polarimetric SAR data. Remote Sens. 2017, 9, 560–576. [Google Scholar] [CrossRef] [Green Version]
  22. Zhang, X.; Ma, Y.; Zhang, J. Shallow water bathymetry based on inherent optical properties using high spatial resolution multispectral imagery. Remote Sens. 2020, 12, 3027–3050. [Google Scholar] [CrossRef]
  23. Zhang, J.; Ma, Y.; Tian, Z.; Liang, J. Impact of wavelet denoising on Multi-Spectral bathymetry inversion. Adv. Mar. Sci. 2015, 33, 334–341. [Google Scholar] [CrossRef]
  24. Li, J.; Zhang, H.; Hou, P.; Fu, B.; Zheng, G. Mapping the bathymetry of shallow coastal water using single-frame fine-resolution optical remote sensing imagery. Acta Oceanologica Sinica 2016, 35, 60–66. [Google Scholar] [CrossRef]
  25. Yang, J. An Assimilation Model for Underwater Topography Retrieval from Multi-Source Multitemporal SAR Data[D]. Graduate University of Chinese Academy of Sciences, Qingdao, China, 2007; pp. 20–22. [Google Scholar]
  26. Xiao, Y.; Cui, T.; Gong, J. A non-periodic stripes noises removal method for airborne SAR data. Adv. Mar. Sci. 2016, 34, 571–578. [Google Scholar] [CrossRef]
  27. Fang, G. Analysis and Forecasting of Tides and Tidal Currents, 1st ed.; China Ocean Press: Beijing, China, 1986; pp. 17–18. [Google Scholar]
  28. Ding, W. Distribution of tides and tidal currents in the south china sea. Oceanol. Limnol. Sin. 1986, 17, 468–480. [Google Scholar]
  29. Fu, B. Shallow Sea Bottom Topography Mapping by SAR[D]. Ocean University of China, Qingdao, China, 2005; pp. 39–44. [Google Scholar]
  30. Fu, B.; Fan, K.; Chen, P.; Shi, A.; Wang, X. Technology and Application of Synthetic Aperture Radar (SAR) Remote Sensing for Shallow Water Depth Detection, 1st ed.; China Ocean Press: Beijing, China, 2015; pp. 49–50. [Google Scholar]
Figure 1. Synthetic aperture radar (SAR) mechanism of shallow underwater topography imaging.
Remotesensing 13 00076 g001
Figure 2. Study area image. (a) The South China Sea map; (b) GF-6 image (UTC 12.March 2020, downloaded from the National Satellite Ocean Application Service.
Remotesensing 13 00076 g002
Figure 3. Images of GF-3 in the study area after pretreatment: (a) Image A HH Polarization; (b) Image A HV Polarization; (c) Image B VV Polarization; (d) Image B VH Polarization; (e) Image C VV Polarization; (f) Image C VH Polarization.
Remotesensing 13 00076 g003
Figure 4. Flow chart of shallow sea underwater topography detection. The state of the Princeton Ocean Model (POM) is described in Section 3.2.
Remotesensing 13 00076 g004
Figure 5. Change in tide level 10 h before and after imaging at 3 points: (a) Point 1; (b) Point 2; and (c) Point 3.
Remotesensing 13 00076 g005
Figure 6. Schematic diagram of the tide flow vector at the feature point.
Remotesensing 13 00076 g006
Figure 7. Inversion results by contour map on six images: (a) Image A HH Polarization; (b) Image A HV Polarization; (c) Image B VV Polarization; (d) Image B VH Polarization; (e) Image C VV Polarization; and (f) Image C VH Polarization.
Remotesensing 13 00076 g007aRemotesensing 13 00076 g007b
Figure 8. Scatter plots of inversion depth and measured depth of different images: (a) Image A HH Polarization; (b) Image A HV Polarization; (c) Image B VV Polarization; (d) Image B VH Polarization; (e) Image C VV Polarization; and (f) Image C VH Polarization. The equation in the picture is the linear regression equation, and the red solid line is the linear fitting line.
Remotesensing 13 00076 g008
Figure 9. Histogram of average absolute error distribution of detection results on four images: (a) Image A HH Polarization; (b) Image A HV Polarization; (c) Image B VV Polarization; and (d) Image B VH Polarization.
Remotesensing 13 00076 g009
Figure 10. Error graph of detection results on four images: (a) mean absolute error (MAE); (b) mean relative error (MRE).
Remotesensing 13 00076 g010
Figure 11. Diagram of two sections.
Remotesensing 13 00076 g011
Figure 12. Detection results of different polarization images along two sections: (a) Image A, Section 1; (b) Image A, Section 2; (c) Image B, Section 1; (d) Image B, Section 2; (e) Image C, Section 1; (f) Image C, Section 2.
Remotesensing 13 00076 g012aRemotesensing 13 00076 g012b
Table 1. Main parameters of the GF-3 satellite.
ImageTime (UTC)PolarizationResolution (m)Mode
A14 June 2020 10:09HH, HV5Fine Stripmap-I
B01 July 2020 22:26VV, VH10Fine Stripmap-II
C04 January 2020 22:32VV, VH10Fine Stripmap-II
Table 2. Error table of image detection results at different imaging times.
ImageMAE (m)MRE (%)R
A1.45513.920.900
B1.54514.730.885
C2.17020.670.805
Table 3. Precision error table of different water depths.
Depth (m)ErrorImage AImage BMean Error
HH PolarizationHV PolarizationVV PolarizationVH Polarization
1–5MAE (m)2.382.301.972.232.22
MRE (%)130129110127124
5–10MAE (m)2.382.432.612.592.50
MRE (%)33.7534.5837.1136.9535.60
10–15MAE (m)0.981.001.061.031.02
MRE (%)7.837.938.498.198.08
15–20MAE (m)1.481.461.681.671.57
MRE (%)9.169.1610.5210.469.83
Table 4. Detection error table along sections depth.
ImagePolarizationSection 1Section 2Mean Error
MAE/mMRE/%MAE/mMRE/%MAE/mMRE/%
AHH0.7926.910.459.170.7420.98
HV0.9432.200.7715.63
BVV0.6020.500.489.770.6516.89
VH0.4515.551.0721.72
CVV3.001002.1643.662.4666.90
VH2.1372.452.5551.47
Publisher’s Note: MDPI stays neutral with regard to jurisdictional claims in published maps and institutional affiliations.

