Article

Development and Performance Evaluation of a Very Low-Cost UAV-Lidar System for Forestry Applications

1
State Key Laboratory of Vegetation and Environmental Change, Institute of Botany, Chinese Academy of Sciences, Beijing 100093, China
2
College of Resources and Environment, University of Chinese Academy of Sciences, Beijing 100049, China
3
Department of Environmental Sciences, Policy and Management, University of California, Berkeley, CA 94720-3114, USA
4
Division of Agriculture and Natural Resources, University of California, Berkeley, CA 94720-3114, USA
5
Institute of Ecology, College of Urban and Environmental Science, Peking University, Beijing 100871, China
*
Author to whom correspondence should be addressed.
Remote Sens. 2021, 13(1), 77; https://doi.org/10.3390/rs13010077
Submission received: 24 November 2020 / Revised: 21 December 2020 / Accepted: 24 December 2020 / Published: 28 December 2020
(This article belongs to the Special Issue Trends in UAV Remote Sensing Applications: Part II)

Abstract

:
Accurate and repeated forest inventory data are critical to understand forest ecosystem processes and manage forest resources. In recent years, unmanned aerial vehicle (UAV)-borne light detection and ranging (lidar) systems have demonstrated effectiveness at deriving forest inventory attributes. However, their high cost has largely prevented them from being used in large-scale forest applications. Here, we developed a very low-cost UAV lidar system that integrates a recently emerged DJI Livox MID40 laser scanner (~$600 USD) and evaluated its capability in estimating both individual tree-level (i.e., tree height) and plot-level forest inventory attributes (i.e., canopy cover, gap fraction, and leaf area index (LAI)). Moreover, a comprehensive comparison was conducted between the developed DJI Livox system and four other UAV lidar systems equipped with high-end laser scanners (i.e., RIEGL VUX-1 UAV, RIEGL miniVUX-1 UAV, HESAI Pandar40, and Velodyne Puck LITE). Using these instruments, we surveyed a coniferous forest site and a broadleaved forest site, with tree densities ranging from 500 trees/ha to 3000 trees/ha, with 52 UAV flights at different flying height and speed combinations. The developed DJI Livox MID40 system effectively captured the upper canopy structure and terrain surface information at both forest sites. The estimated individual tree height was highly correlated with field measurements (coniferous site: R2 = 0.96, root mean squared error/RMSE = 0.59 m; broadleaved site: R2 = 0.70, RMSE = 1.63 m). The plot-level estimates of canopy cover, gap fraction, and LAI corresponded well with those derived from the high-end RIEGL VUX-1 UAV system but tended to have systematic biases in areas with medium to high canopy densities. Overall, the DJI Livox MID40 system performed comparably to the RIEGL miniVUX-1 UAV, HESAI Pandar40, and Velodyne Puck LITE systems in the coniferous site and to the Velodyne Puck LITE system in the broadleaved forest. Despite its apparent weaknesses of limited sensitivity to low-intensity returns and narrow field of view, we believe that the very low-cost system developed by this study can largely broaden the potential use of UAV lidar in forest inventory applications. This study also provides guidance for the selection of the appropriate UAV lidar system and flight specifications for forest research and management.

1. Introduction

Forest inventory is a fundamental forest management practice for quantifying forest resources and understanding forest ecosystem processes [1,2,3,4]. In recent years, light detection and ranging (lidar) has been recognized as an efficient and accurate technology for estimating forest inventory attributes such as tree height, diameter at breast height (DBH), crown diameter, crown base height, standing volume, and aboveground biomass [5,6,7,8,9,10,11,12]. Compared to traditional field-based methods, lidar has shown great potential to both improve the timeliness and reduce the labor cost of repeated forest inventory practices [13,14,15]. Various platforms (e.g., terrestrial, mobile, unmanned aerial vehicle (UAV), airborne, and spaceborne) have been developed to deploy lidar instruments. Among them, UAV lidar provides the ability to balance convenience, spatial coverage, and data quality [16,17], all essential characteristics for local landscape-scale forest inventory practices.
Laser scanner is the core of a UAV lidar system’s performance and needs to be light due to UAV payload limitations. In recent years, developments in laser scanners in the self-driving and photography industries have led to the emergence of a series of off-the-shelf light-weighted laser scanners (Table 1). Most of these laser scanners can measure an object within a distance of 250 m and have a high range precision (≤5 cm), which is sufficient for accurately extracting forest canopy height and other forest attributes. Many attempts have been made to integrate UAV lidar systems using these laser scanners. For example, Jaakkola et al. [18] provided an early example of UAV lidar for forestry applications using the Sick LMS151 laser scanner. Wallace et al. [17] developed a UAV lidar system using the Ibeo Lux laser scanner and deployed it to derive individual tree attributes. Guo et al. [16] integrated a UAV lidar system using the Velodyne Puck VLP-16 laser scanner (Velodyne Puck hereafter) to map three-dimensional (3D) forest habitats. The performance of these laser scanners varied significantly. Some studies reported that for forestry applications the RIEGL VUX-1UAV laser scanner (RIEGL VUX hereafter) is better than the RIEGL miniVUX-1DL laser scanner (RIEGL miniVUX hereafter) and the Velodyne Puck laser scanner [19,20]. Nevertheless, we still lack a comprehensive analysis of the performances of different laser scanners for estimating forest inventory attributes under different flight parameter combinations (e.g., height, velocity), which is of great importance for choosing the optimum laser scanner for forest inventories.
Another concern of current UAV lidar systems is their relatively high cost when compared to structure-from-motion (SfM) (also called digital aerial photogrammetry (DAP)) systems that use UAV optical imagery [21,22,23]. For example, a UAV lidar system integrated with a Velodyne Puck laser scanner is one of the cheapest available options, but the hardware of the laser scanner alone currently costs over $4000 USD. In comparison, high-end optical cameras cost much less. For example, the Canon EOS 5D Mark II used in Cao et al. [24] costs around $1300 USD, and the Zenmuse X5S used in Moe et al. [25] costs around $2000 USD. Many studies have compared SfM point clouds with UAV lidar for estimating forest structural attributes. Although SfMs require accurate digital terrain models (DTMs) as a prerequisite input product [17,21,26] and may have difficulties in estimating under-canopy structural information and terrain information [24,27], they can accurately capture forest upper canopy information, such as maximum tree height, 90th percentile of height, and canopy cover [24,27,28,29,30] and generate DBH, standing volume, and aboveground biomass estimates with similar accuracies to those obtainable from certain low-cost laser scanners (e.g., Velodyne Puck) [24,31]. The relatively low cost and comparable performance in capturing upper canopy information of SfM have been the main reason for the limited traction of UAV lidar in large-scale forestry applications.
Recently, Da-Jiang Innovations (DJI) released an inexpensive light-weight laser scanner, Livox MID40 (DJI Livox hereafter), for the self-driving industry. Its retail price is only $599 USD, thus providing a great opportunity to reduce the cost of UAV lidar systems. However, its performance in estimating forest inventory attributes has yet to be investigated. Here, we aim to describe the development of a very low-cost UAV lidar system for forest inventory applications that integrates the DJI Livox laser scanner. Its performance for estimating forest inventory attributes was systematically compared to that of four other UAV lidar systems equipped with a RIEGL VUX laser scanner, a RIEGL miniVUX laser scanner, a HESAI Pandar40 laser scanner, and a Velodyne Puck laser scanner, respectively. To the best of our knowledge, this study is the first evaluation of the performance of DJI Livox for forestry applications. Forest managers and researchers can use this study as a guide to the selection of the laser scanner best fitting their needs.

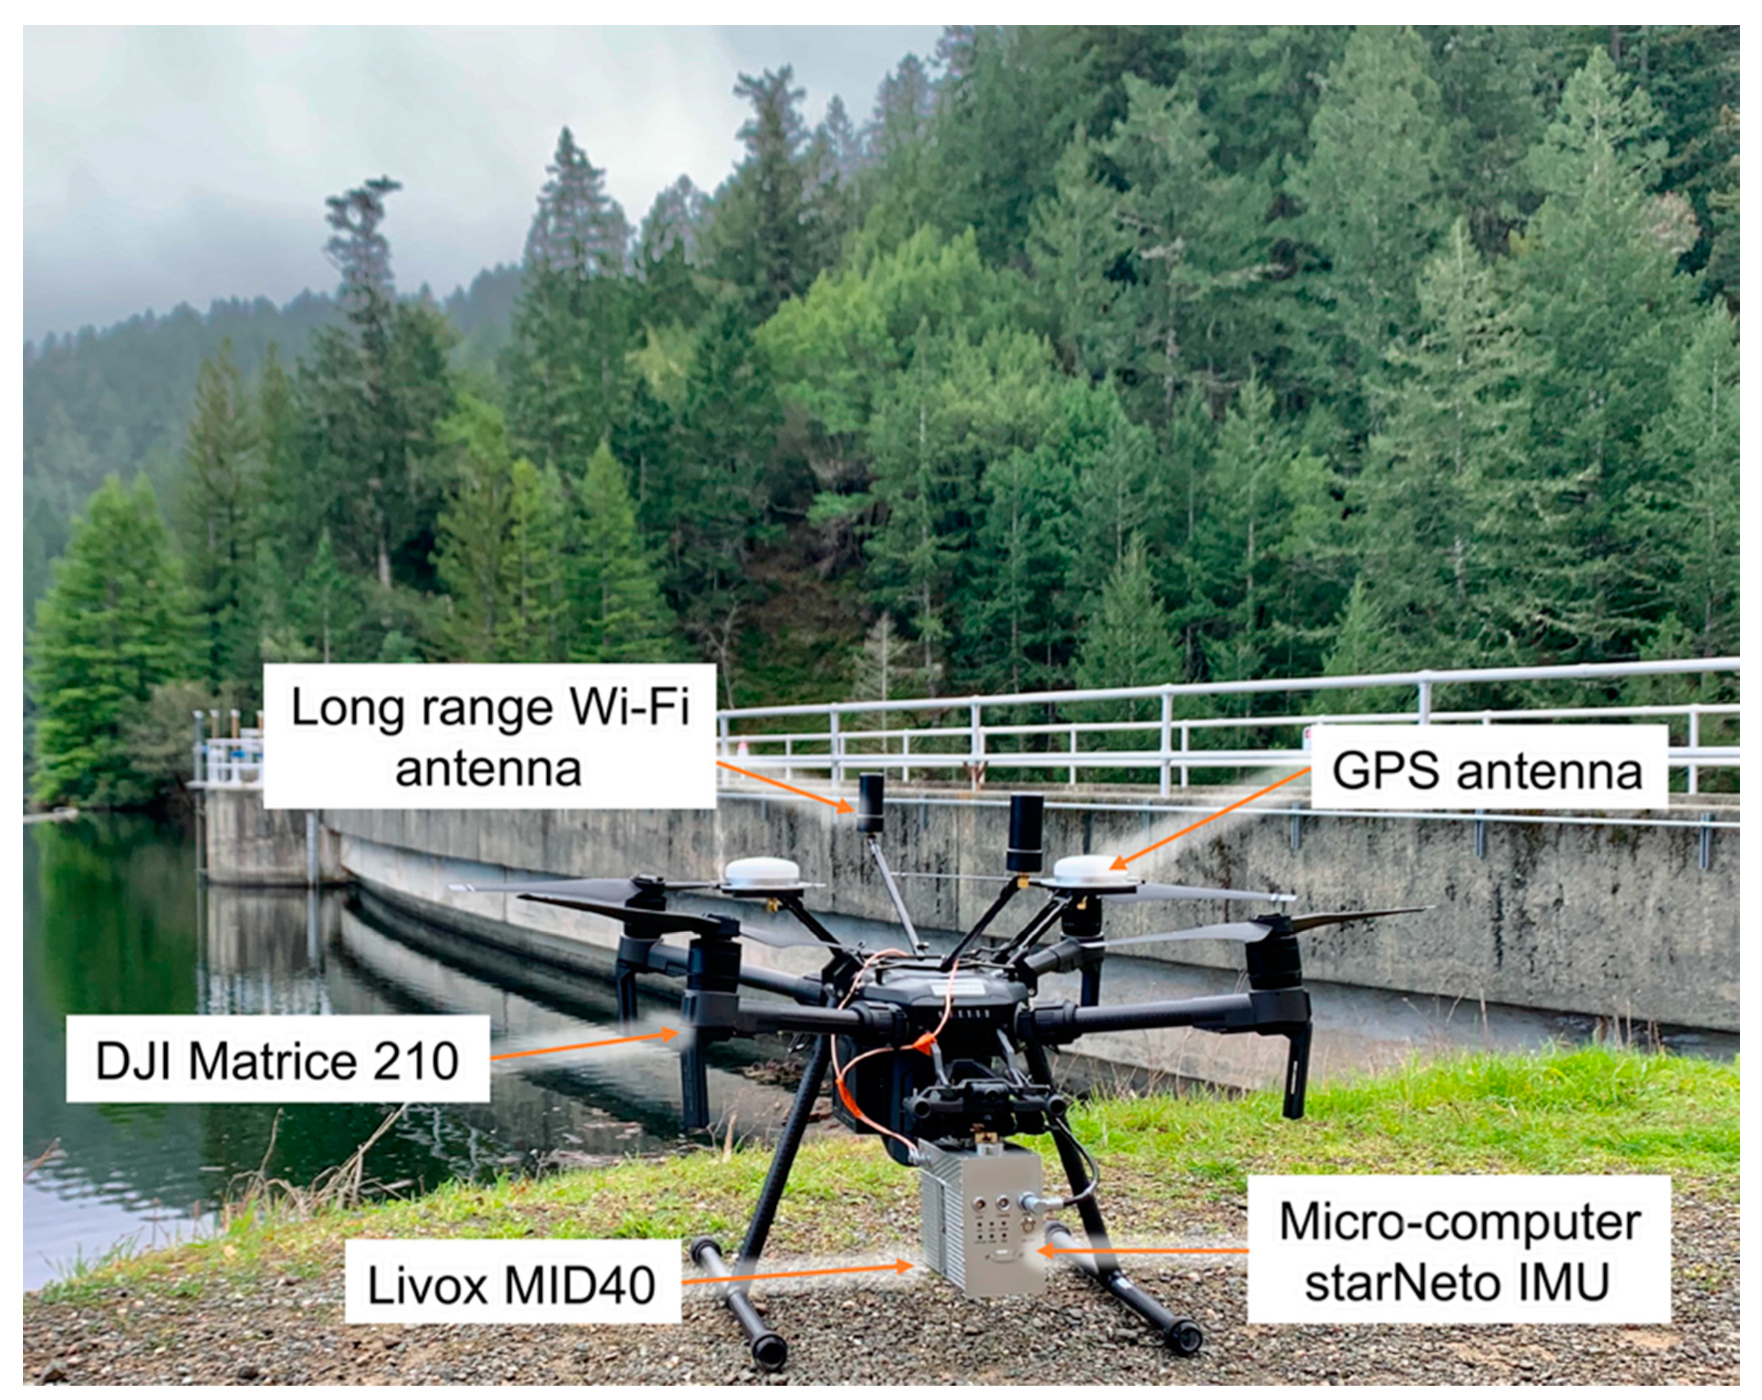
2. Development of the DJI Livox System

The very low-cost UAV lidar system developed by this study has six major components (Figure 1): A DJI Livox laser scanner, a starNeto high-precision inertial measurement unit (IMU), dual global navigation satellite system (GNSS) antennas, a long-range WiFi antenna, and a microcomputer. The DJI Livox laser scanner (Livox Technology, Shenzhen, Guangdong, China) weighs 760 g and measures 88 mm by 69 mm by 76 mm. It has a maximum detection range of 260 m with a ranging accuracy of 2.0 cm. It has a circular field of view (FOV) of 38.4° and can emit 100,000 laser pulses per second at a wavelength of 905 nm. The starNeto IMU (StarNeto Technology, Beijing, China) is used to provide the system position and acceleration measurements at a frequency of 200 Hz. The dynamic accuracy in both heading and position is 0.1° and the gyroscope bias stability and accelerometer bias stability are 6°/h and 0.01 mg, respectively. The dual GNSS antennas are used to track high-precision trajectory information using the real-time kinetic method. The long-range WiFi is used to remotely control the UAV lidar system and transfer the collected lidar data for real-time display. The microcomputer is used to control the UAV system and store the collected UAV lidar data. The integrated UAV lidar system can be mounted either on a rotary or fixed-wing UAV. Here, we used a DJI Matrice 210 UAV (DJI Technology, Shenzhen, Guangdong, China) since it has a relatively lower price and long flight time. The total cost of the UAV lidar system is comparable to that of current mainstream SfM systems.
The lever-arm offsets and boresight angles are two important parameters for resolving lidar point clouds from the raw lidar range measurements. Theoretically, the lever-arm offsets can be measured from the UAV lidar system design, and the boresight angles are specified by the laser scanner provider. However, these measurements usually have unavoidable errors and significantly influence the resolved lidar point clouds [32,33]. To minimize the influence of errors in level-arm offsets and boresight angles, we used a kinetic plane-based approach to calibrate the system. This method was originally proposed for airborne lidar systems [34,35] and has been recently shown that it can be used on UAV lidar systems recently [16,36]. Detailed descriptions of the calibration algorithm can be found in Guo et al. [16].

3. Performance Evaluation of the DJI Livox System
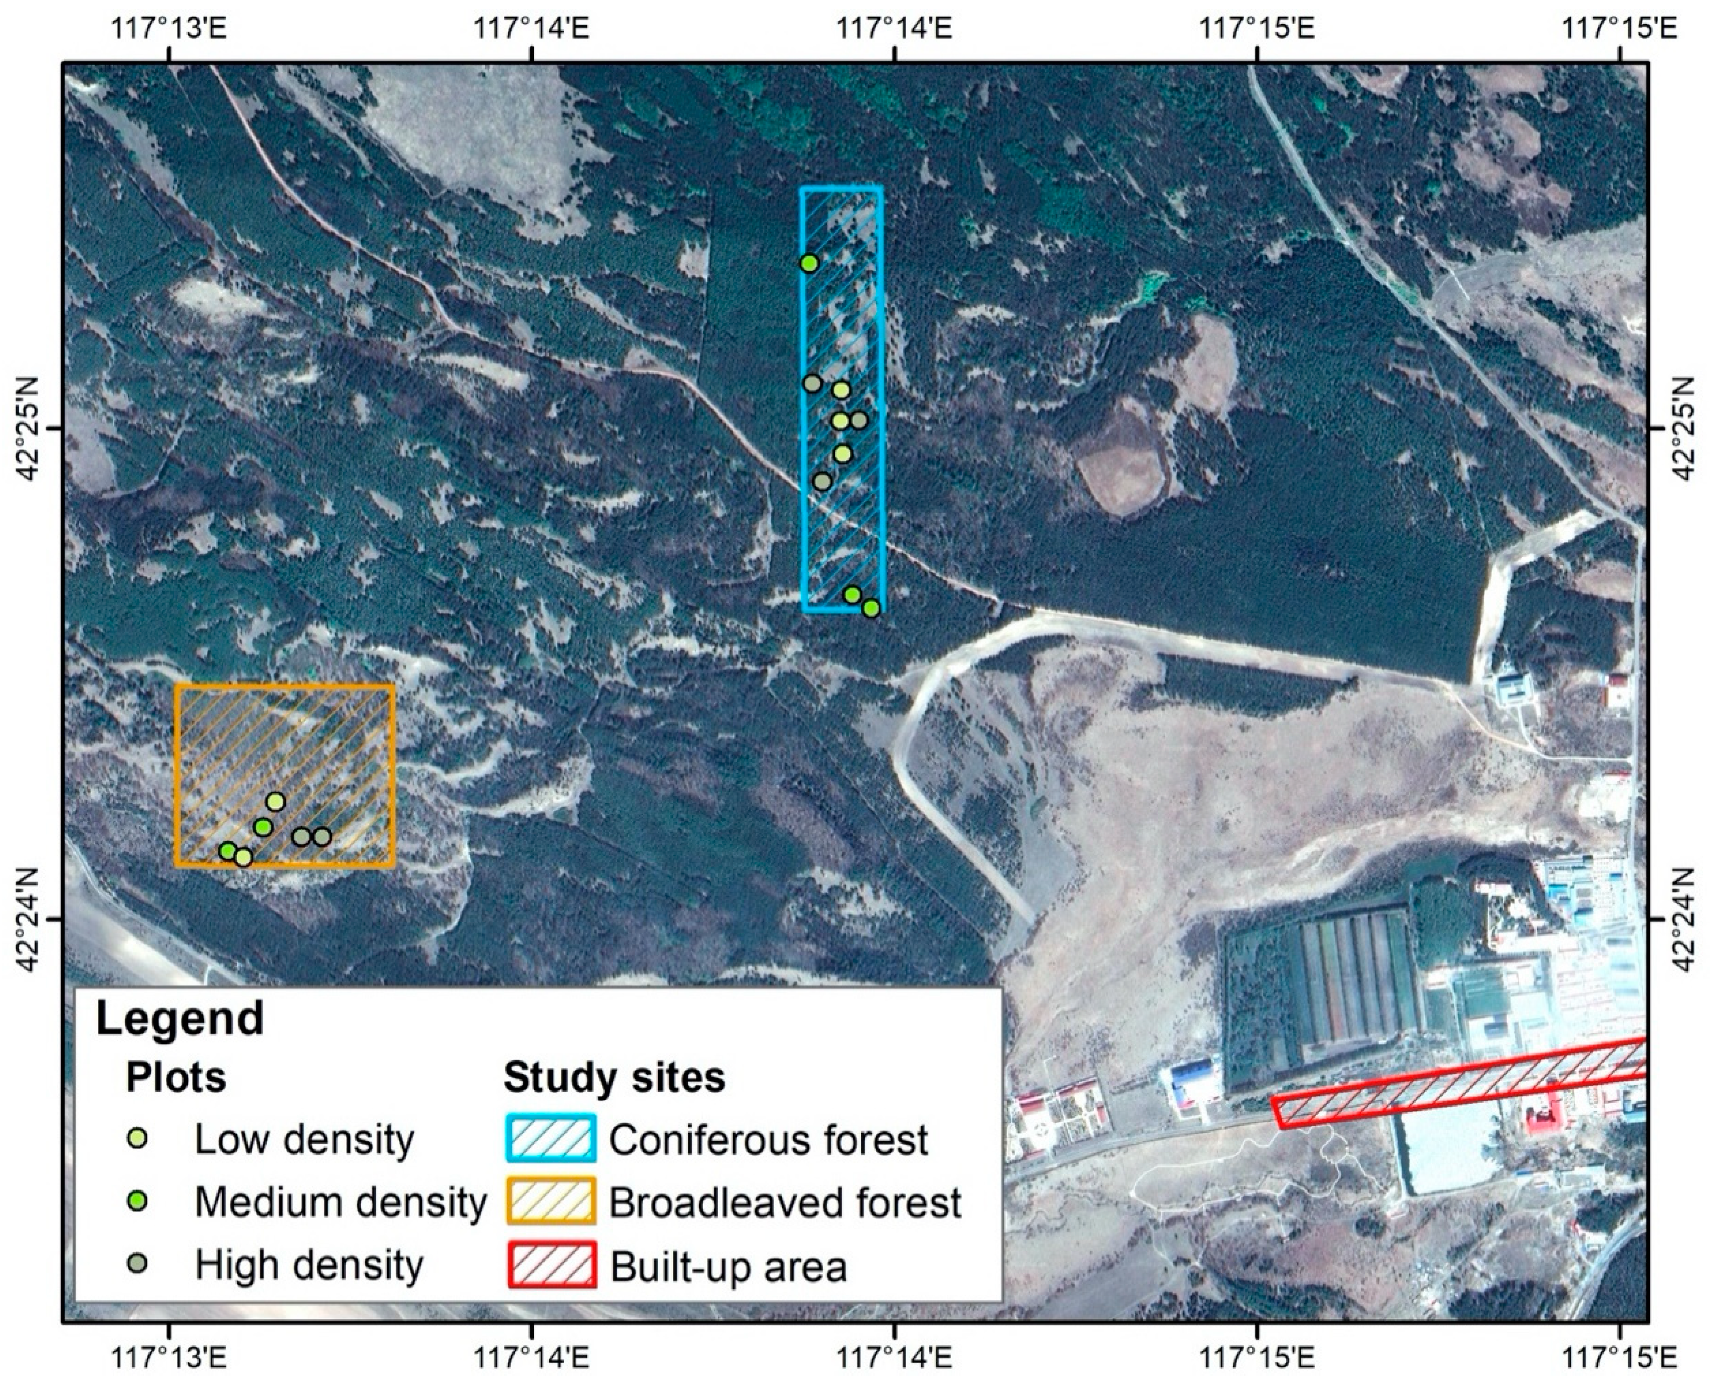
The performance of the developed very low-cost UAV lidar system was evaluated in both coniferous and broadleaved forests and was compared with four other UAV lidar systems equipped with a RIEGL VUX laser scanner (RIEGL Laser Measurement System GmbH, Horn, Austria), a RIEGL miniVUX laser scanner (RIEGL Laser Measurement System GmbH, Horn, Austria), a HESAI Pandar40 laser scanner (HESAI Technology, Shanghai, China), and a Velodyne Puck laser scanner (Velodyne Lidar, San Jose, CA, USA), respectively. A total of 52 flight-speed and flight-height combinations were used to collect data from these UAV lidar systems. Four forest inventory attributes, including individual tree height, canopy cover, gap fraction, and leaf area index (LAI), were calculated from each collected dataset to provide a comprehensive understanding of the capability of each UAV lidar system in estimating forest inventory attributes. Details of data acquisition, data processing, and accuracy assessment are described below.

3.1. Study Area

The experiment was conducted in the Saihanba National Forest Park, Hebei Province, China (42°24′43.7″ N 117°14′46.4″ E). Two study sites with different forest types (i.e., a planted coniferous forest and a broadleaved forest) were selected within the study area to evaluate the performance of the developed very low-cost UAV lidar system in forest inventory applications (Figure 2). The coniferous forest site is about 16 ha in size (200 m by 800 m) with a relatively flat terrain at ~1500 m ASL (above sea level). The dominant tree species are Mongolian Scots pine (Pinus sylvestris var. mongolica) and larch (Larix gmelinii var. principis-rupprechtii). The average canopy cover of the coniferous site is 67%, the average tree height is about 15 m, and the tree density ranges from 512 stems/ha to 1152 stems/ha. The broadleaved forest site is 13 ha in size (400 m × 330 m). Its dominant tree species is white birch (Betula platyphylla). The average canopy cover is 63%, and the average tree height is about 9 m. The tree density in the broadleaved site is higher, ranging from 496 stems/ha to 2256 stems/ha.

3.2. Data Collection

3.2.1. Field Data

A total of fifteen square plots (25 m by 25 m) were chosen in the two study sites to evaluate the accuracy of the extracted individual tree heights from UAV lidar data; nine plots were in the coniferous site, and six were in the broadleaved site (Figure 2). These plots were designed with different tree densities to gain a comprehensive understanding of the capability of the developed UAV lidar system in estimating individual tree attributes (Figure 2). The location, DBH, and height of each individual tree with a DBH > 2 cm were recorded in August and September 2019. Tree location was measured by a real-time kinetic global positioning system unit from Huace Navigation Technology Ltd. (Shanghai, China), tree height was measured by a Haglof laser rangefinder (Haglöf Sweden, Långsele, Västernorrland, Sverige), and DBH was measured with a diameter tape. Detailed information on tree attribute statistics from plots in each tree density group is provided in Table 2.

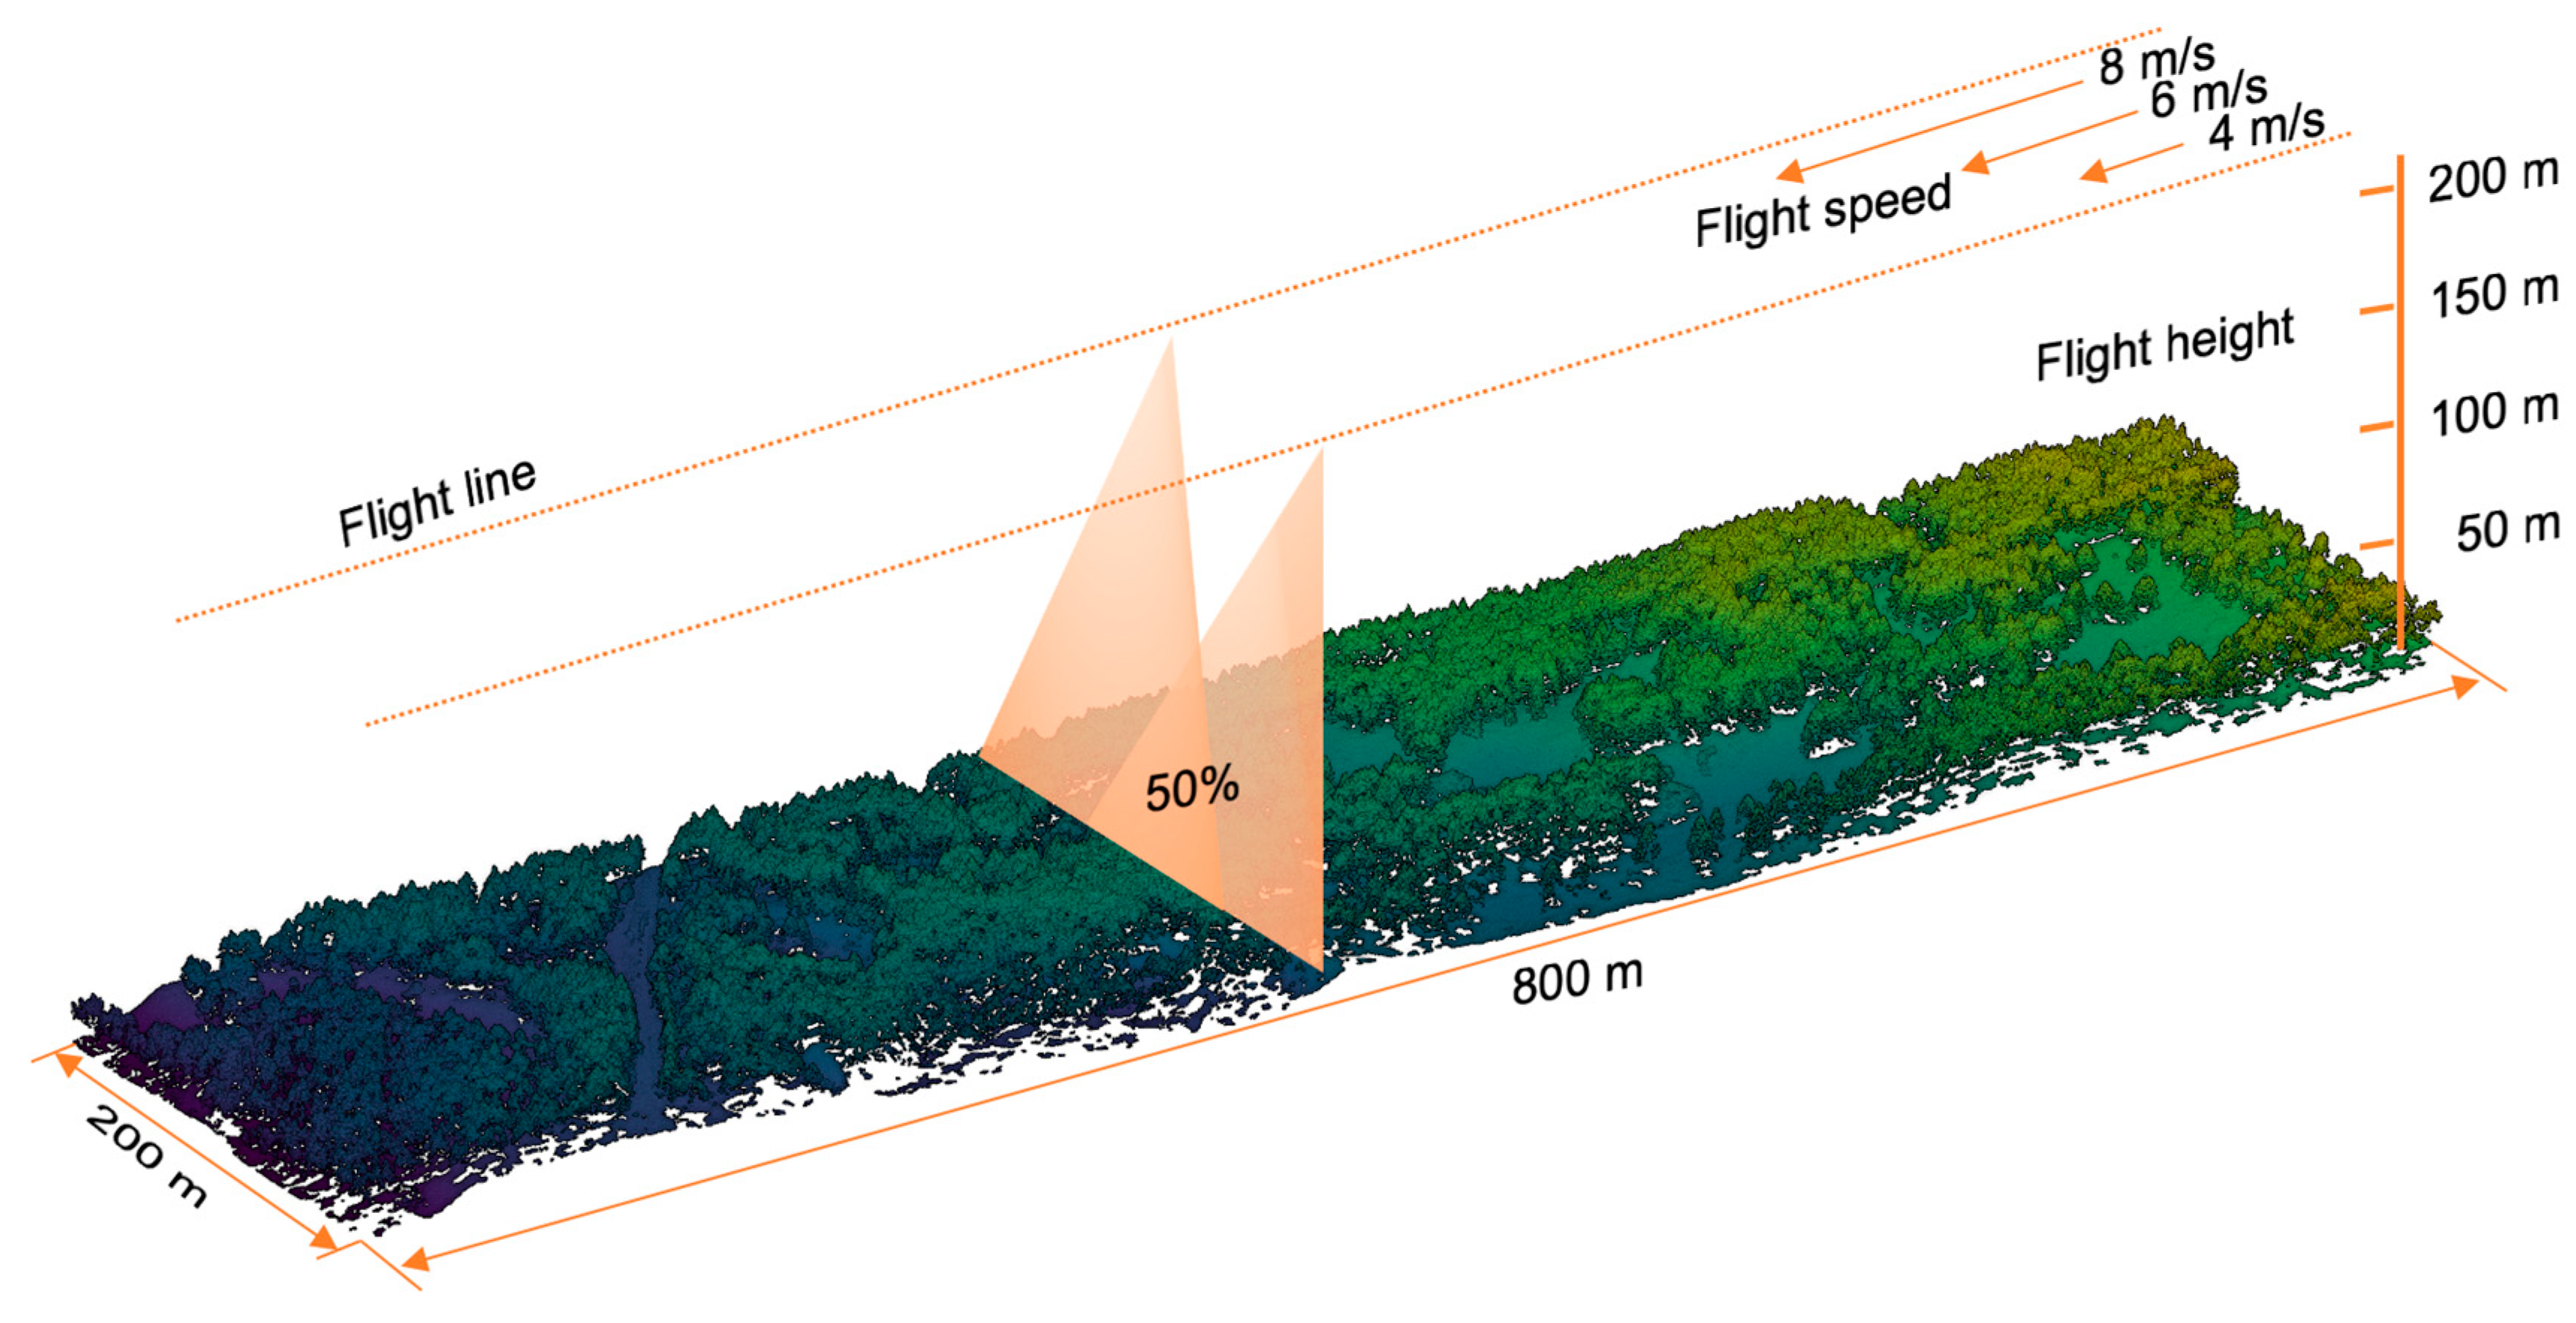
3.2.2. UAV Lidar Data Acquisition

The quality of UAV lidar data usually varies with flight speed and flight height. To get a comprehensive understanding of the capability of the developed low-cost UAV lidar system, different flight height and flight speed combinations were used to collect DJI Livox data. In the coniferous site, nine UAV flights with three flight speeds (i.e., 4 m/s, 6 m/s, and 8 m/s) and four flight heights (i.e., 100 m, 150 m, and 200 m) combinations were conducted (Figure 3). Each flight had the same lateral overlap ratio (50%). The scan frequency was set to the maximum measurement of the lidar sensor (100 Hz). After careful examination, the flight height (150 m) and flight speed (6 m/s) combination that could balance both data quality and data collection efficiency was selected to collect data in the broadleaved site.
To systematically understand the capability of the DJI Livox scanner on forest inventory applications, the Greenvalley International LiAir UAV lidar series equipped with four other laser scanners (i.e., RIEGL VUX, RIEGL miniVUX, HESAI Pandar40 and Velodyne Puck) were used here to collect data as well. At the coniferous site, the flight specifications were set similarly to the DJI Livox scanner. The flight speeds varied from 4 m/s to 8 m/s with an interval of 2 m/s; the flight heights were changed from 50 m to 200 m with an interval of 50 m, except in the case of the Velodyne Puck. Because the Velodyne Puck has a maximum ranging distance of 100 m and only captures incomplete information at the maximum ranging distance, its flight heights were set to 50 m and 75 m (Table 3). In the broadleaved site, the flight specifications of all laser scanners were identical to those of the DJI Livox scanner, except in the case of the Velodyne Puck scanner. Its flight height was set to 75 m instead of 150 m considering its limited ranging capability (Table 3). In total, 51 UAV flights were conducted in the two study sites to collect UAV lidar data from RIEGL VUX, RIEGL miniVUX, HESAI Pandar40, and Velodyne Puck scanners for comparison. The flight overlap ratio was set to 50% for each UAV flight.
Besides the data collection in the two forested study sites, the developed DJI Livox system was also used to collect data in a built-up area to evaluate the horizontal and vertical positioning accuracy of the system. The built-up site was 7.5 ha in size (1000 m by 75 m), and the UAV lidar data was collected at a flight height of 150 m and a flight speed of 6 m/s. The flight path overlap ratio was set to 50% as well. A total of 34 landmarks that could be recognized in the lidar point cloud were identified, including 24 crosswalk lines and 10 building corners. The lengths of the crosswalk lines and heights of building corners were measured in the field with tapes or rangefinders.

3.3. Lidar Data Preprocessing

All UAV lidar measurements were preprocessed using the same procedures, which included point cloud georeferencing, strip alignment, denoising, filtering, and normalization. The raw range measurements were combined with the IMU and GNSS measurements to generate georeferenced point clouds using the LiAquire software [16] and then the flight alignment tool in the LiDAR360 software was used to reduce the misalignment errors between flight lines. The adjusted point clouds of each UAV flight were denoised using a statistical approach that identified outliers by determining whether the distance between a point and its k neighboring points was larger than a threshold avg. + std. (where avg. and std. represent the average and standard deviation of distances between points and their k neighboring points) [37]. Ground points were extracted from the denoised point clouds using an improved progressive triangulated irregular network densification filtering algorithm proposed by Zhao et al. (2016). The ground returns of each UAV flight were interpolated into digital elevation models (DEMs) at a resolution of 0.5 m using the ordinary kriging method [38]. The lidar first returns were interpolated into digital surface models (DSMs) using the same approach. Finally, we normalized the point clouds of each UAV flight by subtracting the DEM value from the lidar point height.

3.4. Forest Inventory Attributes Extraction

Forest inventory attributes at two levels—individual tree level and plot level—were extracted from the DJI Livox data. At the individual tree level, we first segmented individual trees from the normalized points using point cloud-based methods. A top-down point cloud-based method proposed by Li et al. [39] was used in the coniferous forest site, and a bottom-up point cloud-based method proposed by Lu et al. [40] was used in the broadleaved forest site following the suggestions from Yang et al. [41]. The automatic segmentation results were visually examined and manually corrected to ensure a complete understanding of the capability of the DJI Livox system for forest inventory applications. Individual tree heights were then estimated as the difference between the highest and lowest points of each tree. At the plot level, canopy cover, gap fraction, and LAI were estimated at a spatial resolution of 5 m. Canopy cover was calculated from the first returns and single returns [42] according to Equation (1):
C C = F c a n o p y + S c a n o p y F t o t a l + S t o t a l ,
where CC represents canopy cover, F c a n o p y and S c a n o p y represent the first returns and single returns, and F t o t a l and S t o t a l represent the total first returns and single returns in the region of calculation. The calculation of LAI was based on the Beer–Lambert law following the equation provided by Richardson et al. [43]:
L A I = cos ( θ ) 0.5 × ln ( G F ) ,
G P = N g r o u n d N t o t a l ,
where θ represents the mean LiDAR scanning angle and G P represents the gap fraction, which was calculated as the ratio of ground points ( N g r o u n d ) and total points ( N t o t a l ). A height threshold of 2 m was used for calculating these forest attributes to remove the influence of understory vegetation [44].

3.5. Evaluation of the DJI Livox System

3.5.1. Lidar Data Quality Assessment

The quality of the data collected by the DJI Livox system was assessed in three aspects: Precision, relative positioning accuracy, and point density. Precision was evaluated by a point-to-plane normal distance method using the data collected over the built-up area [45]. Points of 11 planar objects (including nine horizontal building rooftops and two vertical building facades) were first visually identified from the field and manually cut out from the DJI Livox data, and then a plane was fitted from points belonging to each object using the least-squares fitting method. The normal distance of each point to its corresponding fitted plane was calculated, and the horizontal and vertical precisions were evaluated by calculating the mean and standard deviation of all horizontal or vertical distance residuals. The relative positioning accuracy was evaluated by the 34 field-measured landmarks. The differences between the horizontal or vertical height measured from the point clouds and field measurements were first calculated and the mean and standard deviation of the horizontal and vertical biases were used as the representation of the horizontal and vertical accuracies. Additionally, the point density and ground point density at each flight height and flight speed combination from the DJI Livox system were calculated at the 20 field plots and randomly selected canopy vertical profiles were drawn to evaluate its performance in depicting forest canopies.

3.5.2. Accuracy Assessment of Individual Tree Attributes

The accuracy of individual tree heights estimated from the DJI Livox system was assessed by comparison with field tree height measurements. The location of each field-measured tree height was matched with lidar-derived individual trees using the recorded tree location, and manual registration was involved if there were difficulties in matching them following the guidance from Guan et al. [46]. Two statistical measurements, i.e., coefficient of determination (R2) and root mean square error (RMSE), were calculated separately for plots with different tree densities in each forest site, following Equations (4) and (5):
R 2 = 1 i = 1 n ( x i x ^ i ) 2 i = 1 n ( x i x ¯ ) 2 ,
R M S E = i = 1 n ( x i x ^ i ) 2 n ,
where x i is a reference observation, x ^ i is a predicted observation from UAV lidar data, x ¯ is the average of all reference observations, and n is the number of reference observations.

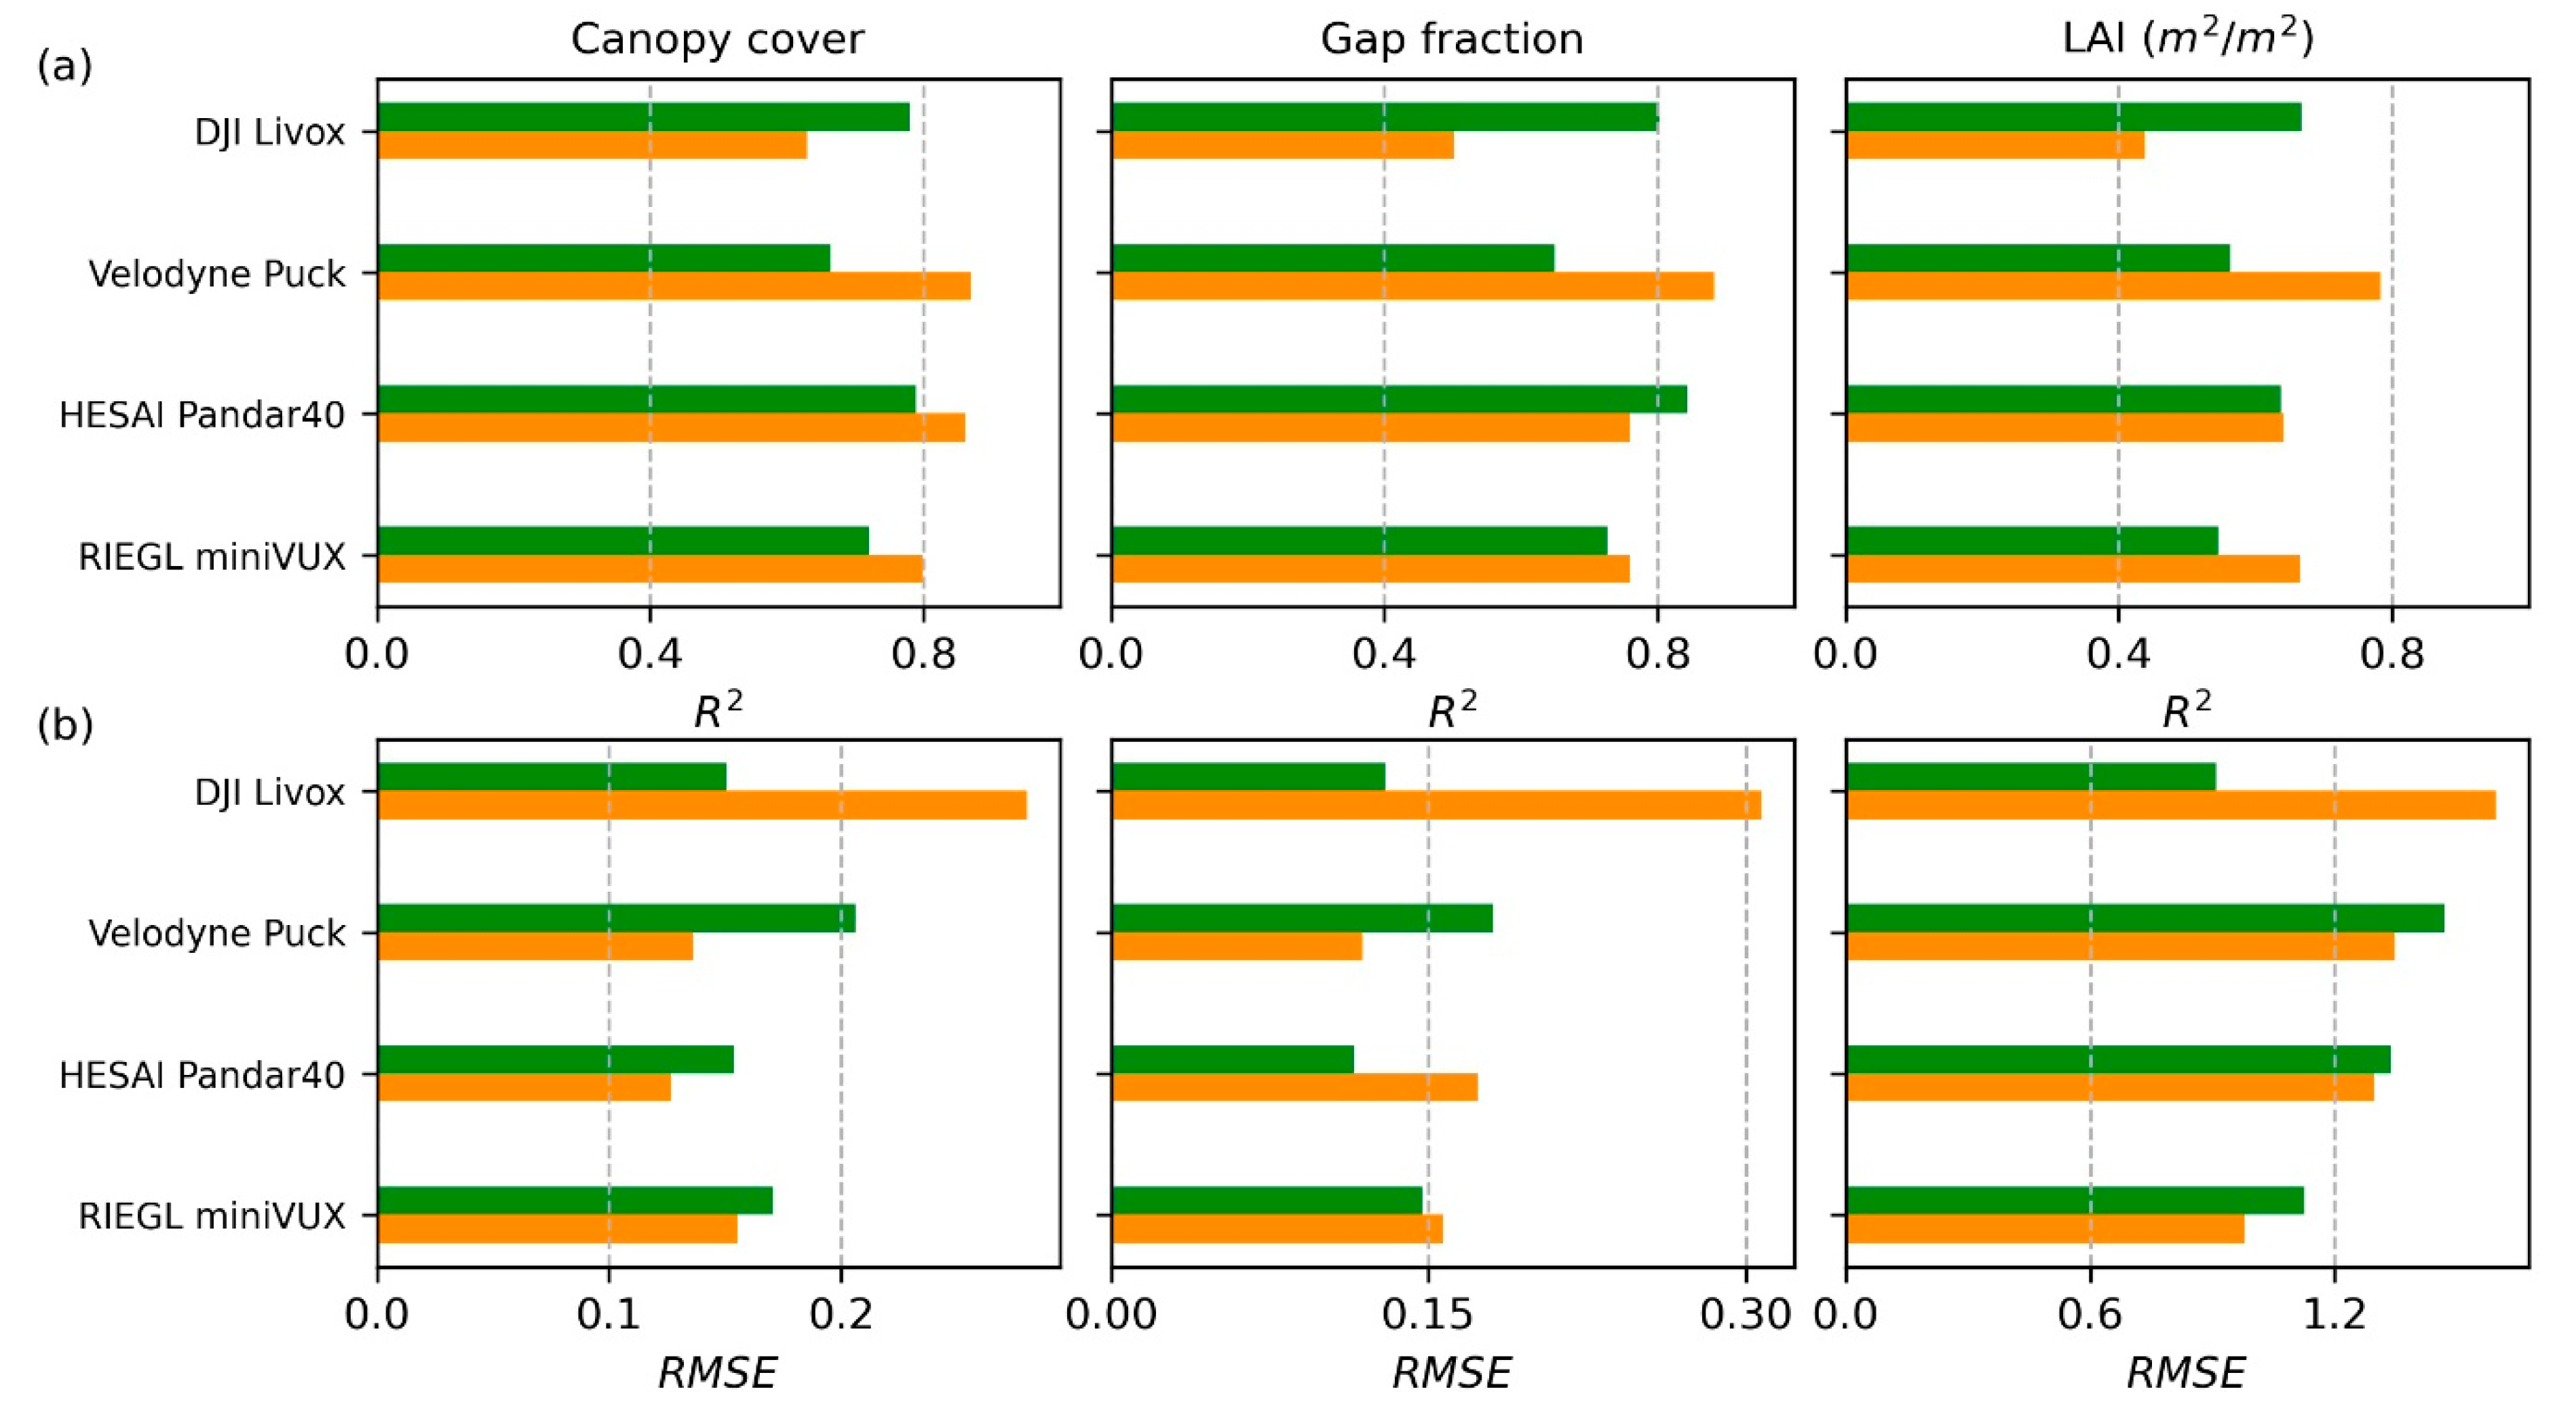
3.5.3. Comparisons with Four Other UAV Lidar Systems

The data quality and estimated forest inventory attributes were further compared with four other UAV lidar systems. In the data quality comparison, point densities and ground point densities of each flight height and flight speed combination from the five UAV lidar systems were calculated. Randomly selected canopy profiles were also drawn for comparing their capability in depicting canopy vertical structure. Besides the data quality assessment, we also compared their accuracies in estimating individual tree heights and plot-level forest inventory attributes. Because we did not have field measurements for plot-level forest inventory attributes, we used the RIEGL VUX as the reference for the accuracy comparison, because the RIEGL VUX has been reported to outperform other light-weighted laser scanners in deriving forest attributes at the plot level [47,48,49]. The individual tree-height estimates and plot-level forest inventory attributes from the other four laser scanners were derived following the same procedure as for the DJI Livox data. Moreover, because there were multiple flight height and speed combinations in the coniferous site, we only used the combination of 100 m flight height and 6 m/s flight speed for the RIEGL VUX, RIEGL miniVUX, and HESAI Pandar40 and the combination of 75 m flight height and 6 m/s flight speed for the Velodyne Puck to estimate individual inventory attributes. As the plot-level forest inventory attributes from the reference RIEGL VUX data, we used the flight combination of 50 m flight height and 4 m/s flight speed, since it can generate the most complete forest canopy information.

4. Results

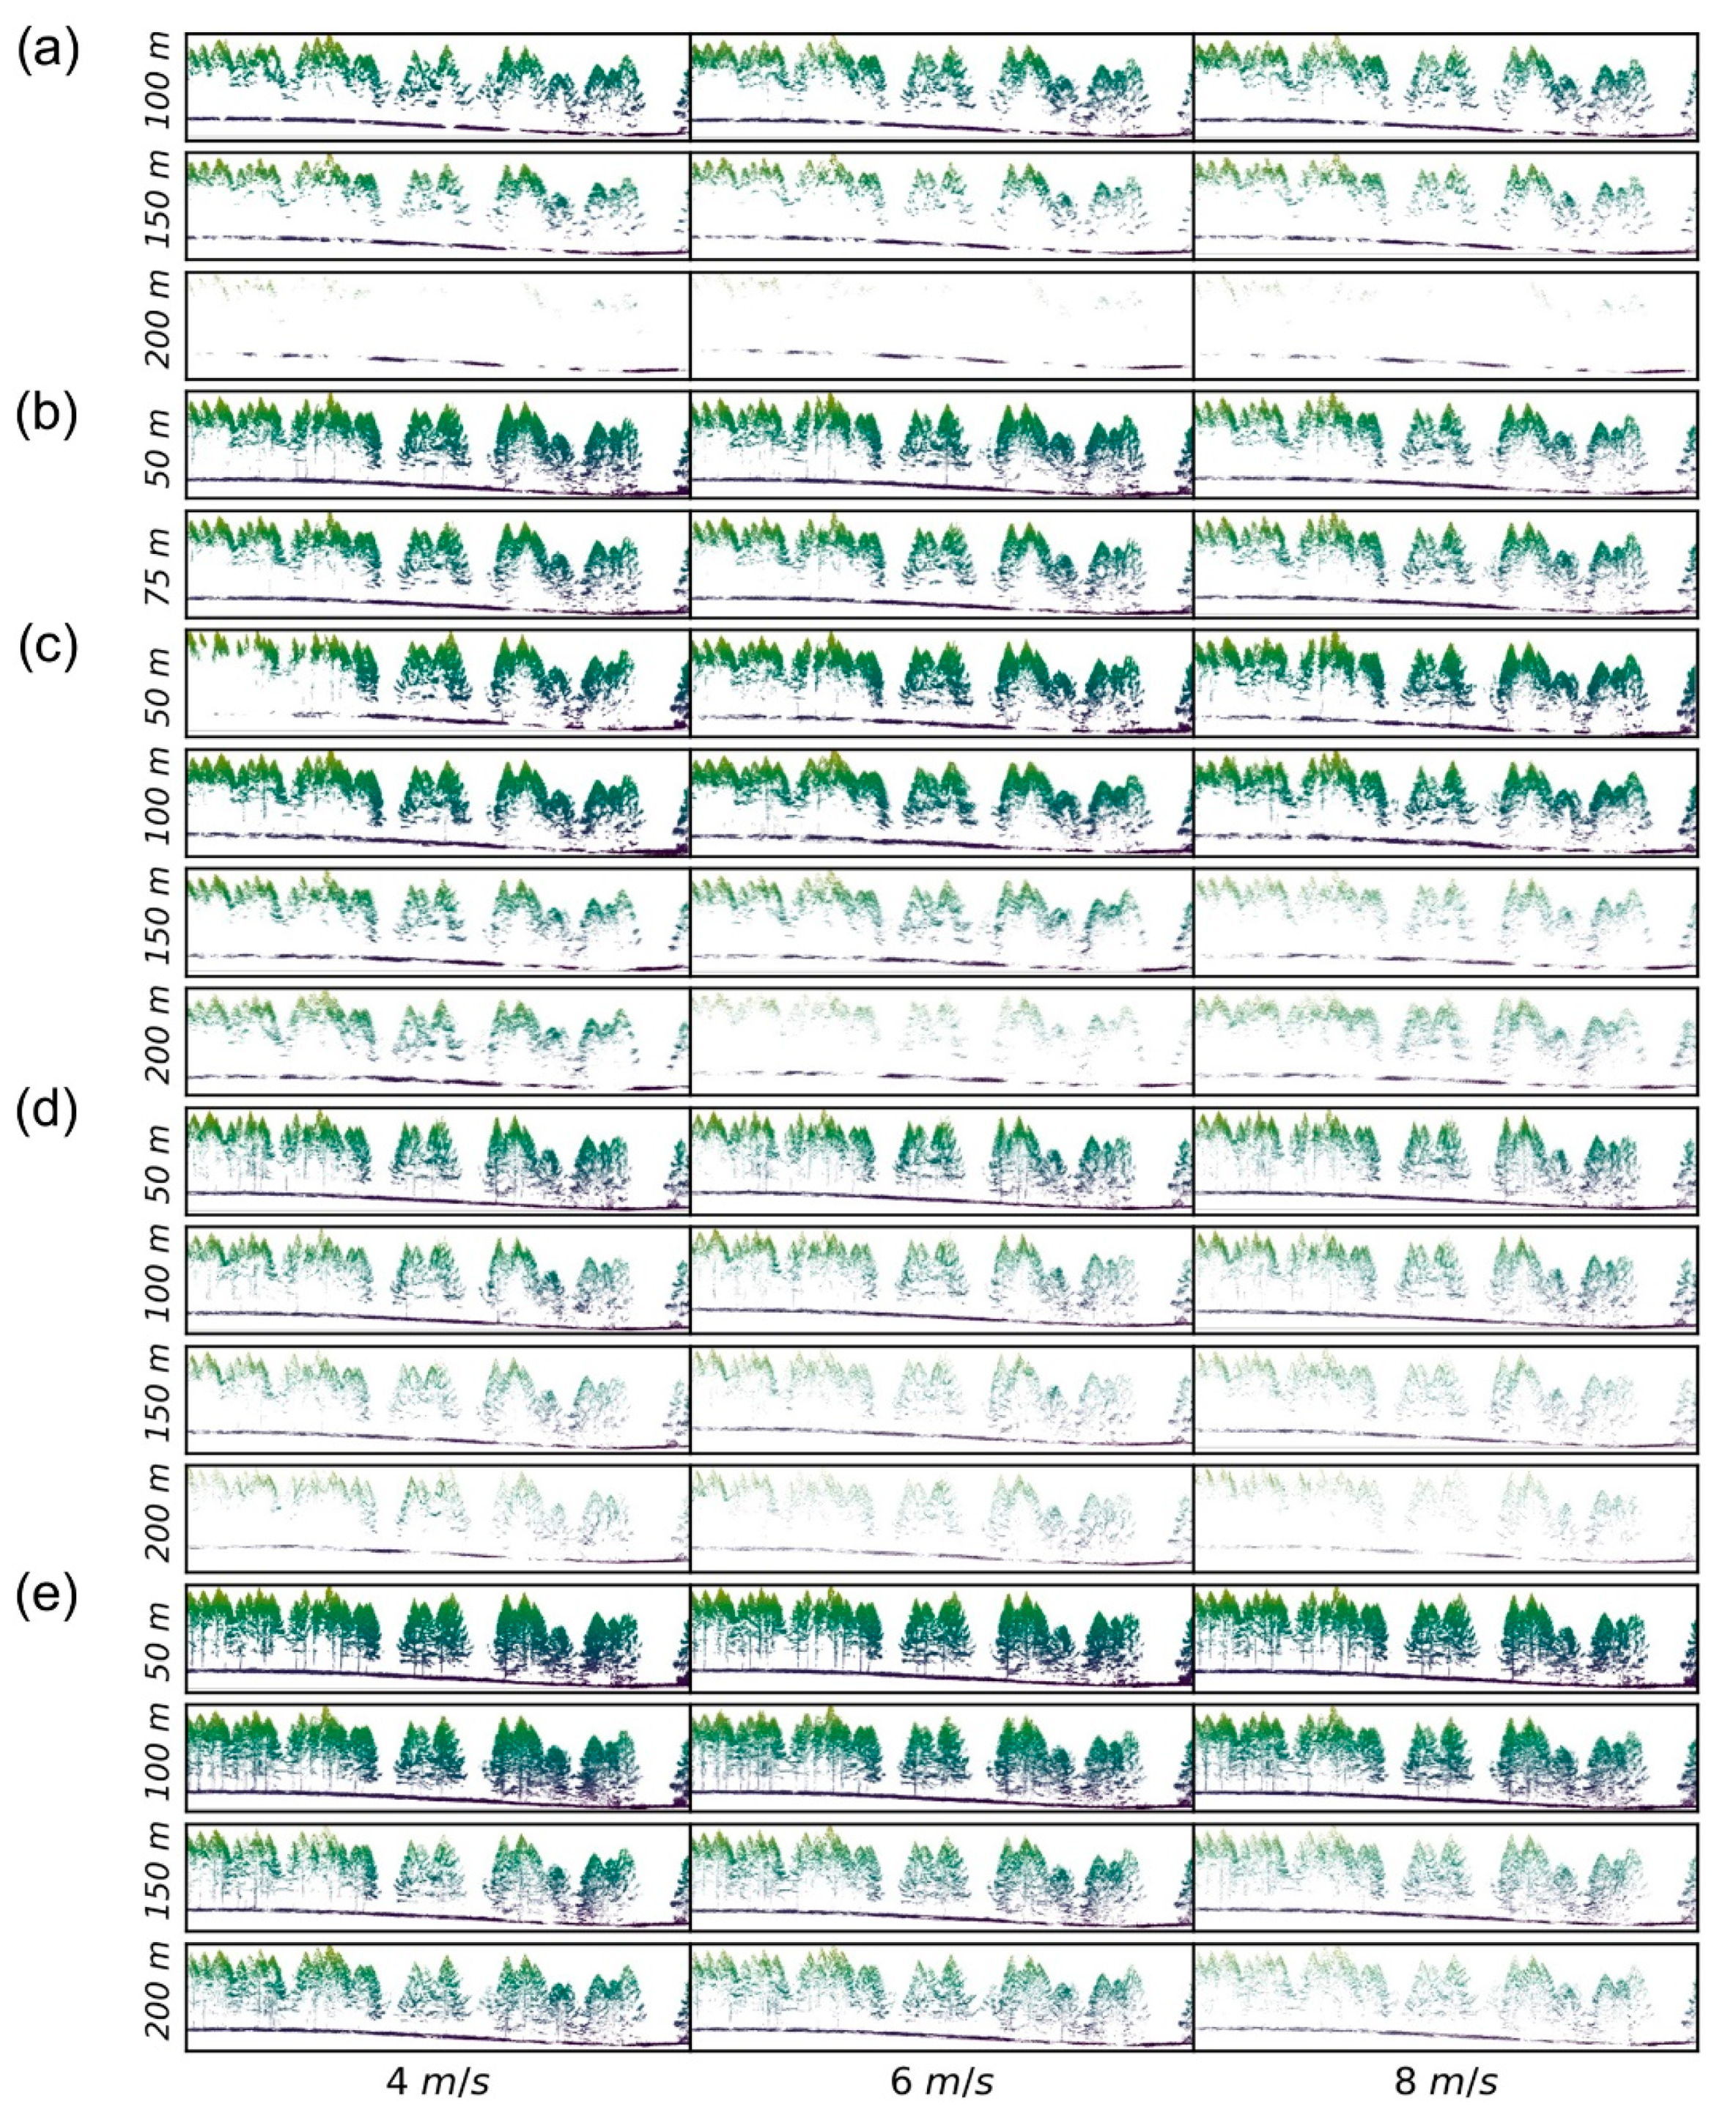
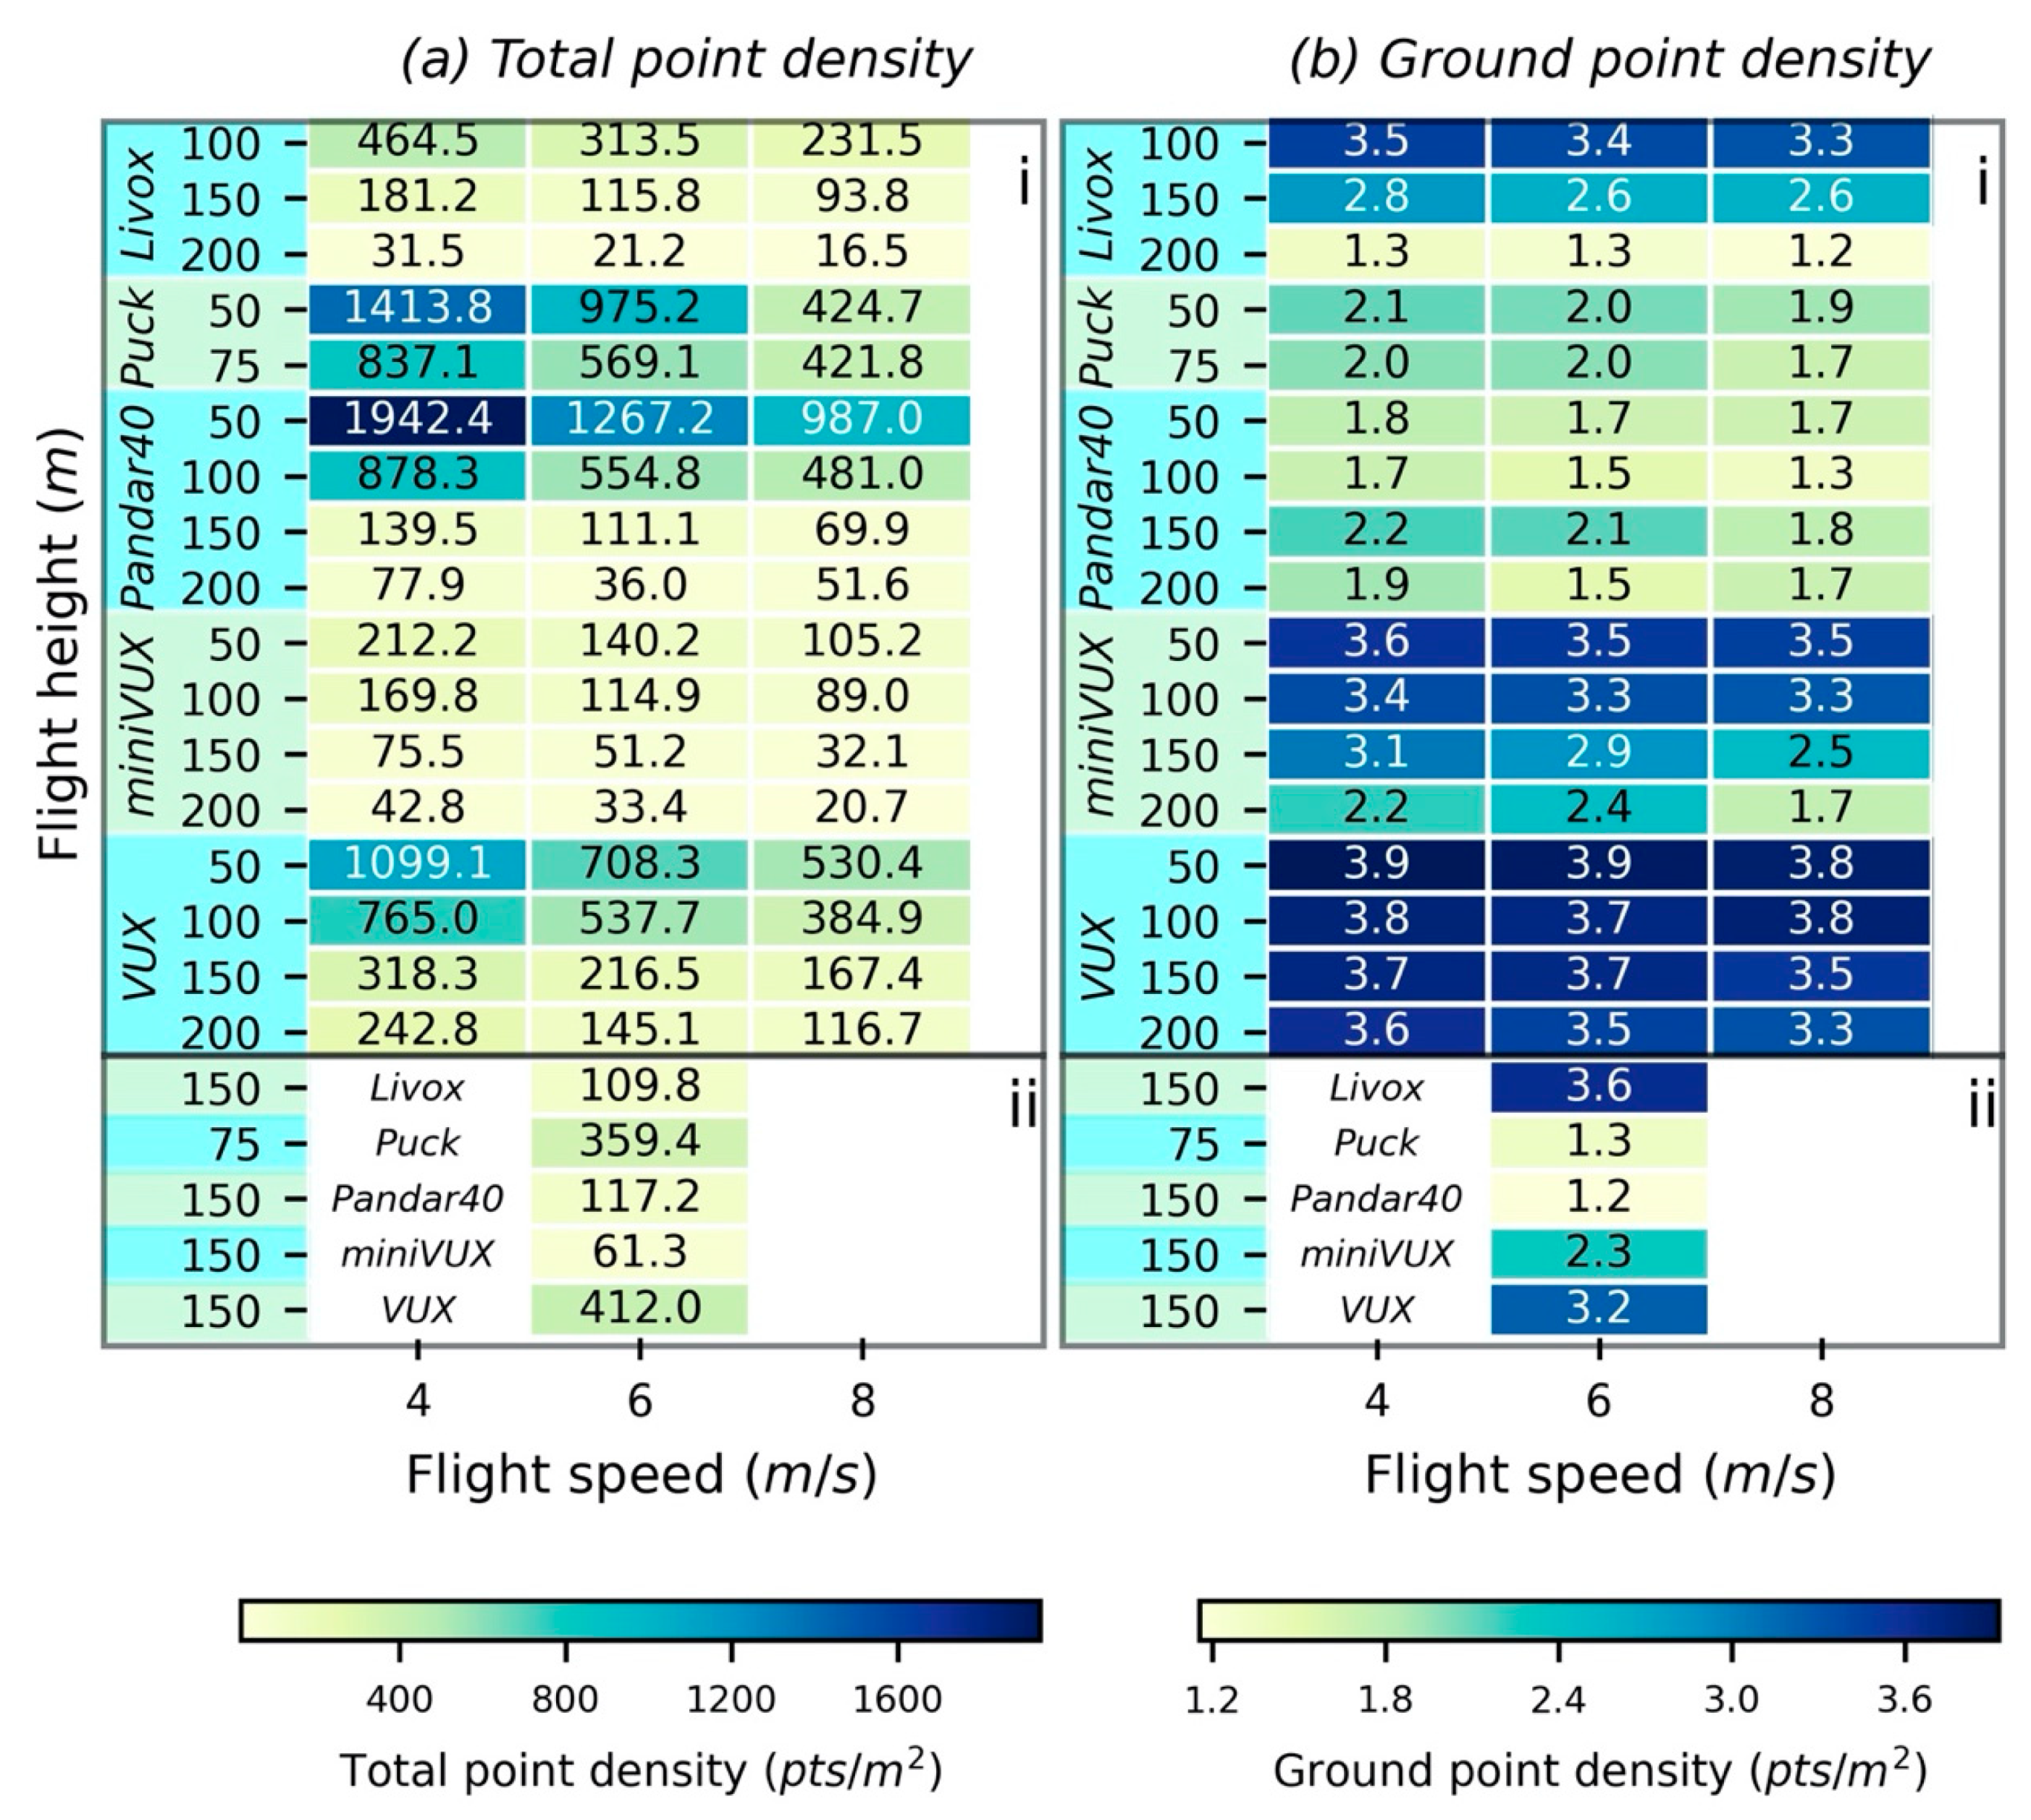
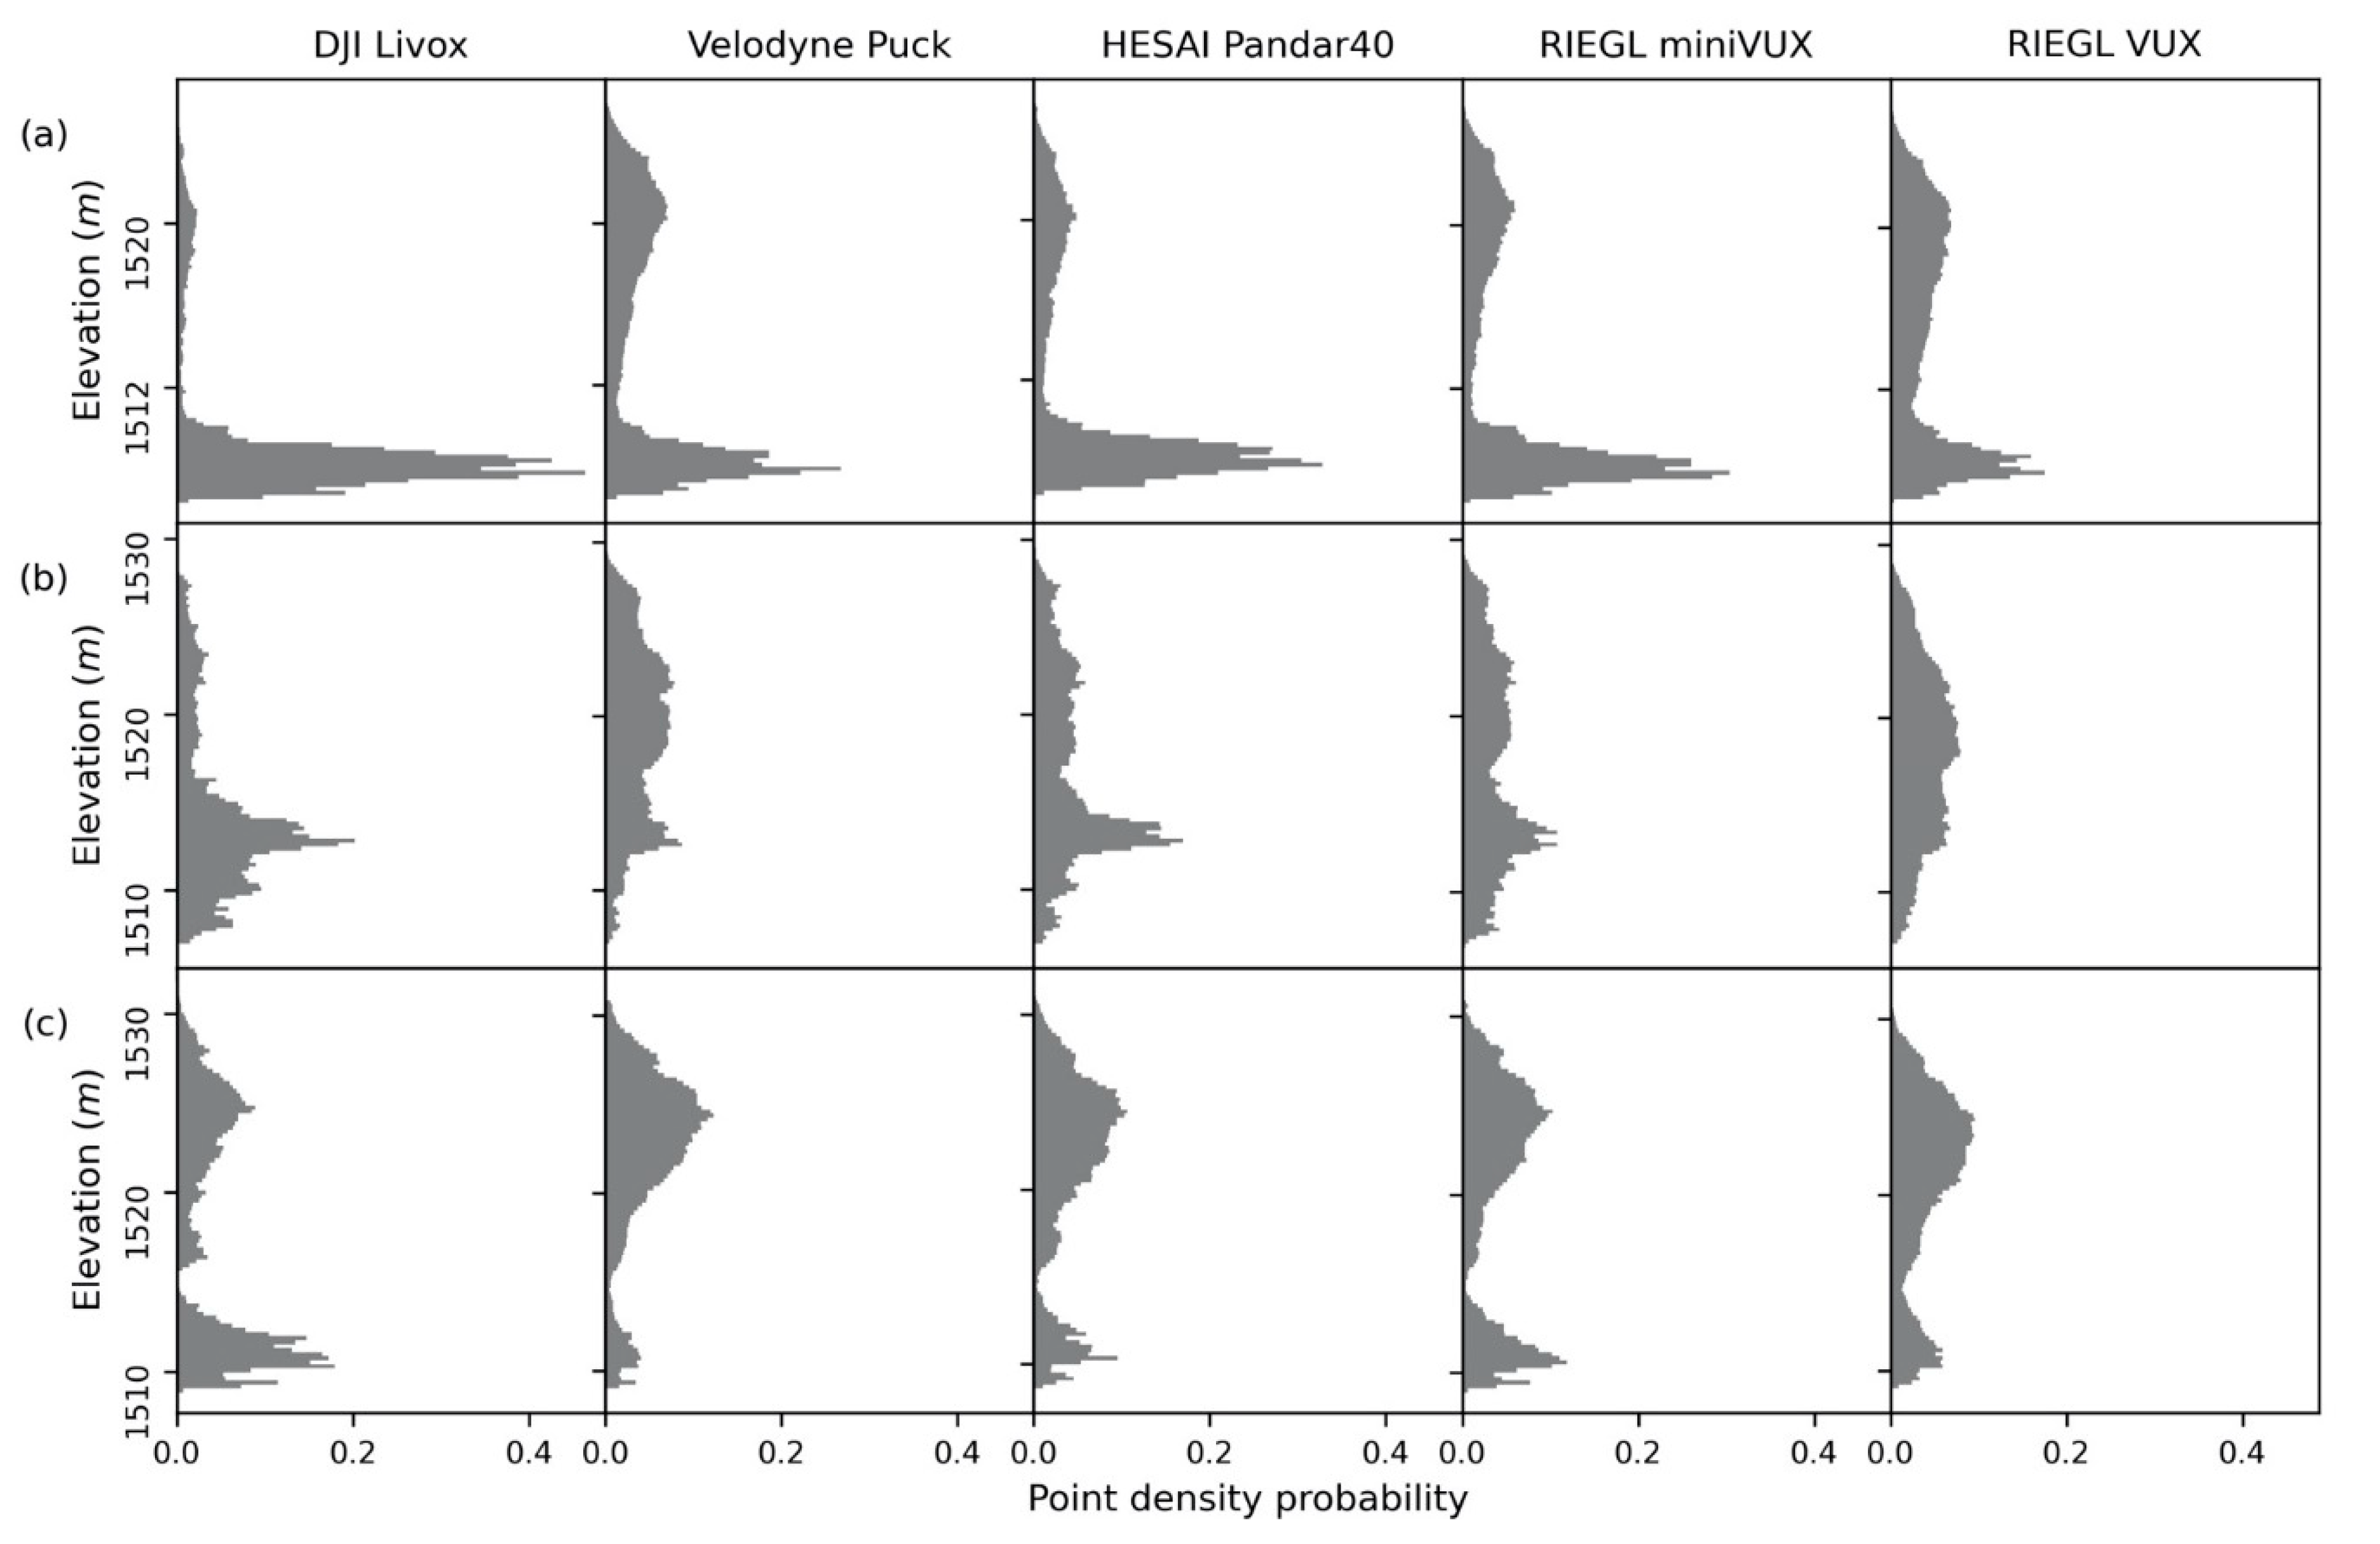
4.1. Data Quality Assessment

We evaluated the horizontal and vertical precisions and relative horizontal and vertical accuracies of the developed DJI Livox system at the built-up site. The horizontal and vertical precisions of the developed DJI Livox system were all lower than 5 cm, and the vertical precision tended to be lower than the horizontal precision (with a higher mean bias and standard deviation of bias) (Table 4). The relative horizontal and vertical errors were around three to four times higher than the horizontal and vertical precisions, and the relative vertical accuracy was lower than the relative horizontal accuracy as well (Table 4).
In the coniferous site, the developed DJI Livox system can capture the 3D forest structures and terrain information at the flight height of 100 m (Figure 4a). As the flight height and speed increased, the completeness of the forest canopy and terrain information decreased. However, flight height had a greater influence on the quality of the acquired DJI Livox data. At the flight height of 200 m, nearly no canopy information was captured, although the terrain information was still well preserved (Figure 4a). Compared with the other four UAV lidar systems, the DJI Livox system had a similar data quality performance as the HESAI Pandar40, Velodyne Puck, and RIEGL miniVUX systems, although the RIEGL miniVUX acquired more canopy internal information (Figure 4b–d). At the flight height of 200 m, the RIEGL miniVUX and HESAI Pandar40 captured much more canopy information than the DJI Livox, although they had similar nominal ranging capabilities (Figure 4c,d). Among the five UAV lidar systems, the RIEGL VUX had the best performances across all flight height and flight speed combinations (Figure 4e). It could even capture the tree stem information at all three flight speeds at flight heights below 100 m, and the obtained canopy information was influenced the least by flight height (Figure 4e).
At the broadleaved site, the DJI Livox system captured much less canopy internal information than at the coniferous site. Most canopy points from the DJI Livox system were at the canopy surface (Figure 5a). Although it captured terrain information well, canopy internal information was largely missing (Figure 5a). The performance of Velodyne Puck was very similar to that of DJI Livox in capturing canopy information but it missed a large proportion of terrain information (Figure 5b). HESAI Pandar40 and RIEGL miniVUX had similar performances that captured more canopy internal information than the DJI Livox and Velodyne Puck (Figure 5a–d). The RIEGL VUX outperformed all other UAV lidar systems and clearly depicted the canopy internal information and the terrain surface (Figure 5e).
The data quality of the developed DJI Livox system was further evaluated by the total point density and ground point density. In the coniferous site, the DJI Livox system generated a total point density comparable to the RIEGL miniVUX system, which was much less than the Velodyne Puck, HESAI Pandar40, and RIEGL VUX systems (Figure 6a). The increase of flight height and flight speed significantly reduced the total point density. The total point density of DJI Livox, Velodyne Puck, and HESAI Pandar40 decreased by over 90% with the increase in flight height, and by over 50% with the increase in flight speed (Figure 6a). In comparison, flight height and flight speed had a much smaller influence on the two REIGL systems (Figure 6a). In terms of ground point density, the developed DJI Livox system performed comparably to the REIGL VUX and REIGL miniVUX systems at the flight height of 100 m, returning a density that was around 1.5 to 2 times higher than that of the HESAI Pandar40 and Velodyne Puck systems (Figure 6b). With the increase of flight height and flight speed, the two REIGL systems maintained a high ground point density, while the ground point density of the DJI Livox system decreased by 62% (Figure 6b). In the broadleaved site, the DJI Livox system obtained a total point density over 100 pts/m2, which was comparable to the HESAI Pandar40 and REIGL miniVUX systems but much lower than the Velodyne Puck and REIGL VUX systems (Figure 6a). The ground point density of the DJI Livox system was the highest in the broadleaved site, followed by the REIGL VUX, REIGL miniVUX, Velodyne Puck, and HESAI Pandar40 (Figure 6b).

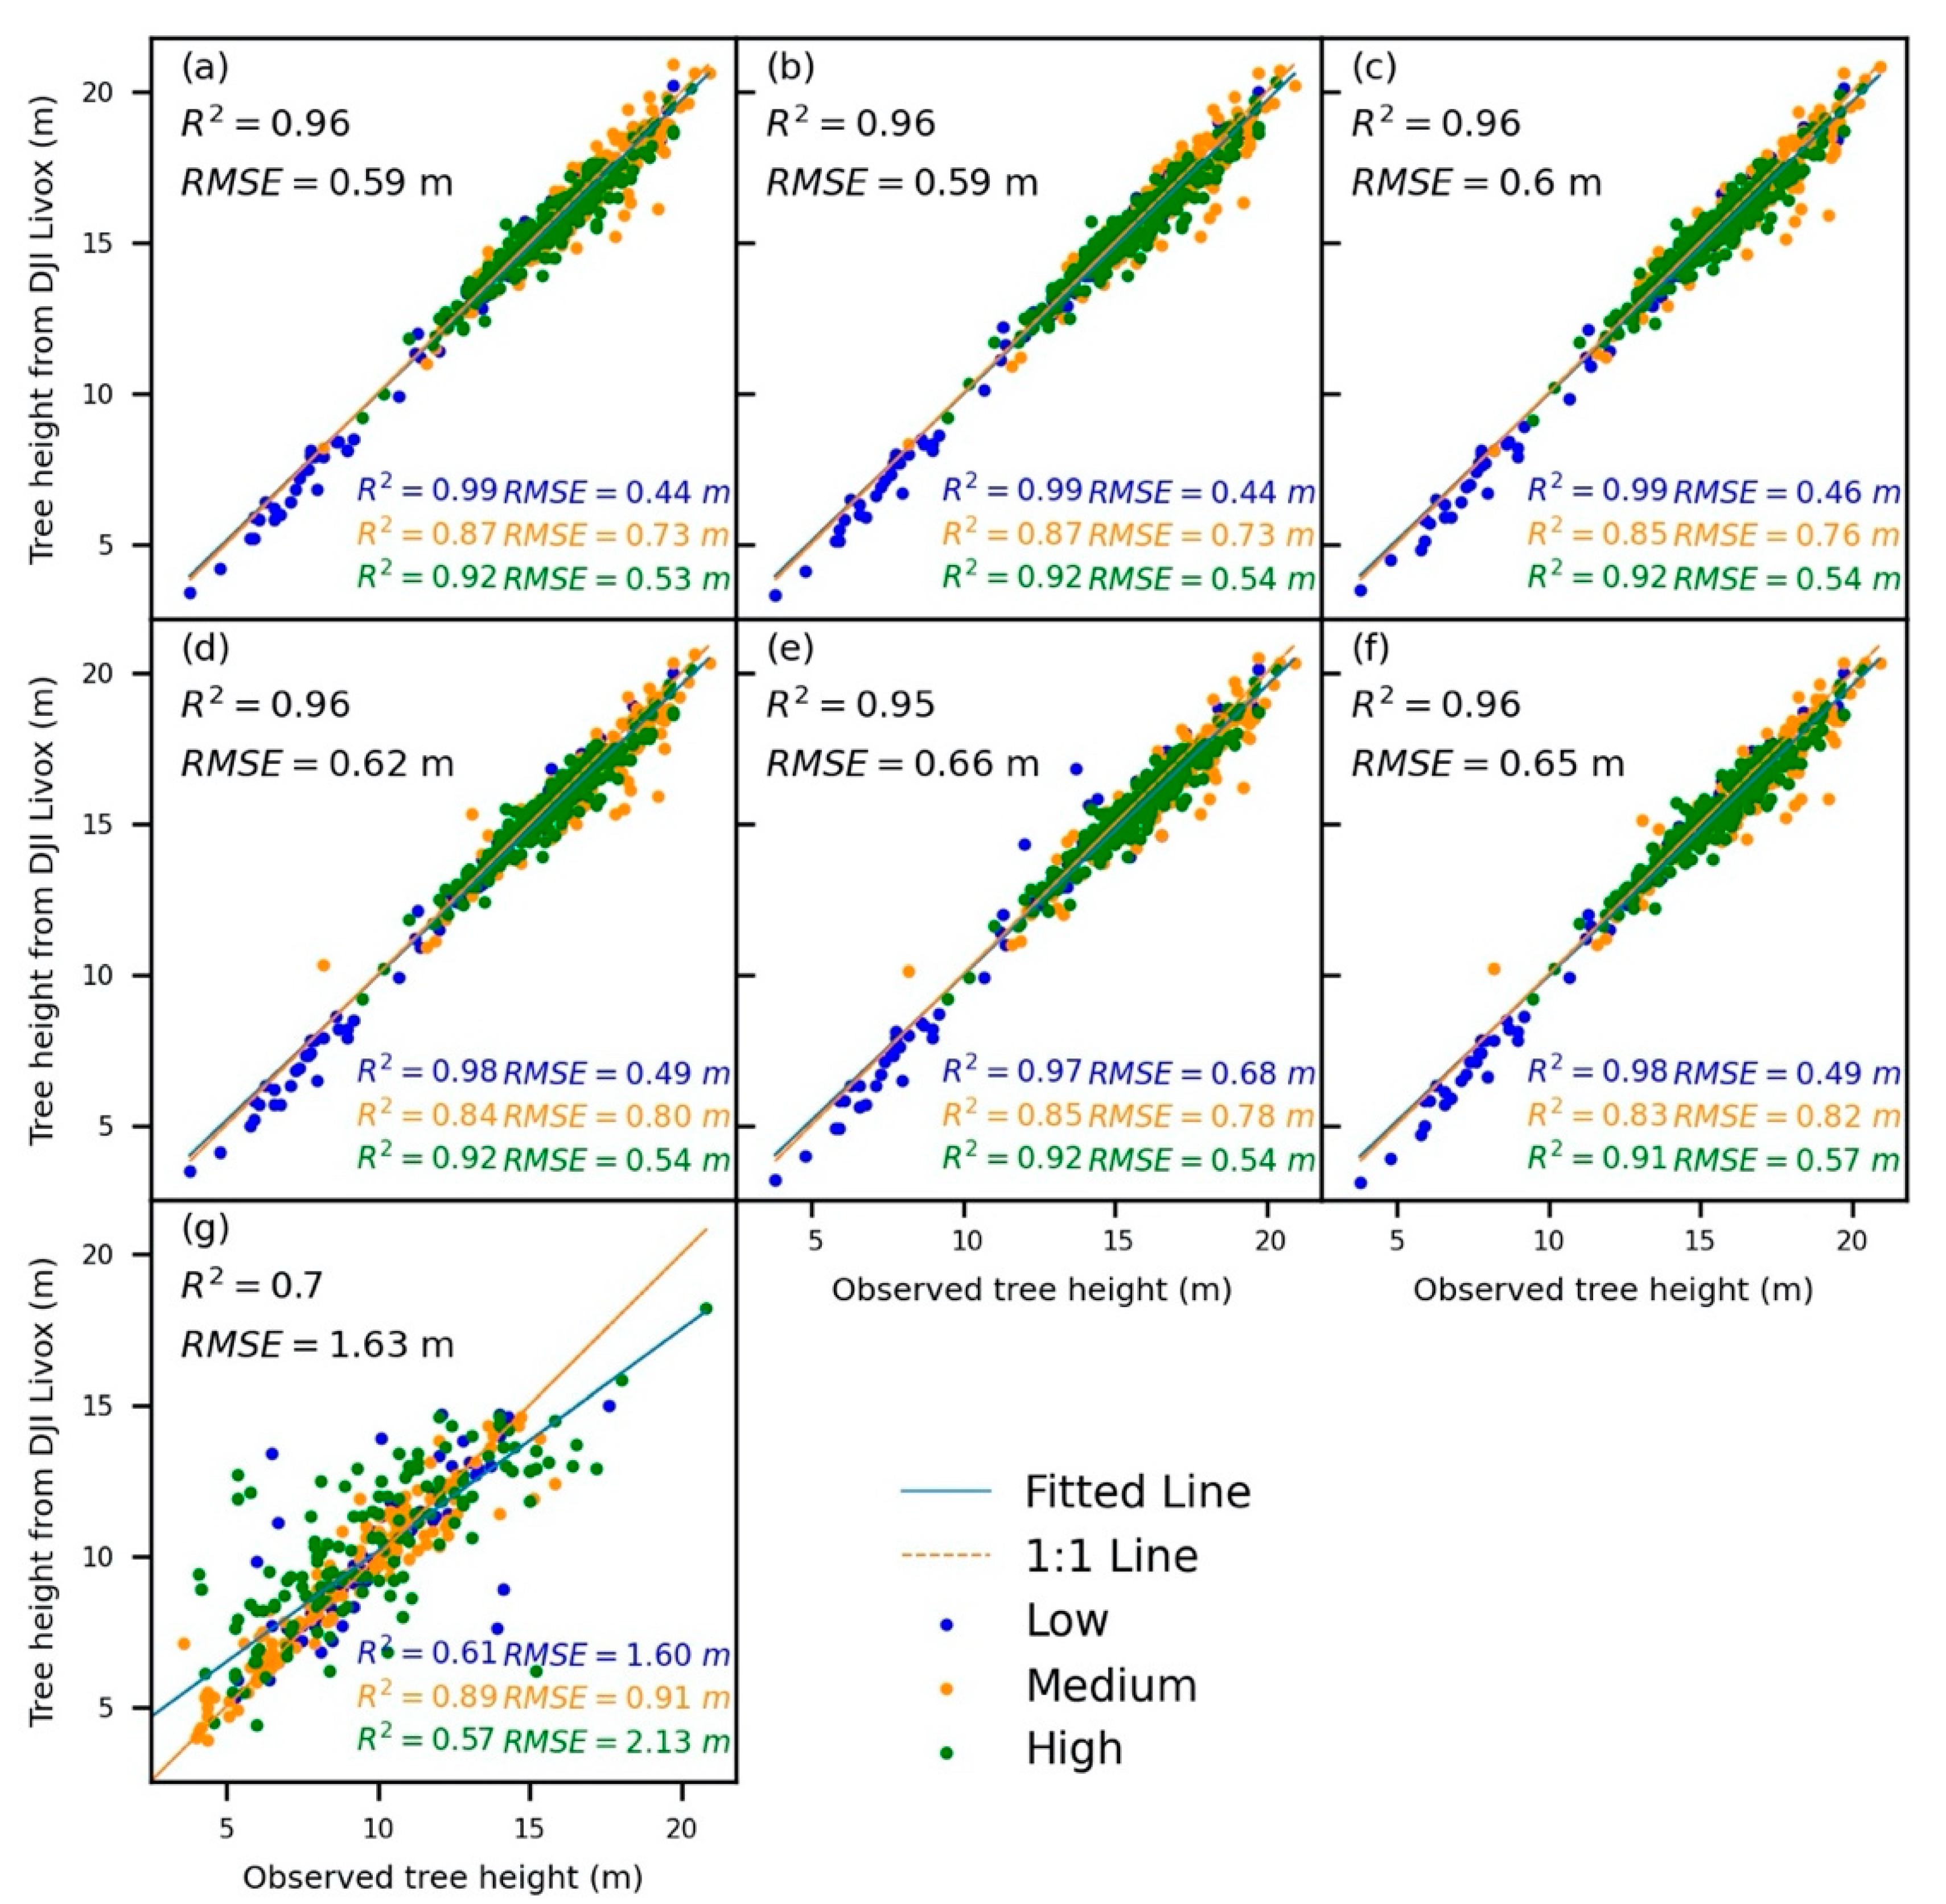
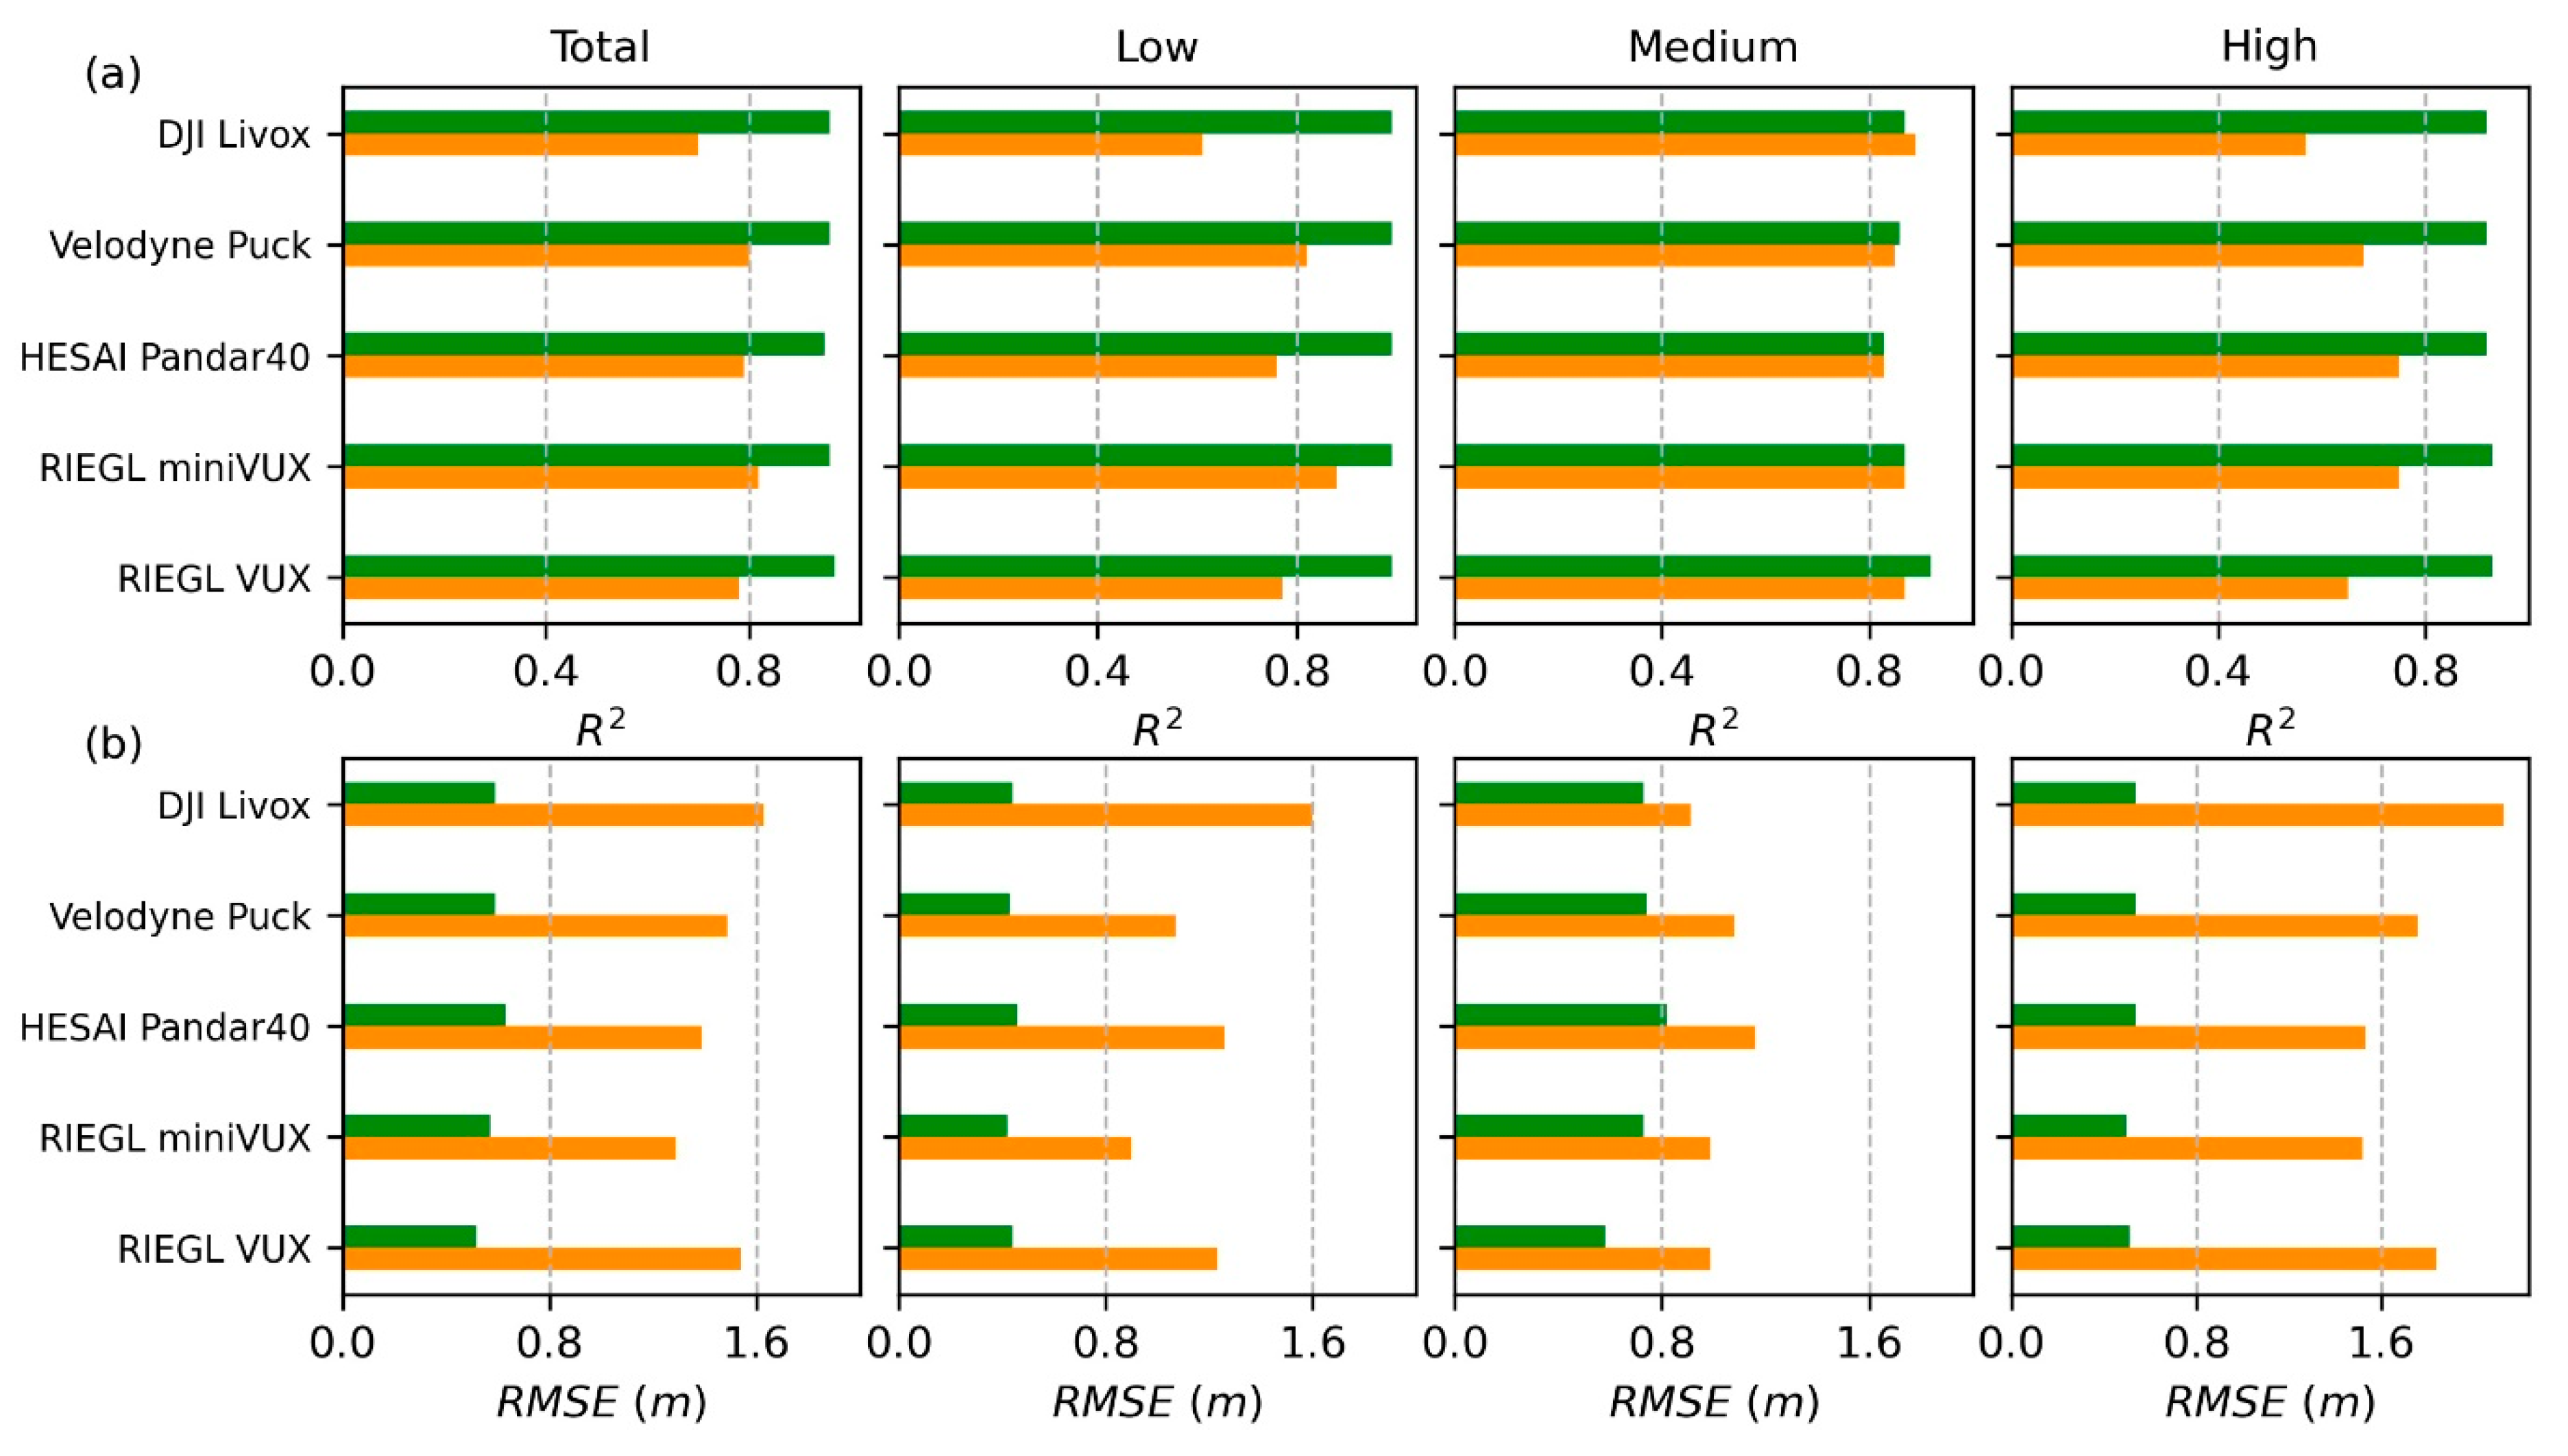
4.2. Accuracy Assessment of Individual Tree Height Estimates

Individual tree height estimates from the DJI Livox data fitted well with field measurements in both coniferous and broadleaved sites (Figure 7). The accuracy of the extracted individual tree heights in the coniferous site was around 95%–96% for different flight heights (i.e., 100 m and 150 m) and flight speeds (i.e., 4 m/s, 6 m/s, and 8 m/s) combinations, and the RMSE ranged from 0.59 m to 0.65 m (Figure 7a–f). Moreover, the accuracy of individual tree height estimates was similar across plots with different tree densities and was higher than 85% in all flight height and flight speed combinations (Figure 7a–f). The accuracy of individual tree heights in the plot group with low tree densities was the highest (R2 = 0.99, RMSE < 0.46 m) while in the plot group with medium tree densities it was the lowest (R2 > 0.83, RMSE < 0.82 m) (Figure 7a–f). The accuracy of individual tree height estimates in the broadleaved site was lower than that in the coniferous site (R2 = 0.70, RMSE = 1.63 m) (Figure 7g). Among tree plots with different tree densities, the medium group had the highest individual tree estimate accuracy (R2 = 0.89, RMSE = 0.91 m), followed by the low group (R2 = 0.61, RMSE = 1.60 m) and the high group (R2 = 0.57, RMSE = 2.13 m) (Figure 7g).
The estimated individual tree heights in the coniferous site from the DJI Livox system had a similar accuracy compared to the other four UAV lidar systems. Their R2 values were higher than 0.87, and the RMSE values were lower than 0.82 m (Figure 8). Among plot groups with different tree densities, the performance of different UAV lidar systems in the estimation of individual tree heights was consistently high as well. The low-density group had the highest accuracy for all UAV lidar systems (R2 = 0.99, RMSE < 0.46 m) while the medium density group had the lowest accuracy (R2 > 0.83, RMSE < 0.82 m) (Figure 8). In the broadleaved site, there were larger discrepancies in individual tree height estimates from different UAV lidar systems (Figure 8). The accuracy of individual tree height estimates from the DJI Livox system was the lowest, except in the medium density group (Figure 8). The RIEGL miniVUX system had the highest accuracy in general. Its difference in R2 with the DJI Livox could be as large as 12%, and its difference in RMSE could reach 0.7 m in the low-density group (Figure 8).

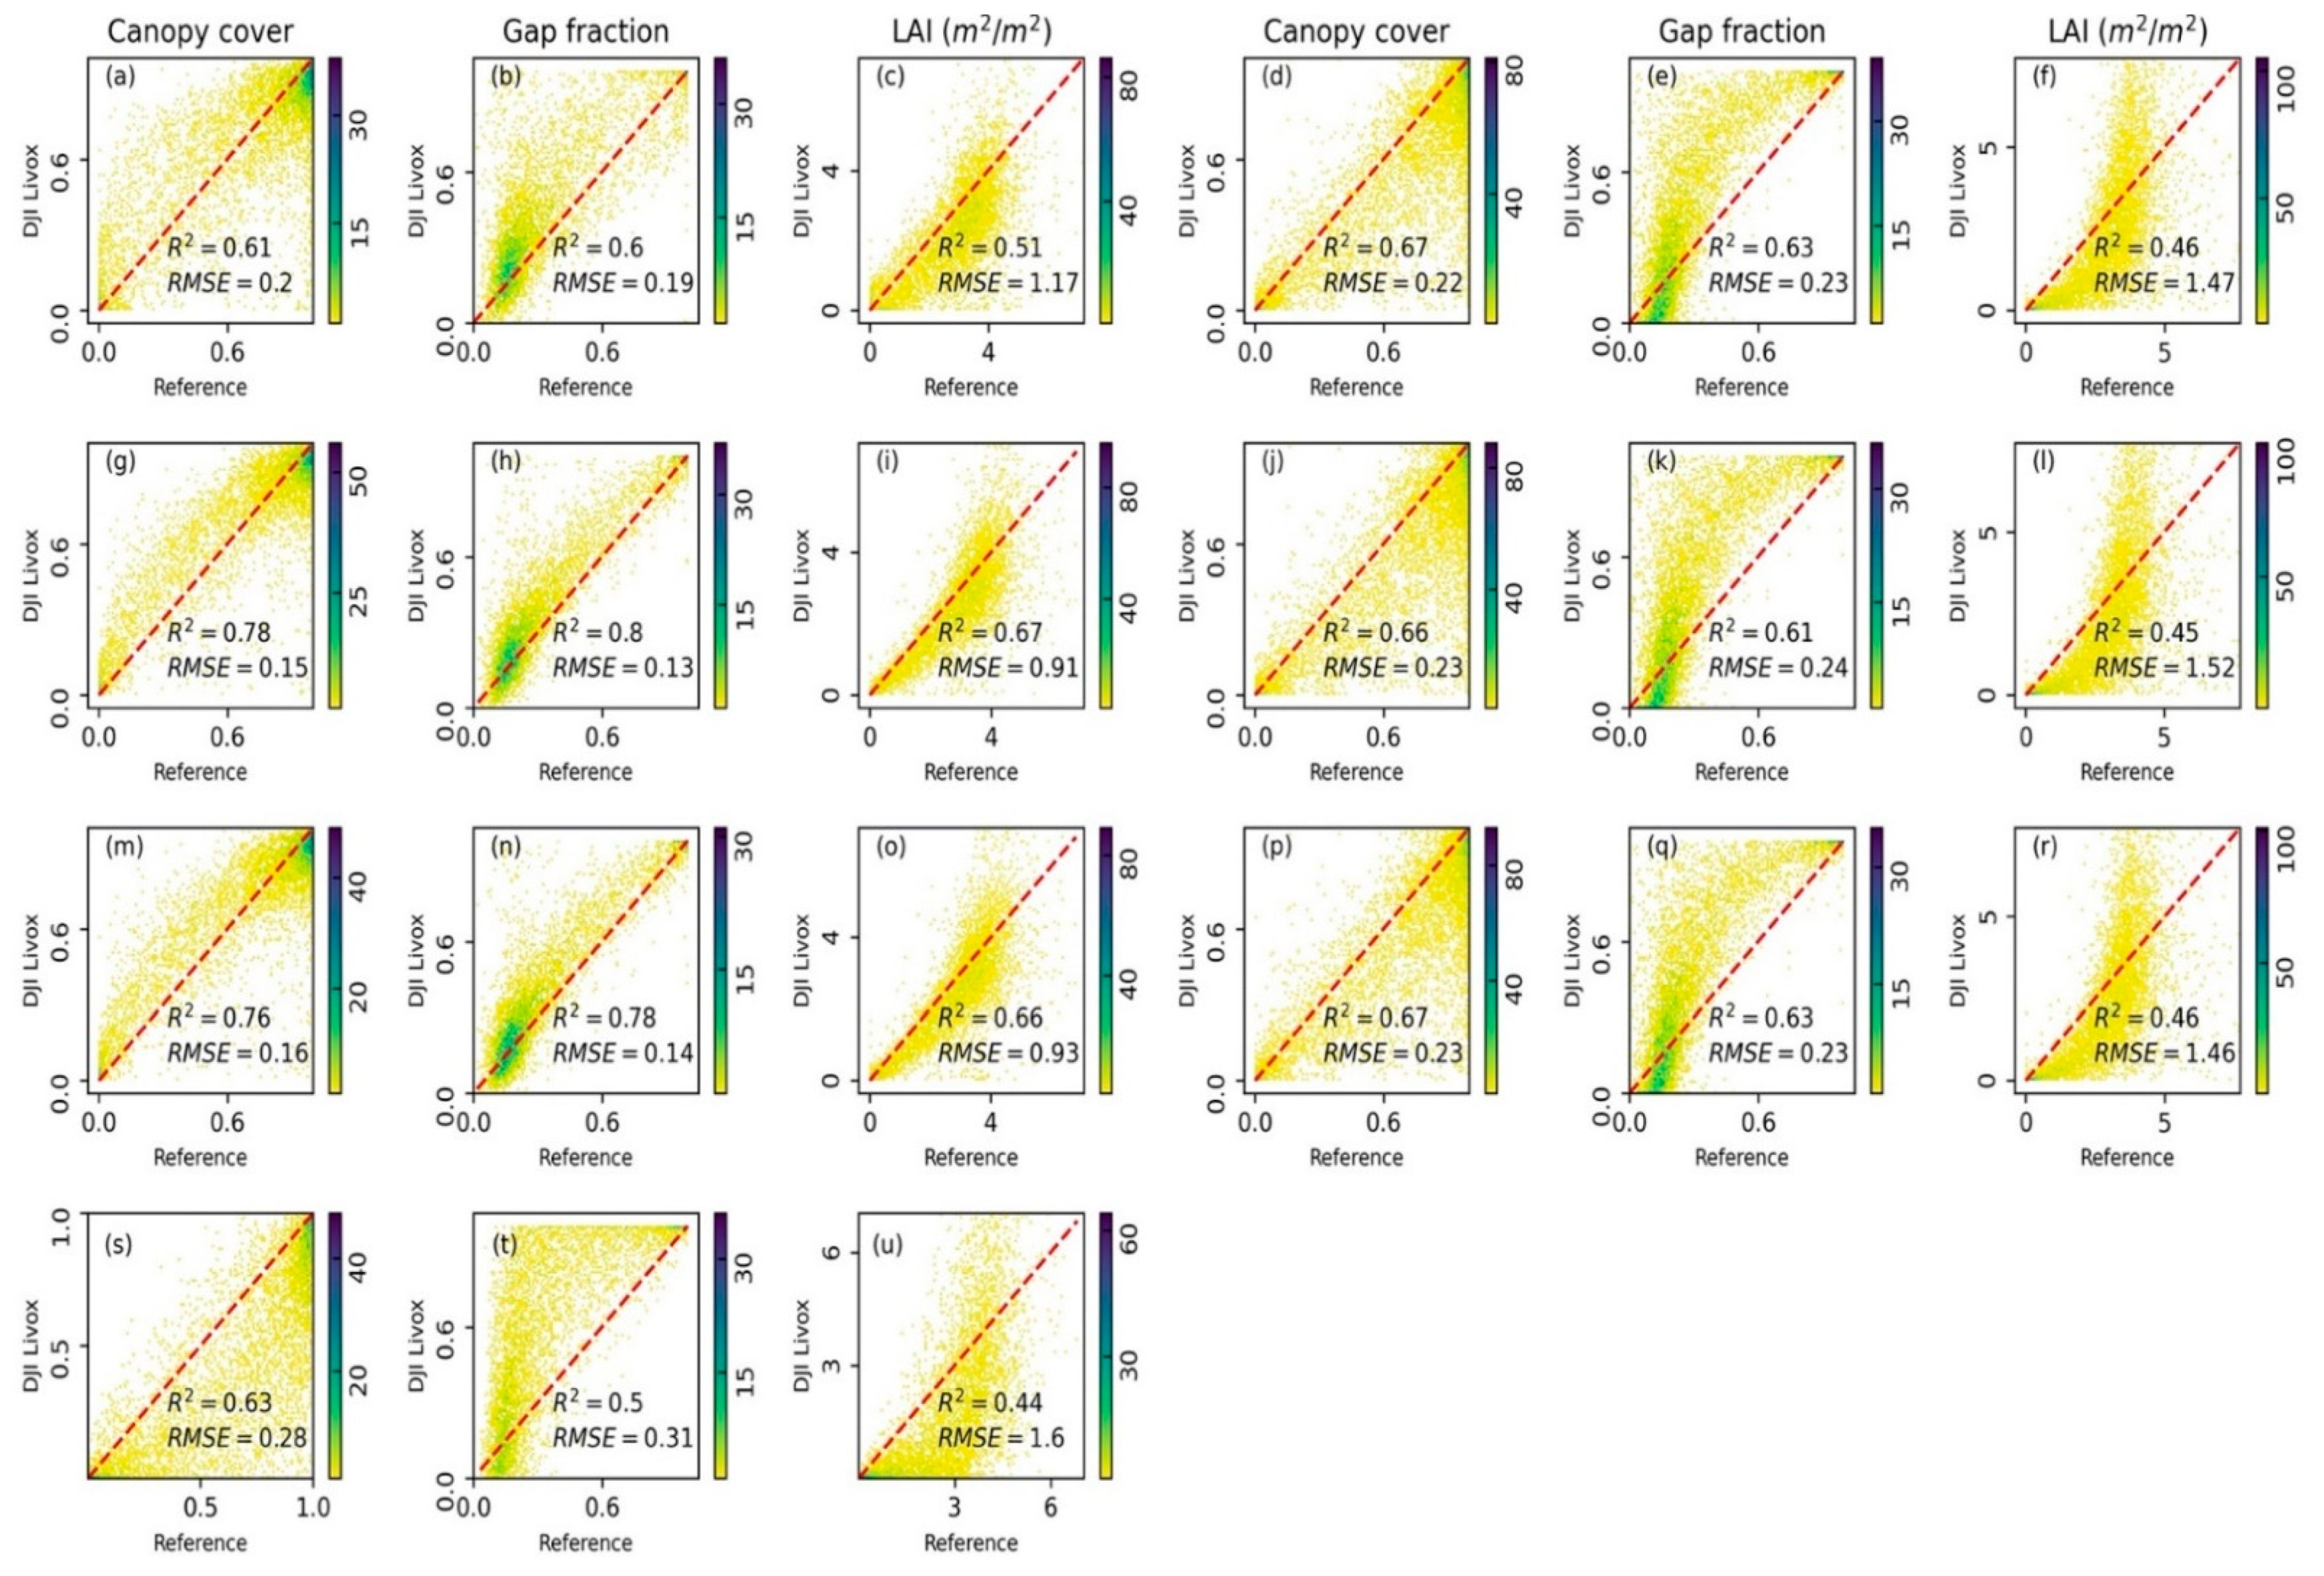
4.3. Validation of Plot-Level Forest Inventory Attribute Estimates

Since we did not have in situ plot-level forest inventory attributes, we used the plot-level attributes derived from the REIGL VUX system (flight height: 50 m; flight speed: 4 m/s) as the reference dataset to evaluate the capability of the DJI Livox system. In the coniferous site, forest inventory attributes derived from the DJI Livox system fit well with those derived from the REIGL VUX system (Figure 9). However, the performance of the DJI Livox system varied significantly with forest inventory attributes and flight specifications. The canopy cover estimates from the DJI Livox system had a general good linear correlation with the reference dataset at the flight height of 100 m, and the R2 was the highest for the flight with a speed of 6 m/s (Figure 9a,g,c). As the flight height increased to 150 m, we observed a clear underestimation trend at medium canopy cover (0.6–0.8), although the R2 values remained higher than 0.66 (Figure 9d,j,p). The gap fraction estimates from the DJI Livox system showed a strong overestimation trend in the medium range (0.4–0.7), and the amount of overestimation increased with flight height (Figure 9e,k,q). Moreover, at the flight height of 100 m, the gap fraction estimated from the flight with a speed of 6 m/s was the highest among all flight speeds as well (Figure 9b,h,n). The LAI estimates from the DJI Livox system had the lowest correlations with the reference dataset among the three forest inventory attributes (Figure 9c,i,o,f,l,r). The LAI had a strong saturation effect after reaching 4 m2/m2, and the estimation accuracy at the flight height of 150 m was lower than that at the flight height of 100 m in general (Figure 9c,i,o,f,l,r). In the broadleaved forests, the accuracies of the three plot-level attributes derived from the DJI Livox system were slightly lower than those in the coniferous forest (Figure 9s–u). They followed similar patterns as the estimates in the coniferous site, with canopy cover that tended to be underestimated at medium range (0.4–0.8), gap fraction that tended to be overestimated at medium range (0.4–0.7), and LAI estimates that tended to be saturated at or above 4 m2/m2 (Figure 9u–w).
The accuracies of plot-level forest inventory attributes were compared with those derived from the Velodyne Puck, the HESAI Pandar40, and REIGL miniVUX systems. Since the plot-level forest inventory attributes derived from the REIGL VUX data (acquired at the flight height of 50 m and flight speed of 4 m/s) were used as the reference dataset, we did not include the REIGL VUX system in this comparison. The accuracies of the plot-level canopy, gap fraction, and LAI were comparable to those derived from the HESAI Pandar40 and REIGL miniVUX systems, which were much higher than the accuracies of those attributes derived from the Velodyne Puck (Figure 10). Among the three plot-level forest inventory attributes, the accuracies of canopy cover and gap fraction were generally higher than that of LAI for all UAV lidar systems (Figure 10). In the broadleaved forests, the accuracies of these three attributes derived from the DJI Livox system were the lowest, and those from the other three UAV lidar systems were comparable (Figure 10). The accuracies of canopy cover and gap fraction were higher than for LAI for all UAV lidar systems in the broadleaved site as well, and the performances of HESAI Pandar40 and REIGL miniVUX in the coniferous and broadleaved sites were more consistent than those of the other two systems (Figure 10).

5. Discussion

The relatively high cost of UAV lidar systems has been a major obstacle to their use in large-scale forest inventory applications. In this study, we developed a UAV lidar system that integrates the very low-cost DJI Livox laser scanner and investigated its usefulness for deriving forest inventory attributes. Overall, the collected point clouds from the DJI Livox system showed satisfying positioning accuracy. The horizontal and vertical precisions were comparable to those of UAV lidar systems equipped with other laser scanners (Table 4), such as Velodyne Puck (3 cm) [16], Sick LMS511 PRO (2~5 cm) [18], Ibeo LUX (4 cm) [50], and Hokuyo UTM30LX (2~5 cm) [51]. The relative horizontal and vertical accuracies were higher than the horizontal and vertical precisions, which might be partially caused by the fact that certain landmarks in the point clouds (e.g., road line boundary, wall corner) were difficult visually identify.
In the two forest sites, the DJI Livox system was able to capture variations in the upper canopy (Figure 4a and Figure 5a). The system can acquire lidar data with a point density higher than 100 points/m2 with flight heights lower than 150 m, which should be sufficient for generating accurate plot-level forest inventory attributes using an area-based approach [52,53] (Figure 6). The Velodyne Puck and HESAI Pandar40 systems have a much higher point density than the DJI Livox system, but similarly to the DJI Livox system, they missed a large proportion of lower canopy information, especially in the broadleaved site (Figure 4 and Figure 5), suggesting that the Velodyne Puck and HESAI Pandar40 systems might provide heavily redundant information in the upper canopy. The REIGL VUX outperformed all other UAV lidar systems in penetrating forest canopy (Figure 4e and Figure 5e). The REIGL miniVUX showed a good capability of depicting lower canopy information as well, although it has a relatively low point density (Figure 4d and Figure 5d), which might be caused by its single-line scanning nature and low scanning frequency.
Flight height had a strong influence on the data quality of the DJI Livox system. This system missed all vegetation information at the flight height of 200 m, although it has a nominal ranging distance of 260 m (Figure 4). This might be caused by its relatively low sensitivity to low-intensity returns. The DJI Livox laser scanner can measure a range of 260 m only for objects with a reflectance higher than 80%. For comparison, the REIGL miniVUX laser scanner can measure a range of 250 m for objects with a reflectance higher than 60%, and the HESAI Pandar40 can measure a range of 200 m for objects with a reflectance higher than 20%. The low sensitivity to low-intensity returns might also explain why the DJI Livox system can capture terrain surface information at the flight height of 200 m while missing nearly all vegetation information. Terrain surfaces generate stronger return signals than vegetation [54], which should be easier to be detected and recorded. Therefore, the DJI Livox system could be a valuable tool for terrain elevation mapping given that only 1 point/m2 is needed for generating DEMs at a resolution of 0.5 m to 1 m [38].
The DJI Livox system was able to accurately extract individual tree heights in the coniferous site, and the accuracy was merely influenced by flight height and flight speed (Figure 8). Moreover, the accuracy of extracted individual tree height from the DJI Livox system was comparable to that of all the other four UAV lidar systems (Figure 9) and to values reported by previous studies [50,55,56]. The performance of the DJI Livox system in extracting individual tree height in the coniferous site was highly consistent in plots with different tree densities as well. The slightly lower accuracy in the medium tree density group might have been caused by the fact that tree heights had the largest variations in this group (Table 2), which may have caused more obstructions and thus reduced the accuracy. In the broadleaved site, the accuracy of the extracted individual tree heights from the DJI Livox system was much lower than that of the other four UAV lidar systems. We believe that this might be partially caused by its low sensitivity to low-intensity returns as well. It is known that broadleaved forests have generally a lower reflectance than coniferous forests [57], which may lead to missing data even in the upper canopy for the DJI Livox system (Figure 9a). In contrast to the coniferous site, the medium tree density group in the broadleaved site had the highest individual tree height accuracy, which might be caused by the greater height homogeneity of the trees in this group (Table 2).
At the plot-level, the DJI Livox system retrieved comparable forest inventory attributes to the high-end REIGL VUX system in the coniferous site (Figure 9). Its accuracy was more sensitive to the flight height rather than the speed. With the increase of flight height, the DJI Livox system tended to underestimate the canopy cover and overestimate gap fraction in their medium ranges. This might be related to its relatively low capability of depicting canopy internal information. In areas with very low canopy cover (i.e., large gap fraction), the DJI Livox system acquired enough canopy internal points to calculate canopy cover and gap fraction; in areas with high canopy cover (i.e., low gap fraction), the canopy cover and gap fraction were largely defined by the upper canopy, and the missing internal canopy information appeared to have less influence on the calculation of canopy cover and gap fraction (Figure 11) [44]. Only in areas with medium canopy cover, the inability to collect canopy internal information of the DJI Livox system leads to a systematic underestimation or overestimation of canopy cover and gap fraction. Plot-level LAI estimates were highly saturated after reaching 4 m2/m2. The difficulty in resolving internal canopy information in areas with dense forest canopy might be the reason leading to this effect as well [58]. In the broadleaved sites, the DJI Livox and Velodyne Puck systems had much lower accuracies in estimating plot-level forest inventory attributes, while the HESAI Pandar40 and REIGL miniVUX systems showed much smaller discrepancies in the coniferous site, which further indicated the superiority of the latter in capturing canopy internal information in broadleaved forests.
Overall, the DJI Livox system was demonstrated to be competitive for capturing upper canopy and terrain surface information, especially in the coniferous forest. However, it still showed several major limitations. First, it had very low sensitivity to returned signals with low intensity. This resulted in a large proportion of the internal canopy information to be missed in areas with dense canopies, leading to large uncertainty in estimating plot-inventory attributes. However, this is not a problem unique to the DJI Livox system. We have found similar effects in the Velodyne Puck as well. How to compensate this effect in the plot-level attribute estimation algorithms needs to be further studied. Second, the DJI Livox system has a very narrow field of view (38.4°), which means that more flight lines are needed to complete a flight mission compared to other laser scanners. This is the reason why we did not include a 50 m flight height in this study for the DJI Livox system, as a single flight mission could not cover the whole study site with the limited UAV battery life, and multiple flight missions may have introduced further errors in the comparison. Recently, DJI has released an updated version of the Livox MID40 laser scanner (Livox MID 70) with a field of view that can reach 70°; this updated scanner may be able to overcome this weakness. Considering its current weaknesses, we suggest using the DJI Livox system with a flight height from 100 m to 150 m in areas with no high-density forest canopies. Nevertheless, we believe that low-cost scanners like DJI Livox will play a very important role in extending the use of UAV lidar in forest inventory applications. The current cost of the DJI Livox system is only $600 USD and thus is even less expensive than most structure-from-motion sensors on the market while not requiring pre-mapped DEMs to derive forest inventory attributes [17,21,26] and providing a much higher accuracy for estimating both individual tree-level and plot-level attributes [24,27].

6. Conclusions

In this study we developed a very low-cost UAV lidar system by integrating the recently released DJI Livox Mid40 laser scanner ($600 USD) with an off-the-shelf UAV. We compared its capability to derive forest inventory attributes with both field measurements and four other high-end UAV lidar systems, i.e., Velodyne Puck, HESAI Pandar40, REIGL miniVUX, and REIGL VUX. The developed DJI Livox system has a horizontal and vertical precision of less than 5 cm, and relative horizontal and vertical accuracies of 12.10 cm and 21.80 cm, respectively. It accurately captured the vertical canopy structure of a coniferous forest site and the upper canopy structure of a forest broadleaved site. We demonstrated that the system clearly retrieved terrain surface information at both study sites. Flight height was the major factor influencing the data quality of the Livox system, and a flight height lower than 150 m is suggested in forest inventory applications. Moreover, the DJI Livox system accurately estimated individual tree height across plots with different tree densities in both coniferous (R2 ≥ 0.95, RMSE ≤ 0.66 m) and broadleaved (R2 = 0.7, RMSE = 1.63 m) sites, although the accuracy in the broadleaved site was slightly lower. Plot-level estimates of canopy cover (R2: 0.61–0.78, RMSE: 0.15–0.28), gap fraction (R2: 0.50–0.80, RMSE: 0.13–0.31), and LAI (R2: 0.44–0.67, RMSE: 0.91–1.60 m2/m2) agreed with those from the REIGL VUX system, although the DJI Livox systems had systematic biases in areas with medium to high canopy densities. The overall performance of the developed DJI Livox system was comparable to the Velodyne Puck, HESAI Paranr40, and REIGL miniVUX systems in the coniferous site, and was slightly lower than that of the HESAI Paranr40 and REIGL miniVUX systems in the broadleaved site. The relatively low sensitivity to returns with low intensity and narrow field of view of the DJI Livox system appear to be the two major weaknesses for forest inventory applications. Nevertheless, we believe that such a system will largely expand the use of UAV lidar in forest inventory applications by overcoming the current major obstacle, which is the high cost of other scanners. The results of this study can help other forest researchers and managers choose the appropriate UAV system and flight specifications to fit their needs.

Author Contributions

Conceptualization, T.H., Y.S. and Q.G.; methodology, T.H. and Y.S.; software, X.S.; investigation, T.H., H.G., Q.S., X.S. and Y.S.; formal analysis, T.H., H.G. and Q.S.; writing—original draft preparation, T.H. and Y.S.; writing—review and editing, T.H., Y.S., M.K. and Q.G. All authors have read and agreed to the published version of the manuscript.

Funding

This study was supported by the National Key R&D Program of China (Grant No. 2017YFC0503905), the National Natural Science Foundation of China (Grant No.41901358, 41871332 and 31971575), the Beijing Municipal Science and Technology Project (Grant No. Z191100007419004), and the Chinese Academy of Sciences President’s International Fellowship Initiative (Grant No. 2019VTA0007).

Institutional Review Board Statement

Not applicable.

Informed Consent Statement

Not applicable.

Data Availability Statement

The data presented in this study are available on request from the corresponding author.

Acknowledgments

We thank the Greenvalley International for providing four UAV lidar systems used for comparison.

Conflicts of Interest

The authors declare no conflict of interest.

References

  1. Fang, J.; Chen, A.; Peng, C.; Zhao, S.; Ci, L. Changes in forest biomass carbon storage in China between 1949 and 1998. Science 2001, 292, 2320–2322. [Google Scholar] [CrossRef]
  2. Saatchi, S.S.; Harris, N.L.; Brown, S.; Lefsky, M.; Mitchard, E.T.A.; Salas, W.; Zutta, B.R.; Buermann, W.; Lewis, S.L.; Hagen, S.; et al. Benchmark map of forest carbon stocks in tropical regions across three continents. Proc. Natl. Acad. Sci. USA 2011, 108, 9899–9904. [Google Scholar] [CrossRef] [Green Version]
  3. Pan, Y.D.; Birdsey, R.A.; Phillips, O.L.; Jackson, R.B. The Structure, Distribution, and Biomass of the World’s Forests. In Annual Review of Ecology, Evolution, and Systematics, Vol 44; Futuyma, D.J., Ed.; Annual Reviews: Palo Alto, CA, USA, 2013; Volume 44, pp. 593–622. [Google Scholar]
  4. Bustamante, M.M.C.; Roitman, I.; Aide, T.M.; Alencar, A.; Anderson, L.O.; Aragao, L.; Asner, G.P.; Barlow, J.; Berenguer, E.; Chambers, J.; et al. Toward an integrated monitoring framework to assess the effects of tropical forest degradation and recovery on carbon stocks and biodiversity. Glob. Chang. Biol. 2016, 22, 92–109. [Google Scholar] [CrossRef] [PubMed]
  5. Næsset, E.; Gobakken, T.; Holmgren, J.; Hyyppä, H.; Hyyppä, J.; Maltamo, M.; Nilsson, M.; Olsson, H.; Persson, Å.; Söderman, U. Laser scanning of forest resources: The Nordic experience. Scand. J. For. Res. 2004, 19, 482–499. [Google Scholar] [CrossRef]
  6. Wulder, M.A.; White, J.C.; Nelson, R.F.; Naesset, E.; Orka, H.O.; Coops, N.C.; Hilker, T.; Bater, C.W.; Gobakken, T. Lidar sampling for large-area forest characterization: A review. Remote Sens. Environ. 2012, 121, 196–209. [Google Scholar] [CrossRef] [Green Version]
  7. Liang, X.L.; Hyyppa, J.; Kaartinen, H.; Lehtomaki, M.; Pyorala, J.; Pfeifer, N.; Holopainen, M.; Brolly, G.; Pirotti, F.; Hackenberg, J.; et al. International benchmarking of terrestrial laser scanning approaches for forest inventories. ISPRS J. Photogramm. Remote Sens. 2018, 144, 137–179. [Google Scholar] [CrossRef]
  8. Liu, K.; Shen, X.; Cao, L.; Wang, G.B.; Cao, F.L. Estimating forest structural attributes using UAV-LiDAR data in Ginkgo plantations. ISPRS J. Photogramm. Remote Sens. 2018, 146, 465–482. [Google Scholar] [CrossRef]
  9. Luo, L.; Zhai, Q.; Su, Y.; Ma, Q.; Kelly, M.; Guo, Q. Simple method for direct crown base height estimation of individual conifer trees using airborne LiDAR data. Opt. Express 2018, 26, A562–A578. [Google Scholar] [CrossRef]
  10. Li, L.; Guo, Q.; Tao, S.; Kelly, M.; Xu, G. Lidar with multi-temporal MODIS provide a means to upscale predictions of forest biomass. ISPRS J. Photogramm. Remote Sens. 2015, 102, 198–208. [Google Scholar] [CrossRef]
  11. Jakubowksi, M.K.; Guo, Q.; Collins, B.; Stephens, S.; Kelly, M. Predicting surface fuel models and fuel metrics using Lidar and CIR imagery in a dense, mountainous forest. Photogramm. Eng. Remote Sens. 2013, 79, 37–49. [Google Scholar] [CrossRef] [Green Version]
  12. Guo, Q.; Su, Y.; Hu, T.; Guan, H.; Jin, S.; Zhang, J.; Zhao, X.; Xu, K.; Wei, D.; Kelly, M.; et al. Lidar boosts three-dimensional ecological observations and modelling: A review and perspective. IEEE Geosci. Remote Sens. Mag. 2020. [Google Scholar] [CrossRef]
  13. Su, Y.; Guo, Q.; Jin, S.; Guan, H.; Sun, X.; Ma, Q.; Hu, T.; Wang, R.; Li, Y. The Development and Evaluation of a Backpack LiDAR System for Accurate and Efficient Forest Inventory. IEEE Geosci. Remote. Sens. Lett. 2020, 1–5. [Google Scholar] [CrossRef]
  14. Wang, Y.; Hyyppä, J.; Liang, X.; Kaartinen, H.; Yu, X.; Lindberg, E.; Holmgren, J.; Qin, Y.; Mallet, C.; Ferraz, A.; et al. International Benchmarking of the Individual Tree Detection Methods for Modeling 3-D Canopy Structure for Silviculture and Forest Ecology Using Airborne Laser Scanning. IEEE Trans. Geosci. Remote Sens. 2016, 54, 5011–5027. [Google Scholar] [CrossRef] [Green Version]
  15. Magnussen, S.; Nord-Larsen, T.; Riis-Nielsen, T. Lidar supported estimators of wood volume and aboveground biomass from the Danish national forest inventory (2012–2016). Remote Sens. Environ. 2018, 211, 146–153. [Google Scholar] [CrossRef]
  16. Guo, Q.; Su, Y.; Hu, T.; Zhao, X.; Wu, F.; Li, Y.; Liu, J.; Chen, L.; Xu, G.; Lin, G.; et al. An integrated UAV-borne lidar system for 3D habitat mapping in three forest ecosystems across China. Int. J. Remote Sens. 2017, 38, 2954–2972. [Google Scholar] [CrossRef]
  17. Wallace, L.; Lucieer, A.; Watson, C.; Turner, D. Development of a UAV-LiDAR System with Application to Forest Inventory. Remote Sens. 2012, 4, 1519–1543. [Google Scholar] [CrossRef] [Green Version]
  18. Jaakkola, A.; Hyyppä, J.; Kukko, A.; Yu, X.; Kaartinen, H.; Lehtomäki, M.; Lin, Y. A low-cost multi-sensoral mobile mapping system and its feasibility for tree measurements. ISPRS J. Photogramm. Remote Sens. 2010, 65, 514–522. [Google Scholar] [CrossRef]
  19. Bruggisser, M.; Hollaus, M.; Otepka, J.; Pfeifer, N. Influence of ULS acquisition characteristics on tree stem parameter estimation. ISPRS J. Photogramm. Remote Sens. 2020, 168, 28–40. [Google Scholar] [CrossRef]
  20. Li, J.; Yang, B.; Chen, C.; Habib, A. NRLI-UAV: Non-rigid registration of sequential raw laser scans and images for low-cost UAV LiDAR point cloud quality improvement. ISPRS J. Photogramm. Remote Sens. 2019, 158, 123–145. [Google Scholar] [CrossRef]
  21. Iglhaut, J.; Cabo, C.; Puliti, S.; Piermattei, L.; O’Connor, J.; Rosette, J. Structure from Motion Photogrammetry in Forestry: A Review. Curr. For. Rep. 2019, 5, 155–168. [Google Scholar] [CrossRef] [Green Version]
  22. Jiang, S.; Jiang, C.; Jiang, W. Efficient structure from motion for large-scale UAV images: A review and a comparison of SfM tools. ISPRS J. Photogramm. Remote Sens. 2020, 167, 230–251. [Google Scholar] [CrossRef]
  23. Goodbody, T.R.H.; Coops, N.C.; White, J.C. Digital Aerial Photogrammetry for Updating Area-Based Forest Inventories: A Review of Opportunities, Challenges, and Future Directions. Curr. For. Rep. 2019, 5, 55–75. [Google Scholar] [CrossRef] [Green Version]
  24. Cao, L.; Liu, H.; Fu, X.; Zhang, Z.; Shen, X.; Ruan, H. Comparison of UAV LiDAR and Digital Aerial Photogrammetry Point Clouds for Estimating Forest Structural Attributes in Subtropical Planted Forests. Forests 2019, 10, 145. [Google Scholar] [CrossRef] [Green Version]
  25. Moe, K.T.; Owari, T.; Furuya, N.; Hiroshima, T. Comparing Individual Tree Height Information Derived from Field Surveys, LiDAR and UAV-DAP for High-Value Timber Species in Northern Japan. Forests 2020, 11, 223. [Google Scholar] [CrossRef] [Green Version]
  26. Kachamba, D.J.; Ørka, H.O.; Gobakken, T.; Eid, T.; Mwase, W. Biomass Estimation Using 3D Data from Unmanned Aerial Vehicle Imagery in a Tropical Woodland. Remote Sens. 2016, 8, 968. [Google Scholar] [CrossRef] [Green Version]
  27. Filippelli, S.K.; Lefsky, M.A.; Rocca, M.E. Comparison and integration of lidar and photogrammetric point clouds for mapping pre-fire forest structure. Remote Sens. Environ. 2019, 224, 154–166. [Google Scholar] [CrossRef]
  28. Mielcarek, M.; Kamińska, A.; Stereńczak, K. Digital Aerial Photogrammetry (DAP) and Airborne Laser Scanning (ALS) as Sources of Information about Tree Height: Comparisons of the Accuracy of Remote Sensing Methods for Tree Height Estimation. Remote Sens. 2020, 12, 1808. [Google Scholar] [CrossRef]
  29. Puliti, S.; Ørka, H.O.; Gobakken, T.; Næsset, E. Inventory of Small Forest Areas Using an Unmanned Aerial System. Remote Sens. 2015, 7, 9632–9654. [Google Scholar] [CrossRef] [Green Version]
  30. Jayathunga, S.; Owari, T.; Tsuyuki, S. Evaluating the Performance of Photogrammetric Products Using Fixed-Wing UAV Imagery over a Mixed Conifer–Broadleaf Forest: Comparison with Airborne Laser Scanning. Remote Sens. 2018, 10, 187. [Google Scholar] [CrossRef] [Green Version]
  31. Lin, J.; Wang, M.; Ma, M.; Lin, Y. Aboveground Tree Biomass Estimation of Sparse Subalpine Coniferous Forest with UAV Oblique Photography. Remote Sens. 2018, 10, 1849. [Google Scholar] [CrossRef] [Green Version]
  32. Gautam, D.; Lucieer, A.; Watson, C.; McCoull, C. Lever-arm and boresight correction, and field of view determination of a spectroradiometer mounted on an unmanned aircraft system. ISPRS J. Photogramm. Remote Sens. 2019, 155, 25–36. [Google Scholar] [CrossRef]
  33. Li, Z.; Tan, J.; Liu, H. Rigorous Boresight Self-Calibration of Mobile and UAV LiDAR Scanning Systems by Strip Adjustment. Remote Sens. 2019, 11, 442. [Google Scholar] [CrossRef] [Green Version]
  34. Filin, S. Recovery of systematic biases in laser altimetry data using natural surfaces. Photogramm. Eng. Remote Sens. 2003, 69, 1235–1242. [Google Scholar] [CrossRef]
  35. Skaloud, J.; Lichti, D. Rigorous approach to bore-sight self-calibration in airborne laser scanning. ISPRS J. Photogramm. Remote Sens. 2006, 61, 47–59. [Google Scholar] [CrossRef]
  36. Glennie, C.; Lichti, D.D. Static calibration and analysis of the Velodyne HDL-64E S2 for high accuracy mobile scanning. Remote Sensing 2010, 2, 1610–1624. [Google Scholar] [CrossRef] [Green Version]
  37. Rusu, R.B.; Cousins, S. 3D is here: Point Cloud Library (PCL). In Proceedings of the 2011 IEEE International Conference on Robotics and Automation, Shanghai, China, 9–13 May 2011; pp. 1–4. [Google Scholar]
  38. Guo, Q.; Li, W.; Yu, H.; Alvarez, O. Effects of Topographic Variability and Lidar Sampling Density on Several DEM Interpolation Methods. Photogramm. Eng. Remote Sens. 2010, 76, 701–712. [Google Scholar] [CrossRef] [Green Version]
  39. Li, W.; Guo, Q.; Jakubowski, M.K.; Kelly, M. A New Method for Segmenting Individual Trees from the Lidar Point Cloud. Photogramm. Eng. Remote Sens. 2012, 78, 75–84. [Google Scholar] [CrossRef] [Green Version]
  40. Lu, X.; Guo, Q.; Li, W.; Flanagan, J. A bottom-up approach to segment individual deciduous trees using leaf-off lidar point cloud data. ISPRS J. Photogramm. Remote Sens. 2014, 94, 1–12. [Google Scholar] [CrossRef]
  41. Yang, Q.; Su, Y.; Jin, S.; Kelly, M.; Hu, T.; Ma, Q.; Li, Y.; Song, S.; Zhang, J.; Xu, G.; et al. The Influence of Vegetation Characteristics on Individual Tree Segmentation Methods with Airborne LiDAR Data. Remote Sens. 2019, 11, 2880. [Google Scholar] [CrossRef] [Green Version]
  42. Korhonen, L.; Korpela, I.; Heiskanen, J.; Maltamo, M. Airborne discrete-return LIDAR data in the estimation of vertical canopy cover, angular canopy closure and leaf area index. Remote Sens. Environ. 2011, 115, 1065–1080. [Google Scholar] [CrossRef]
  43. Richardson, J.J.; Moskal, L.M.; Kim, S.-H. Modeling approaches to estimate effective leaf area index from aerial discrete-return LIDAR. Agric. For. Meteorol. 2009, 149, 1152–1160. [Google Scholar] [CrossRef]
  44. Ma, Q.; Su, Y.; Guo, Q. Comparison of Canopy Cover Estimations From Airborne LiDAR, Aerial Imagery, and Satellite Imagery. IEEE J. Sel. Top. Appl. Earth Observ. Remote Sens. 2017, 10, 4225–4236. [Google Scholar] [CrossRef]
  45. Mandlburger, G.; Pfennigbauer, M.; Schwarz, R.; Flöry, S.; Nussbaumer, L. Concept and Performance Evaluation of a Novel UAV-Borne Topo-Bathymetric LiDAR Sensor. Remote Sens. 2020, 12, 986. [Google Scholar] [CrossRef] [Green Version]
  46. Guan, H.; Su, Y.; Sun, X.; Xu, G.; Li, W.; Ma, Q.; Wu, X.; Wu, J.; Liu, L.; Guo, Q. A marker-free method for registering multi-scan terrestrial laser scanning data in forest environments. ISPRS J. Photogramm. Remote Sens. 2020, 166, 82–94. [Google Scholar] [CrossRef]
  47. Gottfried, M.; Hollaus, M.; Glira, P.; Wieser, M.; Milenković, M. First examples from the RIEGL VUX-SYS for forestry applications. In Proceedings of the SilviLaser 2015, La Grande Motte, France, 28–30 September 2015; pp. 105–107. [Google Scholar]
  48. Liang, X.; Wang, Y.; Pyörälä, J.; Lehtomäki, M.; Yu, X.; Kaartinen, H.; Kukko, A.; Honkavaara, E.; Issaoui, A.E.I.; Nevalainen, O.; et al. Forest in situ observations using unmanned aerial vehicle as an alternative of terrestrial measurements. For. Ecosyst. 2019, 6, 1–16. [Google Scholar] [CrossRef] [Green Version]
  49. Wieser, M.; Mandlburger, G.; Hollaus, M.; Otepka, J.; Glira, P.; Pfeifer, N. A Case Study of UAS Borne Laser Scanning for Measurement of Tree Stem Diameter. Remote Sens. 2017, 9, 1154. [Google Scholar] [CrossRef] [Green Version]
  50. Wallace, L.; Lucieer, A.; Malenovský, Z.; Turner, D.; Vopěnka, P. Assessment of Forest Structure Using Two UAV Techniques: A Comparison of Airborne Laser Scanning and Structure from Motion (SfM) Point Clouds. Forests 2016, 7, 62. [Google Scholar] [CrossRef] [Green Version]
  51. Chisholm, R.A.; Cui, J.; Lum, S.K.; Chen, B.M. UAV LiDAR for below-canopy forest surveys. J. Unmanned Veh. Syst. 2013, 1, 61–68. [Google Scholar] [CrossRef] [Green Version]
  52. Jakubowski, M.K.; Guo, Q.; Kelly, M. Tradeoffs between lidar pulse density and forest measurement accuracy. Remote Sens. Environ. 2013, 130, 245–253. [Google Scholar] [CrossRef]
  53. Treitz, P.; Lim, K.; Woods, M.; Pitt, D.; Nesbitt, D.; Etheridge, D. LiDAR Sampling Density for Forest Resource Inventories in Ontario, Canada. Remote Sens. 2012, 4, 830–848. [Google Scholar] [CrossRef] [Green Version]
  54. Langford, J.; Niemann, O.; Frazer, G.; Wulder, M.; Nelson, T. Exploring Small Footprint Lidar Intensity Data in a Forested Environment. In Proceedings of the 2006 IEEE International Symposium on Geoscience and Remote Sensing, Denver, CO, USA, 31 July–4 August 2006; pp. 2416–2419. [Google Scholar]
  55. Jaakkola, A.; Hyyppä, J.; Yu, X.; Kukko, A.; Kaartinen, H.; Liang, X.; Hyyppä, H.; Wang, Y. Autonomous Collection of Forest Field Reference—The Outlook and a First Step with UAV Laser Scanning. Remote Sens. 2017, 9, 785. [Google Scholar] [CrossRef] [Green Version]
  56. Dalla Corte, A.P.; Rex, F.E.; Almeida, D.R.A.d.; Sanquetta, C.R.; Silva, C.A.; Moura, M.M.; Wilkinson, B.; Zambrano, A.M.A.; Cunha Neto, E.M.d.; Veras, H.F. Measuring individual tree diameter and height using GatorEye High-Density UAV-Lidar in an integrated crop-livestock-forest system. Remote Sens. 2020, 12, 863. [Google Scholar] [CrossRef] [Green Version]
  57. Williams, D.L. A comparison of spectral reflectance properties at the needle, branch, and canopy level for selected Conifer species. Remote Sens. Environ. 1991, 35, 79–93. [Google Scholar] [CrossRef]
  58. Zhao, K.; Popescu, S.C. Lidar-based mapping of leaf area index and its use for validating GLOBCARBON satellite LAI product in a temperate forest of the southern USA. Remote Sens. Environ. 2009, 113, 1628–1645. [Google Scholar] [CrossRef]
Figure 1. An illustration of hardware components of the very low-cost UAV lidar system mounted to a Da-Jiang Innovations (DJI) Matrice 210 developed for this study.
Remotesensing 13 00077 g001
Figure 2. The location of the two study sites and field plots. The background satellite image was downloaded from Google; it was acquired on 13 May 2018 by Airbus.
Remotesensing 13 00077 g002
Figure 3. An illustration of UAV lidar data collection scheme in the coniferous forest site. Note that the number of flight lines was determined by flight height.
Remotesensing 13 00077 g003
Figure 4. Lidar vertical profiles in the coniferous site drawn from the UAV lidar data at different flight height and speed combinations. (ae) represent the corresponding lidar vertical profiles from the DJI Livox, Velodyne Puck, HESAI Pandar40, RIEGL miniVUX, and RIEGL VUX systems, respectively. Each profile was 150 m in length and 5 m in width and was drawn from the same location.
Remotesensing 13 00077 g004
Figure 5. Lidar vertical profiles in the broadleaved site drawn from the UAV lidar data from (a) the DJI Livox (150 m flight height, 6 m/s flight speed), (b) the Velodyne Puck (75 m flight height, 6 m/s flight speed), (c) the HESAI Pandar40 (150 m flight height, 6 m/s flight speed), (d) the RIEGL miniVUX (150 m flight height, 6 m/s flight speed), and (e) the RIEGL VUX (150 m flight height, 6 m/s flight speed). Each profile was 350 m in length and 5 m in width and was drawn from the same location.
Remotesensing 13 00077 g005
Figure 6. Comparisons of (a) total point density and (b) ground point density acquired by five UAV lidar systems in the coniferous site (i) and broadleaved site (ii).
Remotesensing 13 00077 g006
Figure 7. Scatter plots between individual tree height estimates from the DJI Livox data and field measurements at different flight height and flight speed combinations. Subplots (ac) used the DJI Livox data at the flight height of 100 m and the flight speed of 4 m/s, 6 m/s, and 8 m/s (from left to right) to derive individual tree height estimates in the coniferous site, and subplots (bf) used the DJI Livox data at the flight height of 150 m and the flight speed of 4 m/s, 6 m/s, and 8 m/s (from left to right) to derive individual tree height estimates in the broadleaved site. Subplot (g) used the DJI Livox data at the flight height of 150 m and the flight speed of 6 m/s in the broadleaved forest. The color of points represents the tree density group, the solid blue line represents the fitted line, and the dashed yellow line represents the 1:1 line.
Remotesensing 13 00077 g007
Figure 8. The accuracy of individual tree height estimates derived from the five UAV lidar systems in the coniferous and broadleaved sites. All UAV lidar data were acquired at the same flight height (100 m in coniferous forest and 150 in the broadleaved forest) and flight speed (6 m/s), except the Velodyne Puck system (flight height: 75 m; flight speed: 6 m/s). The subfigures (a) and (b) stand for R2 and RMSE, respectively. Green and yellow bars indicate the coniferous and broadleaved sites, respectively.
Remotesensing 13 00077 g008
Figure 9. Scatter plots between the forest inventory attributes (i.e., canopy cover, gap fraction, and leaf area index (LAI)) derived from the DJI Livox system and those derived from the RIEGL VUX system in the coniferous site (ar) and the broadleaved site (su). In the coniferous site, forest inventory attributes were derived from DJI Livox data with a flight height of 100 m (ac,gi,mo) and 150 m (bf,jl,pr) and a flight speed of 4 m/s (af), 6 m/s (gl), and 8 m/s (mr), respectively. The reference dataset of plot-level forest inventory attributes was estimated from the REIGL VUX data acquired at a flight height of 150 m and a flight speed of 6 m/s.
Remotesensing 13 00077 g009
Figure 10. The accuracy of plot-level forest inventory attribute estimates (i.e., canopy cover, gap fraction, and LAI) derived from the DJI Livox, Velodyne Puck, HESAI Pandar40, and RIEGL miniVUX in the coniferous and broadleaved sites. All UAV lidar data were acquired at the same flight height (100 m in coniferous forest and 150 in the broadleaved forest) and flight speed (6 m/s), except the Velodyne Puck system (flight height: 75 m; flight speed: 6 m/s). The subfigures (a) and (b) indicate R2 and RMSE, respectively. Green and yellow bars stand for the coniferous and broadleaved site, respectively. The reference dataset of plot-level forest inventory attributes was estimated from the REIGL VUX data acquired at a flight height of 150 m and a flight speed of 6 m/s.
Remotesensing 13 00077 g010
Figure 11. Vertical point density probability distribution in plots with (a) low tree density, (b) medium tree density, and (c) high tree density in the broadleaved site (Table 2). Note that vertical point density was calculated as the proportion of the number of points in each height strata to the total number of points in plots of the corresponding tree density group.
Remotesensing 13 00077 g011
Table 1. Specifications of unmanned aerial vehicle (UAV) light detection and ranging (lidar) sensors used in the literature.
Laser ScannerMaximum Range (m)FOV
(°)
Range Precision (cm)Maximum Measurement Rate (kHz)Weight
(kg)
RIEGL miniVUX-1UAV2503601.0100~1.55
RIEGL VUX-1UAV10503300.5500~3.50
HESAI Pandar402003602.0720~1.46
Velodyne Puck LITE1003603.0300~0.59
Velodyne HDL-32E1003602.0695~1.0
Ibeo LUX1501104.0976~1.0
Sick LMS511 PRO801902.5~5.0100~3.7
Sick LD LRS10002503603.810~4.1
Hokuyo UTM30LX302703.0~5.025~0.37
Table 2. The density, diameter at breast height (DBH), and height statistics in each tree density group calculated from field measurements. Reported DBH and height are mean ± standard deviation.
Tree Density CategoryConiferous Forest SiteBroadleaved Forest Site
Density
(Stems/ha)
DBH
(cm)
Height
(m)
Density
(Stems/ha)
DBH
(cm)
Height
(m)
Low56517.76 ± 6.7915.59 ± 1.9062412.34 ± 5.459.30 ± 3.11
Medium85823.19 ± 6.4313.27 ± 3.95112812.59 ± 5.389.67 ± 2.58
High113019.46 ± 3.8516.87 ± 2.00209610.84 ± 5.309.09 ± 2.79
Table 3. Flight specifications for the five UAV lidar systems (i.e., DJI Livox, RIEGL VUX, RIEGL miniVUX, HESAI Panda, and Velodyne Puck) in the two study sites.
UAV Lidar SystemConiferous ForestBroadleaved Forest
Flight Height
(m)
Flight Speed
(m/s)
Scan Rate
(Hz)
Flight Height
(m)
Flight Speed
(m/s)
Scan Rate
(Hz)
DJI Livox100, 150, 2004, 6, 81001506100
Velodyne Puck50, 754, 6, 8300756300
HESAI Pandar4050, 100, 150, 2004, 6, 87201506720
RIEGL miniVUX50, 100, 150, 2004, 6, 81001506100
RIEGL VUX50, 100, 150, 2004, 6, 84001506400
Table 4. The horizontal and vertical precisions and relative horizontals and vertical accuracies of the developed DJI Livox system. Precisions and accuracies are reported in mean error and root-mean-squared error (RMSE).
Mean Bias (cm)Standard Deviation of Bias (cm)
Horizontal precision3.722.53
Vertical precision4.753.57
Relative horizontal accuracy12.1013.25
Relative vertical accuracy21.809.31
Publisher’s Note: MDPI stays neutral with regard to jurisdictional claims in published maps and institutional affiliations.

