Article

Social-Ecological Archetypes of Land Degradation in the Nigerian Guinea Savannah: Insights for Sustainable Land Management

by
Ademola A. Adenle
1,2,* and
Chinwe Ifejika Speranza
1
1
Institute of Geography, University of Bern, Hallerstrasse 12, 3012 Bern, Switzerland
2
Department of Geography, Federal University of Technology, Minna P.M.B.65, Niger State, Nigeria
*
Author to whom correspondence should be addressed.
Remote Sens. 2021, 13(1), 32; https://doi.org/10.3390/rs13010032
Submission received: 17 November 2020 / Revised: 22 December 2020 / Accepted: 23 December 2020 / Published: 23 December 2020
(This article belongs to the Special Issue Land Degradation Assessment with Earth Observation)

Abstract

:
The Nigerian Guinea Savannah is the most extensive ecoregion in Nigeria, a major food production area, and contains many biodiversity protection areas. However, there is limited understanding of the social-ecological features of its degraded lands and potential insights for sustainable land management and governance. To fill this gap, the self-organizing map method was applied to identify the archetypes of both proximal and underlying drivers of land degradation in this region. Using 12 freely available spatial datasets of drivers of land degradation—4 environmental; 3 socio-economic; and 5 land-use management practices, the identified archetypes were intersected with the Moderate-Resolution Imaging Spectroradiometer (MODIS)-derived land-degradation status of the region, and the state administrative boundaries. Nine archetypes were identified. Archetypes are dominated by: (1) protected areas; (2) very high-density population; (3) moderately high information/knowledge access; (4) low literacy levels and moderate–high poverty levels; (5) rural remoteness; (6) remoteness from a major road; (7) very high livestock density; (8) moderate poverty level and nearly level terrain; and (9) very rugged terrain and remote from a major road. Four archetypes characterized by very high-density population, moderate–high information/knowledge access, and moderate–high poverty level, as well as remoteness from a major town, were associated with 61.3% large-area degradation; and the other five archetypes, covering 38.7% of the area, were responsible for small-area degradation. While different combinations of archetypes exist in all the states, the five states of Niger (40.5%), Oyo (29.6%), Kwara (24.4%), Nassarawa (18.6%), and Ekiti (17.6%), have the largest shares of the archetypes. To deal with these archetypical features, policies and practices that address increasing population in combination with poverty reduction; and that create awareness about land degradation and promote sustainable practices and various forms of land restoration, such as tree planting, are necessary for progressing towards land-degradation neutrality in the Nigerian Guinea Savannah.

1. Introduction

With increasing global population, environmental change, and competing claims on land, the need to maintain land productivity and reduce land degradation has become even more critical. Various global initiatives reflecting this urgency include the United Nations Convention to Combat Desertification (UNCCD) goal of achieving a Land-Degradation Neutral (LDN) World [1]; the African Forest Landscape Restoration Initiative (AFR100) aiming to restore 100 million hectares of land in Africa by 2030 [2]; and the Great Green Wall Initiative across the Sahel [3]. Yet, land degradation (LD), i.e., the persistent reduction (negative trend) or loss of the biological productivity or ecological integrity of land or its value to humans, remains a diverse and complex issue [4,5].
The African Savannah is among the globally threatened landscapes [6], where climatic and edaphic conditions, as well as human activities, constrain vegetation regeneration [7,8]. In West Africa, the savannah ecozones are prone to LD and experience both anthropogenic and non-anthropogenic pressures [7,9]. These expose its 353 million inhabitants and their livelihoods to various impacts such as decline in ecosystem services, food insecurity, migration, and civil conflict [8]. In Nigeria, LD cases across its agroecological zones are mostly triggered by a singular factor or a combination of factors, which include: desertification, deforestation leading to biomass loss, land pollution caused by oil spillage and illegal mining, as well as extensive soil erosion [10]. Thus, agroecological zones like the Nigerian Guinean Savannah (NGS) are experiencing pressures from urbanization, agricultural expansion and an increasing population that is largely dependent on land resources for livelihoods [11,12]. The NGS, covering 49% of Nigeria, is widely degraded, its ecosystem services continue to decline, and livelihoods remain precarious [11,12]. Unsustainable land use and climate stress have been implicated in this widespread degradation [11,13,14,15]. While the indicators of LD drivers, their interplay, and implications at scale are generally acknowledged [14,16], there is a lack of knowledge of the constellation of factors characterizing specific degraded landscapes, such as the NGS, and their interplay [11]. The explanations of several studies in the NGS on LD drivers are often without an integrative perspective capable of exposing the interactions between potential LD drivers [16,17].
Recent studies thus stress the need for an integrative approach to enable a better understanding of the constellation and interplay of LD drivers in land systems [14,17]. One such integrative approach is archetypical clustering for identifying recurrent patterns in land conditions [18,19]. Archetypes, i.e., patterns or processes that occur repeatedly across space and time [19,20], have been found to provide a more holistic understanding of land system processes [20]. This understanding enables comparability across cases and helps identify strategic policy options to address land management across scales [18,19,20]. Archetype studies have been conducted on food security in the Peruvian Altiplano [21]; institutional analysis and climate change in the Peruvian Andes [22]; national analysis of ecosystem services in Germany [23]; water governance of river basins [24], and global land resources management [25]. An archetype approach thus helps to illuminate the associative patterns and influence of the complex drivers of global changes (such as LD) that have often been treated in isolation [19,20,25].
This paper thus aims to identify the characteristic patterns of social-ecological factors associated with LD in the NGS and to analyze the implications of the identified LD archetypes for land governance and sustainable land management (SLM) in the region. In the subsections, the description of the social-ecological conditions in the NGS, the study methods and hypothesis, the archetypical patterns of drivers, their thematic, and spatial characterization, including the links to different levels of LD, and the implications of the archetypes for land governance and SLM in the NGS are presented.

2. Materials and Methods
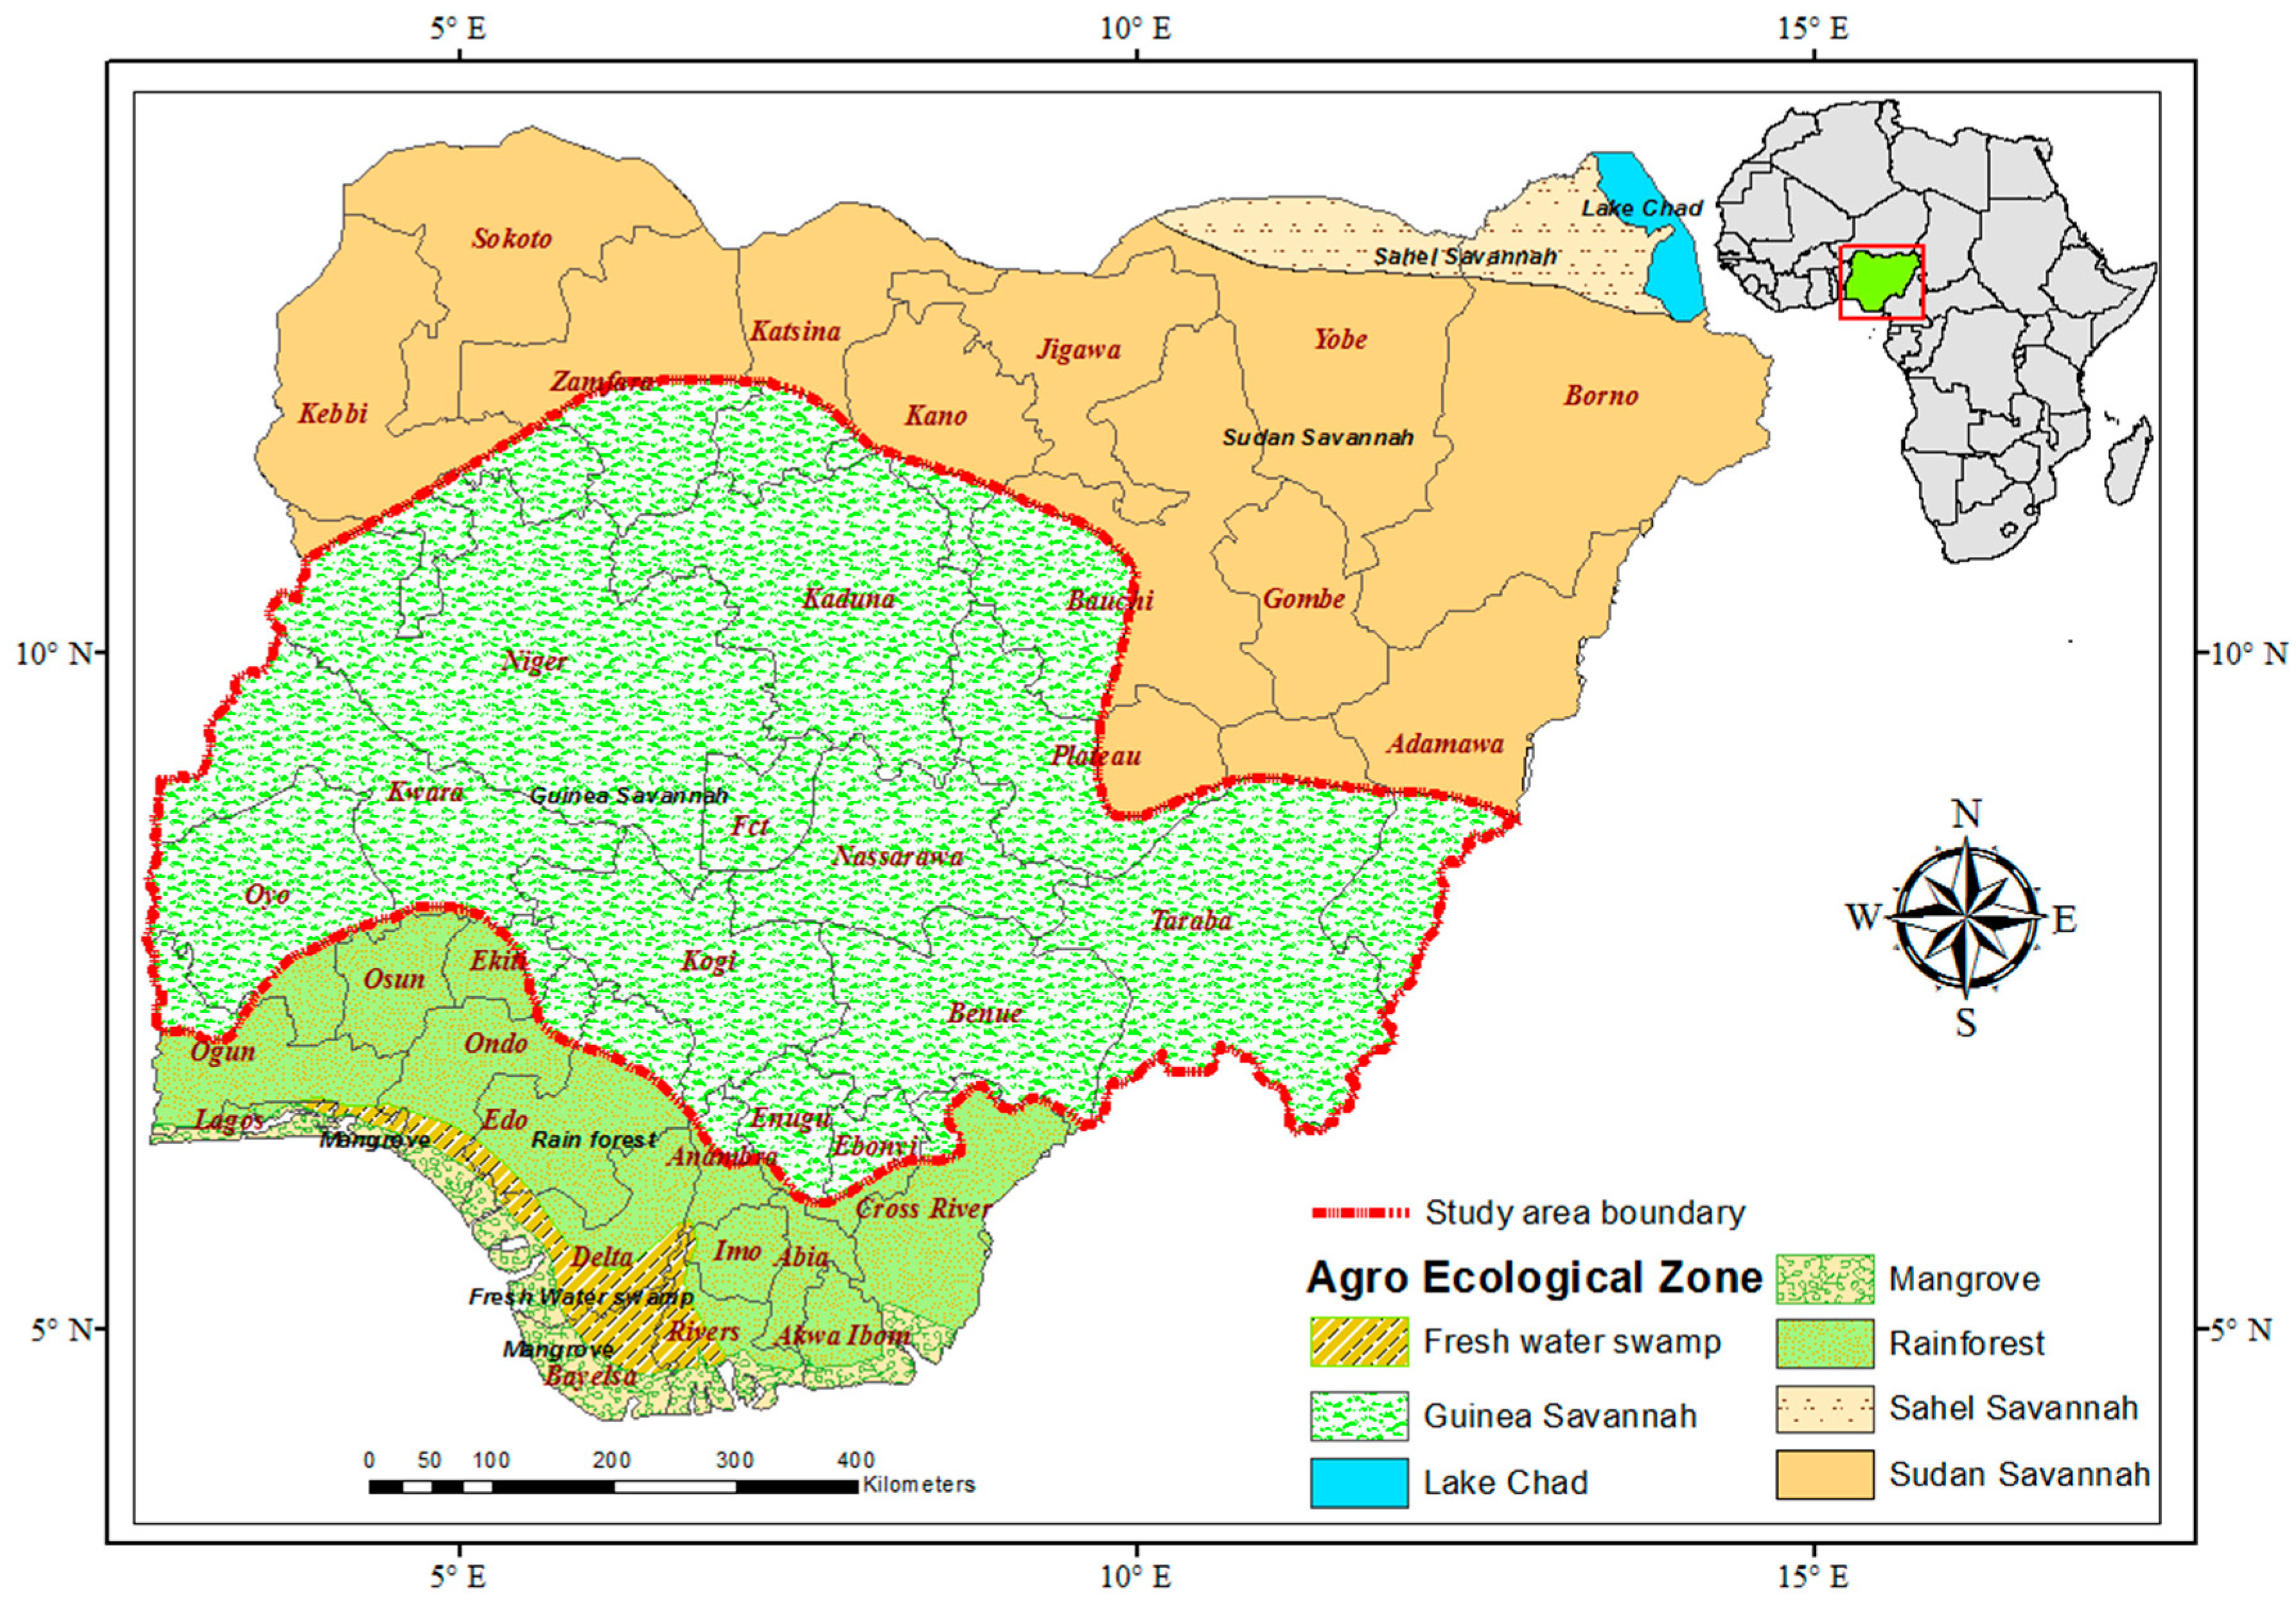
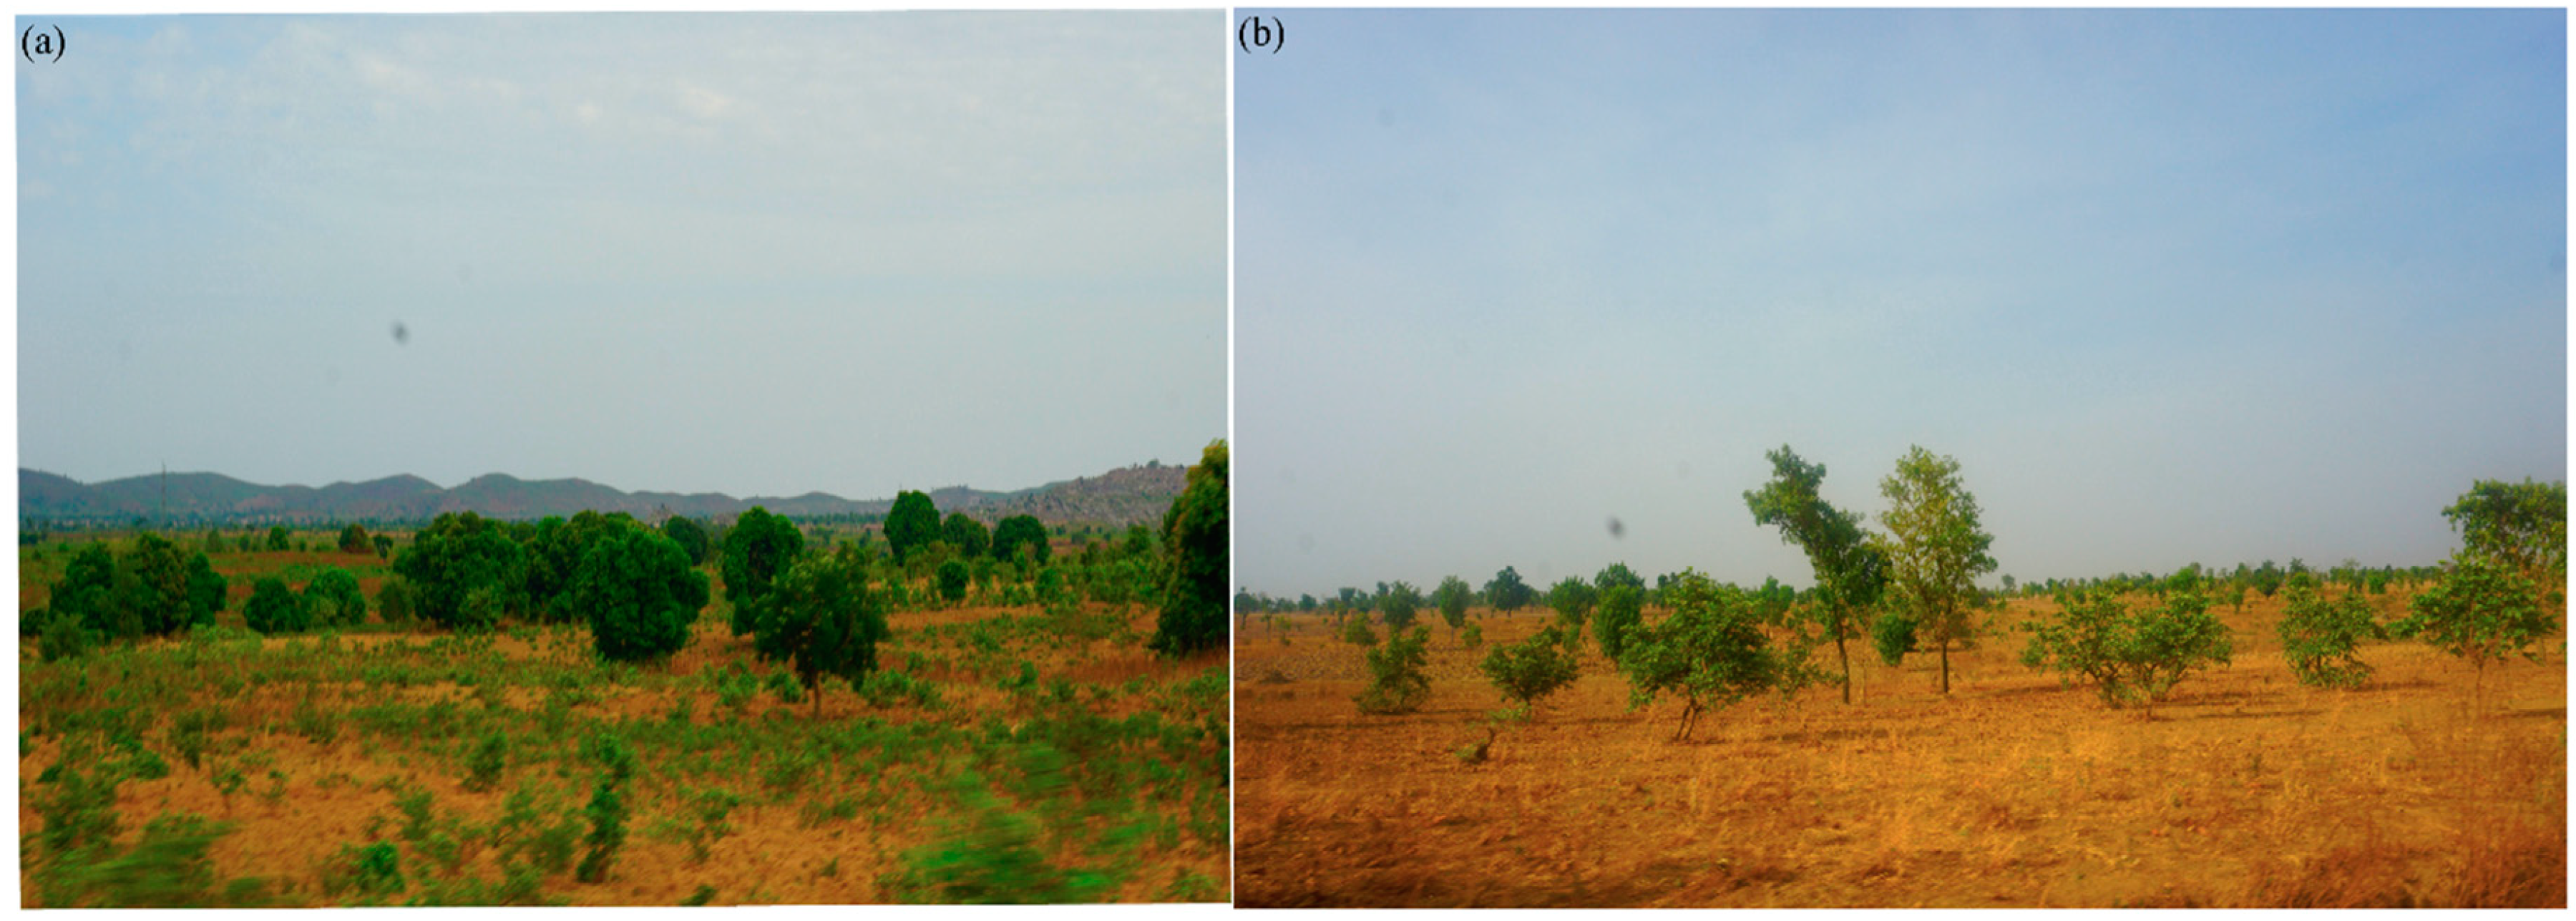
2.1. Study Area

The Nigerian Guinea Savannah (NGS) (Figure 1 and Figure 2) is an ecological region found between 6.50°N and 9.62°N, 2.77°E and 13.18°E. Occupying central Nigeria, it is the country’s most extensive ecological zone, referred to as the Middle Belt of Nigeria. The zone consists of parkland savannah, gallery forests, and derived savannah, including distinctive montane vegetation [26], with tropical dry and wet seasons. Rainfall in the wet season (April to October) is about 1240–1440 mm. The dry season lasts from November to March [27]. Average maximum annual temperature varies from 31 °C to 35 °C while the average minimum ranges from 20 °C to 23 °C [27]. The region is broadly divided into two sub-regions based on distinctive vegetation types, namely the Southern and Northern Guinea Savannahs. The Southern Guinea Savannah has taller trees, such as locust bean tree (Parkia biglobosa), and grasses such as Gamba grass (Andropogon gayanus); while the Northern Guinea Savannah is characterized by bush with some trees (e.g., Isoberlinia spp.) and relatively shorter grasses (e.g., Hyparrhenia spp.) [27]. The NGS has a high level of fauna and flora and hosts major perennial rivers such as River Niger and River Benue. Subsequent years of uncontrolled deforestation and poor land management has transformed the zone largely into a degraded landscape (Figure 2) [12].

2.2. Framing Land-Degradation Drivers

In this study, LD drivers were understood as determinants, i.e., reasons, factors, or actions, shaping the rate of human activities, leading to a decision to remove or reduce vegetation cover thereby causing a decline or loss of land resources’ productivity [14,28]. Factors prompting LD are broadly categorized either as proximal or underlying drivers [16,17,29]. Proximate drivers are human activities or immediate actions, including the decision to directly use or alter the land cover [14]. Underlying drivers include indirect or underpinning factors, such as socio-economic factors (e.g., poverty) and biophysical factors (e.g., topographic variables) that trigger proximate causes of LD [14]. Based on literature [17,28,29] and a report on the LDN target for Nigeria in 2018 [30], three main categories of LD drivers of the Nigerian Guinea Savannah Archetypes (NGSA) namely: environmental, socio-economic, and land-use management practices were identified. Based on the available spatial and remote sensing data, 12 drivers comprising three environmental, four socio-economic, and five land-use management practice categories were selected (Table 1a–c). The processes through which the variables (whether as proximate or underlying drivers), drive the LD are explained in Table 1a–c.

2.3. Datasets Selection

For this study, factors were considered based on their influence on land-use decisions and LD [16,29,31] (see Table 1 for details). Climatic variables such as rainfall were not included because human-induced activities are the prevailing cause of LD, especially in the NGS [11,12]. However, human-induced drivers are better managed than climatic drivers of LD [11,32].

2.3.1. Land-Use Management Practices

Land-use management practices have been linked to degraded land in Nigeria through land clearing and conversion including intensification [13]. Other unsustainable land-use management practices include rapid agricultural expansion, uncontrolled bush burning, deforestation, excessive wood extraction, unplanned infrastructure extension, and urban development, including overgrazing [12,13,33]. For this study and based on spatial data availability, data on land-use management practices were acquired and processed, respectively. The fire-occurrence density was derived from the National Aeronautics and Space Administration (NASA) active fire hotspot data of 2018 (firms.modaps.eosdis.nasa.gov) after running a spatial point-density analysis of the active fire spots at 250 m resolution. The livestock grazing intensity data for 2005, developed by Harvest Choice in 2018 (www.ifpri.org/project/harvestchoice) was used. The generated distance to the major road in 2016 for Nigeria, at a resolution of 3 arc-second (approximately 100 m at the equator) was acquired from (www.worldpop.org/project/categories?id=14) [34]. The Euclidean distance analysis of the extracted major town polygons from Google Earth (www.google.com/earth/) was used to determine the distance to major towns at 250 m resolution. Using the International Union for Conservation of Nature (IUCN) recognized protected area polygon for Nigeria (www.protectedplanet.net/country/NGA), the density of the protected area at 250 m resolution across the NGS was generated through point-density analysis.

2.3.2. Socio-Economic Drivers

Demographic and socio-economic factors such as population density, income, poverty, and illiteracy are drivers of LD in certain contexts [16,29]. In other contexts, they may even be drivers of improved land conditions [35]. However, in the case of Nigeria, its over 200 million inhabitants and population density of 226 km2 place a huge demand on land resources [33,36]. Thus, gridded human population density constructed for 2018 in 2020, from random forest-based dasymetric redistribution at 3 arc-second (approximately 100 m at the equator) spatial resolution, was downloaded from www.worldpop.org [34]. Male and female literacy layers of high resolution at 1 km × 1 km gridded cells developed for 2003 in 2017, based on a geostatistics approach [37], were acquired [34]. These are necessary as they are proxies for access to agricultural extension information, as previous studies show that limited information on SLM drives LD [16,38]. The poverty headcount in percentages for Nigeria at 1 km for 2013 mapped through Bayesian model-based geostatistics analysis was downloaded from www.worldpop.org [34], because poverty can foster practices that cause LD, while LD can foster a poverty trap [38]. These drivers were selected in that they are known factors that influence decisions on land and SLM LD [28,29,38].

2.3.3. Environmental Drivers

Land can be sensitive to degradation due to its environmental and physiographic characteristics, influencing human decisions to use land [31]. Such influential characteristics include soil bulk density (BD), elevation, and slope [13,39]. For this study, the already-processed NASA Shuttle Radar Topography Mission (SRTM) based slope and elevation for Nigeria by [40] at a resolution of 3 arc-second (approximately 100 m at the equator) produced for 2020 was acquired from www.worldpop.org [34]. The spatial mapping of the bulk density (BD; soil compaction) in 2018 at 250 m resolution from 0 cm to 30 cm depth were downloaded from www.soilgrids.org and then averaged to give the overview of the BD for the study area [41,42,43].

2.4. Methods

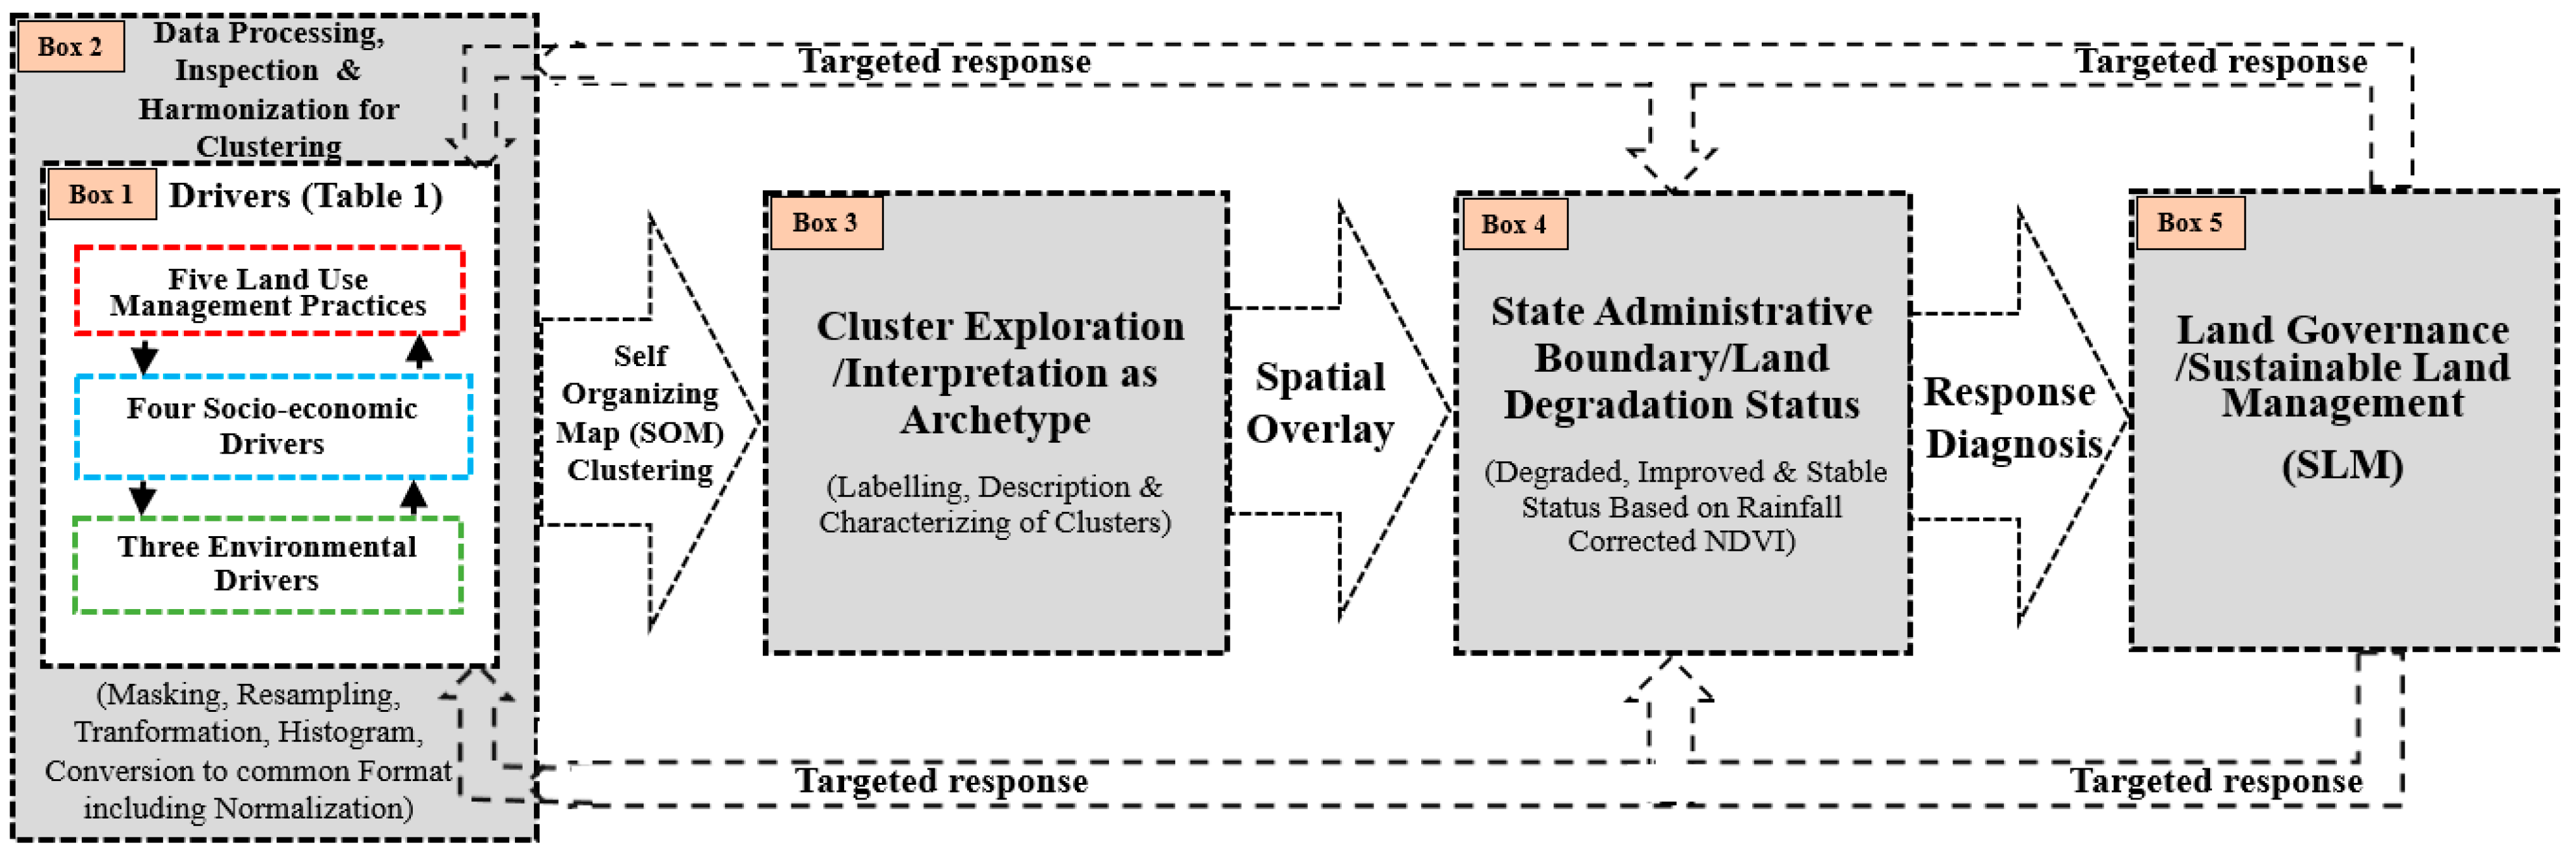
2.4.1. Conceptual Framework

The workflow in Figure 3 was applied to the 12 drivers (Table 1a–c), which served as inputs for identifying archetypes. The intermediate outputs from the framework, such as correlation between drivers including cluster features, can be found in supplementary material Figures S1–S5.

2.4.2. Identifying Archetypes of Land-Degradation Drivers Using Self-Organizing Maps

To develop the Nigerian Guinea Savannah Archetypes (NGSA) of LD drivers, the 12 driver datasets were clipped to the boundary outline and resampled to a 250 m pixel size, using the nearest neighbor technique (Figure 3, Box 2), and then projected to a uniform coordinate system (i.e., Minna/UTM zone 31N). To enhance the clustering of the datasets, data were normalized (Z-score) to reformate into a common scale (Figure 3, Box 2). Correlation was calculated to identify relationships between the drivers (Figures S5 and S6) and the extent of interdependencies among the dataset that might limit the analysis. Then the Kohonen Self-Organizing Map (SOM) technique was applied to generate a single-layer map of the archetypes of LD drivers [54]. The SOM approach involves organizing data (in this case, the 12 spatial datasets) into patterns based on their inherent similarities and dissimilarities into different groups [54,55]. By testing the different combinations of clusters and using a performance analysis involving both the Davies–Bouldin index and the mean distance of the classified grid cells [23,25], nine clusters of LD drivers were identified as archetypes (see supplementary material, Figures S2–S5). The Z-score, i.e., standardized score from the SOM, was used to examine values of each driver in terms of distance from the mean and to explain the clusters. A Z-score that is equal to the mean is zero, while positive and negative Z-score, i.e., greater than or less than zero, depict distance way above or below the mean. Through an ordinal scaling, the relative standing of the Z-score from the mean was ranked. If the Z-scores = 0, this implies mean/low influence of a driver; Z-score ≤ ±1 = moderate influence; ±1 < Z-score < ±2 = high influence; and Z-score ≥ ±2 = very high influence, respectively (Figure 3, Box 3). From the absolute values of the Z-scores of each cluster, the percentage dominance categories in the clusters were determined [23] (Figure 3, Box 3).

2.4.3. Linking Archetypes of Land-Degradation Drivers to State Administrations and Land Status

In a previous study by [11], LD status was captured using rainfall-corrected vegetation greenness as a proxy (Figure 3, Box 4). By overlaying the archetypes cluster (Figure 3, Box 3) with the LD status of the area (i.e., degraded, stable, and improvement) (Figure 3, Box 4), the percentage share of each archetype per LD status was determined. This enabled the grouping of the nine archetypes as undergoing large-area or small-area degradation, respectively. Thus, archetypes with area coverage <10% of the total degraded area have a small-area degradation, while archetypes with area coverage ≥10% of the total degraded area are classified as large-area degradation clusters [56]. Through spatial overlay [23], the linking of the archetypes with the states’ administrative boundaries to determine the share of each archetype per state was possible (Figure 3, Box 4). The emerging results were used to explain and discuss the implications for land governance and SLM in the NGS (Figure 3, Box 5).

3. Results

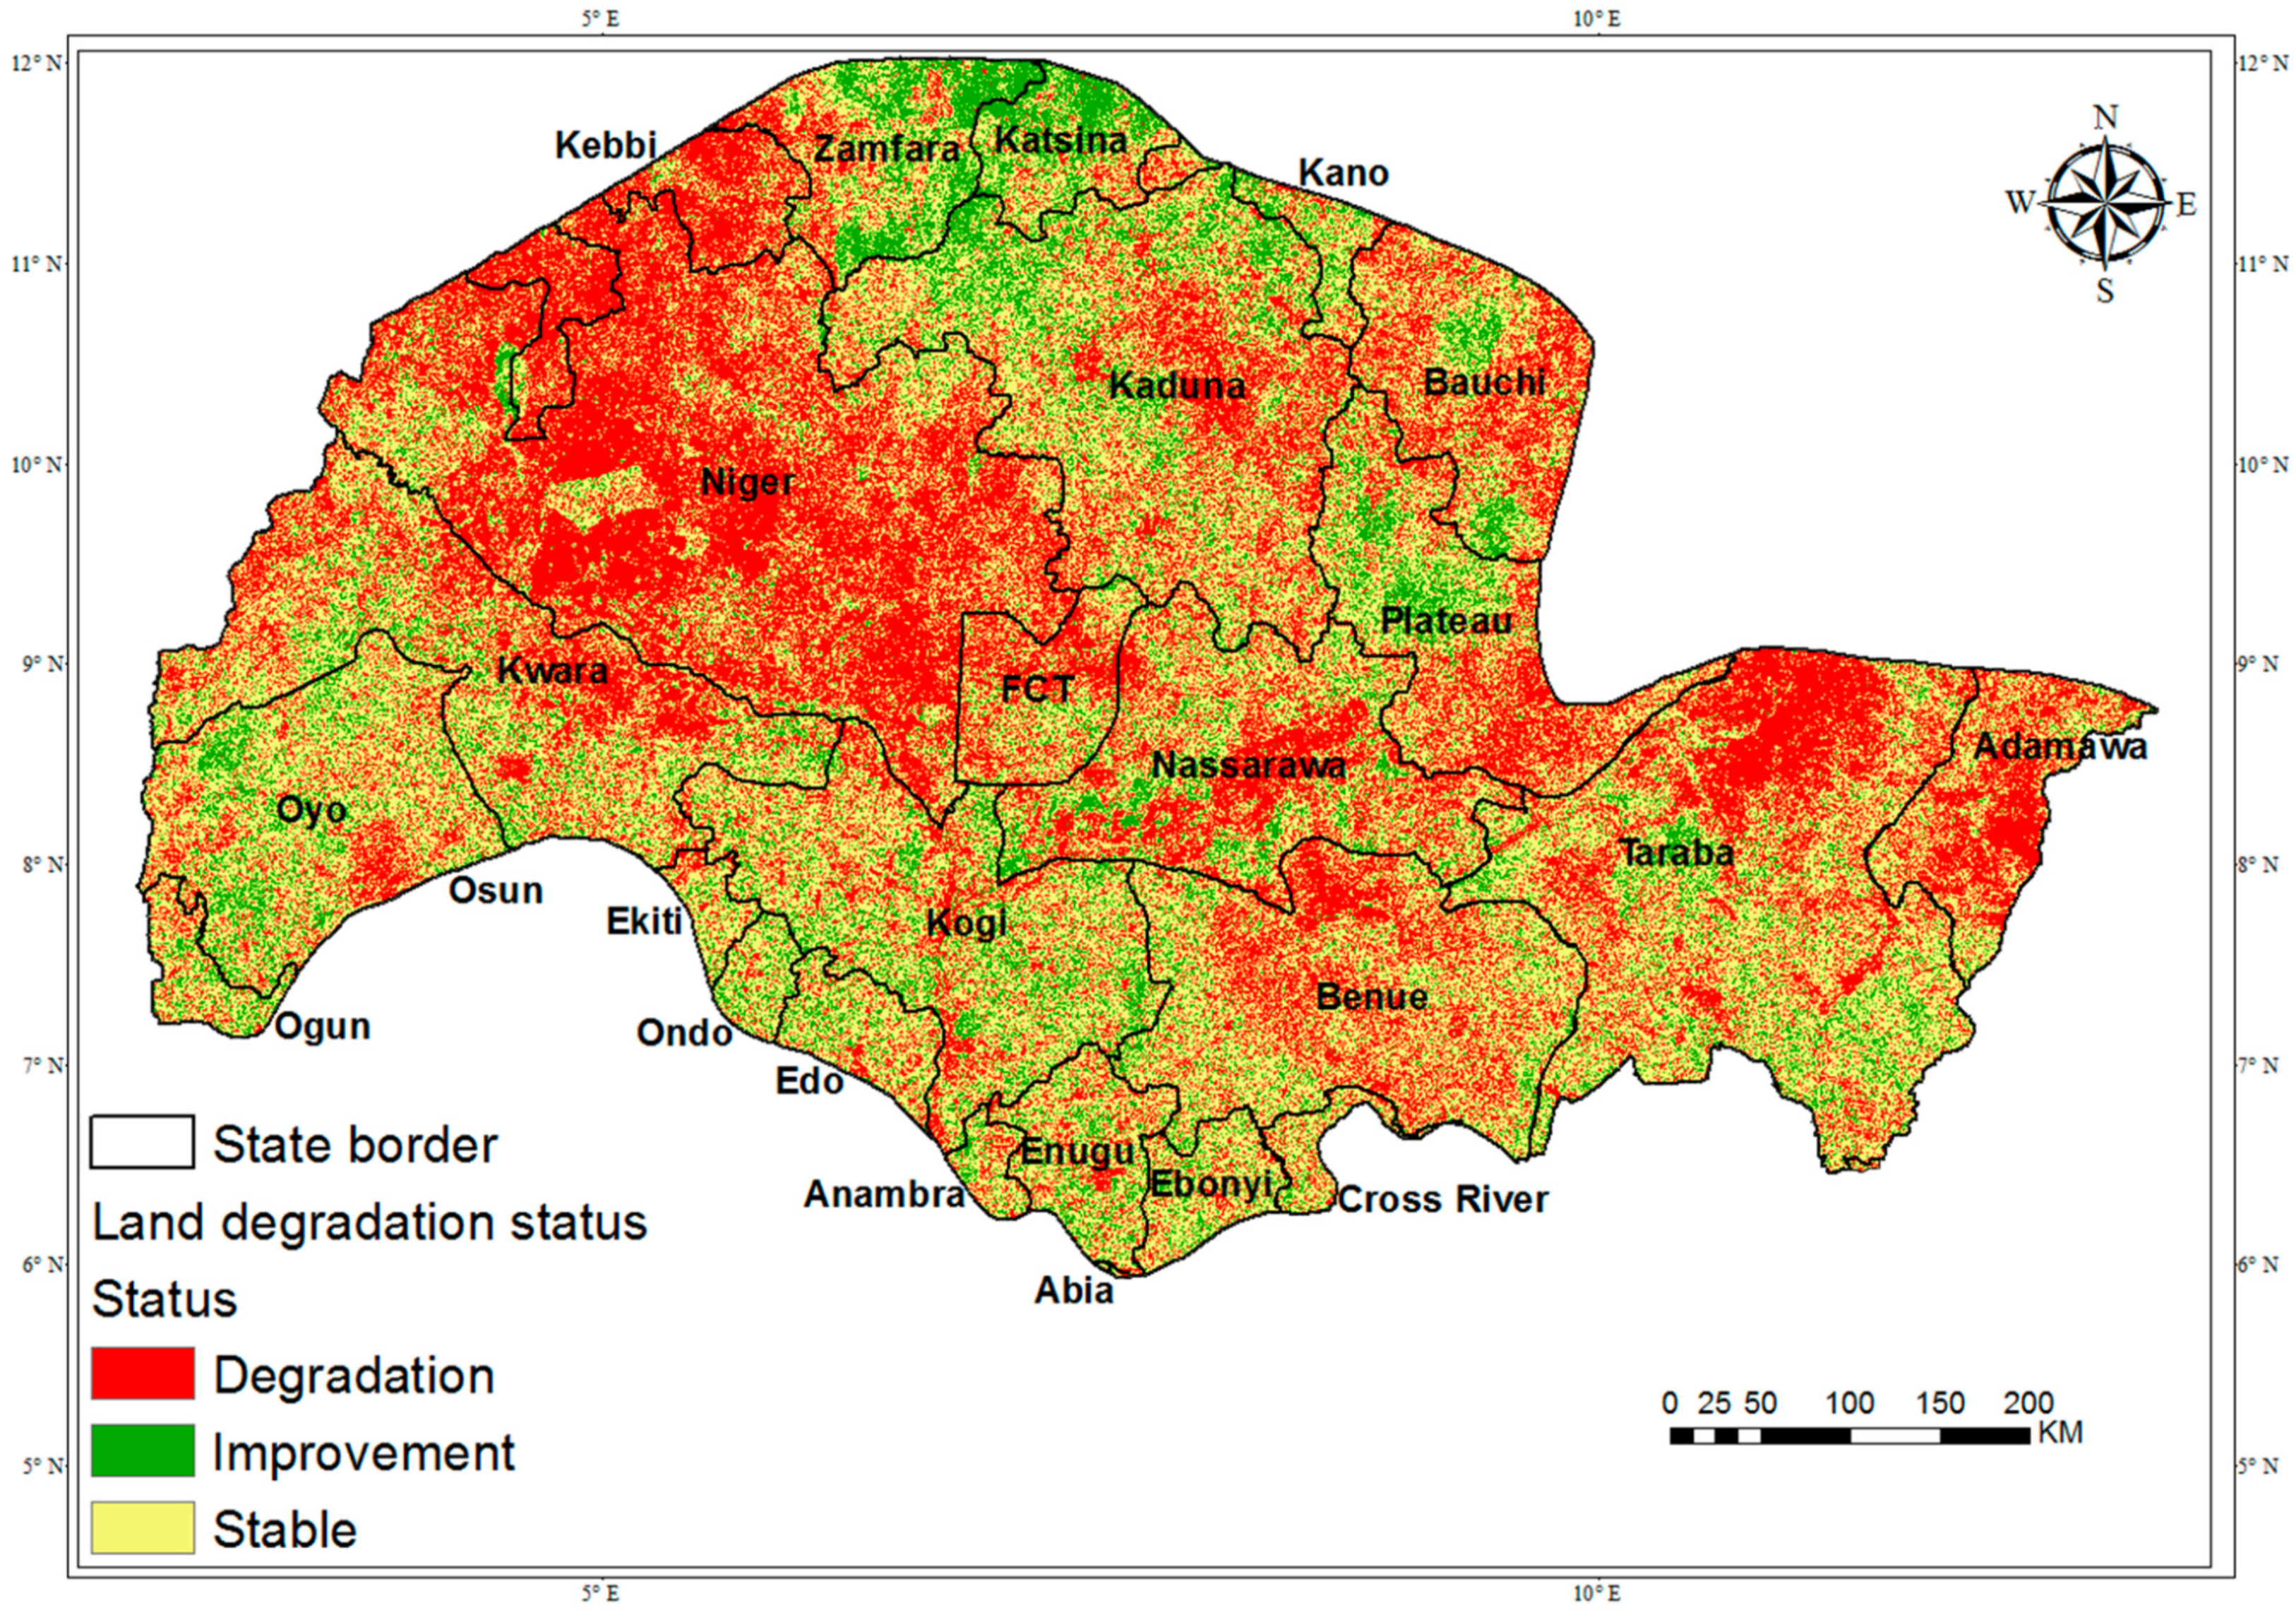
3.1. Land-Degradation Status

Using Normalized Difference Vegetation Index (NDVI) as a proxy for degradation status, Figure 4 shows the spatial distribution of LD in the NGS by [11]. About 38% (251,401 km2) of the NGS is degraded, while 14% (91,258 km2) and 48% (319,470 km2) show improvement and remain stable, respectively. While improved and stable areas are mostly found in the north of the NGS and to a certain extent in the south of the NGS, large-area degradation is predominantly found in the centre of the NGS, ranging from its north-western to its eastern border.

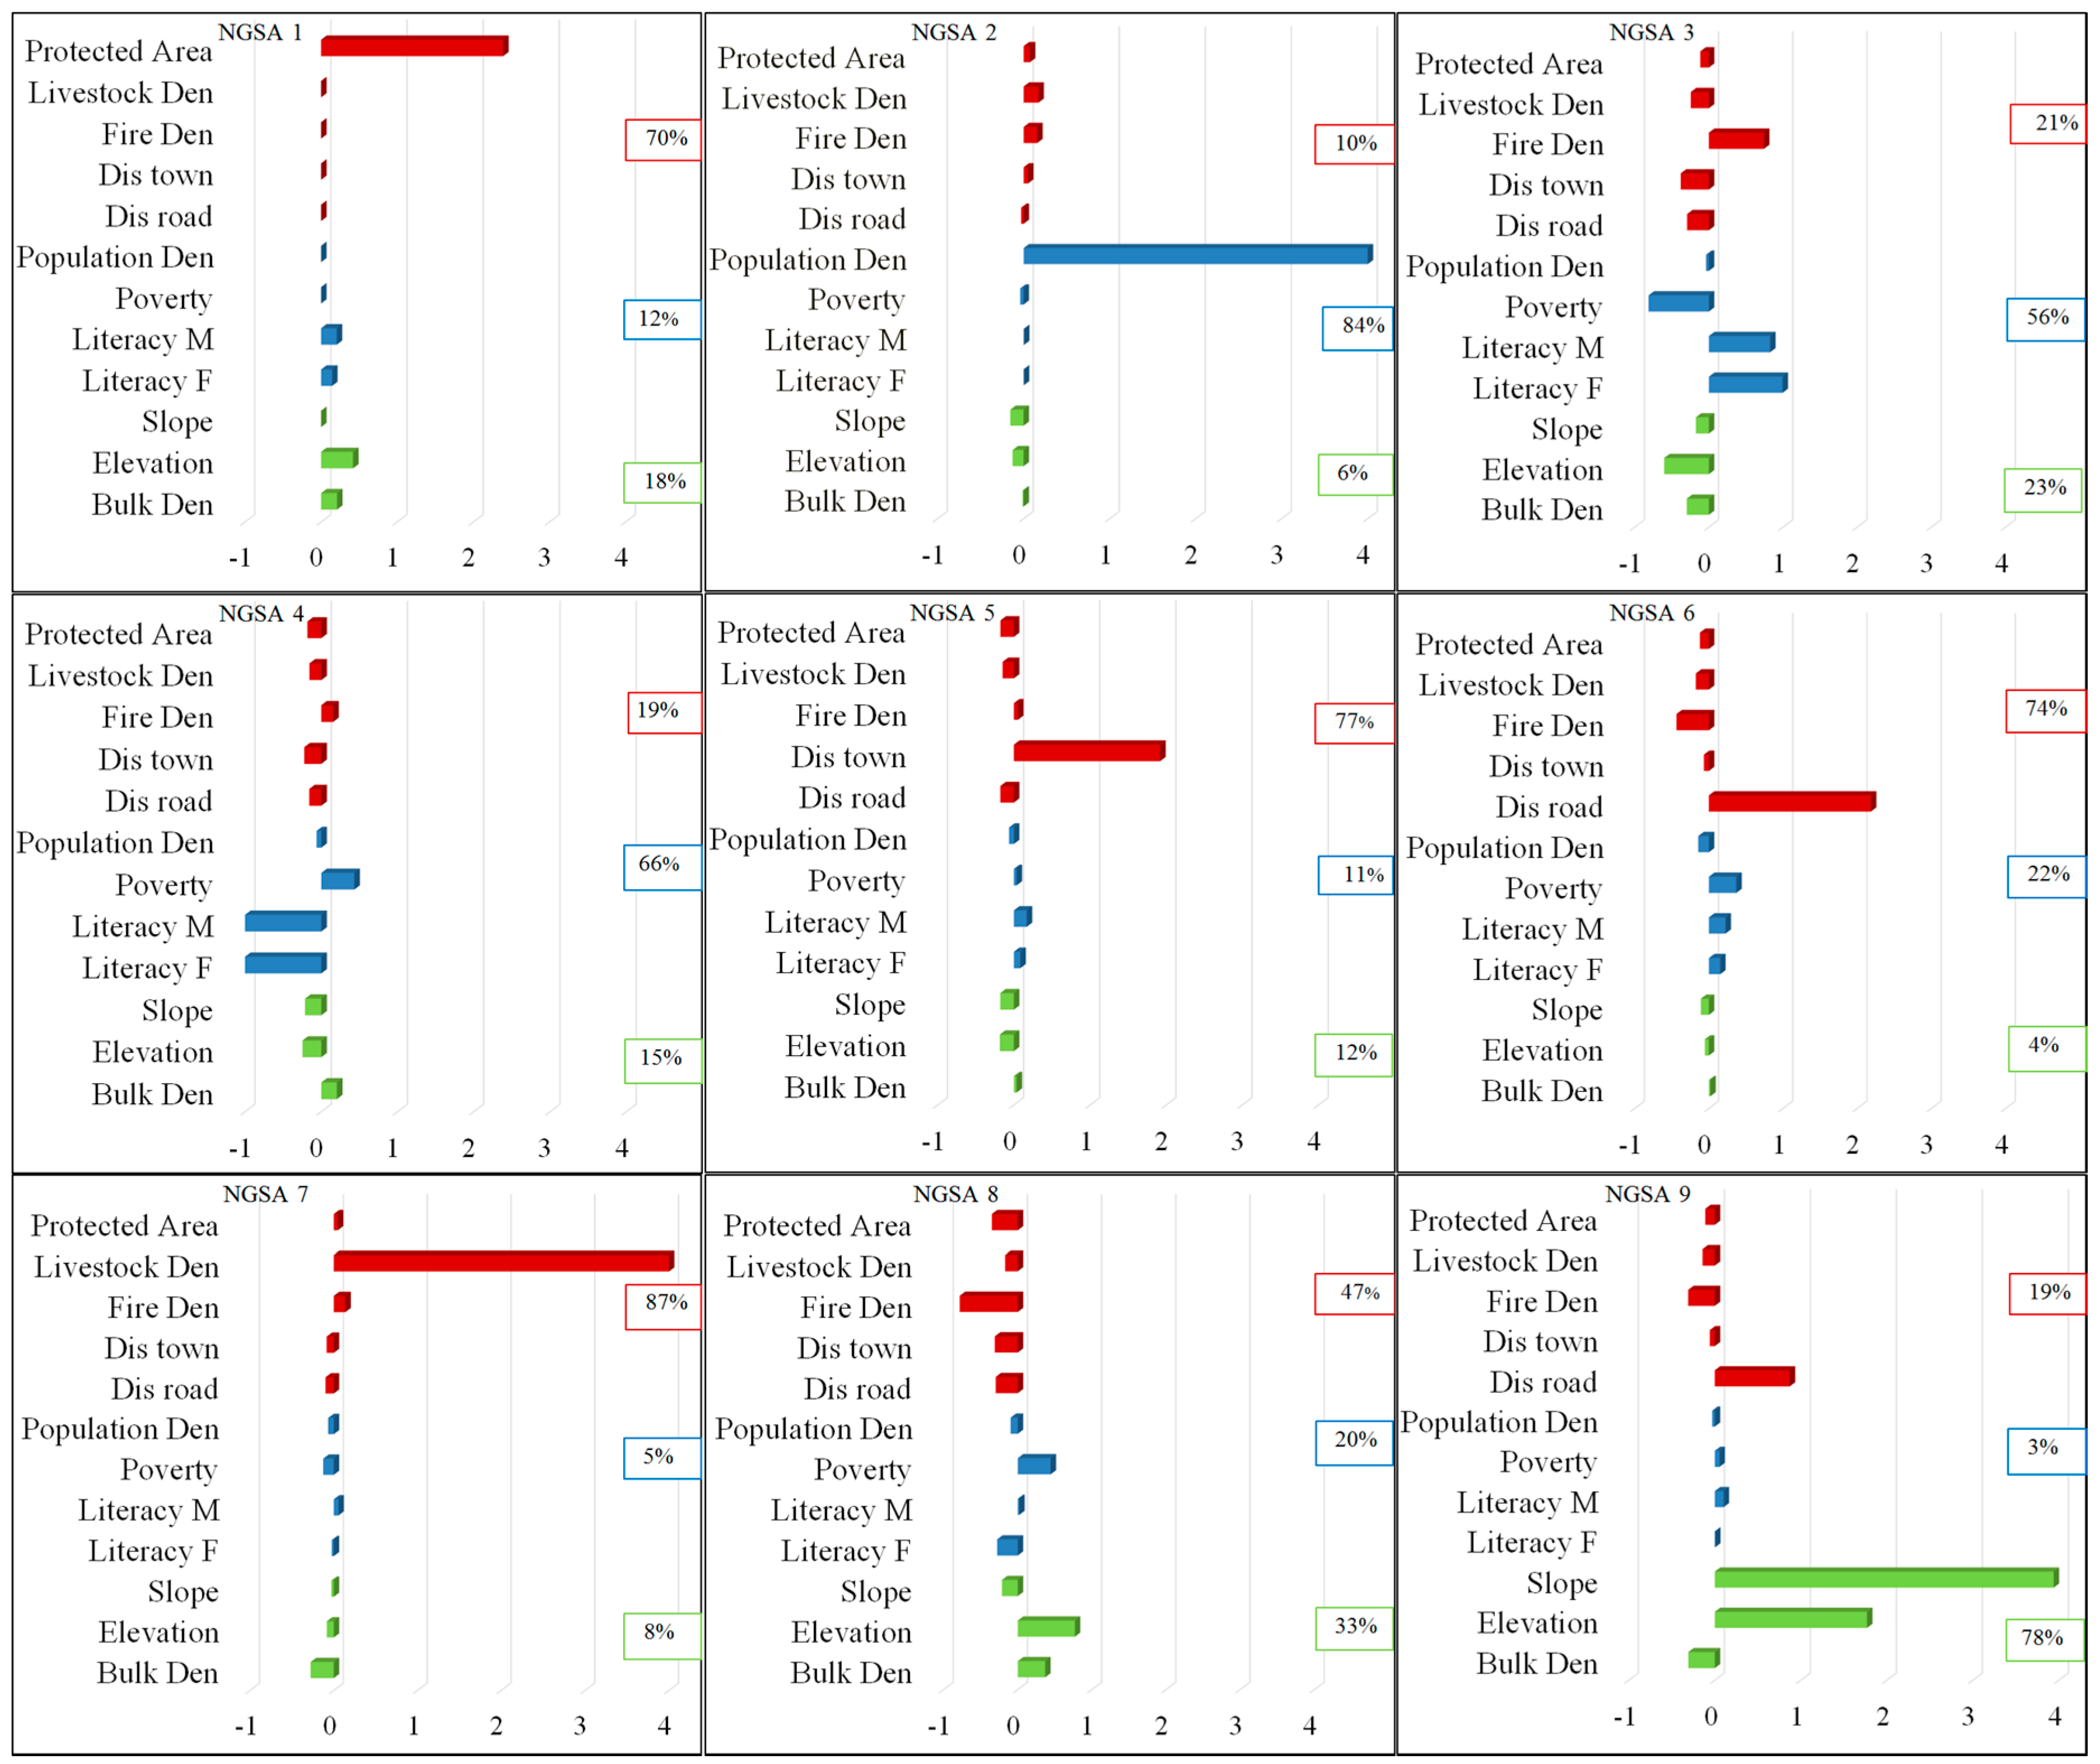
3.2. Land-Degradation Archetypes

In this section, the archetypes and how they can improve the understanding of LD in the NGS are presented. Figure 5 displays each archetype according to the percentage contributions of driver categories, while Figure 6 shows the spatial distribution of the archetypes. Based on the 12 input drivers, nine archetypes of LD drivers were identified (Figure 5). Five archetypes were dominated by land-use management practices (NGSA 1, NGSA 5–8), and three dominated by socio-economic drivers (NGSA 2–4), while NGSA 9 was dominated by environmental drivers (Please refer to supplementary material, Table S1 for a description of the archetypes).

3.3. Spatial Distribution of Archetypes

The spatial distribution of the nine archetypes of LD drivers is shown in Figure 6. In Table 2, a brief description and share of each archetype in the NGS is provided.
From Table 2, six clusters (NGSA 2–5, NGSA 7 and NGSA 9) with individual total areas greater than 10% cover 78.5% of the total area, while the remaining three archetypes with individual total areas smaller than 10% of the area cover 21.5% of the NGS.

3.4. Categories of Archetypes According to State Administrative Boundaries and LD Status

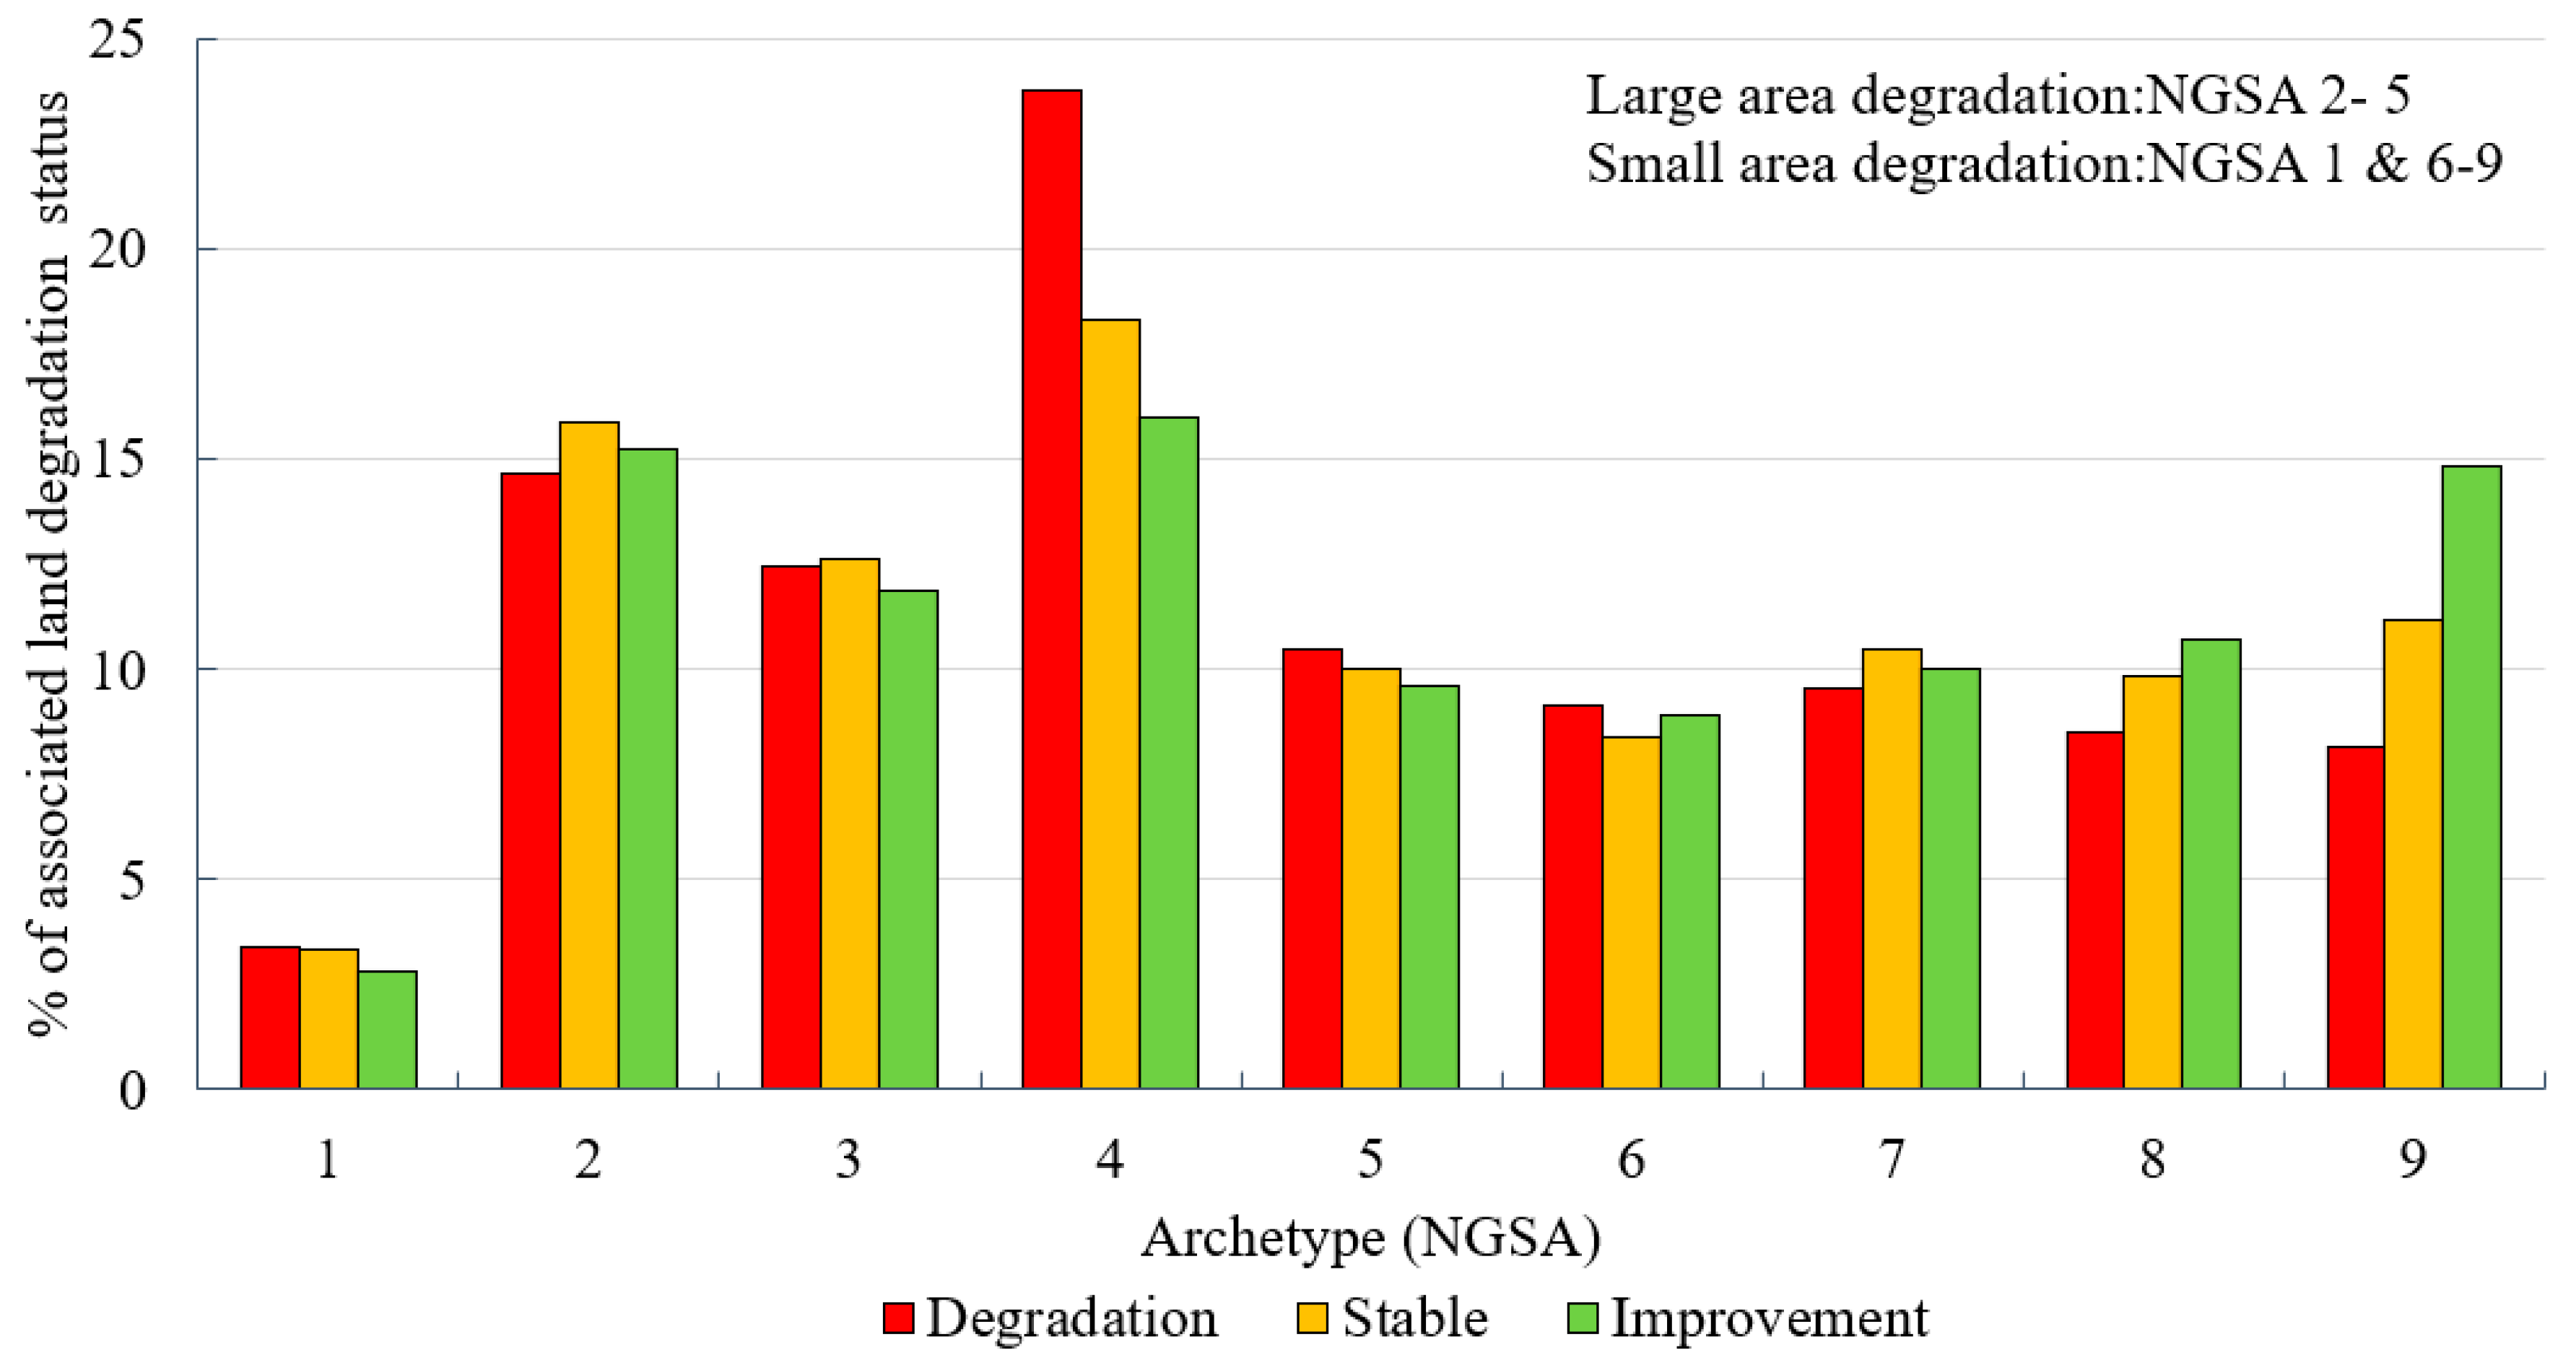
3.4.1. Degree of Land-Degradation Status per Archetype

Figure 6 links the archetypes with the LD status (degradation, stable, improvement; Figure 4), to highlight their proportions and potential interplay (Figure 7). Four archetypes with very high population density (NGSA 2), moderate–high information/knowledge access (NGSA 3), and moderate–high poverty level (NGSA 4), as well as NGSA 5—very remote from a major town—are associated with 61.3% of the large-area LD, while the other archetypes account for 38.7% of small-area degradation (Figure 7). Six archetypes—NGSA 2 to NGSA 5, as well as NGSA 7, with very high livestock density, and NGSA 8 with dominant land-use management practices and nearly level terrain—are responsible for 78.4% of the large-area stable status and the other archetypes for 21.6% of the small-area stable status (Figure 7). For the large-area improvement, six archetypes, NGSA 2 to NGSA 4 and NGSA 7 to NGSA 9 with rugged terrain, i.e., very high slope and moderate elevation, covered 78.7% while other archetypes account for 21.3% of small-area improvement (Figure 7). For the complementary table, see supplementary material, Table S3; and Section 6 for the full description and ranking of the archetypes in relation to LD status.

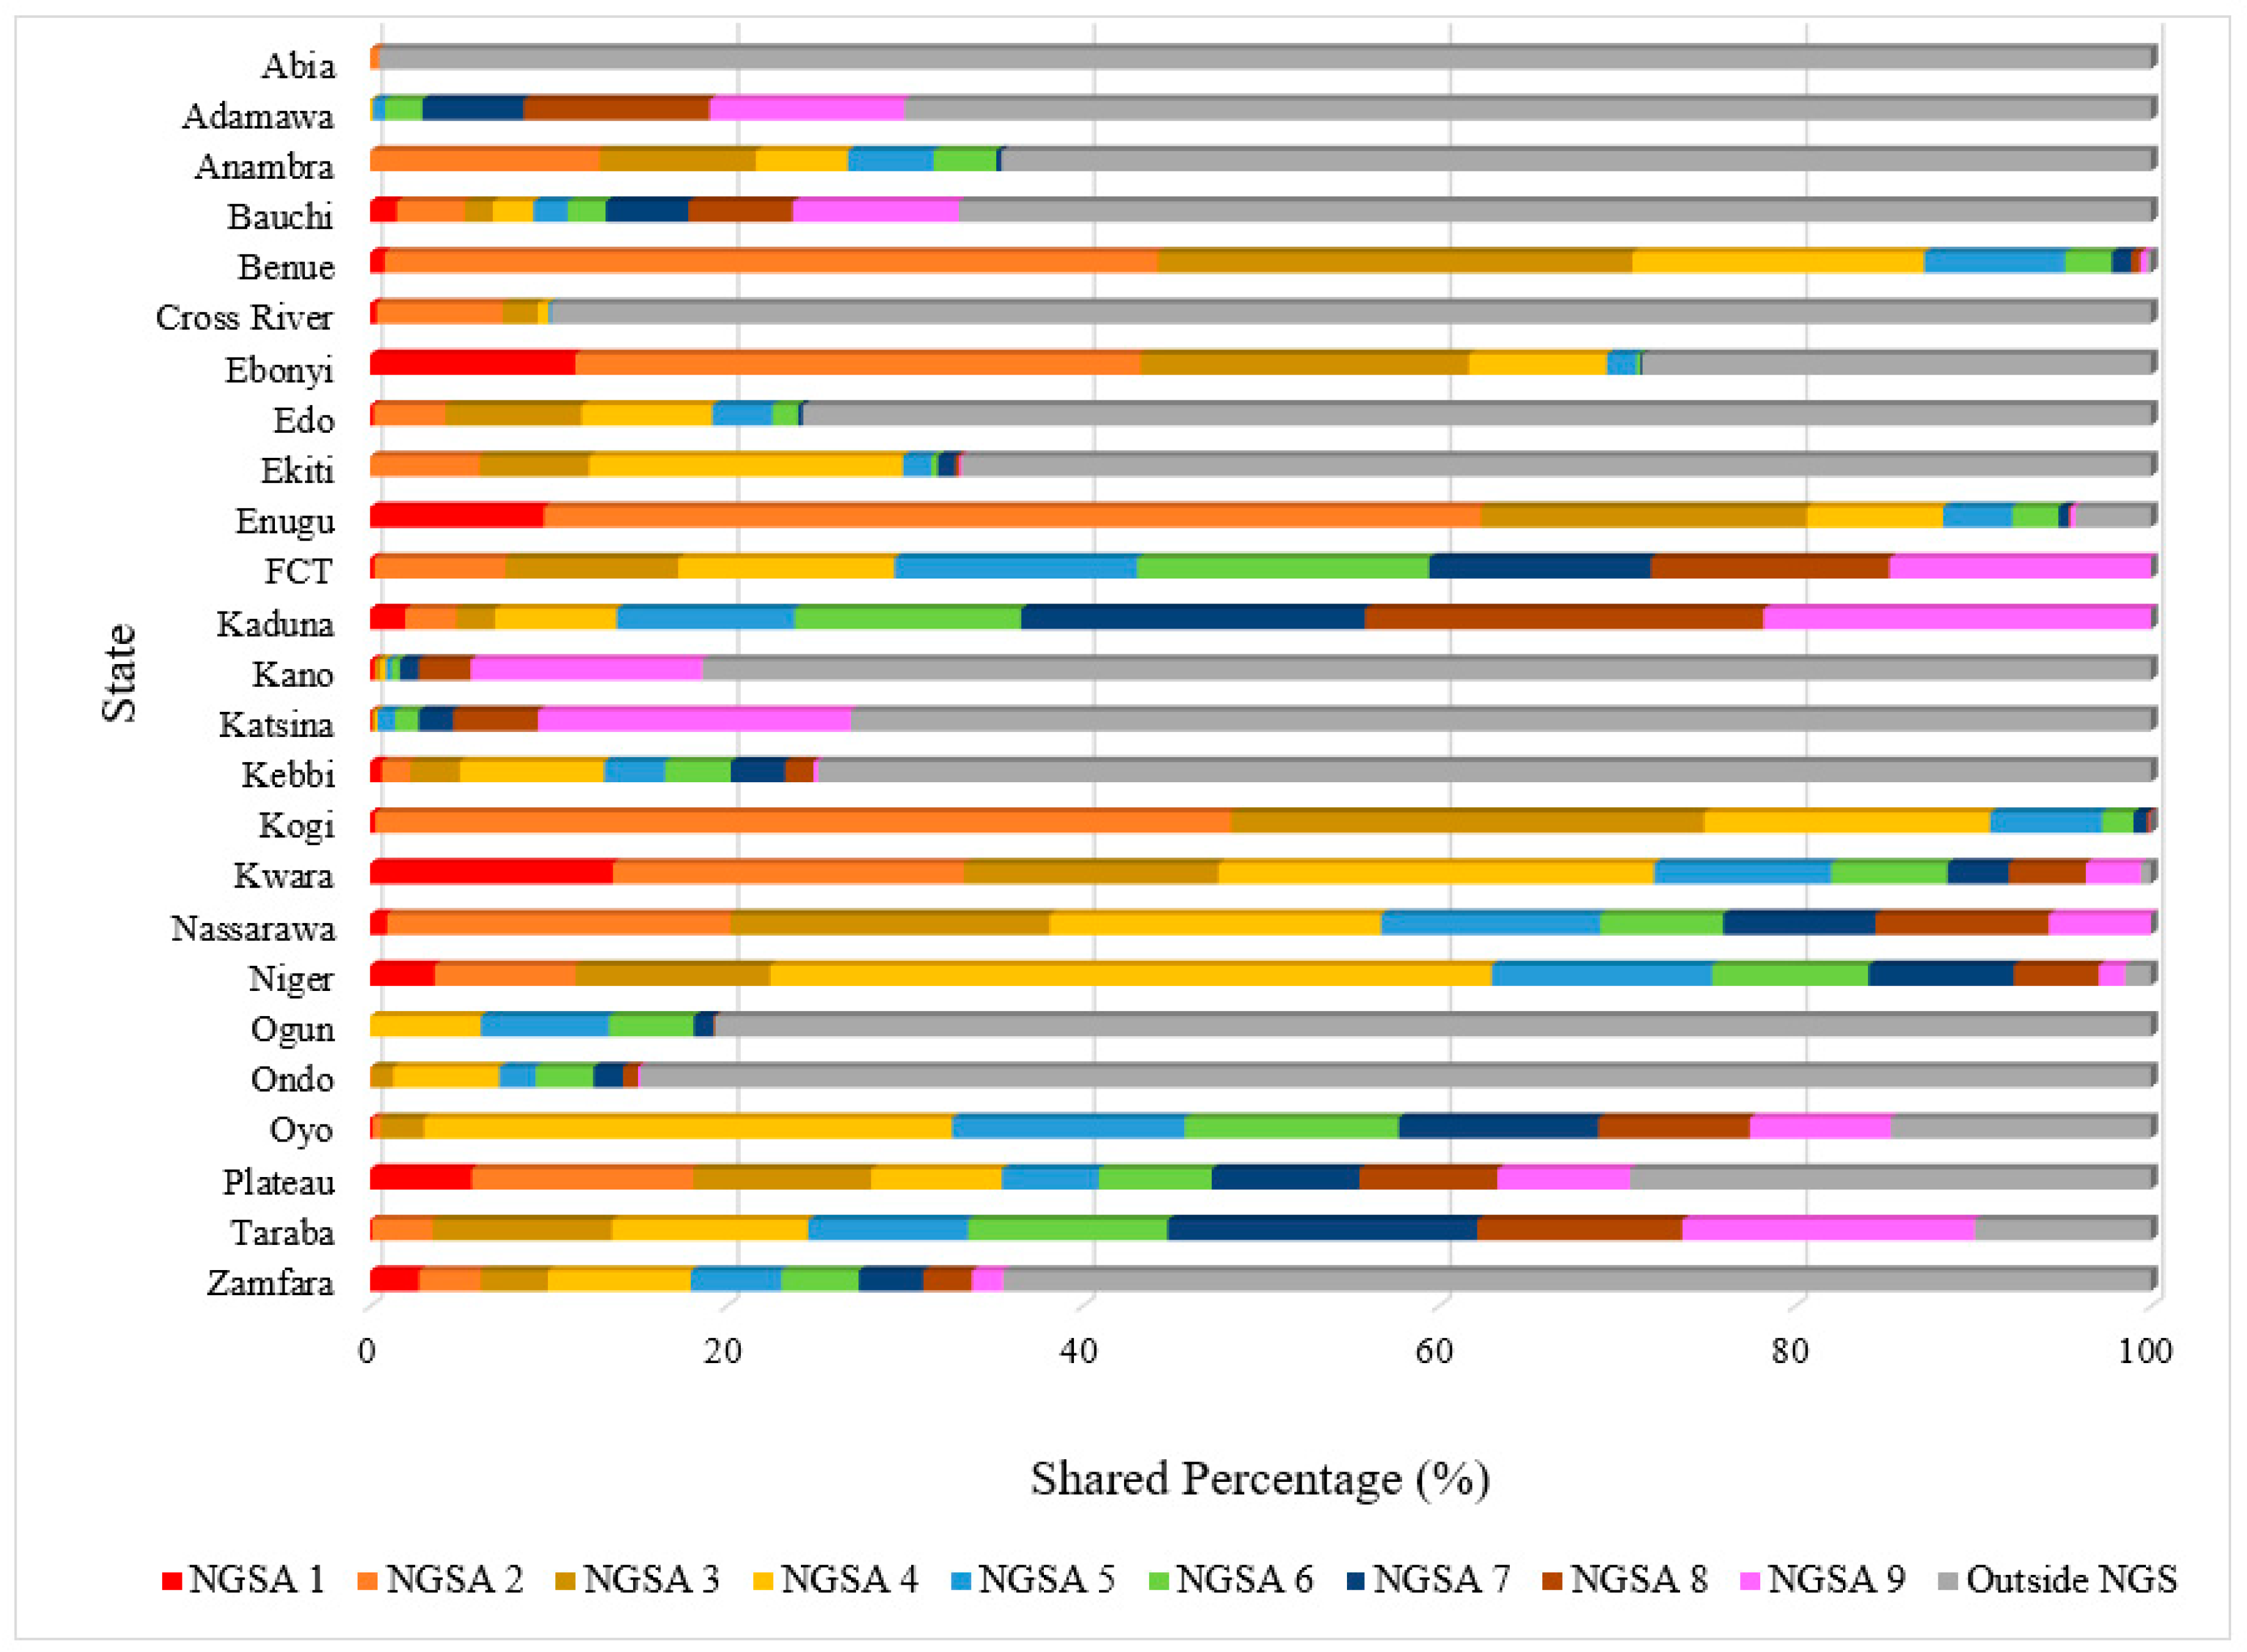
3.4.2. Share of Land-Degradation Archetypes per State Administration Unit

State administrations manage land within their jurisdictions, hence they influence land-use decisions in Nigeria. Figure 8 shows the percentage share of the archetypes within a state’s boundary (for the complementary table, see supplementary material, Table S2). Seven states, comprising Bauchi, Kaduna, Kwara, Nasarawa, Niger, Plateau, and Zamfara have all the nine archetypes. While four states, namely Benue, Kebbi, Taraba, and the Federal Capital Territory (FCT) are covered by eight of the nine archetypes. The remaining states have an uneven combination of all archetypes, with the portion of Abia state found within the NGS only embodying one archetype (i.e., NGSA 2). The five states comprising Niger (40.5%), Oyo (29.6%), Kwara (24.4%), Nassarawa (18.6%), and Ekiti (17.6%), have the largest shares of the archetype of NGSA 4, i.e., a moderate–high poverty level. The supplementary material Table S2 contains the grouping of the archetypes according to the state administrative units.

4. Discussion

4.1. Understanding the Archetypes of Large-Area Degradation

Areas identified to be under large-area degradation are archetypes with more than 10% of their areas experiencing biomass degradation (NDVI). Four major archetypes of large-area degradation were thus identified (Figure 5 and Figure 7). Out of these, NGSA 3, with prolonged cases of fire occurrence, and NGSA 5, with rural remoteness from a major town (Figure 5), highlight land-use management practices as the drivers of large-area degradation in the NGS. NGSA 3 thus confirmed studies that have implicated fire-related activities such as charcoal making, farming, and hunting with bush burning as causes of LD [57,58]. The dominant characteristics of NGSA 5, on the other hand, contradicts the notion that land areas closer to major towns are more prone to LD than those farther away [16,17,29]. NGSA 5 rather reveals the rural areas and natural resource users in remote areas who adopt unsustainable land-use practices (of NGSA 3), such as continuous bush burning and deforestation, trigger LD [59].
Apart from archetype NGS 5 with high remoteness from a major town (Figure 5), the other three, i.e., archetypes with very high-density population (NGSA 2), moderately high information/knowledge access (NGSA 3), and moderate–high poverty level (NGSA 4), are dominated by high percentages of socio-economic drivers. Thus, socio-economic factors are major underlying causes that indirectly push other proximate drivers of large-area degradation in the NGS [29,60,61]. With the low population density of three (NGSA 3–NGSA 5) out of the four archetypes experiencing large-area degradation, high poverty, and low literacy, this factor can be inferred to be associated with large-area degradation in the NGS context [59,61,62]. This confirms studies such as [62,63], who reported that poverty intensifies a tendency to change vegetation cover, as many people deplete natural vegetation for fuel, food, and as a source of income because of fewer or no alternative livelihood options. This invariably points to the areas with high poverty and low population density, i.e., rural population, covering the northwest central and northeast of the NGS, encompassing the states of Kebbi, Niger, parts of northern Kwara, FCT (mainly around Abuja, see the area illustrated in Figure 5), and parts of Nasarawa, Plateau, Taraba, Kaduna, and Adamawa states, which have experienced extensive degradation [11]. Although, NGSA 2 with a very high-density population, hints that urban areas, with their high population density, are also associated with large-area degradation in the NGS, the degradation is not as extensive as in the low-population-density remote areas. Therefore, this result deviates from the general notion that a high-population density is the main cause of LD in Nigeria [13,33]. Hence, a high population density alone does not drive LD without certain complementary factors, such as poverty, illiteracy that restricts information or knowledge access, and poor national policies that are prevalent in Sub-Saharan African contexts [64]. Therefore, the three socio-economic sub-drivers—poverty, literacy and population density—are core interrelating drivers in large-area LD, that require attention in addressing LD in the NGS [29,62,65].
While the percentages of land-use management practices and socio-economic factors dominate as potential drivers of large-area LD, specific environmental drivers of the archetypes also underpin the large-area LD (Figure 5). The nearly level terrain condition, i.e., low-elevation–flat terrain of the four large-area archetypes, is known to encourage land cultivation in Nigeria [13]. In addition, the characteristics of low bulk density of NGSA 2, NGSA 3 and 5, and the high bulk density of NGSA 4 with moderate–high poverty level also highlight soil characteristics that encourage large-area degradation [42,43]. The low bulk density archetypes signify few areas in the southern part of the NGS with suitable soil for cultivation. The archetypes characterized by high bulk density on the other hand correspond to areas with the highest impact of agricultural management practices, such as machinery and high cropping impacts [42]. This represents 23% of the large-area degradation archetypes, and in turn reflects the widespread LD due to the high agricultural engagement by the rural dwellers in the zone [63].

4.2. Understanding the Archetypes of Small-Area Degradation

Five archetypes of small-area degradation were identified, that is, archetypes where degraded areas are less than 10% of the archetype area. LD and their drivers thus differ locally and are context-specific [5,60], and an archetype approach can help identify the socio-ecological contexts [66]. From the five small-area archetypes, three archetypes identified with very high presence of protected areas (NGSA 1), that are very remote from a major road (NGSA 6), have a very high livestock density (NGSA 7), and have high percentages of land-use practices (Figure 5). While the NGSA 1 reflects its conservation and restricted use status, the additional association of NGSA 1 with high and rugged elevations like NGSA 9, further explains its small extent of degradation. However, with its low proximity to major roads and major towns, degradation in protected areas as captured in NGSA 1 call for an investigation into the specific activities driving degradation in protected areas, such as encroachment by human activities [11,63], despite government regulations, particularly around communities that host protected areas [67,68].
In archetypes NGSA 6 and NGSA 9, the small-area degradation is highly driven by non-proximity to a major road, without much influence of other sub-drivers (Figure 5). Nearness to major roads is a measure of infrastructural development that influences accessibility and the spread of land-use management practices, including information [69]. Thus, NGSA 6 represents remote areas with restricted access, which can hamper the propagation of sustainable land-management initiatives [29,38,49]. As in NGSA 1 and NGSA 6, the very high livestock density configuration of NGSA 7 (Figure 5) is also associated with small-area degradation (Figure 7). The Guinea savannah in particular is currently under pressure from high grazing activities because the Sahel and Sudan savannahs have been extensively degraded by overgrazing [15,70], leading to competition for grazing resources and conflicts in the region [71]. Overgrazing has been associated with the disappearance of the typical savannah vegetation and the emergence of the Sudan–Sahelian Savannah in the NGS [15,72]. Thus, from the combination of drivers above, there is a critical need for an improved management of grazing resources, protected areas, and the governance of land resources in the NGS [11,36,68]. While all small-area archetypes are mostly dominated by the land-use management drivers, NGSAs 6 and 8 are the only small-area archetypes that are distinctly driven by the socio-economic drivers characterized by areas with low population density, i.e rural population with corresponding moderate information/knowledge access. Unlike other factors, poverty (high or low) is not a distinctive feature of these archetypes (Figure 5), hence this study cannot confirm the notion that ‘the higher the poverty, the more the degradation’ held by many studies of small-area degradation [38], as noted Table 1. Considering that poverty is widespread in the NGS, there is a need for integrating other social-demographic and social-relational data for a better understanding of the interactions between poverty and LD.

4.3. Archetypes and Policy Insights

As multiple factors are associated with LD, policy interventions aimed at achieving SLM need to be inter-sectoral. However, many policies in Nigeria, such as the Nigerian National Agricultural Policy, focus on single sectors and often do not have LD reduction as a primary objective [10]. Key policy topics related to these findings are sustainable use and management of natural resources, poverty reduction, environmental awareness and education, strategy to reduce dependence on land and natural resources for livelihoods, and inclusion of LD in land-use planning.
With the extensive LD in the NGS, policies for the sustainable management of natural resources including water, soil, and biodiversity, as well as their coherence, are essential [73]. While several response programmes such as the Nigeria National Policy on Environment are promulgated to address activities that cause LD [74], they remain reactive without an effective scaling up to tackle the drivers of LD. For example, the proposed national policy on the rediscovery of grazing routes and reserves remains unprepared to address LD because the advocates focus on the profit and the pressing need to tackle the farmers and herders clashes in Nigeria [67,71], without a recourse to the fact that spatial developments in Nigeria have overtaken several historical grazing spaces [67]. The polarized nature of Nigeria between sectional and ethnic divides further raised several counter notions with socio-political undertones to such policy moves by the government [75]. This subsequently affected the acceptance of related policies such as the 10-year National Livestock Transformation Plan (NLTP), ranching plan, and open grazing [67]. While it is obvious that degradation induces competition and tension among natural resources users, policy decisions on land-based issues require a special focus on LD and land restoration.
Although results did not explicitly show that only low/high poverty is associated with large-/small-area degradation, poverty contributes to the different archetypes identified. Nigeria has about 83 million (40%) of its population living below $1.90 per day, comprising 52% rural dwellers whose livelihoods are predominantly tied to agricultural activities [76,77]. About 30 million more Nigerians are expected to be added to the national population living in extreme poverty by 2030 [77]. Many of the poor depend on livelihood activities such as charcoal making and hunting with bush burning that promote LD [57,58]. Archetype NGS 4, which covers the largest proportion of the NGS (20%) and has moderate–high poverty and a low level of both male and female literacy, is characterized by large-area degradation. Two broad groups of the country’s poverty alleviation programmes (PAPs) have been identified in Nigeria [78]: (a) the Core Poverty Alleviation Programmes (CPAPs) such as Better Life Programme for Rural Dwellers (BLP) and Family Economic Advancement Programme (FEAP), and (b) the Non-Core Poverty Alleviation Programmes (NCPAPs), which include the National Agricultural Land Development Authorities (NALDA). Such policies had no long-lasting effects [78,79] and did not focus on the intersections between poverty and LD. Other policies such as the Agricultural Development Projects (ADPs) and Vision 20-2020 are in a dying state [78,79], with most interventions aimed at increasing farmer revenue and reducing poverty, and mainly focus on improving input supply without giving attention to improving land management.
Nigeria has about 56.9% adult illiteracy [80], with variations across states and regions including urban and rural areas (i.e., urban 74.6% and rural 48.7%). NGSA 3 shows the linkage of low male and female literacy with large-area degradation. Most farmers and herders in Nigeria did not finish primary education and are less likely to access and understand the little knowledge and information disseminated through extension services or lack the resources to access this information themselves [79,81,82]. While the use of mobile phones is promoted to improve access to information, little or no information is provided on sustainable land-use and management. According to [83], technology is necessary to scale up the adoption of initiatives amongst resource-poor users. With the widespread poverty, weak industrial presence to absorb the increasing population, and the reliance on the primary sector, the quest to exploit environmental resources supersedes interest for environmental protection and management [84]. Hence, pathways to improving land management need to be sought both outside agriculture (e.g., creating employment opportunities outside agriculture) as well as within agriculture through improving farmers/herders’ access to sustainable land management practices as well as motivating their adoption [85].
With the growing LD, effective policy on land-use planning is critical for degradation response in Nigeria as the current land-use policies and practices do not adequately consider sustainable land management [10,86]. The historic lapses in the National Land Use Act (LUA) of 1978 persist, whose focus only recognizes land ownership and promotes land access without a sustainable land-use plan or governance to cater for the pressure from the growing population. Calls to review the LUA to give room for a more sustainable policy for land-use planning and governance in Nigeria [10,13], remain unheeded. A challenging question is thus: what opportunities can be identified for promoting SLM [10]?

4.4. Archetypes and Sustainable Land Management (SLM)

Based on literature and the study results, sustainable fuelwood management/energy efficiency, reforestation and afforestation, sustainable pastoralism, and structural land management measures are potential interventions to address LD.
In Nigeria, over 70% of the population rely on wood fuel for cooking, which is an underlying driver of deforestation and associated LD [63]. In recognition of the reliance on fuel wood, sustainable fuelwood management (SFM) is being promoted under the United Nations Development Programme (UNDP)/Global Environment Facility (GEF) project on management of fuel wood in mitigating the effects of climate change such as in Kaduna State, Nigeria [87,88]. While such initiatives have made some progress in establishing woodlots, producing energy-efficient cooking stoves, and establishing local forest management committees, low community buy-in, land tenure, and governance remain key constraints [88]. A review of such initiatives can provide insights on how to improve states’ SLM outcomes and out-scale them to other states in the NGS. Thus, SFM has some potential for promoting landscape stewardship in the region [87,89].
Tree-based programmes also hold potential to reduce LD and remain the principal focus of restoration programs [90]. Reforestation, afforestation, and agroforestry have been found advantageous and successful around the world and in Nigeria, particularly in LD response [91]. In Nigeria, successive governments at all levels have worked collaboratively to encourage and implement various afforestation projects [92]. For instance, among the frontline states of the Great Green Wall Afforestation Programme, tree planning campaigns with eucalyptus species and shelter belts for sand dune and degradation fixation are commonly practiced [74,92]. Therefore, land users in Nigeria can be incentivised to participate in tree-based initiatives, which have recorded successes elsewhere, such as in Kenya [64], to reawaken interest in combating LD. Such initiatives can focus on Niger, Nassarawa, Kwara, and Kogi, including Kaduna and Oyo states, due to the prevalence of large-area LD archetypes. Agroforestry, a multifunctional practice of cropping with trees and shrubs on arable land, is also a potential SLM practice that can improve land productivity, is a low-cost and adaptable tree-based initiative [91,92], that contributes to food security and land resource conservation [91].
With the evidence of high livestock grazing activities in archetype NGSA 7 (Figure 5), traditionally, pastoralism is predominantly practiced in northern Nigeria, with southward movement following the rain and in search of pasture and water during the dry season. Overgrazing causes LD, and indiscriminate overgrazing has caused negative stereotyping and fuelled tensions between pastoralists and non-pastoralist-actors, causing loss of lives and properties as well as communal crisis [67,71]. In some cases, overgrazing by livestock and excessive open grazing lead to the failure of afforestation programmes, including severe violation of protected areas across West Africa [67,93]. While pastoralism under a proper management system is ecologically, economically, and socially viable [94,95], climate change and poor land management in the face of growing national population and pressures from neighbouring herding countries make traditional pastoralism unsustainable in Nigeria [71,93,94]. Studies thus call for controlling open grazing to check indiscriminate overgrazing and secure livestock production in Nigeria [75,96].
In view of several environmental consequences of the archetype driven by terrain characteristics, avoiding degradation-prone rugged terrain is key to maintaining the remaining biomass of the zone. Investing in SLM structures such as land levelling, terracing, and contour farming are critical to tackling LD [97,98], particularly on agricultural landscapes like the NGS, where engagement in farming remains necessary for livelihood sustenance [12,13], and biodiversity and natural conditions are threatened largely by agricultural expansion [13]. Terracing and high-altitude afforestation for erosion control, for example, have been recognized to reduce loss of soil and LD on sloped terrain [99]. Similarly, contour farming and staggered contour trenching, which involves planting of crops across a slope based on elevation contour lines are also effective for managing degradation on rugged–steep terrain [99].

5. Conclusions

This study identified nine archetypes of LD drivers in the NGS, which are mostly dominated by social-economic, land-use management practices, and a slight influence from environment drivers. Specifically, four archetypes characterized by a very high-density population, moderately high information/knowledge access, and moderate–high poverty level, as well as remoteness from a major town, account for 61.3%, 78.4%, and 78.7% of total degraded, stable, and improvement areas, respectively. LD is mostly evident in states bordering the northwest to the central and northeast of the NGS, such as Niger state, which have predominantly large rural farming communities. Besides revealing the LD drivers, the archetypes characteristics provide a basis for determining and prioritizing relevant SLM policies and practices such as poverty reduction, creating environmental awareness and promoting sustainable pastoralism as well as robust land-use planning to strengthen land governance in Nigeria. Despite the limitations of spatial data on the driving factors, the outputs from this study provide a useful guide on how archetypes can serve as a tool for progressing Nigeria’s LDN through SLM. Like most unsupervised classification techniques, field validation of the archetypes results is necessary because of the adopted self-organizing mapping techniques. However, this could not be conducted because mobility limitations and scarcity of spatially explicit data limited the number of variables that could be used for this study. As more spatially explicit data on Nigeria and Africa become available, they need to be integrated in future studies of archetypes as well as validating them with field observations.

Supplementary Materials

The following are available online at https://www.mdpi.com/2072-4292/13/1/32/s1, Figure S1: Correlation matrix between the selected drivers of land degradation archetypes, Figure S2: Training process for determining the nine cluster separations that are suitable for the land-degradation archetypes, Figure S3: The plot showing the aggregated profile of each neuron as synthesized by the selected drivers of land degradation, Figure S4: Quality of the nine clusters in the codebook, Figure S5: Neighbor distances between the neurons for the clusters, Table S1: Calculated Z-score normalized values of drivers characterizing the nine (9) distinctive archetypes of land degradation, Table S2: Archetypes and percentage share per state administration unit, Table S3: Archetypes and share of land status.

Author Contributions

A.A.A.: Conceptualization, Methodology, Software, Data curation, Writing—Original draft preparation. C.I.S.: Conceptualization of the research project, Supervision, Writing—Review & Editing. All authors have read and agreed to the published version of the manuscript.

Funding

Ademola. A. Adenle is funded by the UniBe International 2021, Initiative of the Vice-Rectorate Development, University of Bern, Switzerland and acknowledges the small grant funding from the Rufford foundation for the research project [27153-1] in Nigeria as well as the Small Equipment Grant from IDEA WILD toward the acquisition DJI Mavic Air Quadcopter with Remote Controller.

Acknowledgments

Ademola A. Adenle acknowledges the support from the UniBE International 2021, Initiative of the Vice-Rectorate Development, University of Bern, Switzerland. We are also grateful to the reviewers whose constructive feedback helped to improve this paper. This study contributes to the Programme on Ecosystem Change and Society (www.pecs-science.org) and the Global Land Programme (www.glp.earth).

Conflicts of Interest

The authors declare no conflict of interest.

References

  1. Sims, N.C.; Barger, N.N.; Metternicht, G.I.; England, J.R. A land degradation interpretation matrix for reporting on UN SDG indicator 15.3.1 and land degradation neutrality. Environ. Sci. Policy 2020, 114, 1–6. [Google Scholar] [CrossRef]
  2. Laestadius, L.; Maginnis, S.; Minnemeyer, S.; Potapov, P.; Saint-Laurent, C.; Sizer, N. Mapping opportunities for forest landscape restoration. Unasylva 2011, 62, 47–48. [Google Scholar]
  3. Goffner, D.; Sinare, H.; Gordon, L.J. The Great Green Wall for the Sahara and the Sahel Initiative as an opportunity to enhance resilience in Sahelian landscapes and livelihoods. Reg. Environ. Chang. 2019, 19, 1417–1428. [Google Scholar] [CrossRef] [Green Version]
  4. Olsson, L.; Barbosa, H.; Bhadwal, S.; Cowie, A.; Delusca, K.; Flores-Renteria, D.; Hermans, K.; Jobbagy, E.; Kurz, W.; Li, D.; et al. Land Degradation. In Climate Change and Land: An IPCC Special Report on Climate Change, Desertification, Land Degradation, Sustainable Land Management, Food Security, and Greenhouse Gas Fluxes in Terrestrial Ecosystems; IPCC Press Office: Geneva, Switzerland, 2019; pp. 345–436. [Google Scholar]
  5. Akinyemi, F.O.; Tlhalerwa, L.T.; Eze, P.N. Land degradation assessment in an African dryland context based on the Composite Land Degradation Index and mapping method. Geocarto Int. 2019, 1–17. [Google Scholar] [CrossRef]
  6. Southworth, J.; Zhu, L.; Bunting, E.; Ryan, S.J.; Herrero, H.; Waylen, P.R.; Hill, M.J. Changes in vegetation persistence across global savanna landscapes, 1982–2010. J. Land Use Sci. 2016, 11, 7–32. [Google Scholar] [CrossRef]
  7. Ellison, D.; Ifejika Speranza, C. From blue to green water and back again: Promoting tree, shrub and forest-based landscape resilience in the Sahel. Sci. Total Environ. 2020, 739, 140002. [Google Scholar] [CrossRef]
  8. UNCCD. The Global Land Outlook, West Africa Thematic Report; United Nations Convention to Combat Desertification: Bonn, Germany, 2019. [Google Scholar]
  9. Höhn, A.; Neumann, K. Shifting cultivation and the development of a cultural landscape during the Iron Age (0–1500 AD) in the northern Sahel of Burkina Faso, West Africa: Insights from archaeological charcoal. Quat. Int. 2012, 249, 72–83. [Google Scholar] [CrossRef]
  10. Ifejika Speranza, C.; Adenle, A.; Boillat, S. Land Degradation Neutrality—Potentials for its operationalisation at multi-levels in Nigeria. Environ. Sci. Policy 2019, 94, 63–71. [Google Scholar] [CrossRef]
  11. Adenle, A.A.; Eckert, S.; Speranza, C.I.; Adedeji, O.I.; Ellison, D. Human-induced land degradation dominance in the Nigerian Guinea savannah between 2003–2018. Remote Sens. Appl. Soc. Environ. 2020, 100360. [Google Scholar] [CrossRef]
  12. CILSS (Comité Permanent Inter-états de Lutte contre la Sécheresse dans le Sahel). Landscapes of West Africa—A Window on a Changing World; CILSS: Garretson, SD, USA, 2016. [Google Scholar]
  13. Arowolo, A.O.; Deng, X. Land use/land cover change and statistical modelling of cultivated land change drivers in Nigeria. Reg. Environ. Chang. 2018, 18, 247–259. [Google Scholar] [CrossRef]
  14. Lambin, E.F.; Geist, H.J.; Lepers, E. Dynamics of Land-Use and Land-Cover Change in Tropical Regions. Annu. Rev. Environ. Resour. 2003, 28, 205–241. [Google Scholar] [CrossRef] [Green Version]
  15. Macaulay, B.M. Land degradation in Northern Nigeria: The impacts and implications of human-related and climatic factors. Afr. J. Environ. Sci. Technol. 2014, 8, 267–273. [Google Scholar] [CrossRef]
  16. Mirzabaev, A.; Nkonya, E.; Goedecke, J.; Johnson, T.; Anderson, W. Global Drivers of Land Degradation and Improvement. In Economics of Land Degradation and Improvement—A Global Assessment for Sustainable Development; Nkonya, E., Mirzabaev, A., von Braun, J., Eds.; Springer: Cham, Switzerland, 2016; pp. 167–195. ISBN 978-3-319-19168-3. [Google Scholar]
  17. Batunacun; Wieland, R.; Lakes, T.; Yunfeng, H.; Nendel, C. Identifying drivers of land degradation in Xilingol, China, between 1975 and 2015. Land Use Policy 2019, 83, 543–559. [Google Scholar] [CrossRef]
  18. Sietz, D.; Fleskens, L.; Stringer, L.C. Learning from Non-Linear Ecosystem Dynamics Is Vital for Achieving Land Degradation Neutrality. Land Degrad. Dev. 2017, 28, 2308–2314. [Google Scholar] [CrossRef] [Green Version]
  19. Oberlack, C.; Sietz, D.; Bürgi Bonanomi, E.; de Bremond, A.; Dell’Angelo, J.; Eisenack, K.; Ellis, E.; Epstein, G.; Giger, M.; Heinimann, A.; et al. Archetype analysis in sustainability research: Meanings, motivations, and evidence-based policy making. Ecol. Soc. 2019, 24. [Google Scholar] [CrossRef] [Green Version]
  20. Levers, C.; Müller, D.; Erb, K.; Haberl, H.; Jepsen, M.R.; Metzger, M.J.; Meyfroidt, P.; Plieninger, T.; Plutzar, C.; Stürck, J.; et al. Archetypical patterns and trajectories of land systems in Europe. Reg. Environ. Chang. 2018, 18, 715–732. [Google Scholar] [CrossRef]
  21. Sietz, D.; Mamani Choque, S.E.; Lüdeke, M.K.B. Typical patterns of smallholder vulnerability to weather extremes with regard to food security in the Peruvian Altiplano. Reg. Environ. Chang. 2012, 12, 489–505. [Google Scholar] [CrossRef]
  22. Merino, M.V.; Sietz, D.; Jost, F.; Berger, U. Archetypes of Climate Vulnerability: A Mixed-method Approach Applied in the Peruvian Andes. Clim. Dev. 2019, 11, 418–434. [Google Scholar] [CrossRef]
  23. Dittrich, A.; Seppelt, R.; Václavík, T.; Cord, A.F. Integrating ecosystem service bundles and socio-environmental conditions—A national scale analysis from Germany. Ecosyst. Serv. 2017, 28, 273–282. [Google Scholar] [CrossRef]
  24. Oberlack, C.; Eisenack, K. Archetypical barriers to adapting water governance in river basins to climate change. J. Inst. Econ. 2018, 14, 527–555. [Google Scholar] [CrossRef]
  25. Václavík, T.; Lautenbach, S.; Kuemmerle, T.; Seppelt, R. Mapping global land system archetypes. Glob. Environ. Chang. 2013, 23, 1637–1647. [Google Scholar] [CrossRef]
  26. Iloeje, N.P. A New Geography of Nigeria; New Revised Edition; Longman Nig. Ltd.: Lagos, Nigeria, 2001; p. 200. [Google Scholar]
  27. Nigeria’s First National Communication under the United Nations Framework Convention on Climate Change; The Ministry of the Environment of the Federal 11 Republic of Nigeria: Abuja, Nigeria, 2003.
  28. Mulinge, W.; Gicheru, P.; Murithi, F.; Maingi, P.; Kihiu, E.; Kirui, O.K.; Mirzabaev, A. Economics of Land Degradation and Improvement in Kenya. In Economics of Land Degradation and Improvement—A Global Assessment for Sustainable Development; Nkonya, E., Mirzabaev, A., von Braun, J., Eds.; Springer: Cham, Switzerland, 2016; pp. 471–498. ISBN 978-3-319-19167-6. [Google Scholar]
  29. Vu, Q.M.; Le, Q.B.; Frossard, E.; Vlek, P.L.G. Socio-economic and biophysical determinants of land degradation in Vietnam: An integrated causal analysis at the national level. Land Use Policy 2014, 36, 605–617. [Google Scholar] [CrossRef]
  30. FGN (Federal Government of Nigeria). Final Report of the Land Degradation Neutrality Target Setting Programme; FGN: Abuja, Nigeria, 2018.
  31. Malek, Ž.; Douw, B.; Van Vliet, J.; Van Der Zanden, E.H.; Verburg, P.H. Local land-use decision-making in a global context. Environ. Res. Lett. 2019, 14, 083006. [Google Scholar] [CrossRef]
  32. Zhu, Z.; Piao, S.; Myneni, R.B.; Huang, M.; Zeng, Z.; Canadell, J.G.; Ciais, P.; Sitch, S.; Friedlingstein, P.; Arneth, A.; et al. Greening of the Earth and its drivers. Nat. Clim. Chang. 2016, 6, 791–795. [Google Scholar] [CrossRef]
  33. Olorunfemi, I.E.; Fasinmirin, J.T.; Olufayo, A.A.; Komolafe, A.A. GIS and remote sensing-based analysis of the impacts of land use/land cover change (LULCC) on the environmental sustainability of Ekiti State, southwestern Nigeria. Environ. Dev. Sustain. 2020, 22, 661–692. [Google Scholar] [CrossRef]
  34. WorldPop. Global 100m Covariates; WorldPop: School of Geography and Environmental Science, University of Southampton; Department of Geography and Geosciences, University of Louisville; Departement de Geographie, Universite de Namur) and Center for International Earth Science Information Network (CIESIN), Columbia University 2018. Global High Resolution Population Denominators Project—Funded by the Bill and Melinda Gates Foundation (OPP1134076). Available online: https://dx.doi.org/10.5258/SOTON/WP00645 (accessed on 17 November 2020).
  35. Tiffen, M.; Mortimore, M.; Gichuki, F. More People, Less Erosion: Environmental Recovery in KENYA; John and Wiley: Chichester, NY, USA, 1994; ISBN 978-0-471-94143-9. [Google Scholar]
  36. Abdulaziz, H.; Johar, F.; Majid, M.R.; Medugu, N.I. Protected area management in Nigeria: A review. J. Teknol. 2015, 77. [Google Scholar] [CrossRef] [Green Version]
  37. Bosco, C.; Alegana, V.; Bird, T.; Pezzulo, C.; Bengtsson, L.; Sorichetta, A.; Steele, J.; Hornby, G.; Ruktanonchai, C.; Ruktanonchai, N.; et al. Exploring the high-resolution mapping of gender-disaggregated development indicators. J. R. Soc. Interface 2017, 14, 20160825. [Google Scholar] [CrossRef] [PubMed] [Green Version]
  38. Gnacadja, L.; Wiese, L. Land Degradation Neutrality: Will Africa Achieve It? Institutional Solutions to Land Degradation and Restoration in Africa. In Climate Change and Multi-Dimensional Sustainability in African Agriculture; Lal, R., Kraybill, D., Hansen, D.O., Singh, B.R., Mosogoya, T., Eik, L.O., Eds.; Springer: Cham, Switzerland, 2016; pp. 61–95. ISBN 978-3-319-41236-8. [Google Scholar]
  39. Jendoubi, D.; Liniger, H.; Ifejika Speranza, C. Impacts of land use and topography on soil organic carbon in a Mediterranean landscape (north-western Tunisia). Soil 2019, 5, 239–251. [Google Scholar] [CrossRef] [Green Version]
  40. Lloyd, C.T.; Chamberlain, H.; Kerr, D.; Yetman, G.; Pistolesi, L.; Stevens, F.R.; Gaughan, A.E.; Nieves, J.J.; Hornby, G.; MacManus, K.; et al. Global spatio-temporally harmonised datasets for producing high-resolution gridded population distribution datasets. Big Earth Data 2019, 3, 108–139. [Google Scholar] [CrossRef] [Green Version]
  41. Salako, F.K.; Hauser, S.; Babalola, O.; Tian, G. Improvement of the physical fertility of a degraded Alfisol with planted and natural fallows under humid tropical conditions. Soil Use Manag. 2006, 17, 41–47. [Google Scholar] [CrossRef]
  42. Enang, R.K.; Yerima, B.P.K.; Kome, G.K.; Van Ranst, E. Effects of Forest Clearance and Cultivation on Bulk Density Variations and Relationships with Texture and Organic Matter in Tephra Soils of Mount Kupe (Cameroon). Commun. Soil Sci. Plant Anal. 2017, 48, 2231–2245. [Google Scholar] [CrossRef]
  43. Imbrenda, V.; D’emilio, M.; Lanfredi, M.; Macchiato, M.; Ragosta, M.; Simoniello, T. Indicators for the estimation of vulnerability to land degradation derived from soil compaction and vegetation cover: Indicators for the estimation of soil degradation. Eur. J. Soil Sci. 2014, 65, 907–923. [Google Scholar] [CrossRef] [Green Version]
  44. Nadporozhskaya, M.A.; Chertov, O.G.; Bykhovets, S.S.; Shaw, C.H.; Maksimova, E.Y.; Abakumov, E.V. Recurring surface fires cause soil degradation of forest land: A simulation experiment with the EFIMOD model. Land Degrad. Dev. 2018, 29, 2222–2232. [Google Scholar] [CrossRef]
  45. Miquelajauregui, Y.; Cumming, S.G.; Gauthier, S. Modelling Variable Fire Severity in Boreal Forests: Effects of Fire Intensity and Stand Structure. PLoS ONE 2016, 11, e0150073. [Google Scholar] [CrossRef] [PubMed]
  46. Veldman, J.W. Clarifying the confusion: Old-growth savannahs and tropical ecosystem degradation. Phil. Trans. R. Soc. B 2016, 371, 20150306. [Google Scholar] [CrossRef] [PubMed] [Green Version]
  47. Kosmas, C.; Detsis, V.; Karamesouti, M.; Kounalaki, K.; Vassiliou, P.; Salvati, L. Exploring Long-Term Impact of Grazing Management on Land Degradation in the Socio-Ecological System of Asteroussia Mountains, Greece. Land 2015, 4, 541–559. [Google Scholar] [CrossRef] [Green Version]
  48. Bado, V.B.; Bationo, A. Integrated Management of Soil Fertility and Land Resources in Sub-Saharan Africa: Involving Local Communities. In Advances in Agronomy; Elsevier: Amsterdam, The Netherlands, 2018; Volume 150, pp. 1–33. ISBN 978-0-12-815175-4. [Google Scholar]
  49. Deng, X.; Huang, J.; Huang, Q.; Rozelle, S.; Gibson, J. Do roads lead to grassland degradation or restoration? A case study in Inner Mongolia, China. Environ. Dev. Econ. 2011, 16, 751–773. [Google Scholar] [CrossRef] [Green Version]
  50. Li, W.; Buitenwerf, R.; Munk, M.; Amoke, I.; Bøcher, P.K.; Svenning, J.-C. Accelerating savanna degradation threatens the Maasai Mara socio-ecological system. Glob. Environ. Chang. 2020, 60, 102030. [Google Scholar] [CrossRef]
  51. De la Fuente, B.; Weynants, M.; Bertzky, B.; Delli, G.; Mandrici, A.; Bendito, E.G.; Dubois, G. Land Productivity Dynamics in and around Protected Areas Globally from 1999 to 2013. PLoS ONE 2020, 15, e0224958. [Google Scholar] [CrossRef]
  52. Nabiollahi, K.; Golmohamadi, F.; Taghizadeh-Mehrjardi, R.; Kerry, R.; Davari, M. Assessing the effects of slope gradient and land use change on soil quality degradation through digital mapping of soil quality indices and soil loss rate. Geoderma 2018, 318, 16–28. [Google Scholar] [CrossRef]
  53. Qasim, M.; Hubacek, K.; Termansen, M.; Fleskens, L. Modelling land use change across elevation gradients in district Swat, Pakistan. Reg. Environ. Chang. 2013, 13, 567–581. [Google Scholar] [CrossRef]
  54. Kohonen, T. Self-Organizing Maps; Springer Series in Information Sciences; Springer: Berlin/Heidelberg, Germany, 2001; Volume 30, ISBN 978-3-540-67921-9. [Google Scholar]
  55. Moosavi, V. Contextual mapping: Visualization of high-dimensional spatial patterns in a single geo-map. Comput. Environ. Urban Syst. 2017, 61, 1–12. [Google Scholar] [CrossRef]
  56. Oldeman, L.R.; Hakkeling, R.T.A.; Sombroek, W.G.; International Soil Reference and Information Centre; United Nations. Environment Programme World Map of the Status of Human-Induced Soil Degradation an Explanatory Note; International Soil Reference and Information Centre: Wageningen, The Netherlands; Nairobi, Kenya, 1991. [Google Scholar]
  57. Andela, N.; van der Werf, G.R. Recent trends in African fires driven by cropland expansion and El Niño to La Niña transition. Nat. Clim. Chang. 2014, 4, 791–795. [Google Scholar] [CrossRef]
  58. Woollen, E.; Ryan, C.M.; Baumert, S.; Vollmer, F.; Grundy, I.; Fisher, J.; Fernando, J.; Luz, A.; Ribeiro, N.; Lisboa, S.N. Charcoal production in the Mopane woodlands of Mozambique: What are the trade-offs with other ecosystem services? Phil. Trans. R. Soc. B 2016, 371, 20150315. [Google Scholar] [CrossRef] [PubMed]
  59. Barbier, E.B.; Hochard, J.P. Does Land Degradation Increase Poverty in Developing Countries? PLoS ONE 2016, 11, e0152973. [Google Scholar] [CrossRef] [PubMed] [Green Version]
  60. Nkonya, E.; Mirzabaev, A.; von Braun, J. Economics of Land Degradation and Improvement: An Introduction and Overview. In Economics of Land Degradation and Improvement—A Global Assessment for Sustainable Development; Nkonya, E., Mirzabaev, A., von Braun, J., Eds.; Springer International Publishing: Cham, Switzerland, 2016; pp. 1–14. ISBN 978-3-319-19168-3. [Google Scholar]
  61. Gadzama, N.M.; Ayuba, H.K. On major environmental problem of desertification in Northern Nigeria with sustainable efforts to managing it. World J. Sci. Technol. Sustain. Dev. 2016, 13, 18–30. [Google Scholar] [CrossRef]
  62. Gadzama, N.M. Attenuation of the effects of desertification through sustainable development of Great Green Wall in the Sahel of Africa. World J. Sci. Technol. Sustain. Dev. 2017, 14, 279–289. [Google Scholar] [CrossRef]
  63. Ayanlade, A.; Drake, N. Forest loss in different ecological zones of the Niger Delta, Nigeria: Evidence from remote sensing. GeoJournal 2016, 81, 717–735. [Google Scholar] [CrossRef]
  64. Kiage, L.M. Perspectives on the assumed causes of land degradation in the rangelands of Sub-Saharan Africa. Prog. Phys. Geogr. Earth Environ. 2013, 37, 664–684. [Google Scholar] [CrossRef]
  65. Pingali, P.; Schneider, K.; Zurek, M. Poverty, Agriculture and the Environment: The Case of Sub-Saharan Africa. In Marginality: Addressing the Nexus of Poverty, Exclusion and Ecology; von Braun, J., Gatzweiler, F.W., Eds.; Springer: Dordrecht, The Netherlands, 2014; pp. 151–168. ISBN 978-94-007-7061-4. [Google Scholar]
  66. Eisenack, K.; Villamayor-Tomas, S.; Epstein, G.; Kimmich, C.; Magliocca, N.; Manuel-Navarrete, D.; Oberlack, C.; Roggero, M.; Sietz, D. Design and quality criteria for archetype analysis. Ecol. Soc. 2019, 24. [Google Scholar] [CrossRef] [Green Version]
  67. Ducrotoy, M.J.; Majekodunmi, A.O.; Shaw, A.P.M.; Bagulo, H.; Bertu, W.J.; Gusi, A.M.; Ocholi, R.; Welburn, S.C. Patterns of passage into protected areas: Drivers and outcomes of Fulani immigration, settlement and integration into the Kachia Grazing Reserve, northwest Nigeria. Pastoralism 2018, 8, 1. [Google Scholar] [CrossRef] [PubMed] [Green Version]
  68. Nchor, A.A.; Ogogo, A.U. Rapid assessment of protected area pressures and threats in Nigeria national parks. Glob. J. Agric. Sci. 2012, 11, 63–72. [Google Scholar] [CrossRef]
  69. Mirzabaev, A. Land Degradation and Sustainable Land Management Innovations in Central Asia. In Technological and Institutional Innovations for Marginalized Smallholders in Agricultural Development; Gatzweiler, F.W., von Braun, J., Eds.; Springer: Cham, Switzerland, 2016; pp. 213–224. ISBN 978-3-319-25718-1. [Google Scholar]
  70. Abbas, I.I.; Fasona, M.J. The Human Perception of Land Degradation in a Section of Niger Delta, Nigeria. Mar. Sci. 2012, 2, 94–100. [Google Scholar] [CrossRef] [Green Version]
  71. Fasona, M.; Fabusoro, E.; Sodiya, C.; Adedayo, V.; Olorunfemi, F.; Elias, P.O.; Oyedepo, J.; Oloukoi, G. Some Dimensions of Farmers’-Pastoralists’ Conflicts in the Nigerian Savanna. J. Glob. Initiat. Policy Pedagog. Perspect. 2016, 10, 7. [Google Scholar]
  72. Naibbi, A.I.; Baily, B.; Healey, R.G.; Collier, P. Changing Vegetation Patterns in Yobe State Nigeria: An Analysis of the Rates of Change, Potential Causes and the Implications for Sustainable Resource Management. IJG 2014, 5, 50–62. [Google Scholar] [CrossRef] [Green Version]
  73. Akhtar-Schuster, M.; Thomas, R.J.; Stringer, L.C.; Chasek, P.; Seely, M. Improving the enabling environment to combat land degradation: Institutional, financial, legal and science-policy challenges and solutions. Land Degrad. Dev. 2011, 22, 299–312. [Google Scholar] [CrossRef]
  74. FGN Federal Government of Nigeria. Great Green Wall for the Sahara and Sahel Initiative National Strategic Action Plan; National Strategic Action Plan; Federal Ministry of Environment of Nigeria: Abuja, Nigeria, 2012.
  75. Onele, J. The Grazing Bill and the Right to Property in Nigeria: Lest We Are Deceived! SSRN J. 2016. [Google Scholar] [CrossRef]
  76. World Bank. Nigeria Agriculture and Rural Poverty: A Policy Note; World Bank: Washington, DC, USA, 2014. [Google Scholar]
  77. World Bank. Poverty Reduction in Nigeria in the Last Decade; World Bank: Washington, DC, USA, 2016. [Google Scholar]
  78. Umo, J.O. Escaping Poverty in Africa: A Perspective on Strastegic Agender for Nigeria, 2nd ed.; Millennium Text Publishers Ltd.: Lagos, Nigeria, 2012. [Google Scholar]
  79. Okoro, U.S.; Akpaeti, A.J.; Ekpo, U.N. Seasonality in income and poverty among rural food crop farmers in Akwaibom State, Nigeria. Russ. Agric. Sci. 2015, 41, 383–389. [Google Scholar] [CrossRef]
  80. UNESCO. Reaching the 2015 Literacy Target: Delivering on the Promise; High Level International Round Table on Literacy: Paris, France, 2012. [Google Scholar]
  81. Benjamin, A.M.N. Farmers’ Perception of Effectiveness of Agricultural Extension Delivery in Cross-River State, Nigeria. J. Agric. Vet. Sci. (IOSR-JAVS) 2013, 2, 1–7. [Google Scholar]
  82. Baloch, M.A.; Thapa, G.B. The effect of agricultural extension services: Date farmers’ case in Balochistan, Pakistan. J. Saudi Soc. Agric. Sci. 2018, 17, 282–289. [Google Scholar] [CrossRef] [Green Version]
  83. Lenhardt, A.; Glennie, J.; Intscher, N.; Ali, A.; Morin, G. A Greener BurkinA Sustainable Farming Techniques, Land Reclamation and Improved Livelihoods; Progress Case Study Report; Gallimard: Paris, France, 2014. [Google Scholar]
  84. Atuo, F.A.; Fu, J.; O’Connell, T.J.; Agida, J.A.; Agaldo, J.A. Coupling law enforcement and community-based regulations in support of compliance with biodiversity conservation regulations. Environ. Conserv. 2020, 47, 104–112. [Google Scholar] [CrossRef]
  85. Hughes, K.; Oduol, J.; Kegode, H.; Ouattara, I.; Vagen, T.; Winowiecki, L.A.; Bourne, M.; Neely, C.; Ademonla, A.D.; Carsan, S.; et al. Regreening Africa Consolidated Baseline Survey Report; World Agroforestry: Nairobi, Kenya, 2020. [Google Scholar]
  86. Ifejika Speranza, C.; Ochege, F.U.; Nzeadibe, T.C.; Agwu, A.E. Agricultural Resilience to Climate Change in Anambra State, Southeastern Nigeria. In Beyond Agricultural Impacts; Elsevier: Amsterdam, The Netherlands, 2018; pp. 241–274. ISBN 978-0-12-812624-0. [Google Scholar]
  87. Adewuyi, T.O.; Olofin, E.A. Sustainability of Fuel Wood Harvesting from Afaka Forest Reserve, Kaduna State, Nigeria. JAS 2014, 7, 129. [Google Scholar] [CrossRef]
  88. Ndiboi, S.; Makinde, D. Sustainable Fuelwood Management Project in Nigeria; Final Draft Midterm Review (MTR) REPORT: Abuja, Nigeria, 2020. [Google Scholar]
  89. Mononen, K.; Pitkänen, S. Sustainable Fuelwood Management in West Africa; University of Eastern Finland: Joensuu/Kuopio, Finland, 2016. [Google Scholar]
  90. Chazdon, R.L.; Uriarte, M. Natural regeneration in the context of large-scale forest and landscape restoration in the tropics. Biotropica 2016, 48, 709–715. [Google Scholar] [CrossRef]
  91. Idris Medugu, N.; Rafee Majid, M.; Johar, F.; Choji, I.D. The role of afforestation programme in combating desertification in Nigeria. Int. J. Clim. Chang. Strat. Manag. 2010, 2, 35–47. [Google Scholar] [CrossRef]
  92. Ibrahim, K.M.; Muhammad, S.I. A Review of Afforestation Efforts in Nigeria. Int. J. Adv. Res. Eng. Appl. Sci. 2015, 4, 24–37. [Google Scholar]
  93. Ibrahim, S.S.; Ozdeser, H.; Cavusoglu, B. Testing the impact of environmental hazards and violent conflicts on sustainable pastoral development: Micro-level evidence from Nigeria. Environ. Dev. Sustain. 2020, 22, 4169–4190. [Google Scholar] [CrossRef]
  94. FAO Food and Agriculture Organization. Improving Governance of Pastoral Lands. Governance of Tenure Technical Guides; FAO: Rome, Italy, 2017; Available online: www.fao.org/3/a-i5771e.pdf (accessed on 17 November 2020).
  95. Hannam, I. Governance of Pastoral Lands. In International Yearbook of Soil Law and Policy 2017; Ginzky, H., Dooley, E., Heuser, I.L., Kasimbazi, E., Markus, T., Qin, T., Eds.; Springer: Cham, Switzerland, 2018; Volume 2017, pp. 101–124. ISBN 978-3-319-68884-8. [Google Scholar]
  96. Sule, P.E. Open grazing prohibitions and the politics of exclusivist identity in Nigeria. Afr. Rev. 2020, 1–17. [Google Scholar] [CrossRef]
  97. Liniger, H.; Studer, R.M.; Hauert, C.; Gurtner, M.; Gämperli, U.; Kummer, S.; Hergarten, C. Sustainable Land Management in Practice—Guidelines and Best Practices for Sub-Saharan Africa; TerrAfrica; World Overview of Conservation Approaches and Technologies (WOCAT) and Food and Agriculture Organization of the United Nations (FAO): Midrand, South Africa, 2011; Volume 13. [Google Scholar]
  98. Liniger, H.; Harari, N.; van Lynden, G.; Fleiner, R.; de Leeuw, J.; Bai, Z.; Critchley, W. Achieving land degradation neutrality: The role of SLM knowledge in evidence-based decision-making. Environ. Sci. Policy 2019, 94, 123–134. [Google Scholar] [CrossRef]
  99. Ferro-Vázquez, C.; Lang, C.; Kaal, J.; Stump, D. When is a terrace not a terrace? The importance of understanding landscape evolution in studies of terraced agriculture. J. Environ. Manag. 2017, 202, 500–513. [Google Scholar] [CrossRef] [Green Version]
Figure 1. Map of the Nigerian Guinea Savannah including the administrative boundaries of states (Adapted from [26]).
Remotesensing 13 00032 g001
Figure 2. (a) Landscape showing a degraded patch of the Nigerian savannah vegetation in Shiroro local government area, Niger state, Nigeria; (b) a mix of degraded land with few bushes and trees interspersed in Borgu local government area, Niger state, Nigeria. (Source: own fieldwork, 2019).
Remotesensing 13 00032 g002
Figure 3. The conceptual framework.
Remotesensing 13 00032 g003
Figure 4. Land-degradation (LD) status for the Nigerian Guinea Savannah (NGS) (Source [11]) using Normalized Difference Vegetation Index (NDVI) as a proxy after correcting for rainfall.
Remotesensing 13 00032 g004
Figure 5. The Z-score normalized values of drivers characterizing the nine archetypes of LD drivers, (zero depicts the mean for the NGS; the percentage contribution of driver categories into archetype clusters is presented in the boxes: red: land-use management practice; blue: socio-economic; green: environmental drivers).
Remotesensing 13 00032 g005
Figure 6. Spatial characterization of archetypes of LD drivers. See supplementary material, Section 6 for the full description and ranking of the archetypes in relation to administrative and land status.
Remotesensing 13 00032 g006
Figure 7. Archetypes in percentage of associated LD status (For full percentages, see supplementary material, Table S3).
Remotesensing 13 00032 g007
Figure 8. Share of LD archetypes by states in the NGS. Note: shares outside the NGS, that were not analyzed, are in grey. (For full percentages, see supplementary material, Table S2).
Remotesensing 13 00032 g008
Table 1. List of driver’s datasets for the development of archetypes.
(1a) Land-Use Management Practices
VariablesType of DriverExplanationHypothesized EffectReferences
Fire occurrence density derived from active fire and hotspot dataProximateUncontrolled fire occurrences and bush burning destroy soil and biomass, leading to LD—while controlled fire could be a management strategy.Frequent man-made fire activities lead to more LD. The fewer the man-made fire activities, the less the LD.[44,45,46]
Livestock grazing intensityProximateOvergrazing due to higher livestock intensity leads to LD, especially when the threshold limits of the support systems are exceeded, while lower livestock intensity does not lead to LD.The higher the livestock grazing density, the higher the LD. The lower the grazing density, the less the LD.[47,48]
Distance to major roadProximate/AnthropogenicRoads are a measure of infrastructural development that enhances access to markets and extension services. For instance, a good access road encourages land conversion, including the spread and the adoption of land management practices, while inadequate access discourages land conversion.Proximity drives LD because nearer forest patches are easier to clear, while areas far away are not affected. The farther an area to a major road, the less the LD; the closer to a major road, the more the LD.[16,29,38,49]
Distance to major townsProximate/AnthropogenicLand that is close to major towns is prone to LD pushed by urban development; while land that is far from major towns is less prone to conversion and LD.The farther an area to a major town, the less the LD; the closer to a major town, the more the LD. Areas near settlements or towns are more likely to degrade due to expanding settlements and resource extraction (e.g., wood).[16,17,29]
Protected area statusProximateHuman pressure that causes LD is more severe on unprotected land than on protected land. Protected areas are less prone to degradation due to their protected status.[50,51]
(1b) Socio-Economic Drivers
VariablesType of DriverExplanationHypothesized EffectReferences
Population densityUnderlyingPopulation density can trigger better land management, but can also lead to LD due to overuse or poor management.The higher the population density, the less the LD; the lower the population density, the more the degradation. Alternatively, the higher the population density, the higher the LD. The lesser the population density, the lesser the LD.[16,17,35]
Female/Male LiteracyUnderlyingHigh literacy indicates better access to information or knowledge for making informed decisions, while low literacy may limit people’s ability to understand available information—hence they are likely to make poorer land management and investment decisions. The higher the literacy of women/men, the better the access to knowledge on combating LD; the lower the literacy of women/men, the lesser the access to such information. [38]
Poverty head countUnderlyingDiverging evidence. Poverty and LD are intertwined: while poverty could trigger LD, LD could exacerbate poverty. Poor land users are more likely to give up their land tenure security to other more powerful land users, for example losing their land to large-scale land investments for monocultures.The higher the poverty, the more the prevalence of LD due to various intervening factors such as lack of capital and labor to invest in land management and insecure land tenure.[16,29,38]
(1c) Environmental Drivers
VariablesType of DriverExplanationHypothesized EffectReferences
SlopeProximateSlope influences land-use decisions. Steep lands are often avoided for land-use activities such as cultivation. However, cultivation on non-terraced steep slopes and overgrazing can cause LD such as water and wind erosion.The steeper the slope, the more susceptible to LD, but the less will be the land’s attractiveness for use. The less steep the slope, the less susceptible to LD but the more the attractiveness for land-use activities.[16,39,52]
Bulk Density (BD)UnderlyingSoils with low bulk density have favorable conditions in terms of soil pore space, texture and organic matter content that influence the choice of land for crop cultivation and biomass clearance.Low soil bulk density encourages tillage and crop cultivation, while high soil bulk density discourages crop cultivation. The higher the bulk density, the higher the LD; The lower the bulk density, the less the LD.[41,42,43]
Elevation/TopographyProximate/AnthropogenicLand uses such as farming, which promote degradation are often practiced on flat terrain while rough or high hilly terrains are avoided. Hence, flat terrains are more likely to be exposed to land-use pressure from crop farming.The higher the elevation, the more susceptible is the land to LD such as erosion, but the less the land’s attractiveness for use. The lower the elevation, the less susceptible is the land to LD, but the more attractive for land use because of soil attributes such as deeper soils.[16,53]
Table 2. Description and share of the archetypes of LD drivers.
SOMBrief DescriptionArea Share (%)Area Share (km2)
NGSA 1Archetype dominated by protected areas: Areas with very high numbers of protected areas that are associated with the moderate–high influence of elevation, bulk density and high literacy.3.314,412
NGSA 2Archetype dominated by very high-density population: Areas with very high population density and with minimal influence of livestock and high fire activities.15.367,169
NGSA 3Archetype dominated by moderately high information/knowledge access: Mainly areas with a moderately high level of both male and female literacy, including fire-occurrence activities but with low poverty.12.454,528
NGSA 4Archetype dominated by low literacy level and moderate–high poverty level: Area characterized by moderate–high poverty and minimal fire activities, but with low levels of both male and female literacy.20.188,036
NGSA 5Archetype dominated by rural remoteness: Highly dominated by land-use management practices and remote from major towns but with a moderately low population density, protected area prevalence, and low livestock density.10.144,408
NGSA 6Archetype dominated by remoteness from a major road: Highly dominated by land-use management practices, which occur at a far distance away from major roads with moderately high poverty and literacy but with moderate fire and livestock activities.8.738,273
NGSA 7Archetype dominated by very high livestock density: Areas with a very high livestock density and moderate levels of other drivers.10.144,044
NGSA 8Archetype dominated by moderate poverty level and nearly level terrain: Collectively driven by all drivers’ categories but fairly dominated by land-use management practices, but with a moderate elevation and moderate influence of bulk density and poverty.9.441,297
NGSA 9Archetype dominated by very rugged terrain and remote from a major road: Areas with moderate elevation, high slope, and distant from the major road.10.545,880
100.00438,046.88
Publisher’s Note: MDPI stays neutral with regard to jurisdictional claims in published maps and institutional affiliations.

