1. Introduction
In the UK, a total of 11-billion liters of sewarage are treated on a daily basis [
1]. Wastewater Treatment Plants (WWTPs) are essential in ensuring that the effluent discharged into the environment does not have a significant negative effect [
2]. Companies operating WWTPs in the UK have a duty to ensure that the effluent quality meets legislative requirements, as described within a permit issued by the environmental regulator. The Environment Agency (England), the Northen Ireland Environment Agency (Northern Ireland), the Scottish Environment Protection Agency (Scotland), and Natural Resources Wales (Wales) are the environmental regulator for these activities in the UK.
WWTPs typically incorporate a combination of different physical, chemical, and biological processes that are considered in three phases: primary, secondary, and tertiary [
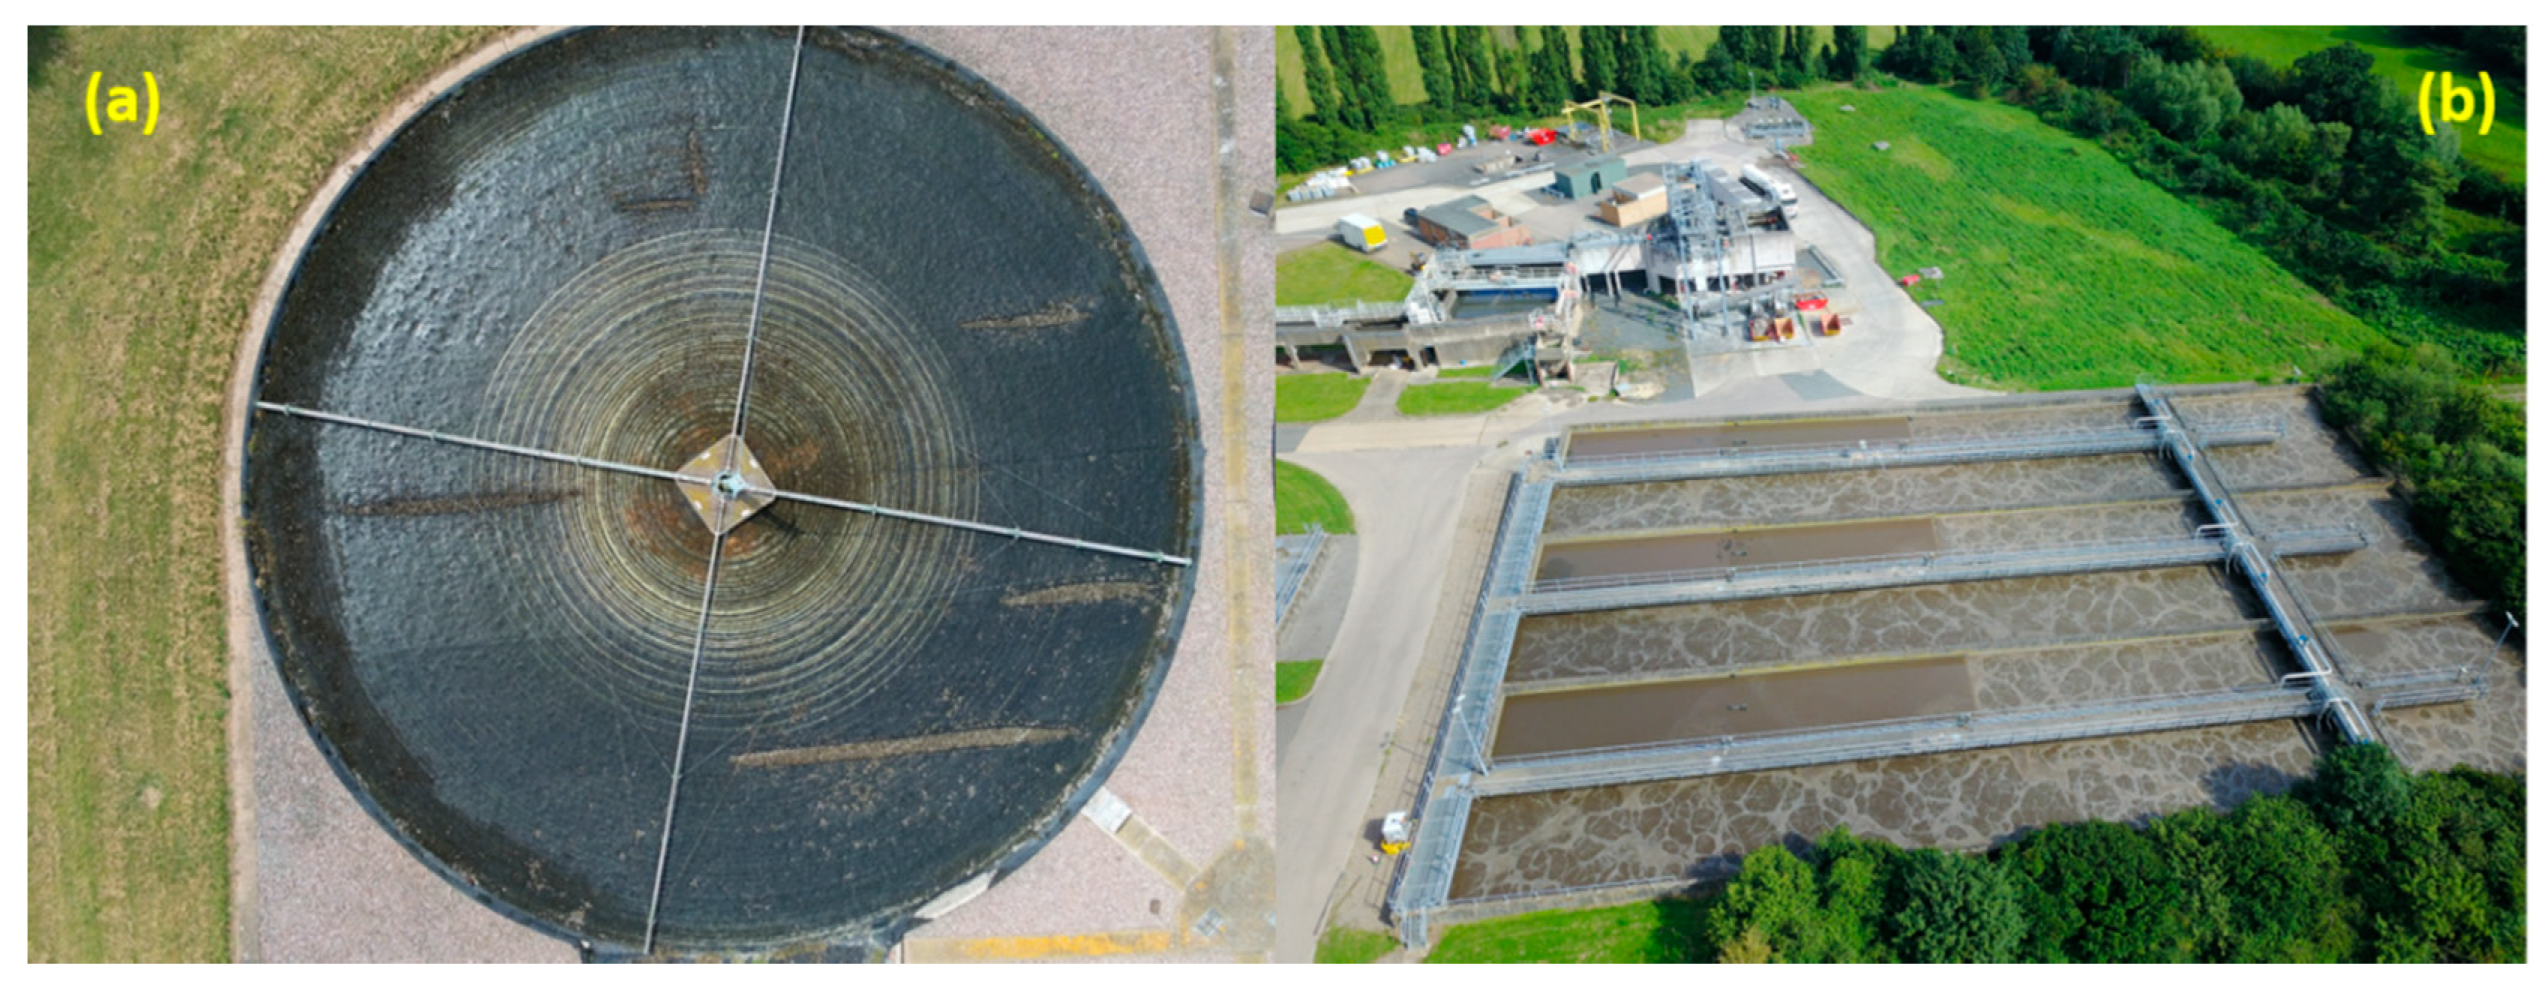
3]. Primary treatment generally involves sedimentation to remove solids that remain after a pre-treatment that deals with larger solids and grit. Secondary treatment addresses organic matter not removed during the primary treatment, whilst also targeting suspended solids and nutrients. Secondary treatment is generally a biological process that is carried out in Activated Sludge (AS) or Trickling Filter (TF) plants (
Figure 1). Tertiary treatment is only usually required if the effluent is discharged into a sensitive or vulnerable receiving water course. Tertiary treatment is often used to remove nutrients or pathogens.
The inspection and maintenance of WWTPs is time consuming and costly. For England and Wales, WWTPs annual maintenance costs are estimated to be more than £14,600 million, with staff costs comprising
ca. 36% of the total [
4]. For sites where the main biological treatment process is based on a single TF, one visit every two weeks is considered to be adequate. Weekly inspections are required for WWTPs with three TFs. If there are more than 10 TFs or there is an AS process, daily inspection is necessary. Although the rates of failure of physical, chemical and biological processes are decreasing [
5], staff costs linked to site maintenance remain high as operators are required to visit sites, some of which are remote, to oversee their operation [
6].
TFs and ASs (
Figure 1) are the most common biological processes in WWTPs in England [
7]. TFs deal with organics and nitrogen in the wastewater [
8], whereas AS also treat the organics and nitrogen, but can also be easily adapted to treat phosphorous [
9]. TFs are most likely to be installed in small and remotely located WWTPs which operators visit but are not based at permanently. Remote WWTPs are considered to be those with a capacity below 10,000 p.e [
10]. In UK, approximately 54% (986) of the WWTPs have a lower capacity than this [
11]. AS consists of aerated tanks containing suspended biomass followed by settling tanks to allow for the separation of the biological flocs from the treated water. It requires a high level of maintenance [
9], as any changes in pollutant levels in the wastewater require a manual adjustment to key parameters, such as the Sludge Retention Time, Return Activated Sludge rates, and the Oxygen Supply Rate. The use of AS is not feasible for small plants and remote sites, because it requires a high level of operator oversight [
9].
The operating problems that are typically associated with TFs are ponding, odours, flies, sloughing, weather concerns, and shock loads [
8]. Except for weather concerns and shock loads, the rest of the operating problems are linked to a lack of uniform irrigation of water from the rotor arms. Some relate to the deterioration of both the media and the rotor arms and they can be visually detected by inspectors. The majority of TF related failures occur during a vernal slough, when the temperature increases and excess biomass builds up until it falls off the unit media. There can also be significant problems when there are rainfall events after a dry period, which result in blocking of both the biofilters and rotatory arms. Blockages of the orifices in the distributing arms can result from poorly designed preliminary screening and grit removal systems, which then has an impact on effluent quality as the wastewater distribution through the media is not unifom (personal communication, Severn Trent). The operating issues that are typically associated with AS are solid separation, bulking, foaming, and aeration malfunction [
12]. The AS problems, such as foaming, bulking, and aeration malfunction, can be visually detected based on a change in bubble density and size patterns [
13].
The current methods of inspecting WWTPs rely on visual observations [
14] or on monitoring the removal efficiency of the different pollutants (e.g., Biological Oxygen Demand (BOD), solids, or nutrients) [
15]. For example, BOD, ammonia, and total suspended solids tests are required to determine the level of performance of TFs and ASs [
16]. Operators are required to visit sites to carry out visual inspections to ascertain mechanical failure causes. Some water utilities have recently used fixed cameras and video surveying technology to decrease the cost of inspection and maintenance practices. For example, Sintra Water Utility used a remote camera to inspect the network piping condition and incorrect connections [
14] and a project funded by the Spanish Agency for Technology Development proposed on-line monitoring of the aeration process in the biological reactor [
17]. In recent years, the use of unmanned aircraft systems (UASs) for asset surveying and inspection tasks has increased considerably. UASs have been used to inspect a varied range of structures within the energy and water industry, including wind turbines [
18], solar panels [
19], dams [
20], and pipe leaks [
21]. However, the potential of such technology to aid WWTPs inspection is still poorly understood and explored.
Similarly, the use of image processing techniques to detect failures in WWTPs has been explored in the last few years. For example, in Switzerland, machine learning algorithms are used to model urban runoff [
22]. In Sweden, UASs are used to measure the temperature in wastewater collection tanks with image processing being used to detect any run-off water [
23]. However, to date, the integration of image processing and UAS technology for the operational monitoring and inspection of WWTP assets is undocumented within the scientific literature. To the authors’ knowledge, the only study using UASs within a wastewater treatment context has been carried out in Spain, where UASs have been used to take samples of WWTP effluent [
24]. UASs are programmed to collect samples from designated locations within the selected basins, but the technology does not make any use of image processing techniques.
Therefore, we set out to explore the potential use of a combined image processing-UAS approach for WWTP asset inspection. The aim of this study is to develop a combined image processing and UAS framework for autonomous asset inspection for the specific case of ASs and TFs. This will be achieved through the following overarching objectives:
- O1.
to develop a set of image processing algorithms for the detection of TFs and ASs failures;
- O2.
to quantify the robustness of the image processing algorithms developed under O1 for the detection of TFs and ASs failures; and,
- O3.
to discuss the findings of O1-O2 within a regulatory and economic context.
2. Materials and Methods
2.1. Study Site Selection
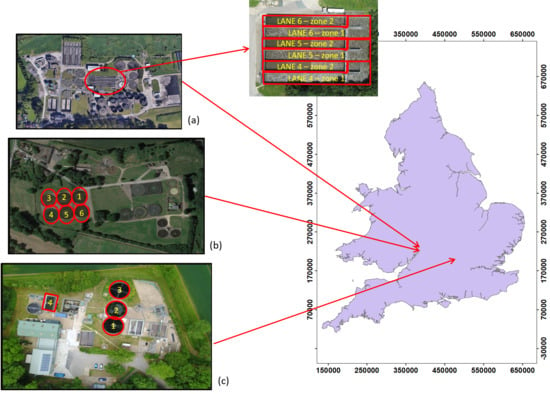
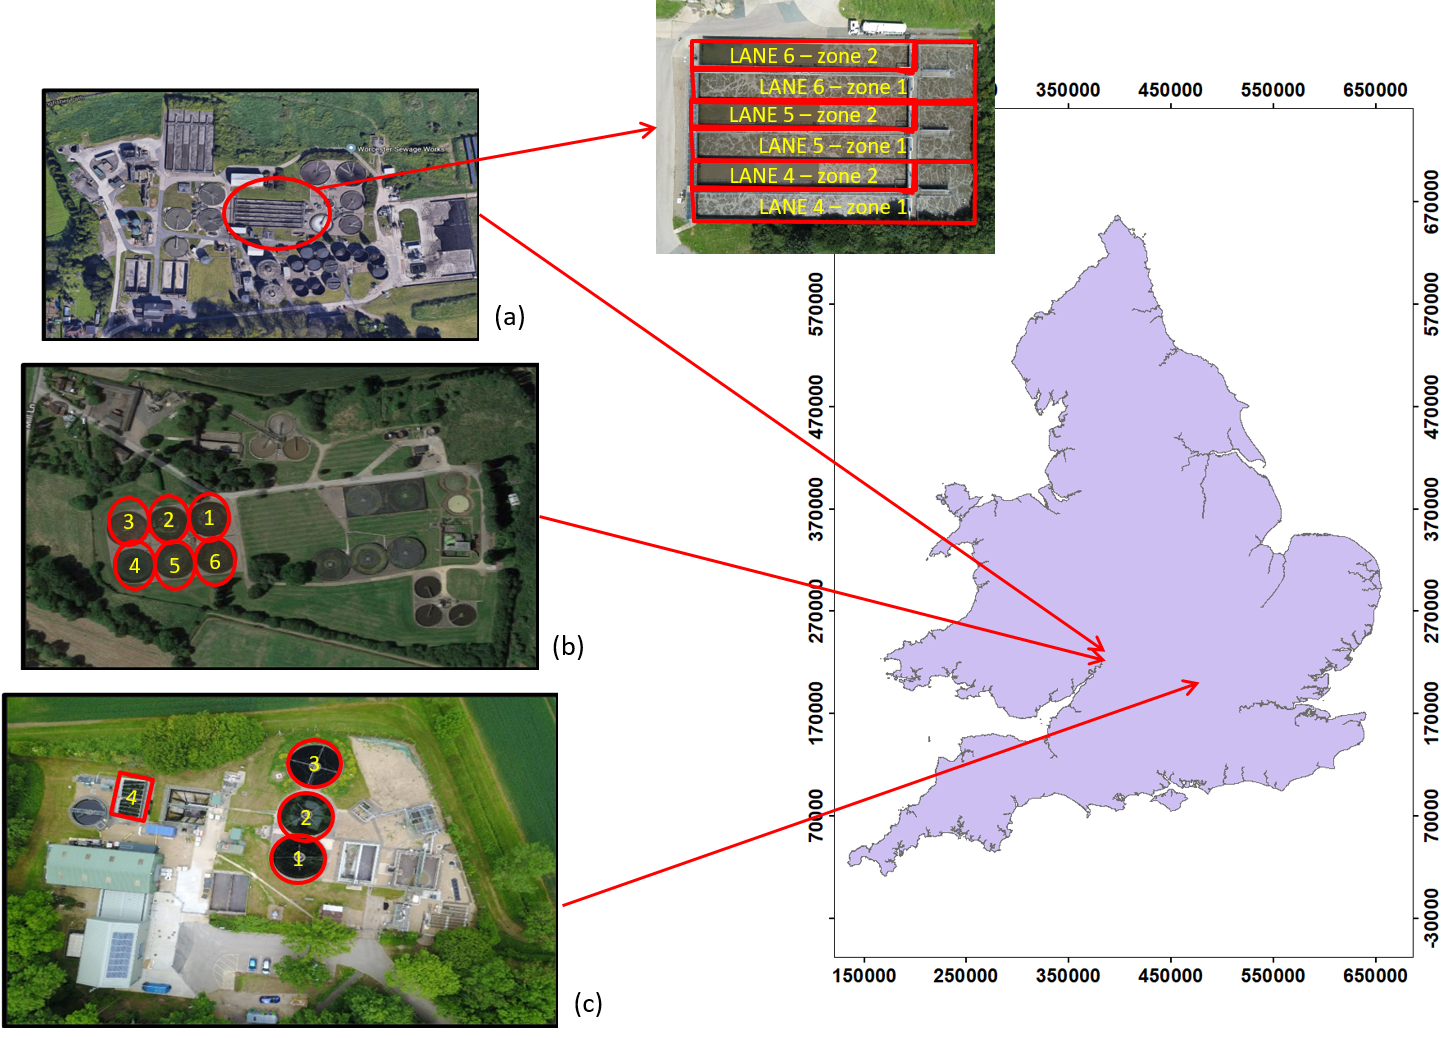
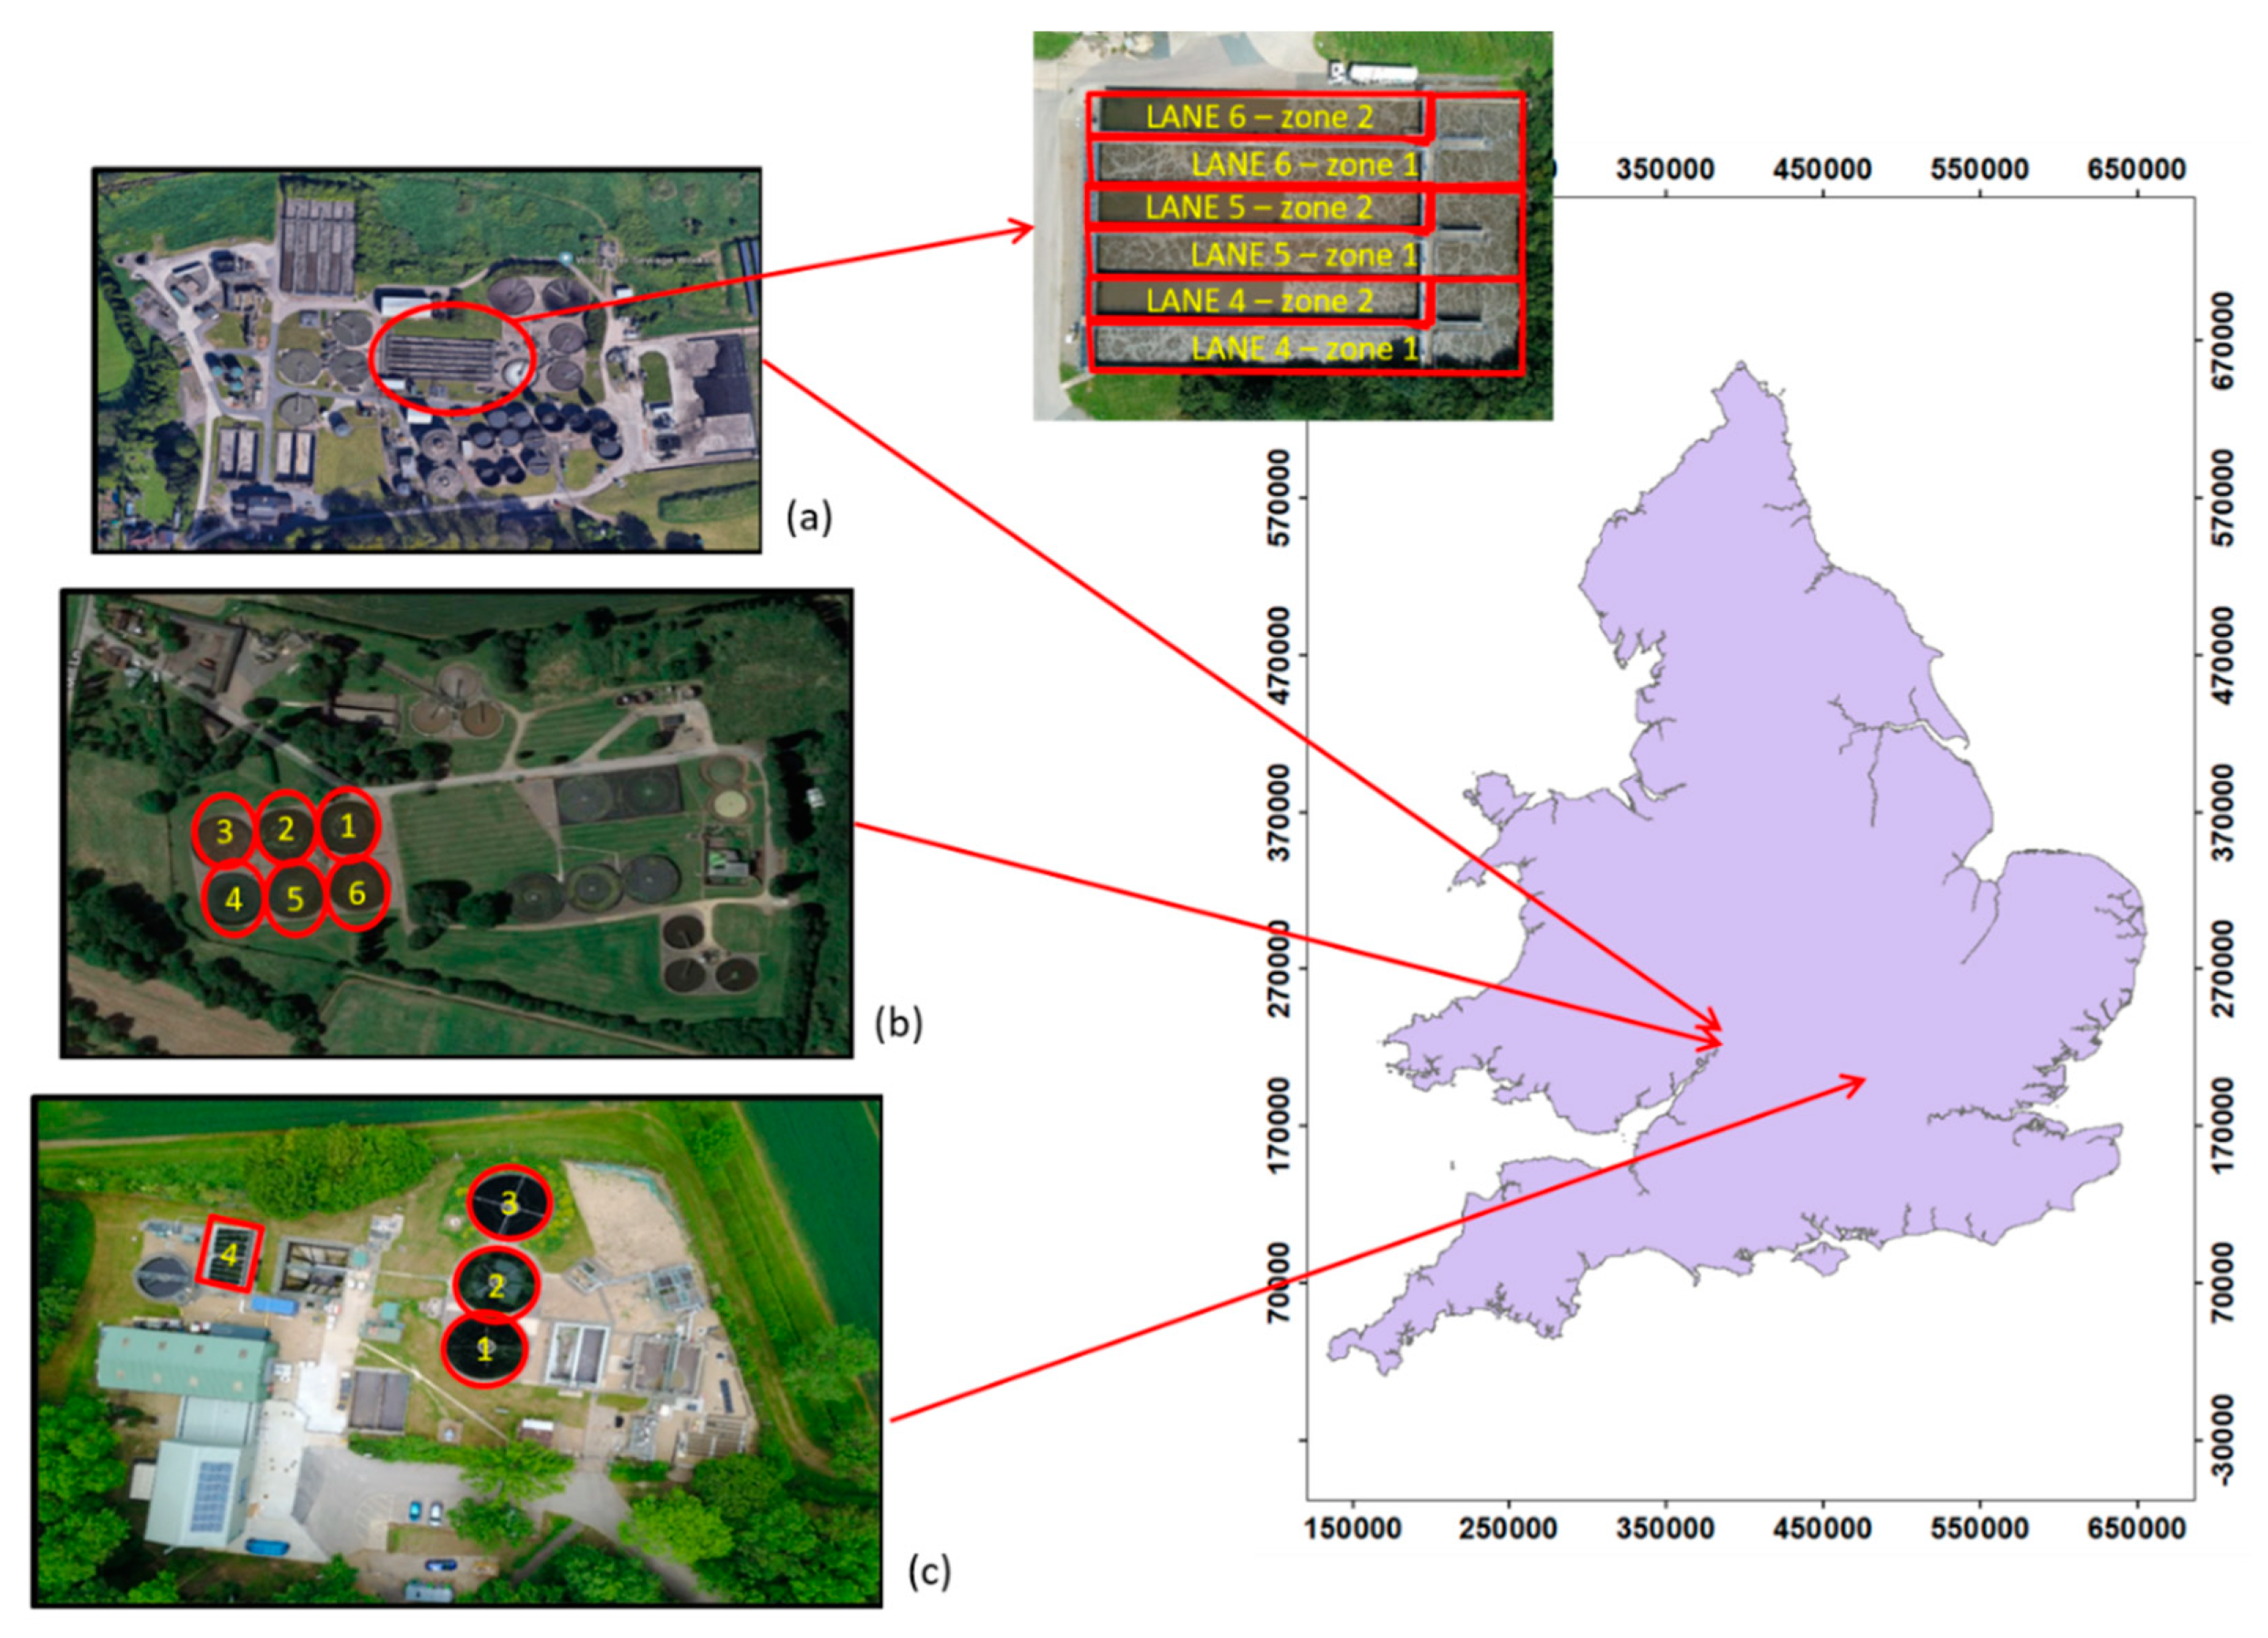
A total of three WWTP study sites (
Figure 2) located in Cranfield University (Cranfield, England), Worcester (Worcestershire, England), and Malvern (Worcestershire, England) were selected based on their capacity (i.e., size) and treatment type (TF/AS). The site at Cranfield is located 80 km north-west from London, one kilometer North of Cranfield University. The WWTP serves the university’s facilities, as well as the student (4500) and staff (1500). There are three TFs at this facility. The three TFs are 5.4 m long and they have a diameter of 12.3 m. They have a total of 10 orifices per arm, with the diameter of each orifice being 24 mm [
25]. The area covered by each TF is 475 m
2. A total of 675 m
3 of wastewater per day is treated and discharged into the Chicheley Brook, which flows into the River Great Ouse, an Environment Agency Freshwater Fish Protected Area [
26]. Within this site, the treatment train comprises an inlet screen, balance tank, a lamella clarifier, a primary TF, then a second lamella clarifier and TF, and to a final TF before the discharge of the effluent to the Chicheley Brook.
The site at Worcester has a capacity for 130,000 p.e. and it is located near the city center. The only biological treatment used in this WWTP is AS. The site has two AS tanks; the first one is 72 m × 44 m × 2.5 m and the second tank is 65 m × 30 m × 2 m. Both of the tanks have three lanes each with aerobic and anoxic configuration. The normal dissolved oxygen in the aerobic zone is 1.5 mg L−1 and for the anoxic zone is 0.8 mg L−1. The treatment train consists of inlet screening and grit removal, sedimentation tanks, AS process, and sedimentation tank.
The site at Malvern has a capacity for 36,000 p.e. and it is approximately 23 km south-west from Worcester, discharging its effluent to Pool brook. The site treats a total of 4500 m3 of wastewater per day, where two-thirds is treated by six TFs of 32 m diameter, whilst the other third is processed by an additional five TFs of 30 m diameter. The 32 m diameter TFs cover a total area of 735.4 m2 each and have arms of 15.3 m length each with a total of 31 orifices per arm and an orifice diameter of 42 mm. The 30 m diameter TFs cover an area of 642.4 m2 each and they have rotating arms of 14.3 m length, with 29 orifices per arm of 37 mm each in diameter. The treatment train consists of inlet screening, and grit removal, followed by a sedimentation tank and distribution to the TFs. The effluent is then treated in a humus tank to clarify it before discharge.
2.2. Data Collection
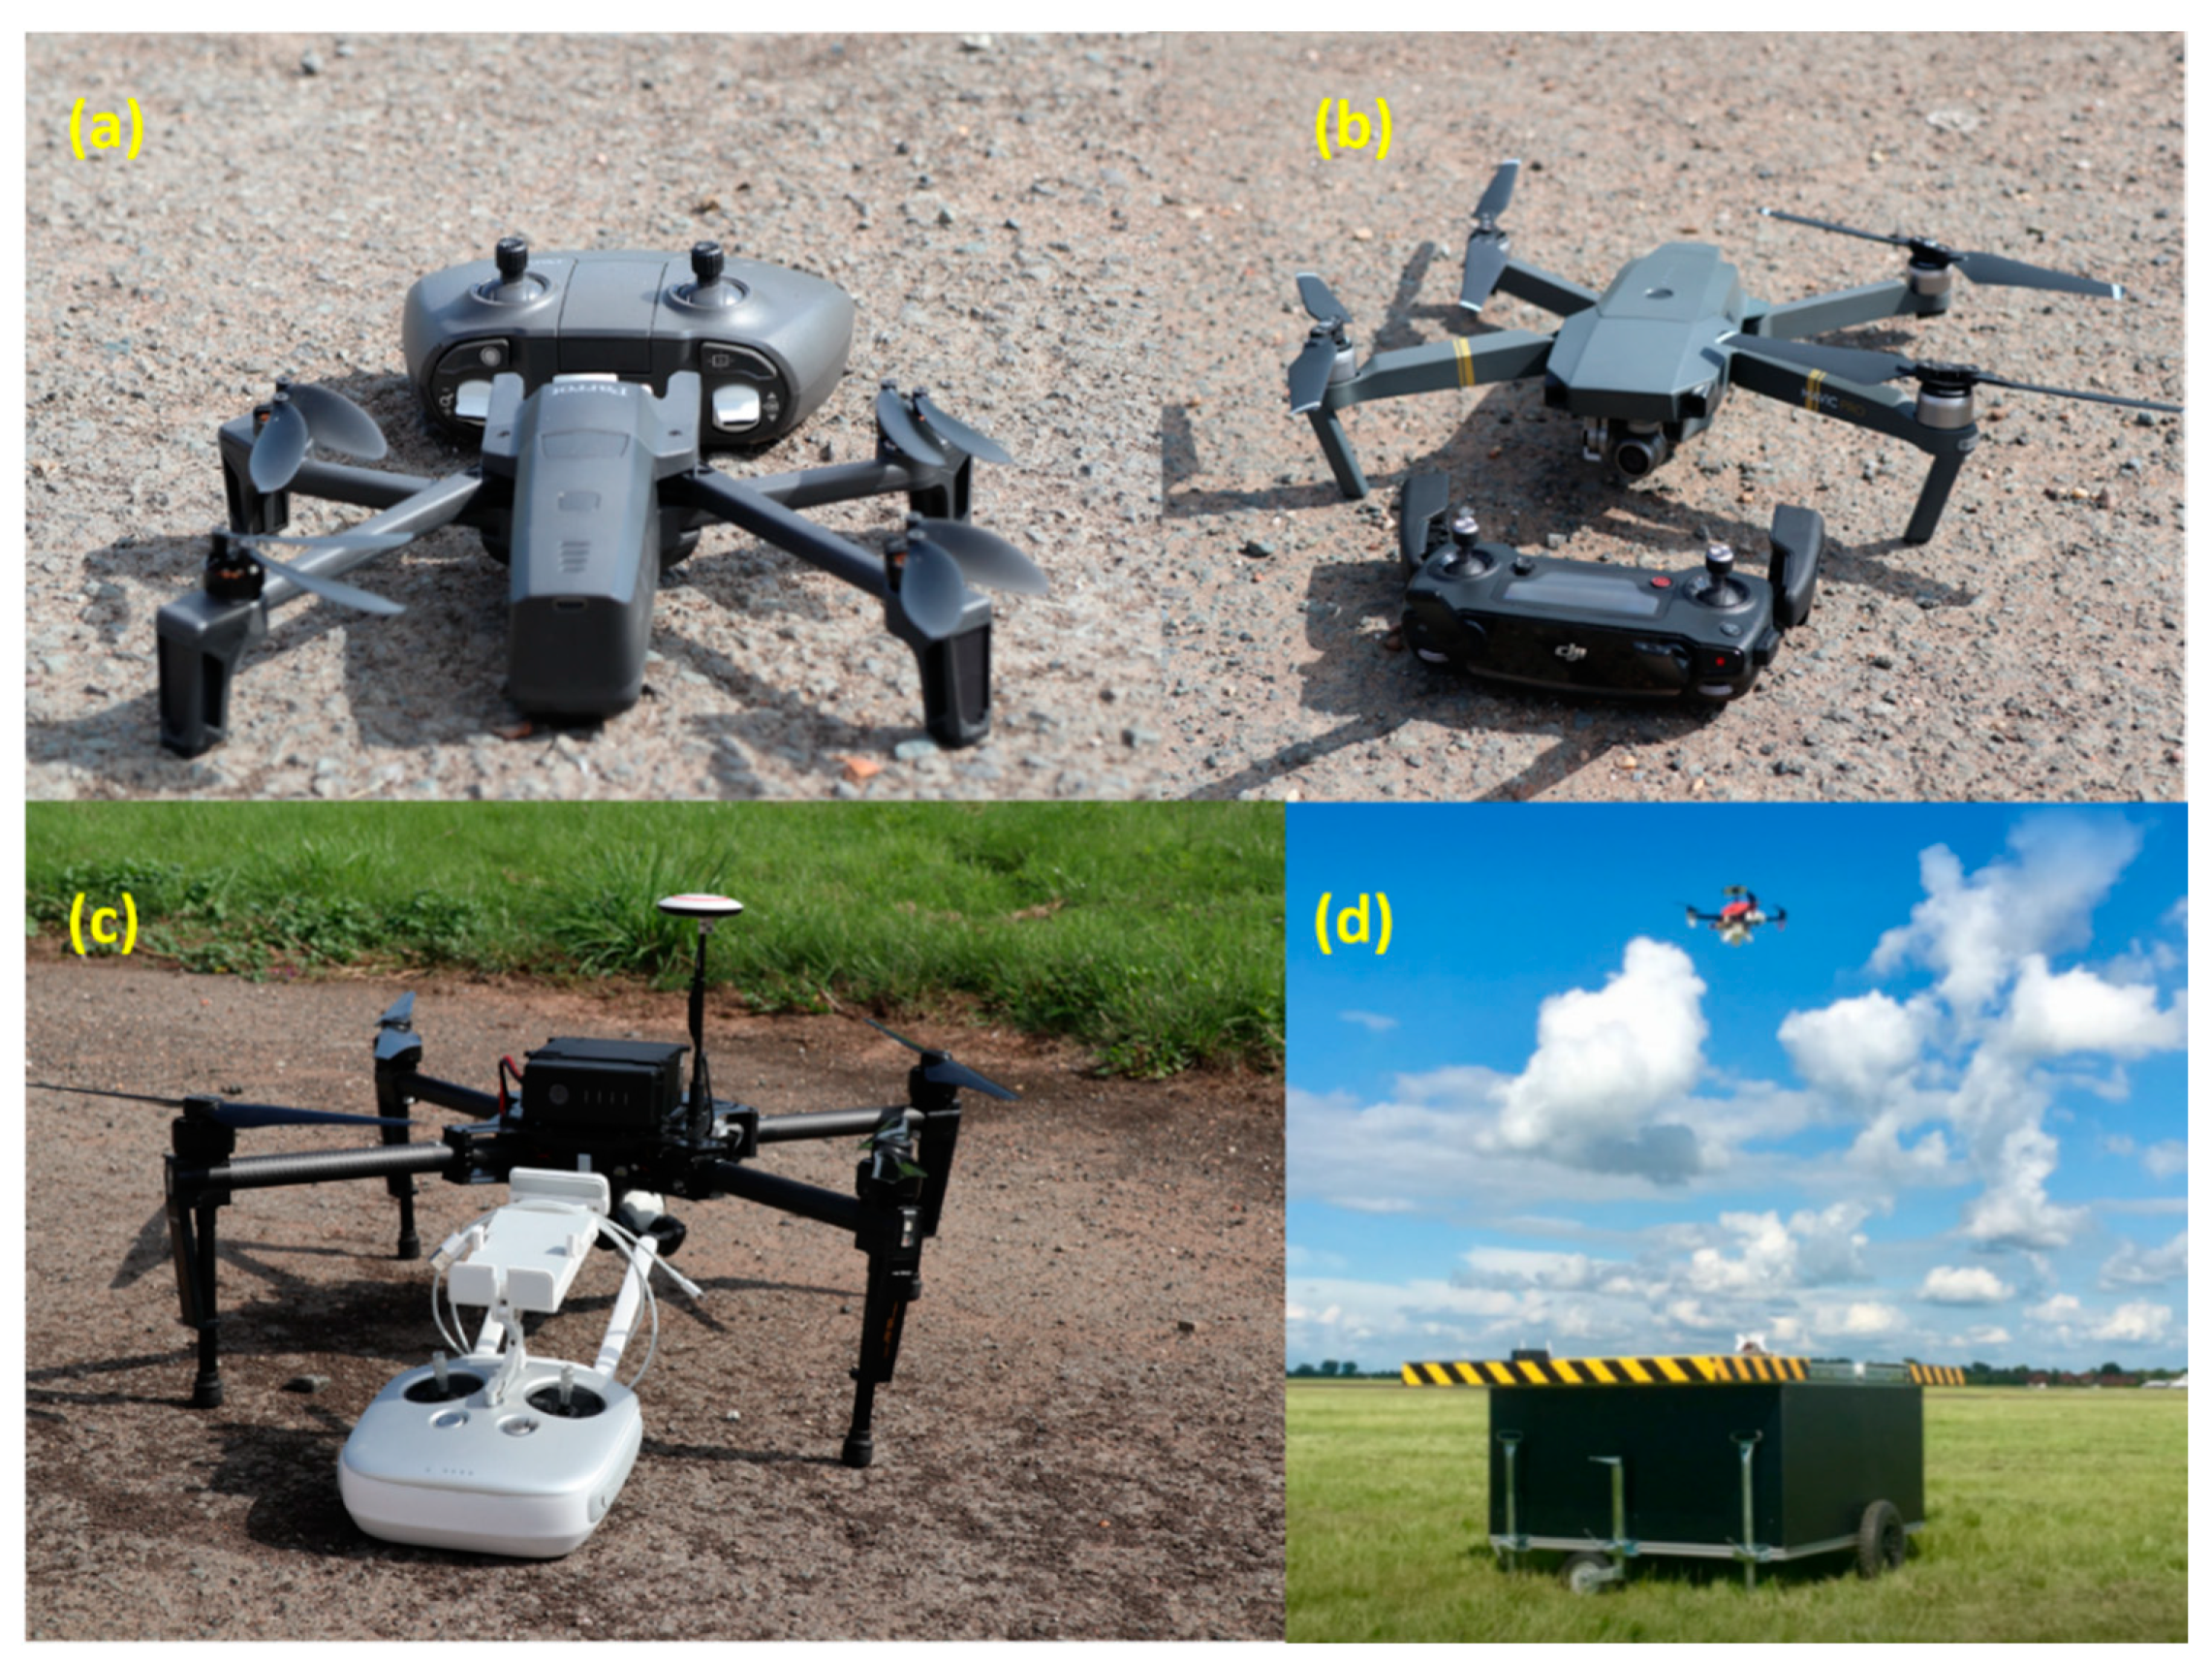
Three different quadcopters were used for image acquisition during an initial pilot study that was carried out at Cranfield WWTP (
Figure 3): the Parrot Anafi (Parrot, France), the DJI MAVIC 2 Pro (DJI Technology Co, China), and the DJI Matrice 100 (DJI Technology Co, China) (
Figure 3). The Parrot Anafi (Parrot, France) is one of the smallest (0.17 m × 0.24 m × 0.06 m) and lightest (0.32 kg) UASs currently available in the market. The platform has a 4K and 21 megapixel (35 mm focal length, 1/2.4” CMOS sensor) camera with High Dynamic Range (HDR) video and digital zoom capabilities. The camera can tilt up and down through 180 degrees. The Parrot Anafi has a high-density Li-Po battery that provides 25 min flight time and a GPS and GLONASS geo-positioning system that enables the smart return to home and accuracy of ±0.5 m in the vertical and ±1.5 m in the horizontal axes. The UAS legs contain a dual-band antenna to optimize the video transmission up to 4 km. It is able to operate in wind speeds up to 50 km h
−1 and speed of up to 55 km h
−1 in the sport mode. The DJI Mavic 2 Pro (DJI Technology Co, China) with a dimension of 0.32 m × 0.24 m × 0.08 m, weighs 0.90 kg. The platform has omnidirectional obstacle sensing and a 20 megapixel (28 mm focal length, 1” CMOS sensor) Hasselblad L1D-20c camera that can be tilted up and down through 180 degrees. The Li-Po 4S battery provides up to 31 min of flight time. The DJI Mavic 2 Pro is equipped with the same GPS as the Parrot Anafi. The UAS legs contain a dual-band antenna for optimizing the video transmission up to 5 km with no obstacles. It is able to operate in wind speeds up to 38 km h
−1 and it is capable of speeds up to 72 km h
−1 in the sport mode. The 0.63 m × 0.56 m × 0.33 m DJI Matrice 100 (DJI Technology Co, China) weighs 2.43 kg and it is equipped with a Zenmuse X3 12.4 megapixel (28 mm focal length, 1/2.3” CMOS sensor) camera that can be tilted up and down through 180 degrees. It has a dual battery compartment for 2 TB48D battery packs, which enable flight times of up to 40 min. The platform is equipped with the same GPS as the other two UASs with an accuracy of ±0.5 m in the vertical and ±2.5 m in the horizontal axe, as it has a foldable antenna providing more positioning accuracy. It is able to operate in winds up to 10 m s
−1 and it is able to reach speeds of up to 22 m s
−1 in the sport mode.
Data that were collected with the UASs were visually compared for image quality purposes for three different ground sampling distances (GSDs) (
Table 1) and the best performing UAS selected for data collection at the two other study sites. The GSDs (1 cm, 2 cm, and 3 cm) were compared at each site to ensure that the decision to select a particular UAS platform was based on a combination of camera performance and UAS estability at different flight altitudes.
Table 1 summarises the flight altitudes that are required for each UAS to achieve the desired GSD. The images were assessed in terms of the clarity of the pictures obtained. At each site, the flight plan was designed with a multi-pass trajectory with nadir frame capture at defined waypoints that ensured 80% overlap both across and along the track and full coverage of the TF and AS assets. A larger number of indistinct images were registered with the DJI Pro (DJI Technology Co, China) platforms. For the DJI Mavic 2 Pro (DJI Technology Co, China), 37% (142 out of 376) of the images collected were blurred. For the DJI Matrice 100, the proportion was 44% (72 out of 162), whereas all 232 images collected by the Parrot Anafi (Parrot, France) met the required data quality standards. Based on these results, only the imagery collected with the Parrot Anafi UAS was used for further data analysis.
The Herotech8 (Herotech8, UK) UAS docking station (
Figure 3) was used to autonomously deploy the UASs. The docking station enables autonomous take-off, landing, flight plan implementation, and image capture at selected waypoints. The docking station is 1.6 m × 1.6 m × 1.1 m, weighs 80 kgs, and requires 230V power and Ethernet wired connection. The data were collected by fully qualified pilots with Remote Pilot Qualifications (RPQ-s) and Civil Aviation Authority (CAA) regulations were adhered to in all circumstances.
A total of 10 consecutive flights that were spaced at equal time intervals were carried out from 10:00 to 12:00 at Cranfield site on the 5/6/19, 19/6/19 and 24/7/19 over two TFs. Flights were made with the arms of the TF both stationary and rotating, where the stationary mode was assumed to represent TF failure. TF failure was identified when water from the orifices was not observed. The lack of water was assumed to represent failure, because the three most common failures in TFs are arm orifice obstruction, decreased speed in arm rotation, and biofilm growth. Only images capturing the TF in full were considered for analysis; those images with cropped sections of the TFs unit were discarded. For the site at Malvern, the data were collected from 14:00 to 16:00 on the 08/08/19 over a total of four flights at six TFs. Data were collected with the TFs arms stationary and rotating, as was the case at the Cranfield site.
For Worcester, the data were collected from 11:00 to 13:00 on the 08/08/19 over 11 consecutive flights. For the AS, failure was simulated through the adjustment of the dissolved oxygen (mg L
−1) via manual operation of the air injected into the system. This was achieved via the adjustment of the air flow valve aperture, which controls the quantity of air (i.e., oxygen) injected into each of the AS lanes.
Figure 2 shows the lanes within the AS at Worcester WWTP. Each lane is divided into two consecutive zones (zone 1 and zone 2) with varying (grading) levels of dissolved oxygen. The amount of injected air controls the pattern of bubbles within each lane; larger amounts of injected air directly results in larger bubbles and larger bubble density patterns. A fully open valve (valve position = 100% aperture) injects air to the maximum capacity of the valve, whereas a fully closed valve (valve position = 0% aperture) is considered to be non-operational. The optimal conditions reported in
Table 2 are specific for the WWTP at Worcester and describe the valve aperture setting used for the WWTP to effectively process the daily wastewater intake. The relationship between injected air and dissolved oxygen is not linear, as bubble size, buoyancy, and, hence, water–gas contact time also play a crucial role [
27,
28]. The modification of the air flow can result in the AS working sub-optimally.
Table 2 summarizes the performance conditions considered for the AS. Sub-optimal conditions 1 represents a sligth increase in the injection of air flow rate in lane 5, whilst holding lane 4 and 6 at optimum levels. Sub-optimal conditions 2 represents a significant increase in air flow rate in lane 4 zone 2 and a significant reduction in the injection of air in lane 5 zone 1, whilst leaving lane 6 within the optimal zone. The two sub-optimal scenarios were selected in consultation with the WWTP operator. An ancillary data set with 46 images with all of the AS working in optimal conditions (
Table 2) was also collected.
2.3. Algorithm Development
The collected imagery was divided into two subsets for calibration and validation purposes. The calibration subset was used for the development of the algorithms, whereas the validation (independent) data set was used to test their accuracy. The validation data had a 50:50 ratio of cases depicting “working” and “sub-optimal” or “failure” configurations (
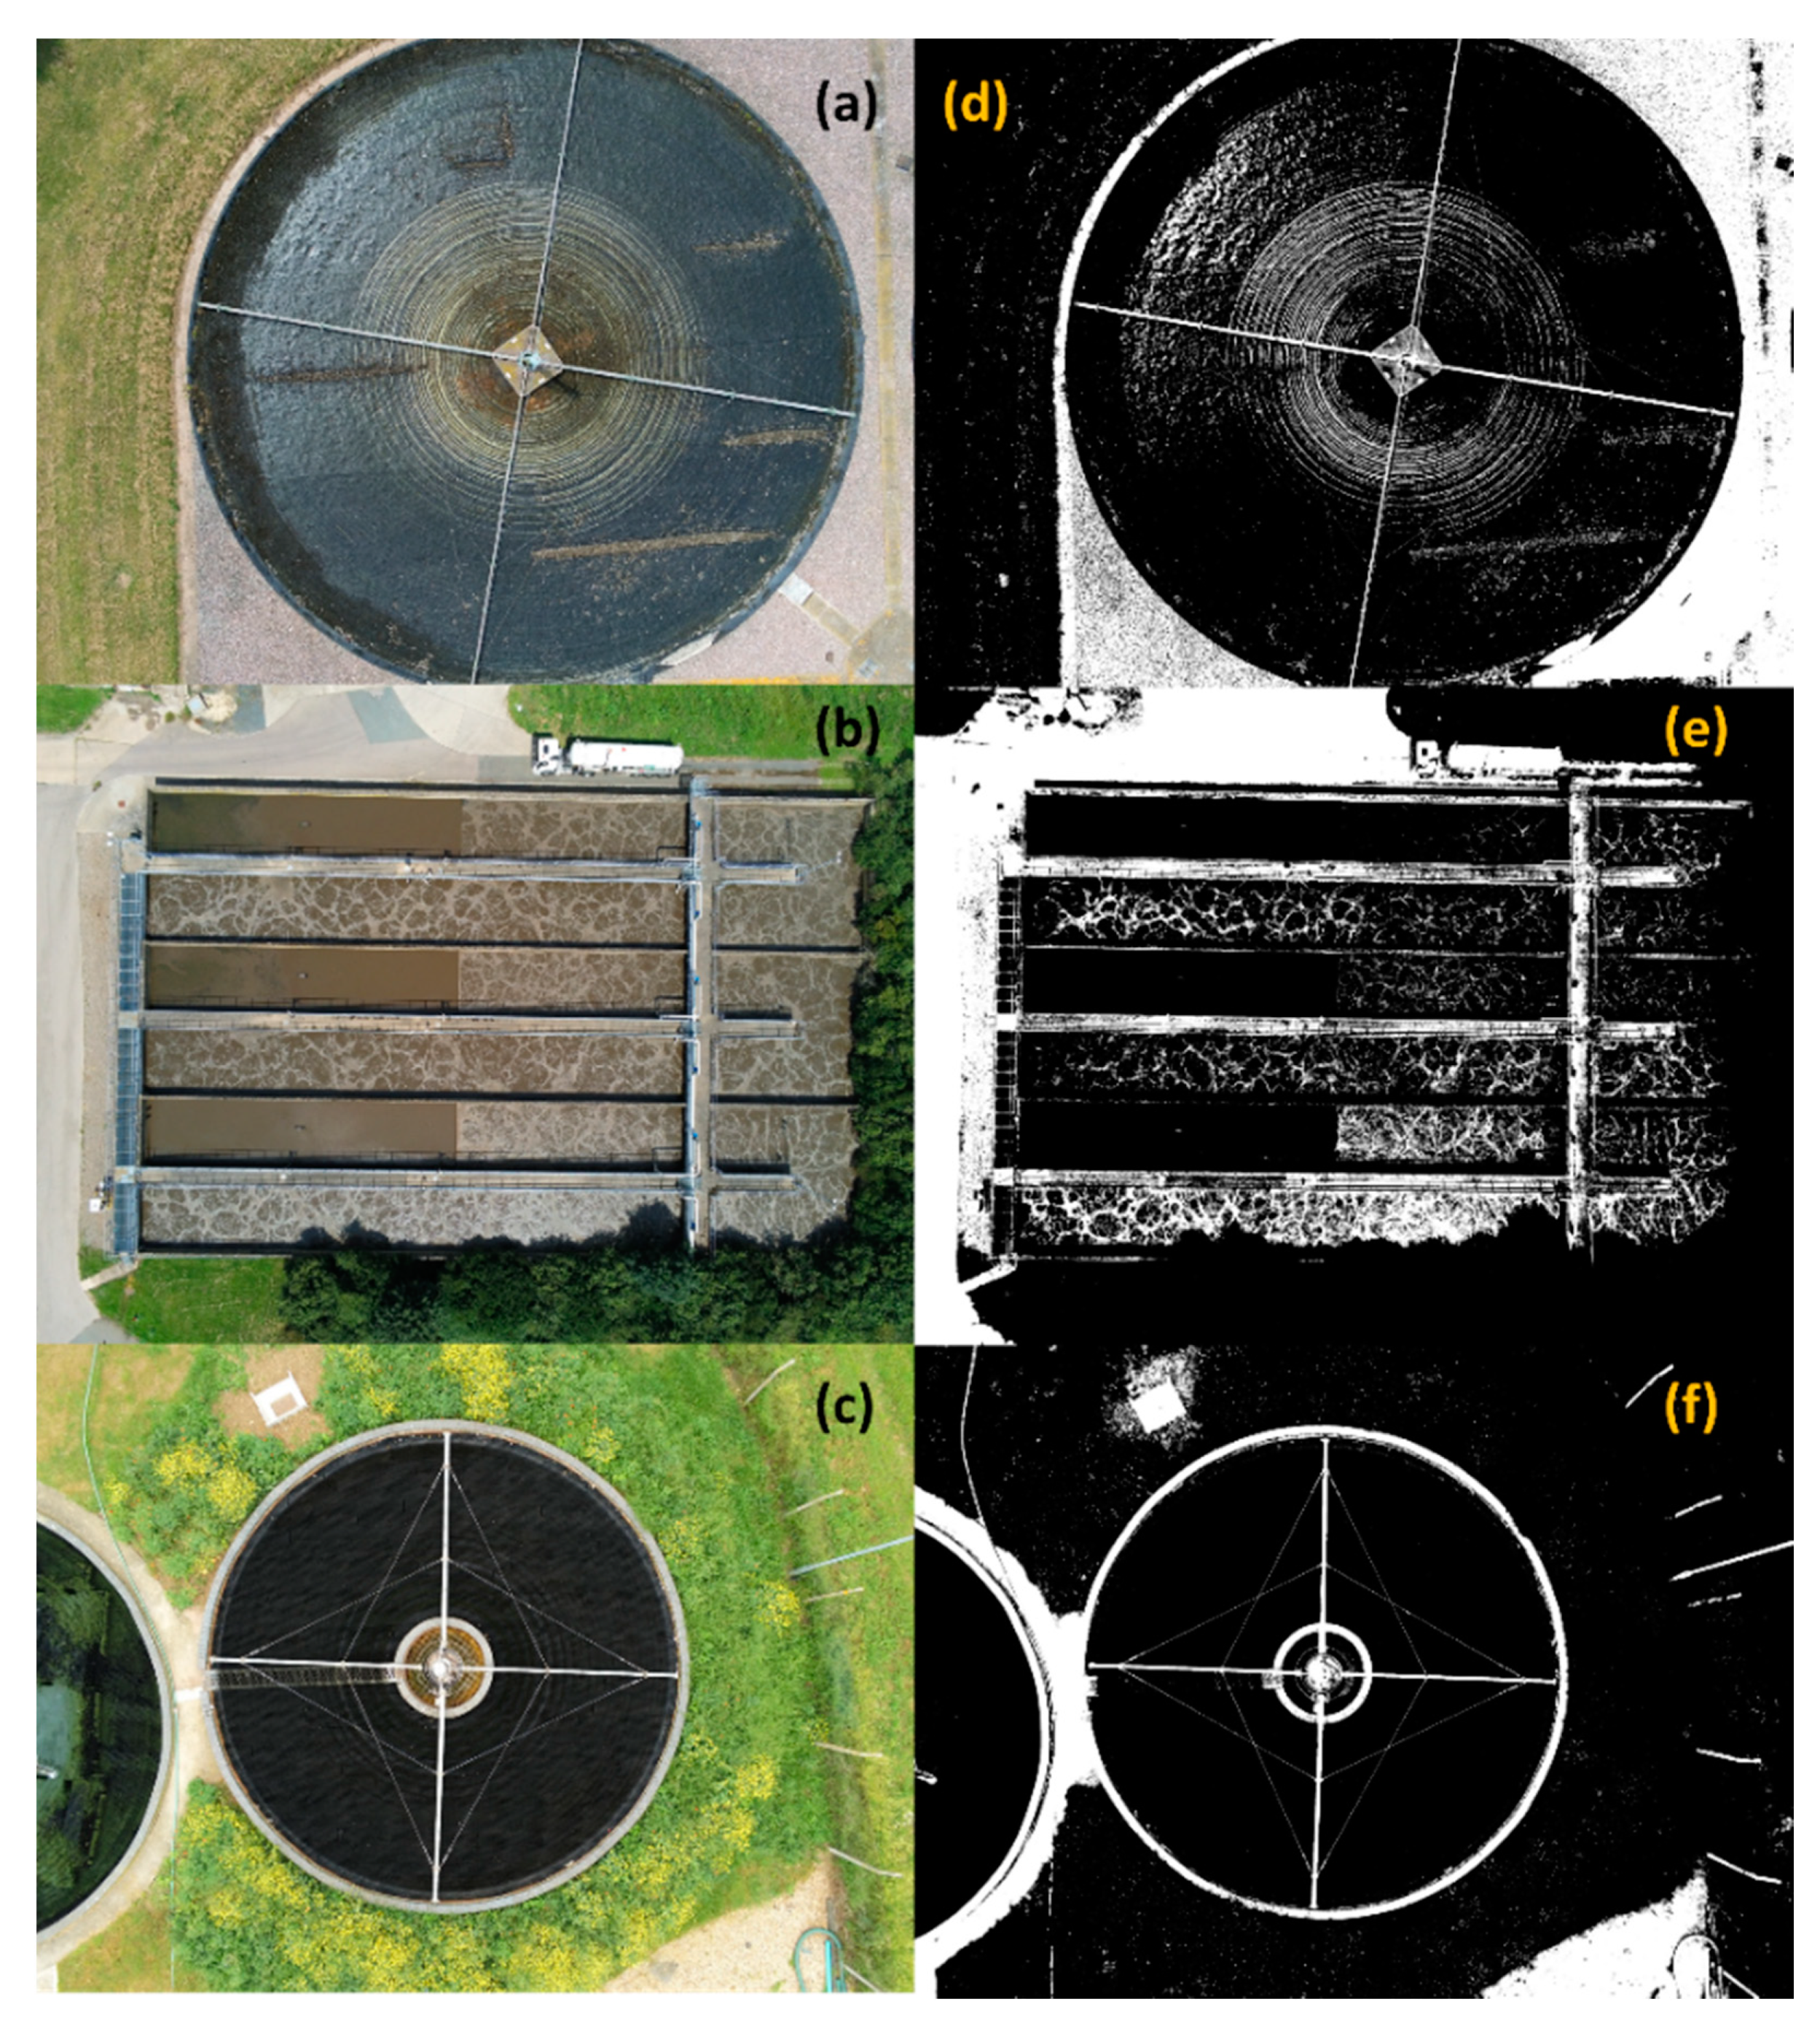
Table 3). The set of algorithms was generated in open source software (OpenCV, Microsoft Visual Studio 2017) to detect TF and AS failure. The Core, imgproc, and HighGUI modules were used for the development of the algorithms (OpenCV, Microsoft Visual Studio 2017). For the TFs, the lack of water flow and, therefore, lack of rotation, was detected based on the number of pixels showing a change in pixel color between a baseline image depicting stationary conditions and the performance conditions being tested. The water coming out of the filter generates a pattern on the still water within the tank that presents a color that is slightly lighter than the background water. The algorithm first detects the different colors of the image for each RGB (Red, Green, and Blue) band. Further, the algorithms detect which pixels are in a determined range of colors previously established as reference values for water. These reference values were obtained through visual assessment of the range of R, G, and B combinations that best represented water in all of the calibration images (32) that were collected at Cranfield, Worcester, and Malvern WWTPs. Any pixels within the range of the combined reference values for R, G, and B were classified as “water”, whereas anything outside the range was classified as “other”. The algorithms then transform the image into black and white, where white represents the “water” class and black represents “other”. The ratio of white over all pixels within the image is then estimated; variations in this ratio with respect to the ratio observed for stationary conditions indicate plausible failure or a change in asset performance. For the TF failure to be diagnosed, the variation in the ratio with respect to the stationary conditions should be larger than the average of the ratios obtained for all of the calibration images collected at the TF under scruitiny.
A similar approach was used to detect whether AS’s were operating sub-optimally. Here, the white pixels are used as an indicator of the quantity of bubbles in the tank. The averaged ratio across all of the calibration images was estimated and used as the reference threshold for sub-optimal performance detection. Ratio values that were above the threshold were considered to indicate a change in aeration pattern and, therefore, sub-optimal conditions.
2.4. Validation
The accuracy (AC) (Equation (1)) of the algorithms in the TF failure or the sub-optinal performance of the AS were estimated while using a confusion matrix [
29]. The true positive ratio (TPR) (Equation (2)), true negative ratio (TNR) (Equation (3)), false positive ratio (FPR) (Equation (4)), and false negative ratio (FNR) (Equation (5)) were estimated, as follows:
where TP (True Positives) is the number of times that the algorithm correctly identified a failure, FN (False Negatives) is the number of times that the algorithm incorrectly identified the failure, TN (True Negatives) is the number of times that the algorithm correctly identified the non-failure, and FP (False Positives) is the number of times it incorrectly identified the non-failure.
4. Discussion
The aim of this study was to develop an image processing and UAS framework for autonomous AS and TF inspection. The objectives focused on: (O1) the development of a set of image processing algorithms for the detection of TFs and ASs failures; (O2) the quantification of the robustness of these algorithms; and, (O3) the discussion of the findings within a regulatory and economic context.
With regard to O1 and O2, algorithms were developed for imagery collected with a Parrot Anafi (Parrot, France) platform. From the three initial platforms tested, the Parrot Anafi (Parrot, France) provided better image quality than the other two UASs tested. This was primarily due to the characteristics of the embedded camera, associated resolution, and UAS stability when in flight. The analysis framework developed here depends heavily on the quality of the collected imagery. Platforms with higher stability and GPS positioning systems enable the collection of still frames and reduce the probability of collecting images that are not suitable for analysis (e.g., the asset not being included in full in a single frame or the capture of multiple assets within a frame). UAS platforms with higher stability and image resolution than that used in this study exist within the market (e.g., Falcon 8 Trinity (ASCTEC, Krailling, Germany)) and should, therefore, provide better input data for the implementation of the framework proposed here.
The results from both the TF and AS analysis suggest that (i) performance of the analysis framework depends upon the site and asset inspected and (ii) the best performance in identifying whether an asset is working or not or is working sub-optinally is achieved with AS assets. Differences in performance are explained by changes in GSD, flight conditions, and environmental conditions. For the TFs, the algorithms at the Malvern WWTP site showed a lower performance (AC = 55%) than that observed for the Cranfield site (AC = 81%) due to a coarser GSD being determined by the size of the TFs and the need to capture the TF in its totality within a single frame. Data collection at Malvern was also influenced by a change in light conditions and brightness between static and rotary status, which resulted in noise within the imagery due to increased levels of reflection. Differences in the data acquired and asset characteristics have an impact on the ratio of white pixels over total pixels, which is best defined on an individual TF and AS basis. Therefore, the framework is expected to perform best when these parameters are adjusted to individual TF and AS assets. The algorithms developed for the AS showed excellent performance, even though the UAS had to fly at a greater altitude with a coarser GSD than used for the TFs. Although very promising, it is unclear at this stage whether these results will be transferable to other AS sites. This needs to be tested in the future to ascertain the capability of the framework presented here. In all instances, input data should be collected preferably under cloudy conditions to ensure that reflectance levels are kept to a minimum and the number of white pixels is identified accurately. The GSD should always be finer than 2 cm to allow for the algorithms to detect changes in the ratio of white pixels vs. total pixels.
The framework has the potential to be integrated with other existing applications of UAS surveying within the water industry. For example, dam [
20] and leakage inspection [
21]. In the short term, the framework could be tailored in order to detect biofilm growth failure and monitoring of its status over time. In the medium to long term, the framework could be expanded to include the inspection of other assets or features of interest, such as the inspection of the wires of the distribution arms in TFs, which are affected by temperature and need to be adjusted on a regular basis [
16] or the assessment of tertiary treatment (e.g., wetlands) [
30,
31]. Other applications could expand to mapping the trophic status of reservoirs [
32].
The use of the Herotech8 autonomous docking port enables the automated deployment and implementation of extended (wide area) flights, which facilitates the frequent collection of high resolution images at pre-determined way points without the need for inspectors to be onsite. It provides an integrated solution for the automated and autonomous inspection of assets within WWTPs and not just limited to TFs and ASs. The imagery collected will be analyzed in real-time via an on-board computer and detection of asset failure will be directly communicated to the central control room, where informed management decisions about the asset will be taken. The framework will not require capital investment (e.g., UAS) to be made at all WWTPs; it is envisaged that autonomous vehicles that are already available to transport the UAS platform will move the equipment from plant to plant without the requirement of human intervention. This will be relatively easy to achieve in WWTPs that are remotely located, but in close proximity to each other. Therefore, capital investment could cover inspection of multiple plants per UAS platform purchased. In addition to the capital investment required to make the framework operational, there would be a need to make provision for maintenance of the inspection equipment and the provision of parts and spares should the platform crash unexpectedly. Costs that are associated to routine inspections are expected to decrease, as operators will only be required to visit the sites when the WWTP assets fail or the inspection equipment becomes non-operational. Savings are expected to be in the order of £37,000 annually for small remote plants assuming a current rate of inspection of two visits a week by a single operator and an average cost of £360 per full day visit (2020 prices).
Key limitations curtailing the uptake of the methodology relate to in-country specific airspace regulation and platform operational constrains. With regard to the UK airspace regulations, UASs can only be flown within the visual line of sight. The CAA requires collision avoidance capability to be integrated within the autonomous UAS capability in order to be able to carry out missions beyond the visual line of sight. The regulations states that a UAS can only be operated autonomously if “the remote pilot of a small unmanned aircraft maintains direct, unaided visual contact with the aircraft sufficient to monitor its flight path in relation to other aircraft, persons, vehicles, vessels, and structures for the purpose of avoiding collisions” [
33]. To date, there is no collision avoidance system on the market with CAA approval. Extended Visual line of Sight (EVLOS) and Beyond the Visual Line of Sight (BVLOS) missions may both be curtailed by the need to have multiple spotters along the flying area to ensure no collision occurs; exemption from the regulation to operate EVLOS/BVLOS is only granted to those UAS pilots with specific levels of competency for low risk missions. Both requirements will have to be met by the water industry if the framework proposed here is to be used for multiple asset inspections. With regard to the platform operational constrains, UAS missions are limited by weather conditions (i.e., temperature, wind and rain) as well as battery endurance. UAS platforms are unable to operate in gusty conditions, with a large proportion being unable to operate in rainy conditions. Battery endurance, usually limited to less than 50 min, is severely compromised for temperatures < 10 °C. Similarly, high temperatures can have an adverse effect on battery endurance.
However, albeit the existence of limitations, the algorithms developed here could also be used for imagery collected with fixed cameras distributed at key points within the WWTPs. There are compact cameras that are available in the market that range from 42.1 megapixles (£3500) to 20.1 megapixels (≈£800) (Sony, Japan) capable of providing high quality imagery, as required for the framework proposed here. This could overcome the regulatory constraints identified for UAS operations albeit having an impact on the extent of the area that can be covered and the number of assets inspected simultaneously. Similarly, it will require large structures that ensure the asset is captured in full in a single frame. For example, for the AS, the camera will have to be installed at a height of 20 m to be able to capture the AS facility in a single frame.
This study demonstrates that the rapid and remote surveying of multiple assets within the water industry is feasible through the combined use of image processing and UASs. The results presented here are a step forward towards decreasing the cost of asset inspections in WWTPs and de-risking surveillance activity. The next steps should focus on integrating real-time capability and autonomous WWTP transfer within the proposed framework. The development of a fully automated inspection system will require the algorithms to be further developed, so that they can work in real-time without any visual manipulation of the data. This will require the use of machine learning techniques able to run automatically the processes described here for any combination of WWTP asset, light conditions, UAS platforms and cameras, amongst other parameters. The study presented here is a first step towards addressing this challenge and further research is required to form a more comprehensive picture of how the proposed framework could be made widely transferable.


