Article

Consistency Analysis of Remote Sensing Land Cover Products in the Tropical Rainforest Climate Region: A Case Study of Indonesia

1
Geological Engineering and Institute of Surveying and Mapping, Chang’an University, Xi’an 710054, China
2
State Key Laboratory of Resources and Environment Information System, Institute of Geographic Sciences and Natural Resources Research, CAS, Beijing 100101, China
3
University of Chinese Academy of Sciences, Beijing 100049, China
4
Jiangsu Center for Collaborative Innovation in Geographical Information Resource Development and Application, Nanjing 210023, China
5
The Second Topographic Surveying Brigade of Ministry of Natural Resources, Xi’an 710054, China
*
Author to whom correspondence should be addressed.
Remote Sens. 2020, 12(9), 1410; https://doi.org/10.3390/rs12091410
Submission received: 7 April 2020 / Revised: 26 April 2020 / Accepted: 28 April 2020 / Published: 30 April 2020

Abstract

:
Land cover changes in tropical rainforest climate zones play an important role in global climate change and the functioning of the Earth’s natural system. Existing research on the consistency of different land cover products has mainly focused on administrative divisions (continental or national scales). However, the ongoing production of large regional or global land cover products with higher resolutions requires us to have a better grasp of confusing land types and their geographical locations for different zoning (e.g., geographical zoning) in order to guide the optimization of strategies such as zoning and sample selection in automated land cover classification. Therefore, we selected the GlobeLand30-2010, GLC_FCS30-2015, and FROM_GLC2015 global land cover products with a 30-m resolution covering Indonesia, which has a tropical rainforest climate, as a case study, and then analyzed these products in terms of areal consistency, spatial consistency, and accuracy evaluation. The results revealed that (a) all three land cover products revealed that forest is the main land cover type in Indonesia. The area correlation coefficient of any two products is better than 0.89; (b) the areas that are completely consistent among the three products account for 58% of the total area of Indonesia, mainly distributed in the central and northern parts of Kalimantan and Papua, which are dominated by forest land types. The spatial consistency of the three products is low, however, due to the complex surface types and staggered distributions of grassland, shrub, cultivated land, artificial surface, and other land cover types in Java, eastern Sumatra, and the eastern, southern, and northwestern sections of Kalimantan, where the elevation is less than 200 m. Given these results, land cover producers should take heed of the classification accuracy of these areas; (c) the absolute accuracy evaluation demonstrated that the GLC_FCS30-2015 product has the highest overall accuracy (65.59%), followed by the overall accuracy of the GlobeLand30-2010 product (61.65%), while the FROM_GLC2015 exhibits the lowest overall accuracy (57.71%). The mapping accuracy of the three products is higher for forests and artificial surfaces. The cropland mapping accuracy of the GLC_FCS30-2015 product is higher than those of the other two products. The mapping accuracy of all products is low for grassland, shrubland, bareland, and wetland. The classification accuracy of these land cover types requires further improvement and cannot be used directly by land cover users when conducting relevant research in tropical rainforest climate zones, since the utilization of these products could lead to serious errors.

1. Introduction

Land cover classification and mapping is an important basic goal in global change research and provides a data source for many studies on global change [1,2,3]. The spatial distribution of land cover and its changes have certain effects on the material circulation, the dynamic balance of water and heat, and the structure and function of the ecosystem [4,5,6,7,8,9,10]. The traditional investigative method based on field surveys has been used for many years, requires a large amount of investment, and features limited precision. Recently, however, the acquisition of land cover information based on remote sensing has become an important means of quickly obtaining regional and global land cover information due to its ability to rapidly determine land surface cover distribution and dynamic change information in the region of interest [11,12,13,14,15,16].
At present, there are many sets of land cover products with different resolutions, such as the Global Land Cover Fine Surface Covering 30-2015 (GLC_FCS30-2015), produced by the Institute of Remote Sensing and Digital Earth, Chinese Academy of Sciences [17], the GlobeLand30-2010, produced by the National Geomatics Center of China [18], the Fine Resolution Observation and Monitoring of Global Land Cover (FROM_GLC), produced by Tsinghua University [19], the Moderate-resolution Imaging Spectroradiometer (MODIS) of Boston University [20], the GLC2000 of the European Union [21], and others. The emergence of these remote sensing products provides basic data for industry and academia that can be utilized to perform relevant production research [22]. At the same time, it should not be ignored that different products may use different classification systems, classification methods, and satellite images. Hence, the resulting land cover products themselves, as well as the series of follow-up studies derived from these land cover products, will vary [23,24]. The reason for this variety is that these remote sensing land cover products lack consistent benchmarks, and land cover users do not understand the spatial accuracy characteristics of these products in different regions and the advantages and disadvantages of specific field applications.
Driven by the comprehensive promotion of practical demand and theoretical research, scholars have conducted comparative analyses of multi-source remote sensing land cover products on regional and global scales [25,26,27]. At the regional scale, Song et al. [28,29] studied the classification accuracy and spatial distribution of different land cover products in China, concluding that these products had obvious errors and serious confusion in some local areas. The research of Kuenzer et al. [30] in the Mekong River Basin revealed that there is an obvious confusion phenomenon in the staggered distribution areas of different land cover types. Liang et al. [31] assessed the accuracy and consistency of the four global land cover products in the Arctic region in terms of land cover type distribution, spatial superposition, and validation samples. Their results showed that the overall accuracy of the Climate Change Initiative Land Cover (CCI-LC) 2000 is highest in the Arctic region, at 63.5%, while the overall accuracy of the MODIS data is lowest, at only 29.5%. Kang et al. [32] introduced the landscape index to evaluate the consistency of different land cover products in 2010, concluding that although the area ratio of land use types for these three products was more consistent in northern Laos, the spatial pattern characteristics of the different land use types were significantly different at a 30-m scale. On a global scale, Giri et al. [33] studied the consistency between Global Land Cover (GLC) 2000 and MODIS land cover products, finding that these products have higher overall consistency but lower consistency for finer land cover types. Herold et al. [34] analyzed the consistency of four global land cover datasets with a resolution of 1 km. Their results showed that the land cover types of evergreen broadleaf forest, snow, and bare land are more consistent, and the accuracy of producers and users is higher. The above studies demonstrate the importance and value of analyzing the consistency of multi-source remote sensing land cover products from different aspects.
However, most of these studies focused on administrative divisions (continental or national scales). In fact, there are some types of surface cover under different zoning (e.g., geographical or ecological zoning) with poor accuracy due to the cognitive standards and complexity of the spatial patterns of ground objects. The current production of land cover products with a high resolution of 30 m in large regions or globally requires a better grasp of the confusing land cover types and their geographical locations in different zones in order to guide the optimization of strategies such as zoning and sample selection during automated land cover classification. Hua et al. [35] performed consistency studies on different land cover data at global and continental scales through climate and altitude zoning. Their results revealed that the spatial consistency of Europe is high, at 66.57%, and the overall consistency of the frost climate is as high as 95%. Research on the consistency of different land cover products in tropical rainforest climate zones is lacking, however, even though land cover changes in tropical rainforest climate zones will impact the greenhouse effect, energy balance, and water transport, thereby affecting climate change on a regional or even global scale. Therefore, land cover and its changes in tropical rainforest climate zones have important implications for global climate change. In addition, existing data sources used in the consistency study of different land cover products focus mainly on products with lower spatial resolution. However, low-resolution products, such as MODIS, CCI-LC2000, and GLC2000 have some limitations when carrying out in-depth research on natural geography, the ecological environment, and global change. Hence, there is an urgent need to evaluate and analyze the consistency of current higher-resolution land cover products. Indonesia is located around the equator and is the largest archipelagic country in the world. Its territory spans Asia and Oceania, and it plays an important role in global strategy. Due to its typical tropical rainforest climate, Indonesia is rich in resources, and its land cover types are complex and diverse. The distributions of population, agriculture, forestry, mining, and other resources on each of its islands are unique.
Therefore, in order to make up for the shortcomings of the existing research, this study used Indonesia, with its typical tropical rainforest climate characteristics, as the research area, and the global land cover products GlobeLand30-2010, FROM-GLC2015, and GLC_FCS30-2015 as the data sources to carry out the analysis of areal consistency, spatial consistency, relative accuracy, and absolute accuracy evaluation methods. The study results can provide valuable reference material for research in the field of global ecological environment change and climate change.

2. Study Area and Data

2.1. Study Area

Indonesia (Figure 1) is located in Southeast Asia and is connected to countries such as Papua New Guinea, Timor-Leste, and Malaysia. It consists of 17,508 islands and is the largest archipelagic country in the world. The larger islands include Kalimantan, Sumatra, Sulawesi, and so on. The interior of the islands is mostly rugged mountains and hills, with only narrow plains along the coast. Kalimantan has mountains extending from its center to the west, with vast coastal plains and swampy southern regions. On Sumatra, the mountain range is oblique, extending from northwest to southeast, with hills and wider coastal alluvial plain in the northeast of mountain range. Sulawesi is mostly mountainous, with only narrow plains along the coast. Indonesia mainly has a tropical rainforest climate, and seasonal changes in precipitation due to monsoon. The annual rainfall in the plain areas ranges from 1780 to 3175 mm, while yearly totals in the mountain areas can reach 6100 mm.

2.2. Data and Preprocessing

We selected three datasets of higher-resolution global land cover products that are currently available free of charge for consistent research, i.e., the GlobeLand30-2010 (http://www.globallandcover.com/), FROM-GLC2015 (http://data.ess.tsinghua.edu.cn/), and GLC_FCS30-2015 (http://data.casearth.cn/sdo/detail/5d904b7a0887164a5c7fbfa0). There are differences among the data sources, classification systems, and classification methods used in the production of these products. The information regarding the main parameters of the three selected land cover products is listed in Table 1.
These products require preprocessing prior to accuracy evaluation and consistency analysis, including data clipping, projection conversion, and classification system merging. In this study, the Geographic Information System (GIS) software ArcGIS developed by the Environmental Systems Research Institute (ESRI) was used to preprocess the original data. We used Indonesia’s vector border cropping to obtain three land cover products encompassing the study area. The three original land cover products selected in this study are all in the same reference systems, and their geographic coordinate systems are all WGS84. In order to carry out subsequent accuracy evaluation and consistency analysis of different products, the coordinate system of three products is projected as World Mercator. Since the classification system types as well as the formulations of related standards were inconsistent among the three products (Table 2), this study selected the GlobeLand30-2010 classification system as a reference to standardize the code of the FROM_GLC2015 and GLC_FCS30-2015 land cover types, ultimately forming a new classification system (Table 3). The spatial distributions of the three land cover products in Indonesia after preprocessing are shown in Figure 2.

3. Methods

3.1. Area Composition Similarity

The correlation coefficient of the land cover type area can quantitatively evaluate the similarity degree of the same land cover type between different data [36]. The formula is:
R i = i = 1 n X i X ¯ Y i Y ¯ i = 1 n X i X ¯ 2 i = 1 n Y i Y ¯ 2
where R i is the area correlation coefficient of two land cover data, i is the land cover type, X i is the total area of type i in land cover dataset   X ,   Y i is the total area of type i in land cover dataset   Y ,   X ¯ is the average of the total area of all types in land cover dataset   X ,   Y ¯ is the average of the total area of all types in land cover dataset   Y ,   and   n is the total number of land cover types.

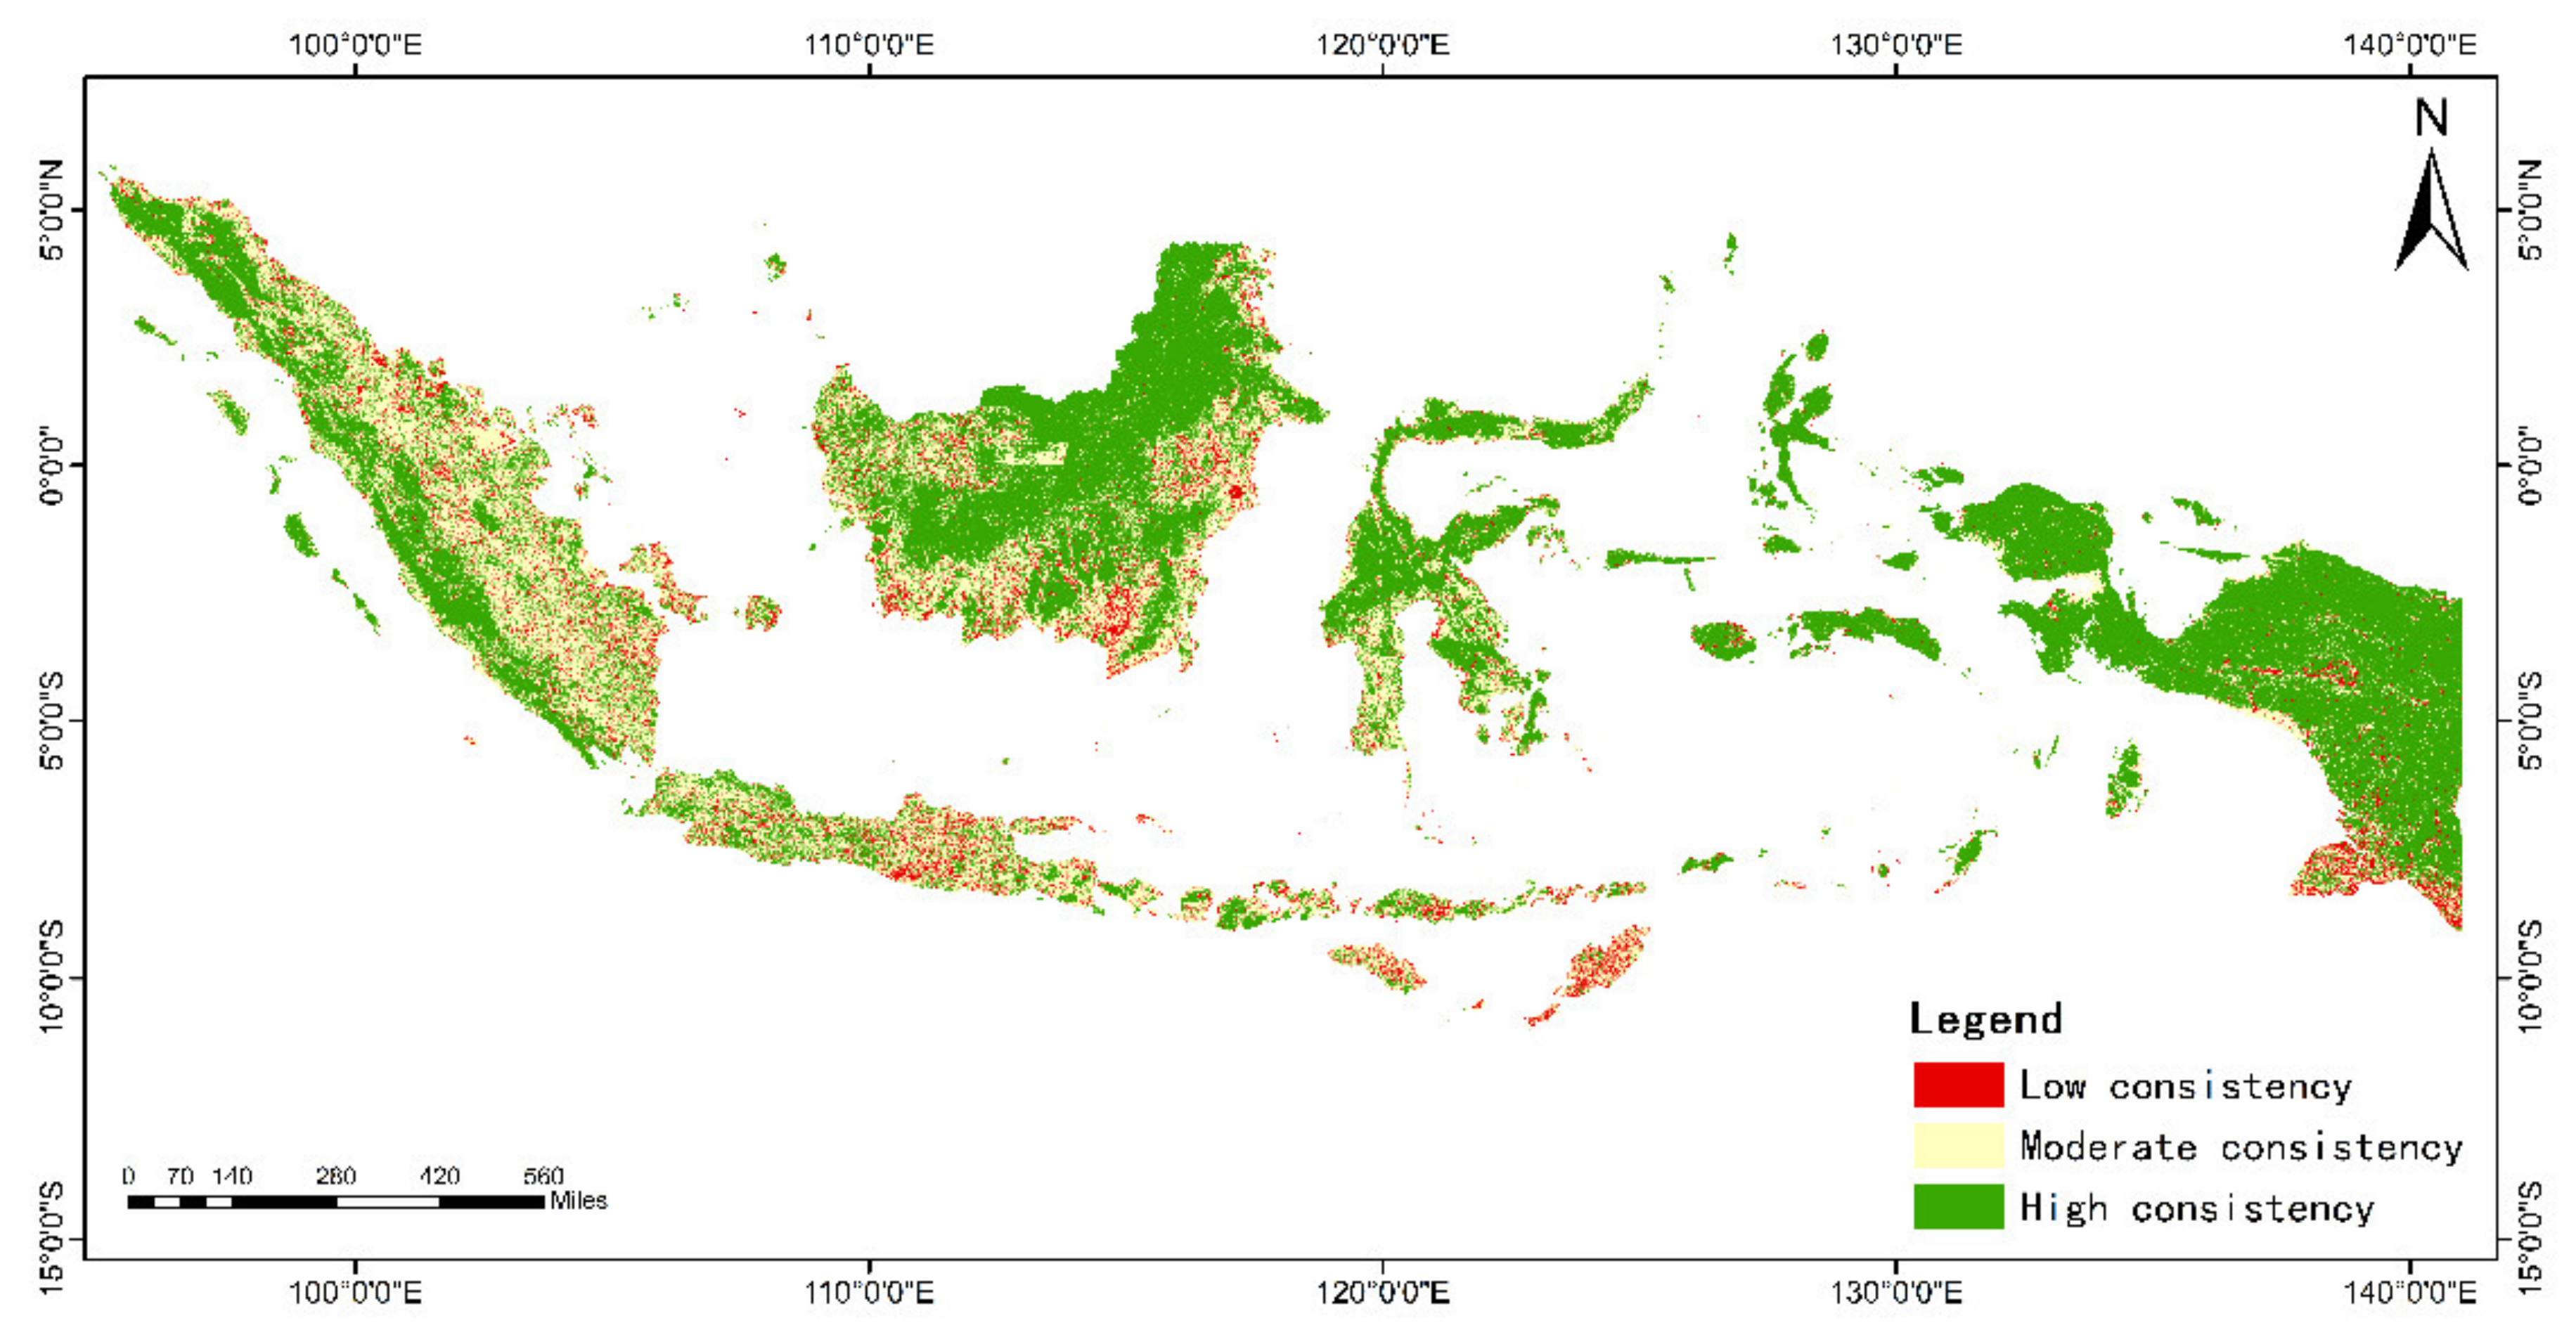
3.2. Spatial Pattern Consistency

In order to intuitively express the spatial pattern consistency of different land cover data, the spatial superposition method was employed to obtain the spatial correspondence of different land cover data pixel-by-pixel. Based on the number of matching coverage types of different land cover data determined pixel-by-pixel, the degree of consistency was classified into three levels, in descending order:
(1)
High consistency: the coverage types of the three land cover products are exactly the same at the same pixel;
(2)
Moderate consistency: any two products have the same coverage type at the same pixel;
(3)
Low consistency: the three land cover products all have different coverage types at the same pixel.

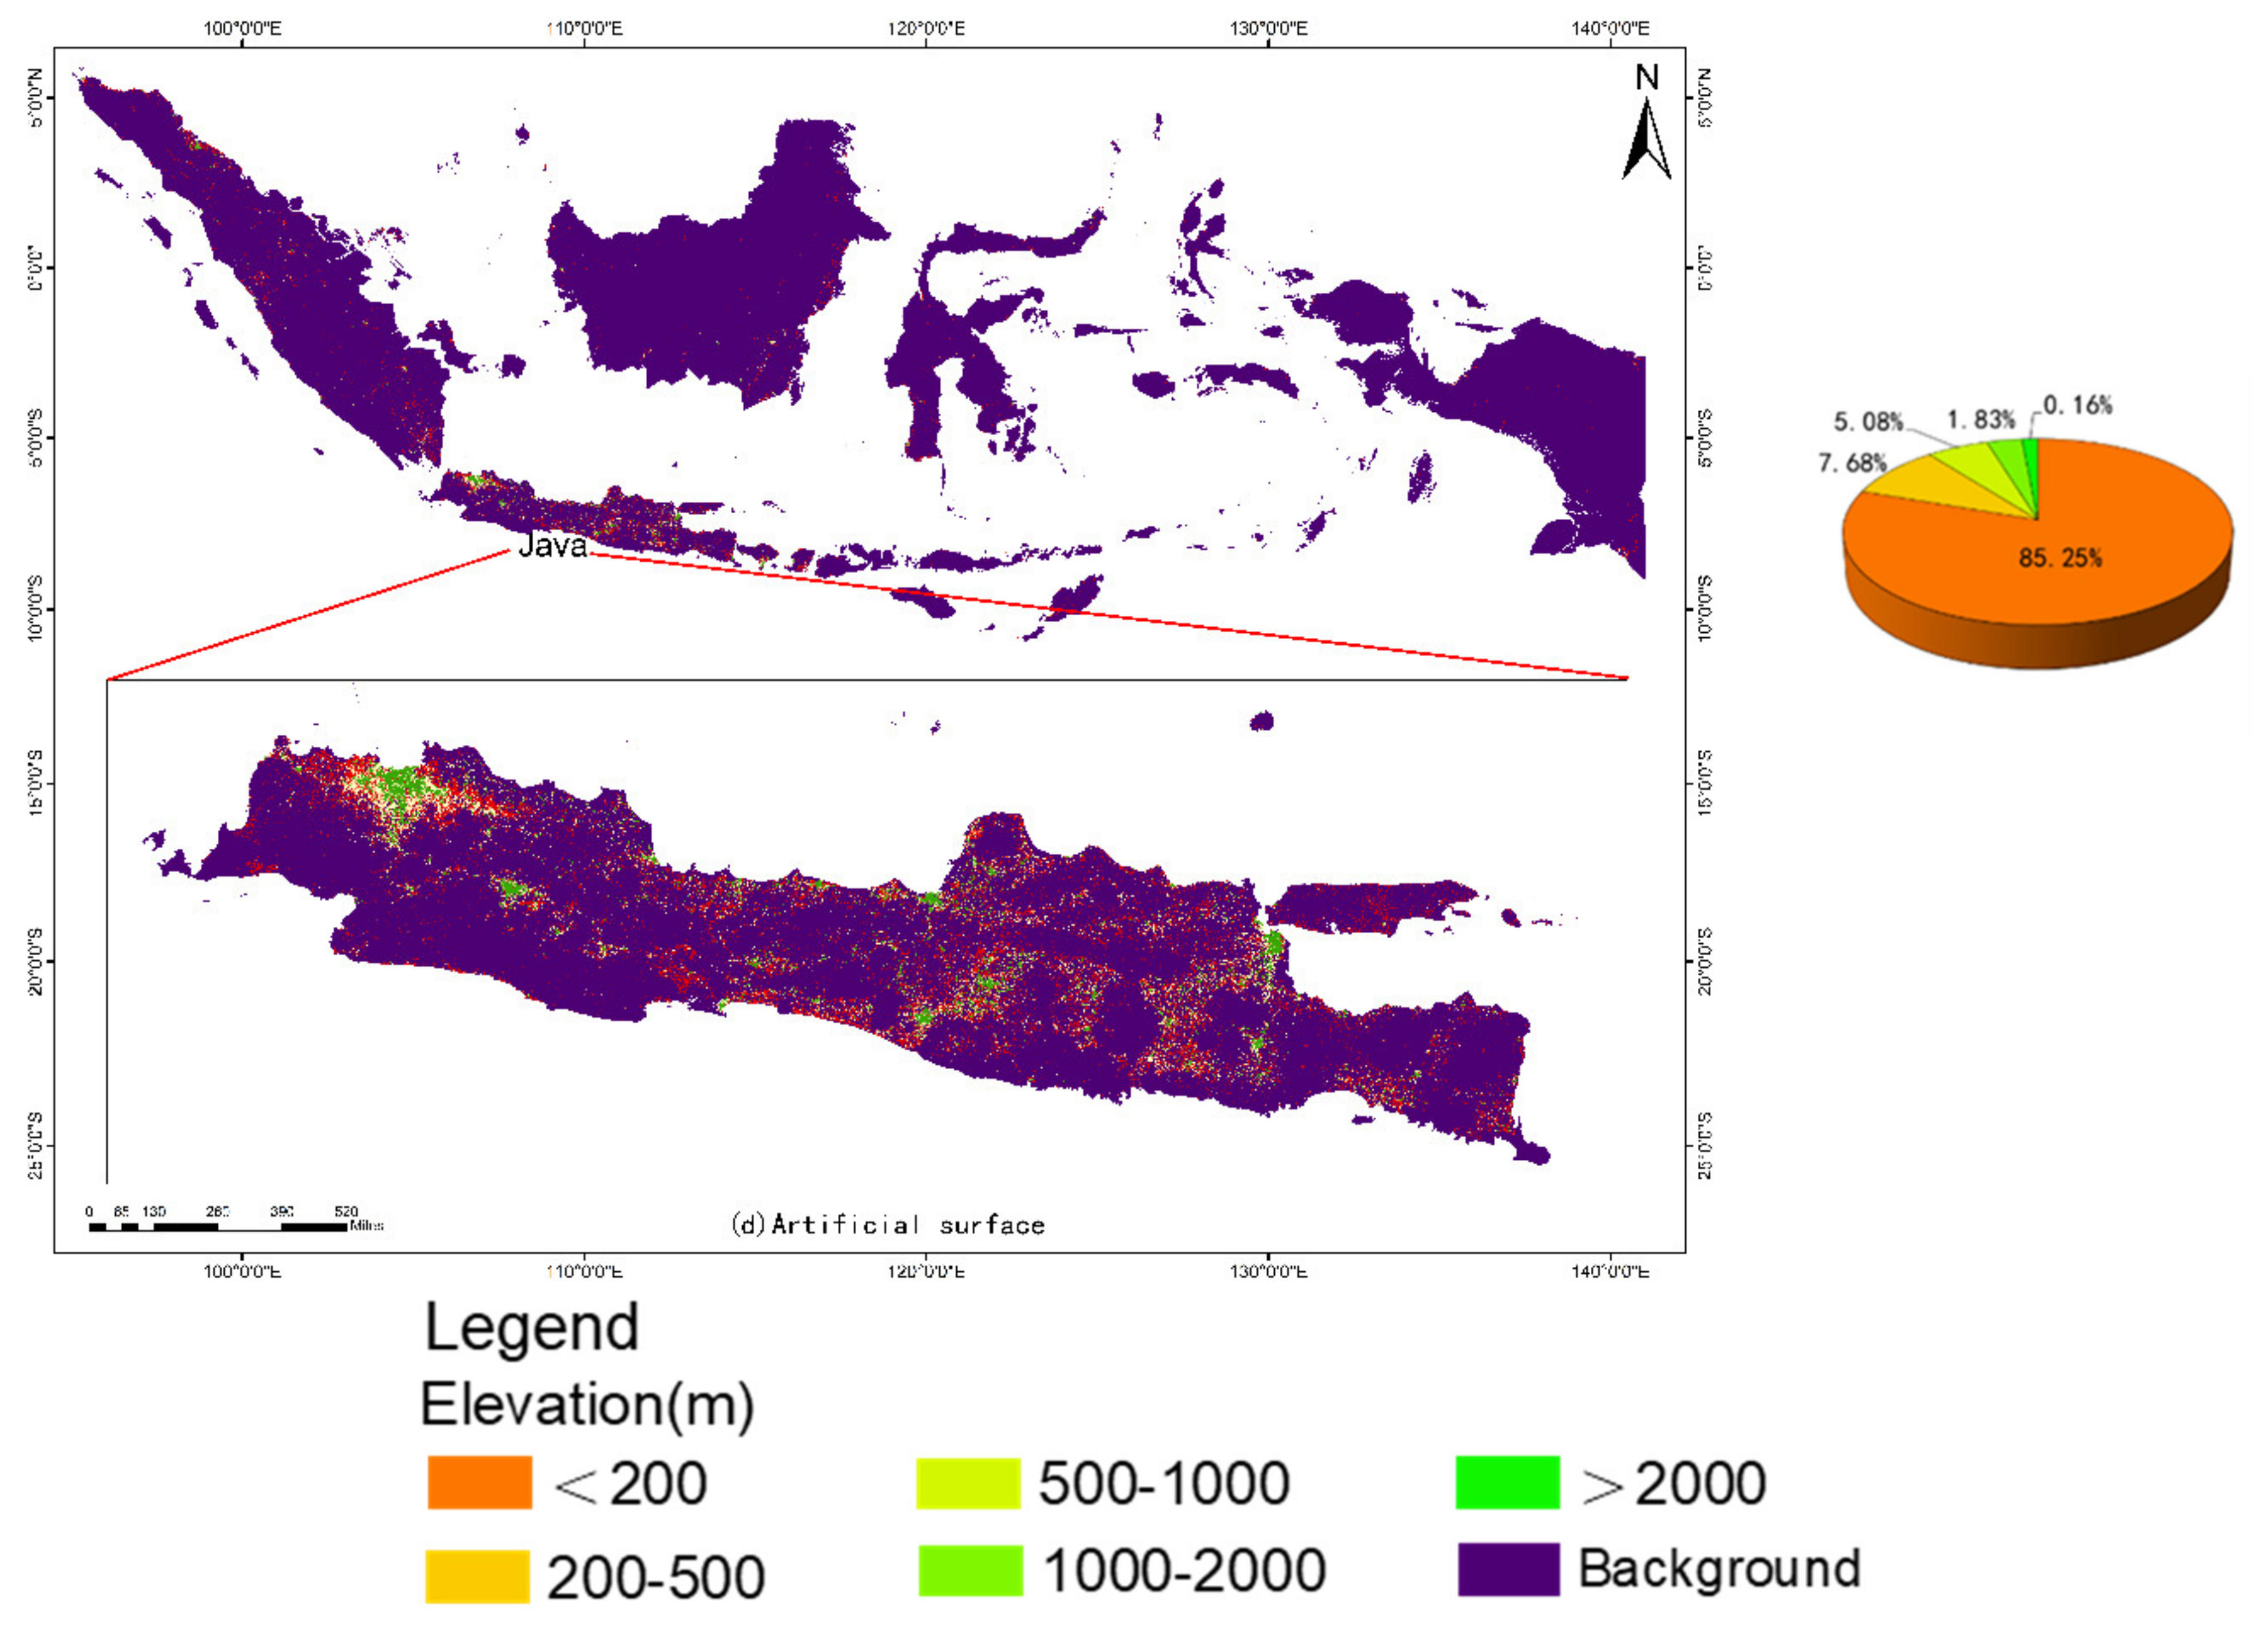
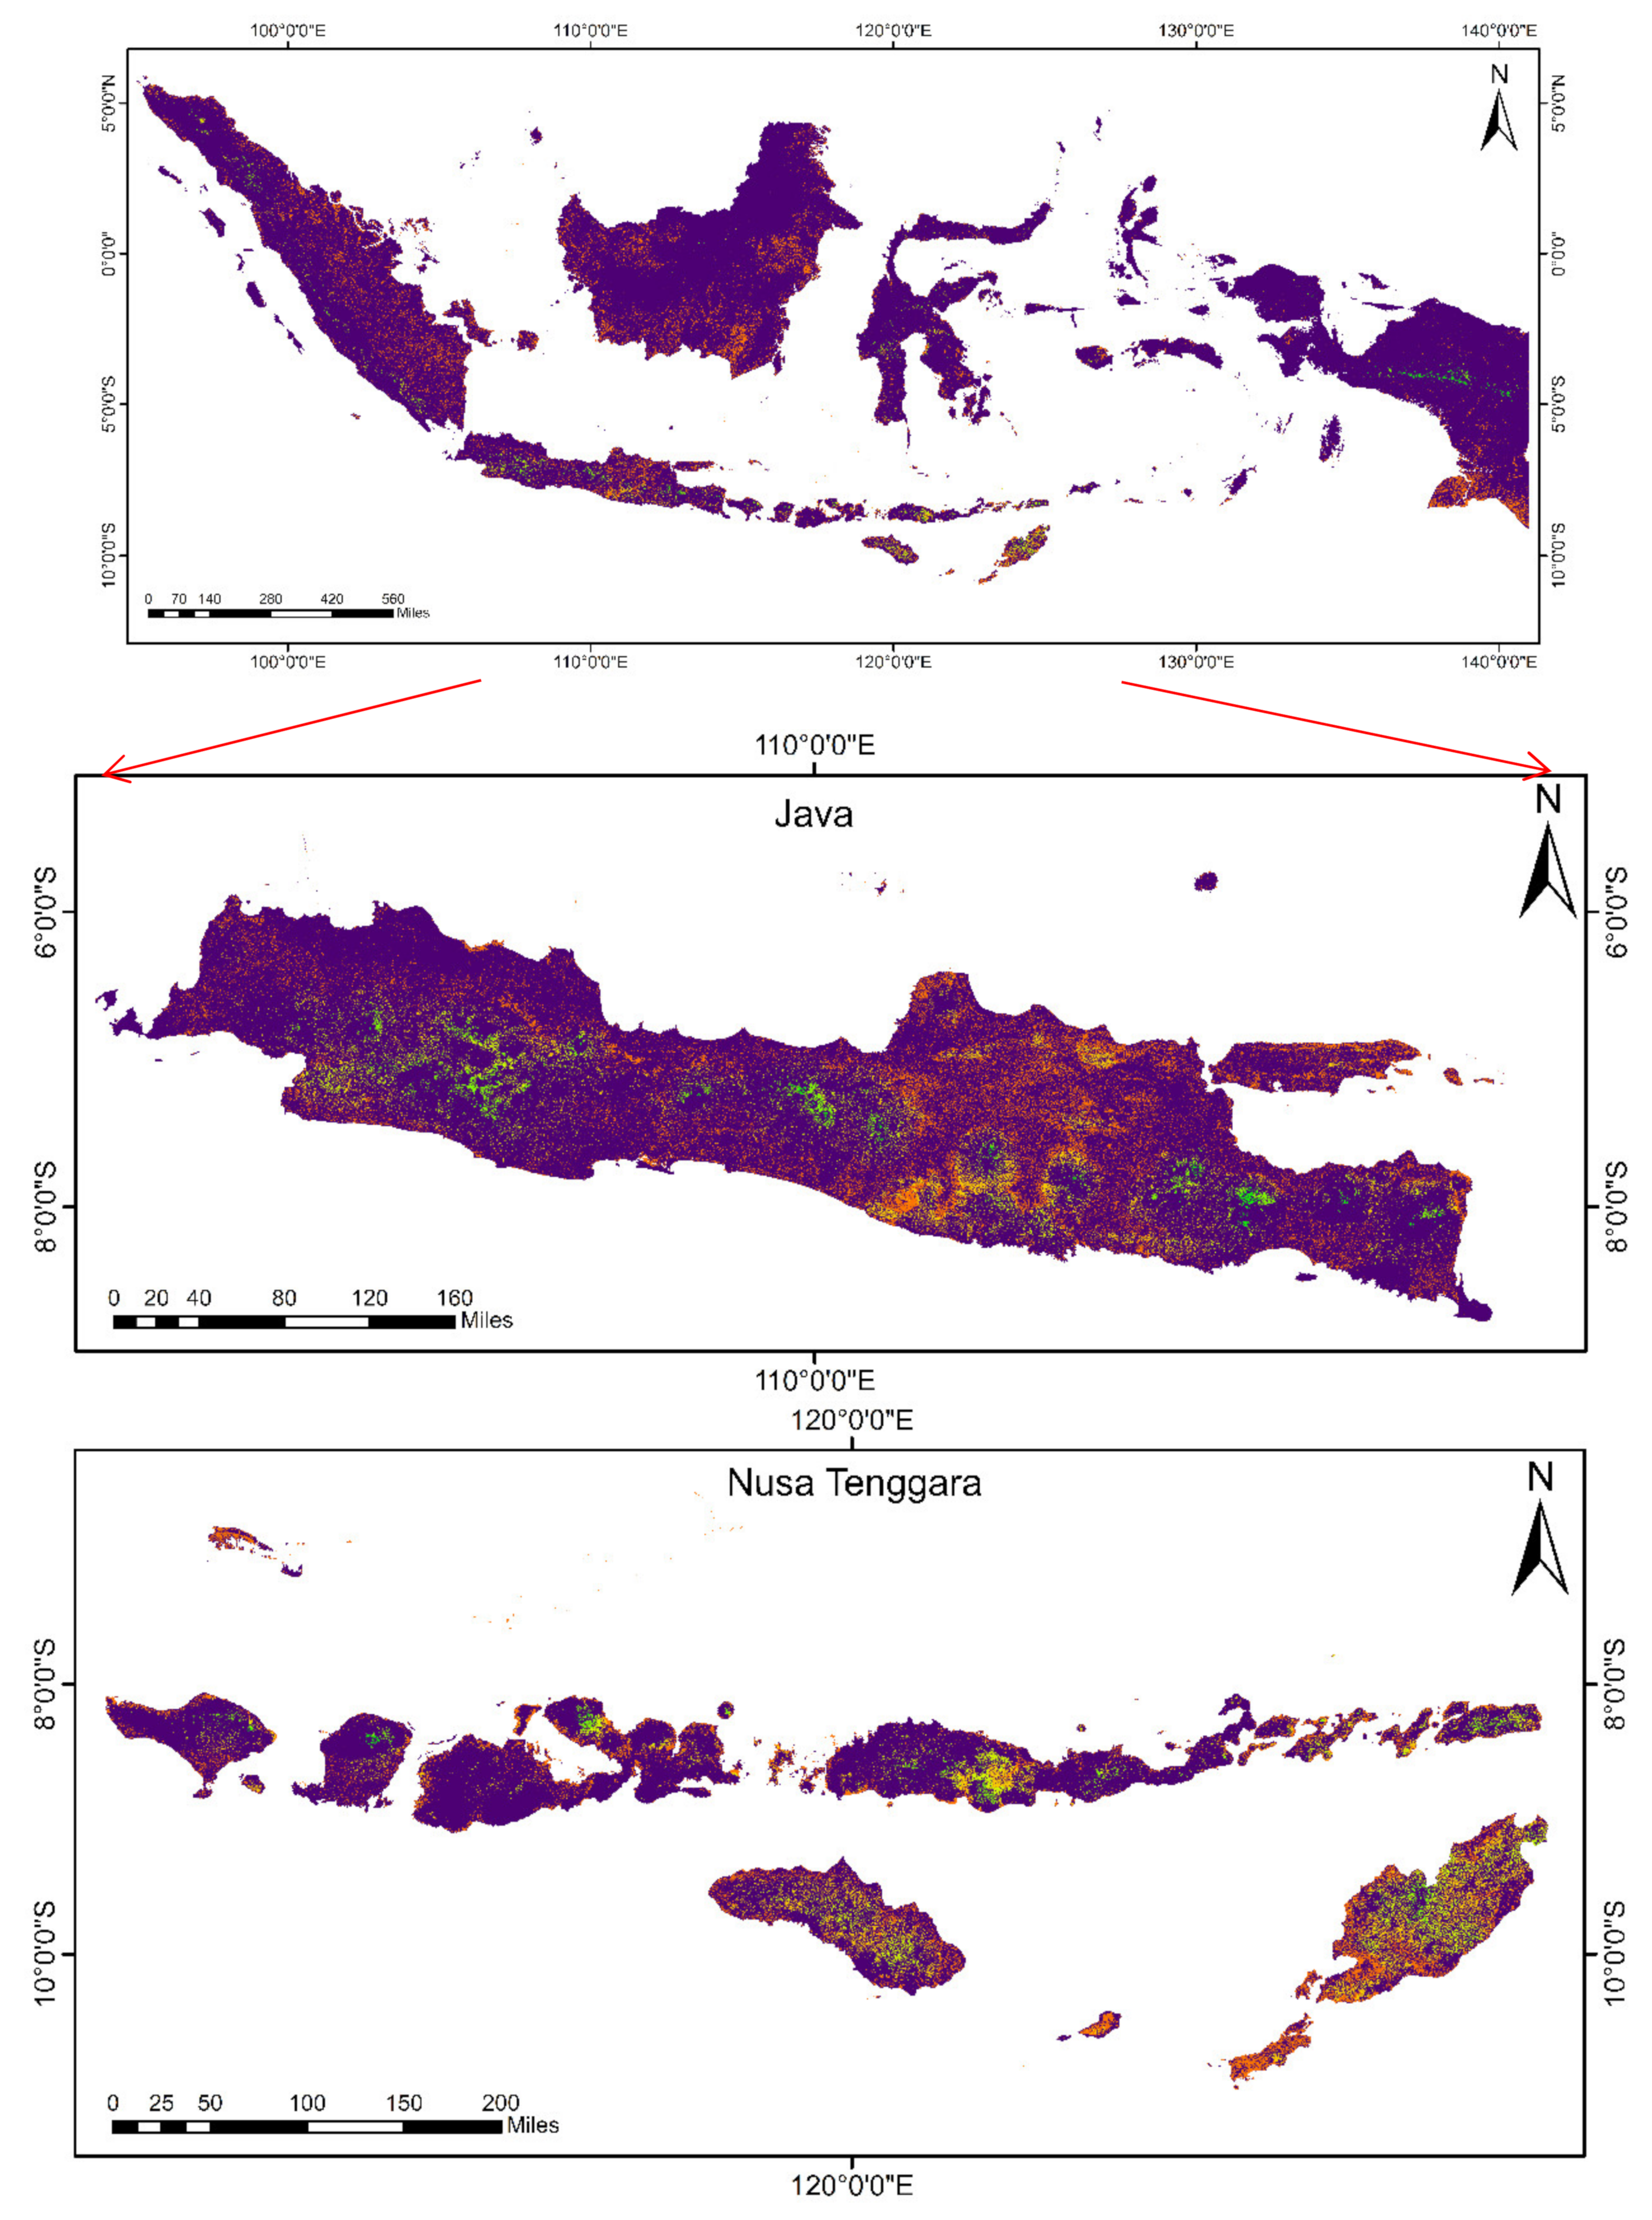
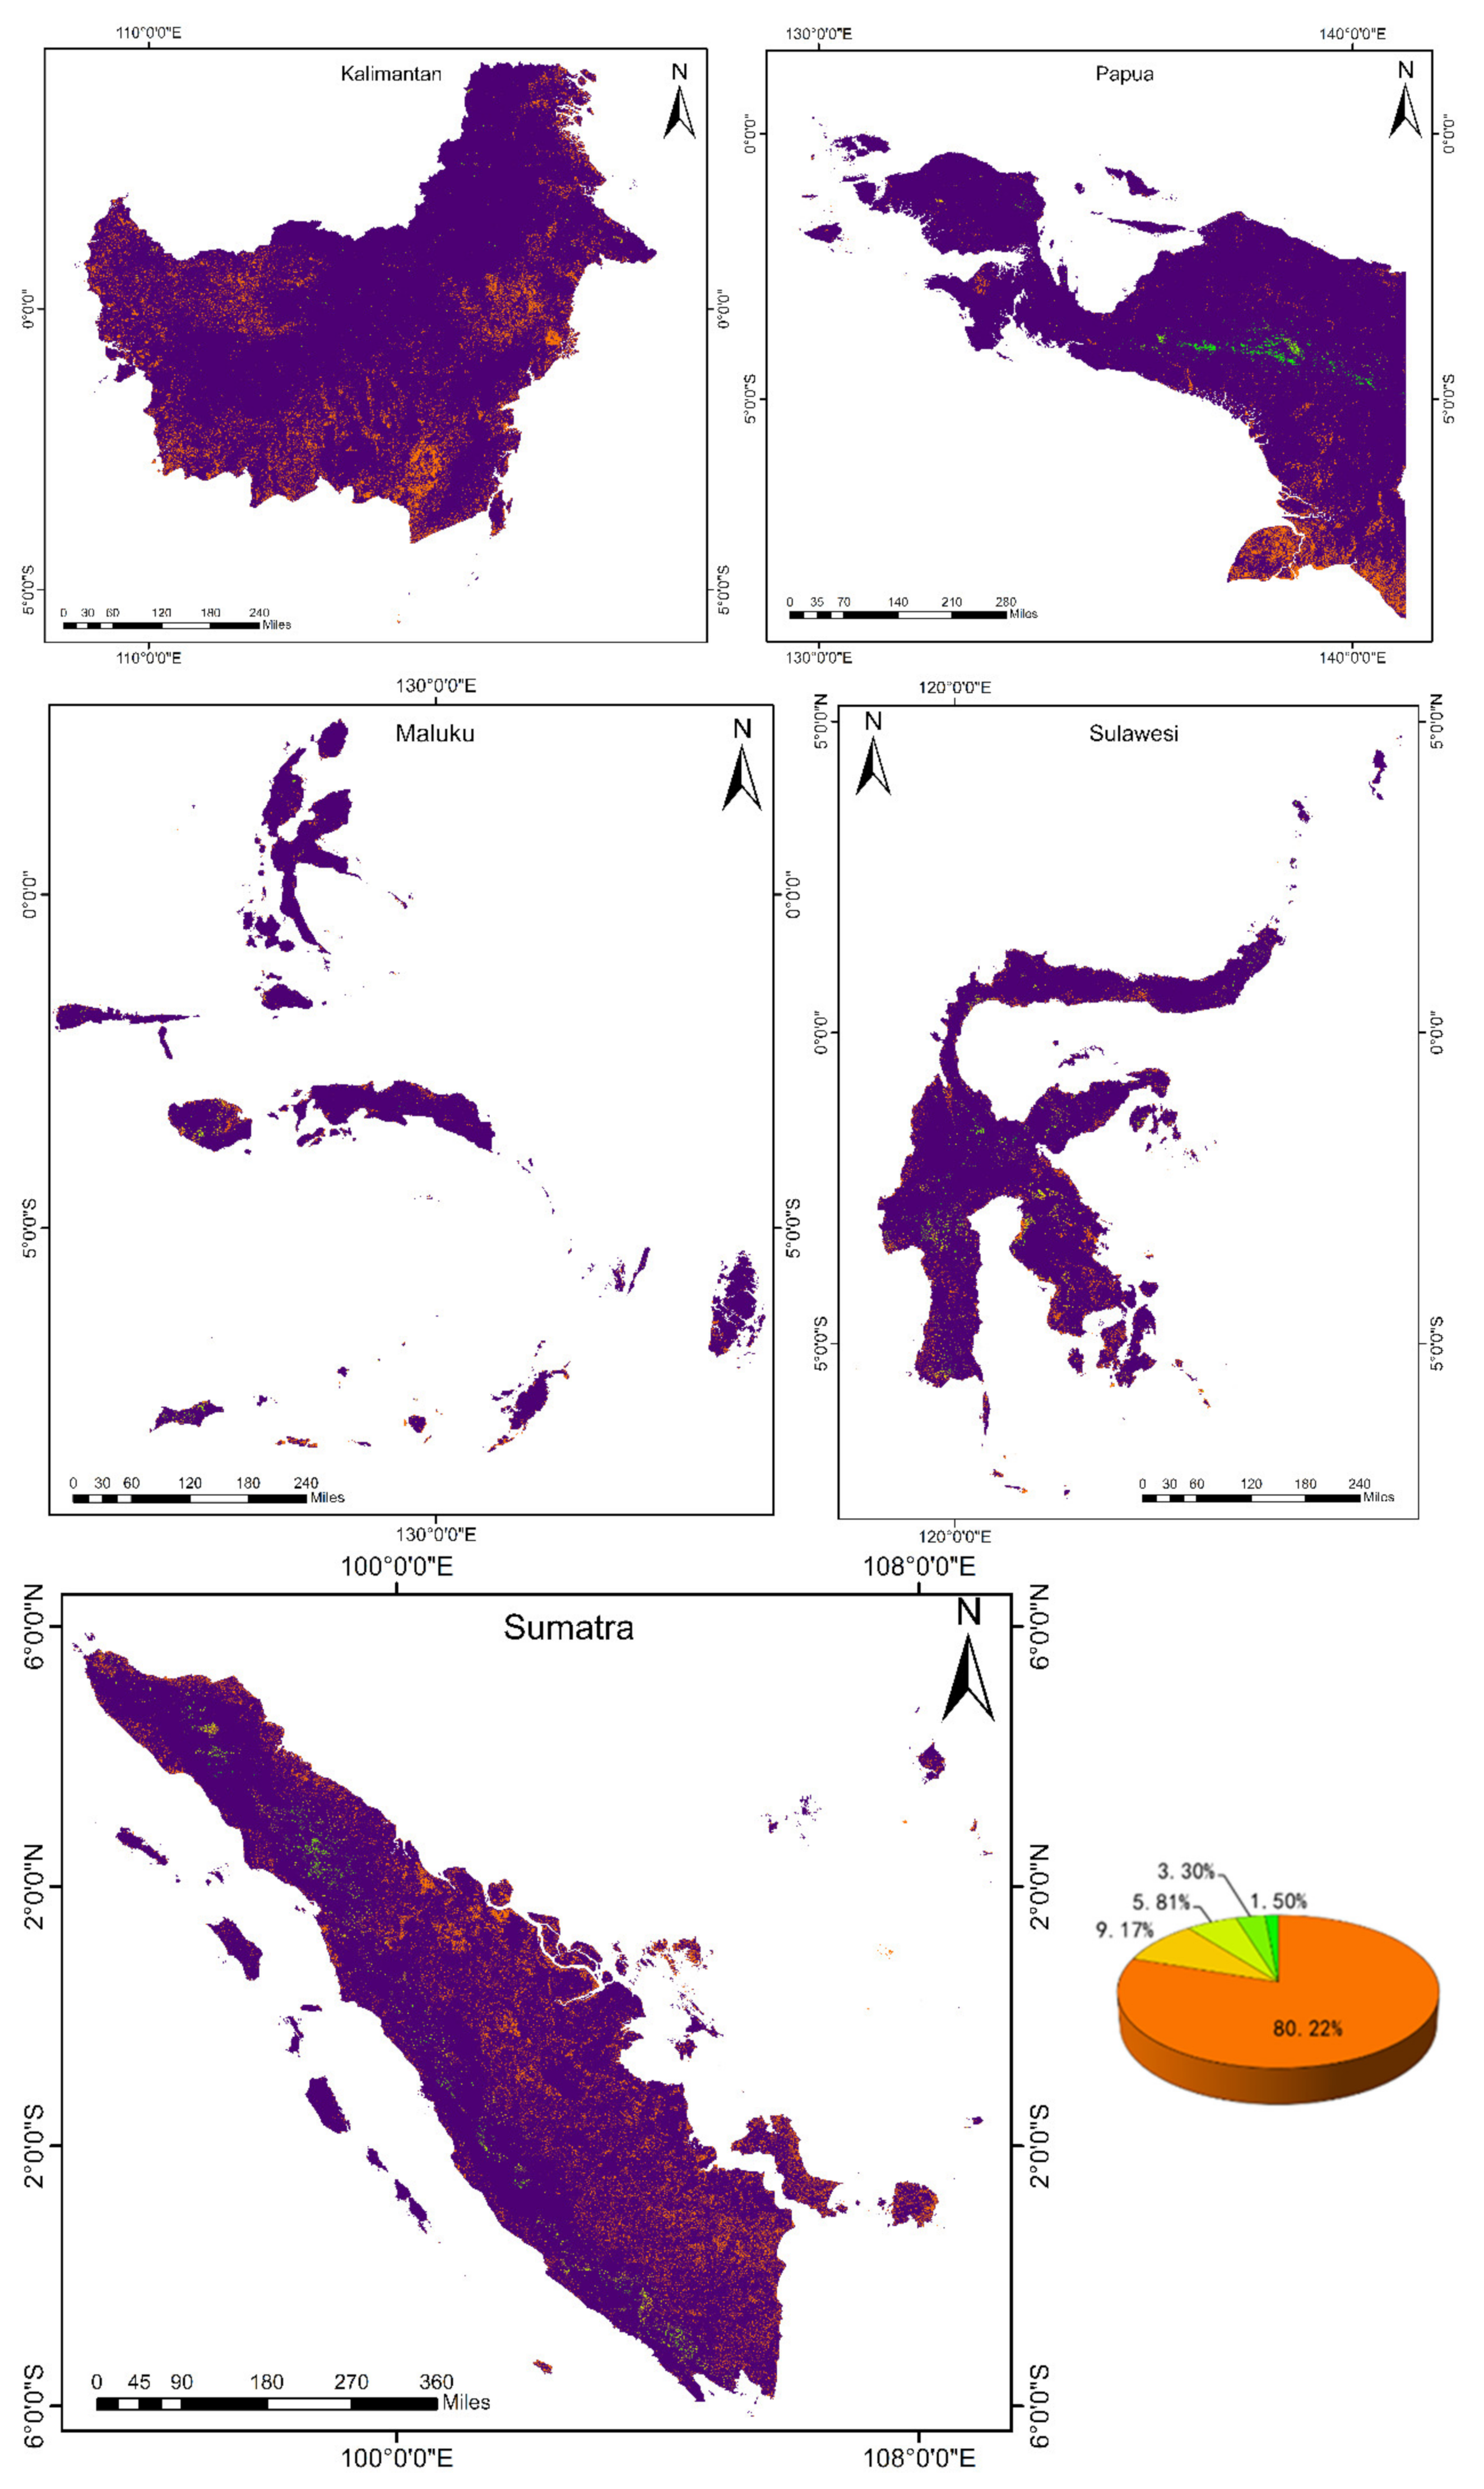
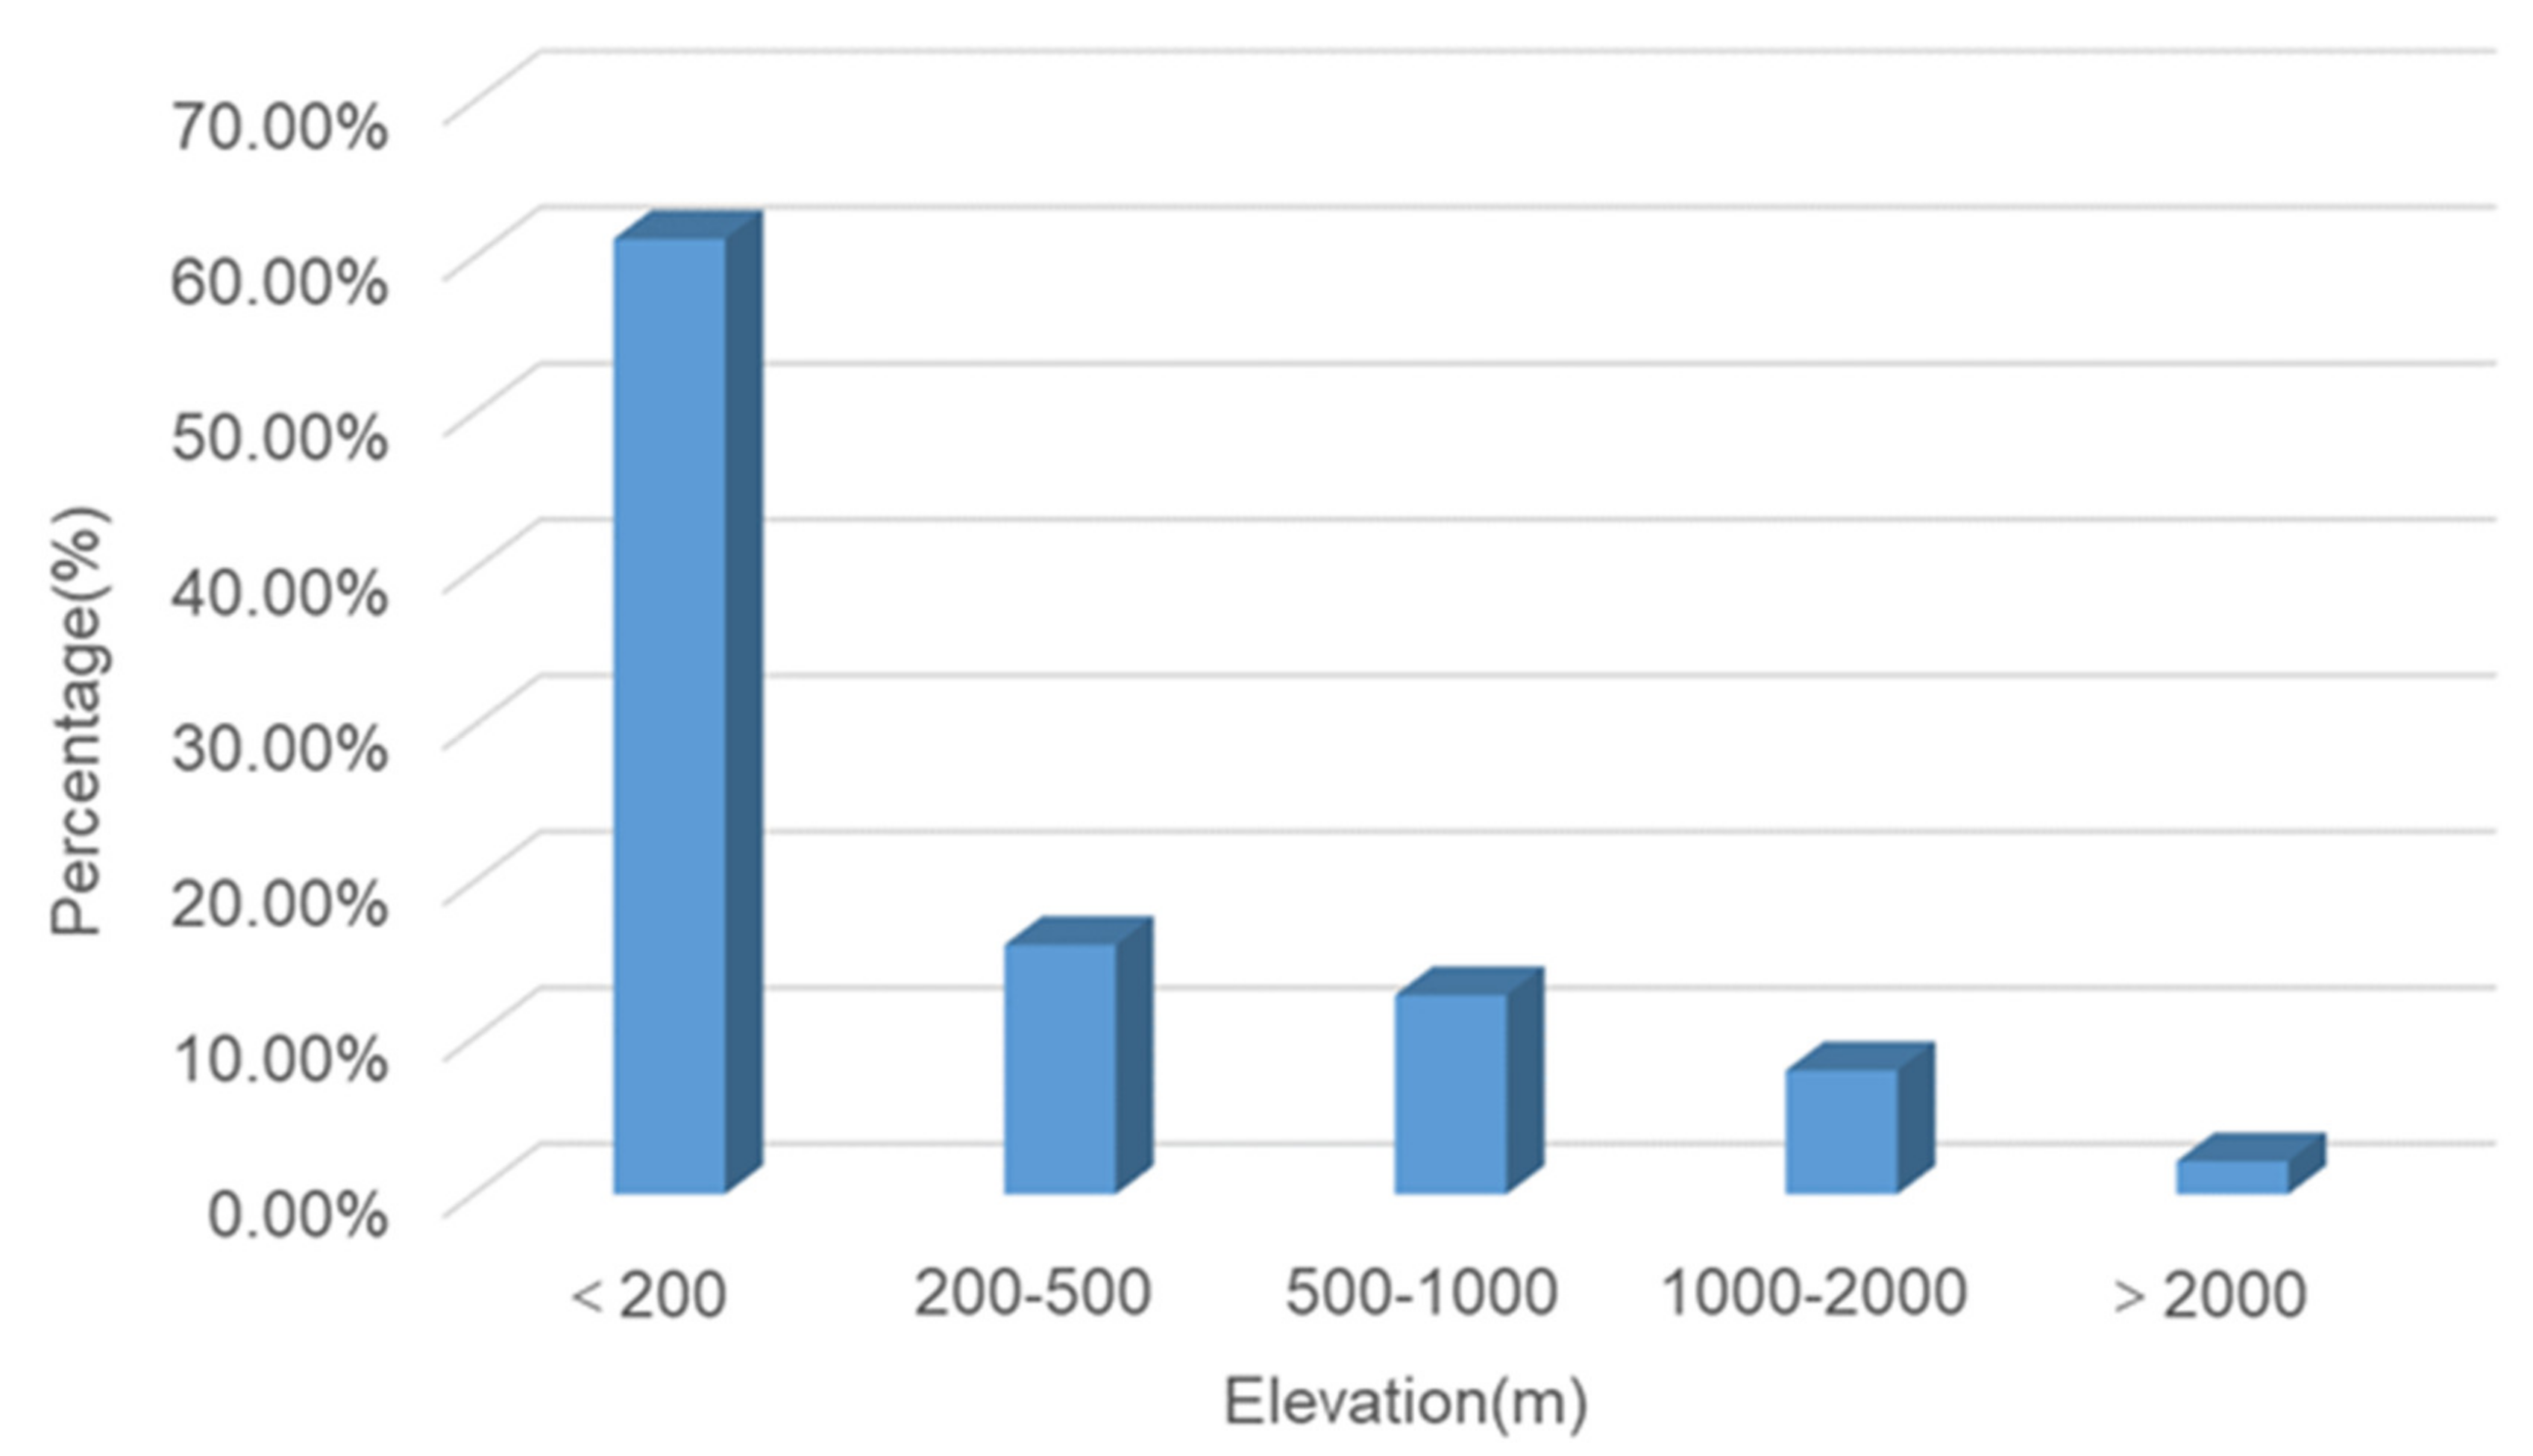
3.3. Consistency Distribution of Topographic Features

Topographic and geomorphic characteristics influence the precision of land cover products [37]. In this study, elevation data were introduced in order to analyze the consistency distribution of multi-source remote sensing land cover products at different elevations. The digital elevation model (DEM) data used in the study are Advanced Spaceborne Thermal Emission and Reflection Radiometer Global Digital Elevation Model Version 2 (ASTER GDEM V2). The product is based on the calculation of ASTER data, and is the only high-resolution elevation image data covering the global land surface. We downloaded the 30 m resolution ASTER GDEM V2 data covering the study area from the Geospatial Data Cloud (http://www.gscloud.cn/). Based on the topographic and geomorphic characteristics of the study area, in order to provide the land cover types with obvious gradient characteristics in the elevation distribution, we divided the elevation into five grades (Table 4).

3.4. Precision Evaluation Based on the Confusion Matrix

3.4.1. Relative Precision Evaluation

The precision evaluation of land cover data based on the confusion matrix is the most common and important method used [38,39,40,41]. The precision evaluation indices obtained by the confusion matrix are producer accuracy (PA), user accuracy (UA), overall accuracy (OA), and kappa coefficient. The calculation formulas of each index are as follows [42]:
PA = x i i x + i × 100 %
UA = x i i x i + × 100 %
OA = i = 1 r x i i n × 100 %
Kappa = n · i = 1 r x i i i = 1 r x i + · x + i n 2 i = 1 r x i + · x + i
where n is the total number of pixels, r is the number of types, x i i is the number of pixels correctly classified, x + i is the number of pixels of a particular type in the reference data, and x i + is the number of pixels of a particular type in the data to be evaluated. We arbitrarily selected two of the three land cover products to calculate their confusion matrix and determine the relative accuracy evaluation results of the different products.

3.4.2. Absolute Precision Evaluation

In order to evaluate the absolute accuracy of the three land cover products, this study took the field survey samples from Indonesia in 2018 (Figure 3) as the reference data, and combined them using manual encryption in order to obtain the final accuracy evaluation verification samples. The field survey samples referenced are collected by GPS. The main steps include five parts: sample point selection, coordinate positioning, taking photos, information recording, and sample point correction. Sample point selection: the basic principles to be followed are that the collected sample points are typical and representative; the collected sample points should choose the larger type patches as far as possible; and the collected sample points try not to be close to the distribution boundary of the type to avoid the influence of the mixed type. Coordinate positioning: use GPS to locate geographical coordinates at selected points. Taking photos: take actual photos at each selected point and save these photos as original materials. Information recording: record the coordinates (latitude and longitude), type, and other related information of each sample point. Sample point correction: refer to high-resolution images (such as Google Earth) and other information to correct the coordinates of the sample points indoors. When obtaining verification samples, there is a certain time interval between the base year of the land cover products to be evaluated and the investigation time. In addition, the Google Earth high-resolution image repository was one of the main data sources for accuracy evaluation given its advantages of accurate positioning, abundant time phase, and wide coverage [43]. Therefore, we transform sample points into the Keyhole Markup Language format (KML) and imported into Google Earth, and then the sample points are interpreted online with Google Earth high-resolution images in 2010 and 2015. If there is no Google Earth historical image at a sample point during interpretation, the sample is discarded. In order to reduce the negative impact of positioning error and interpretation error on sample quality, the following principles were followed during sample selection and interpretation: (1) Since the positioning error of the high-resolution image samples of Google Earth is approximately 15 m, while the spatial resolution of the land cover products to be evaluated is 30 m, the center point of a 210 × 210 m homogenized area was selected as the sample in order to reduce the impact of positioning error [44]; (2) for samples that were difficult to interpret, reference was made to other auxiliary information, such as Geo-Wiki [45]; (3) the interpretation adopted the multi-person independent interpretation method, and samples were abandoned when the interpretation results could not be unified after negotiation. Based on the above principles, 2189 verification samples in 2010 (Figure 4a) and 2232 verification samples in 2015 (Figure 4b) were obtained.

4. Results and Analysis

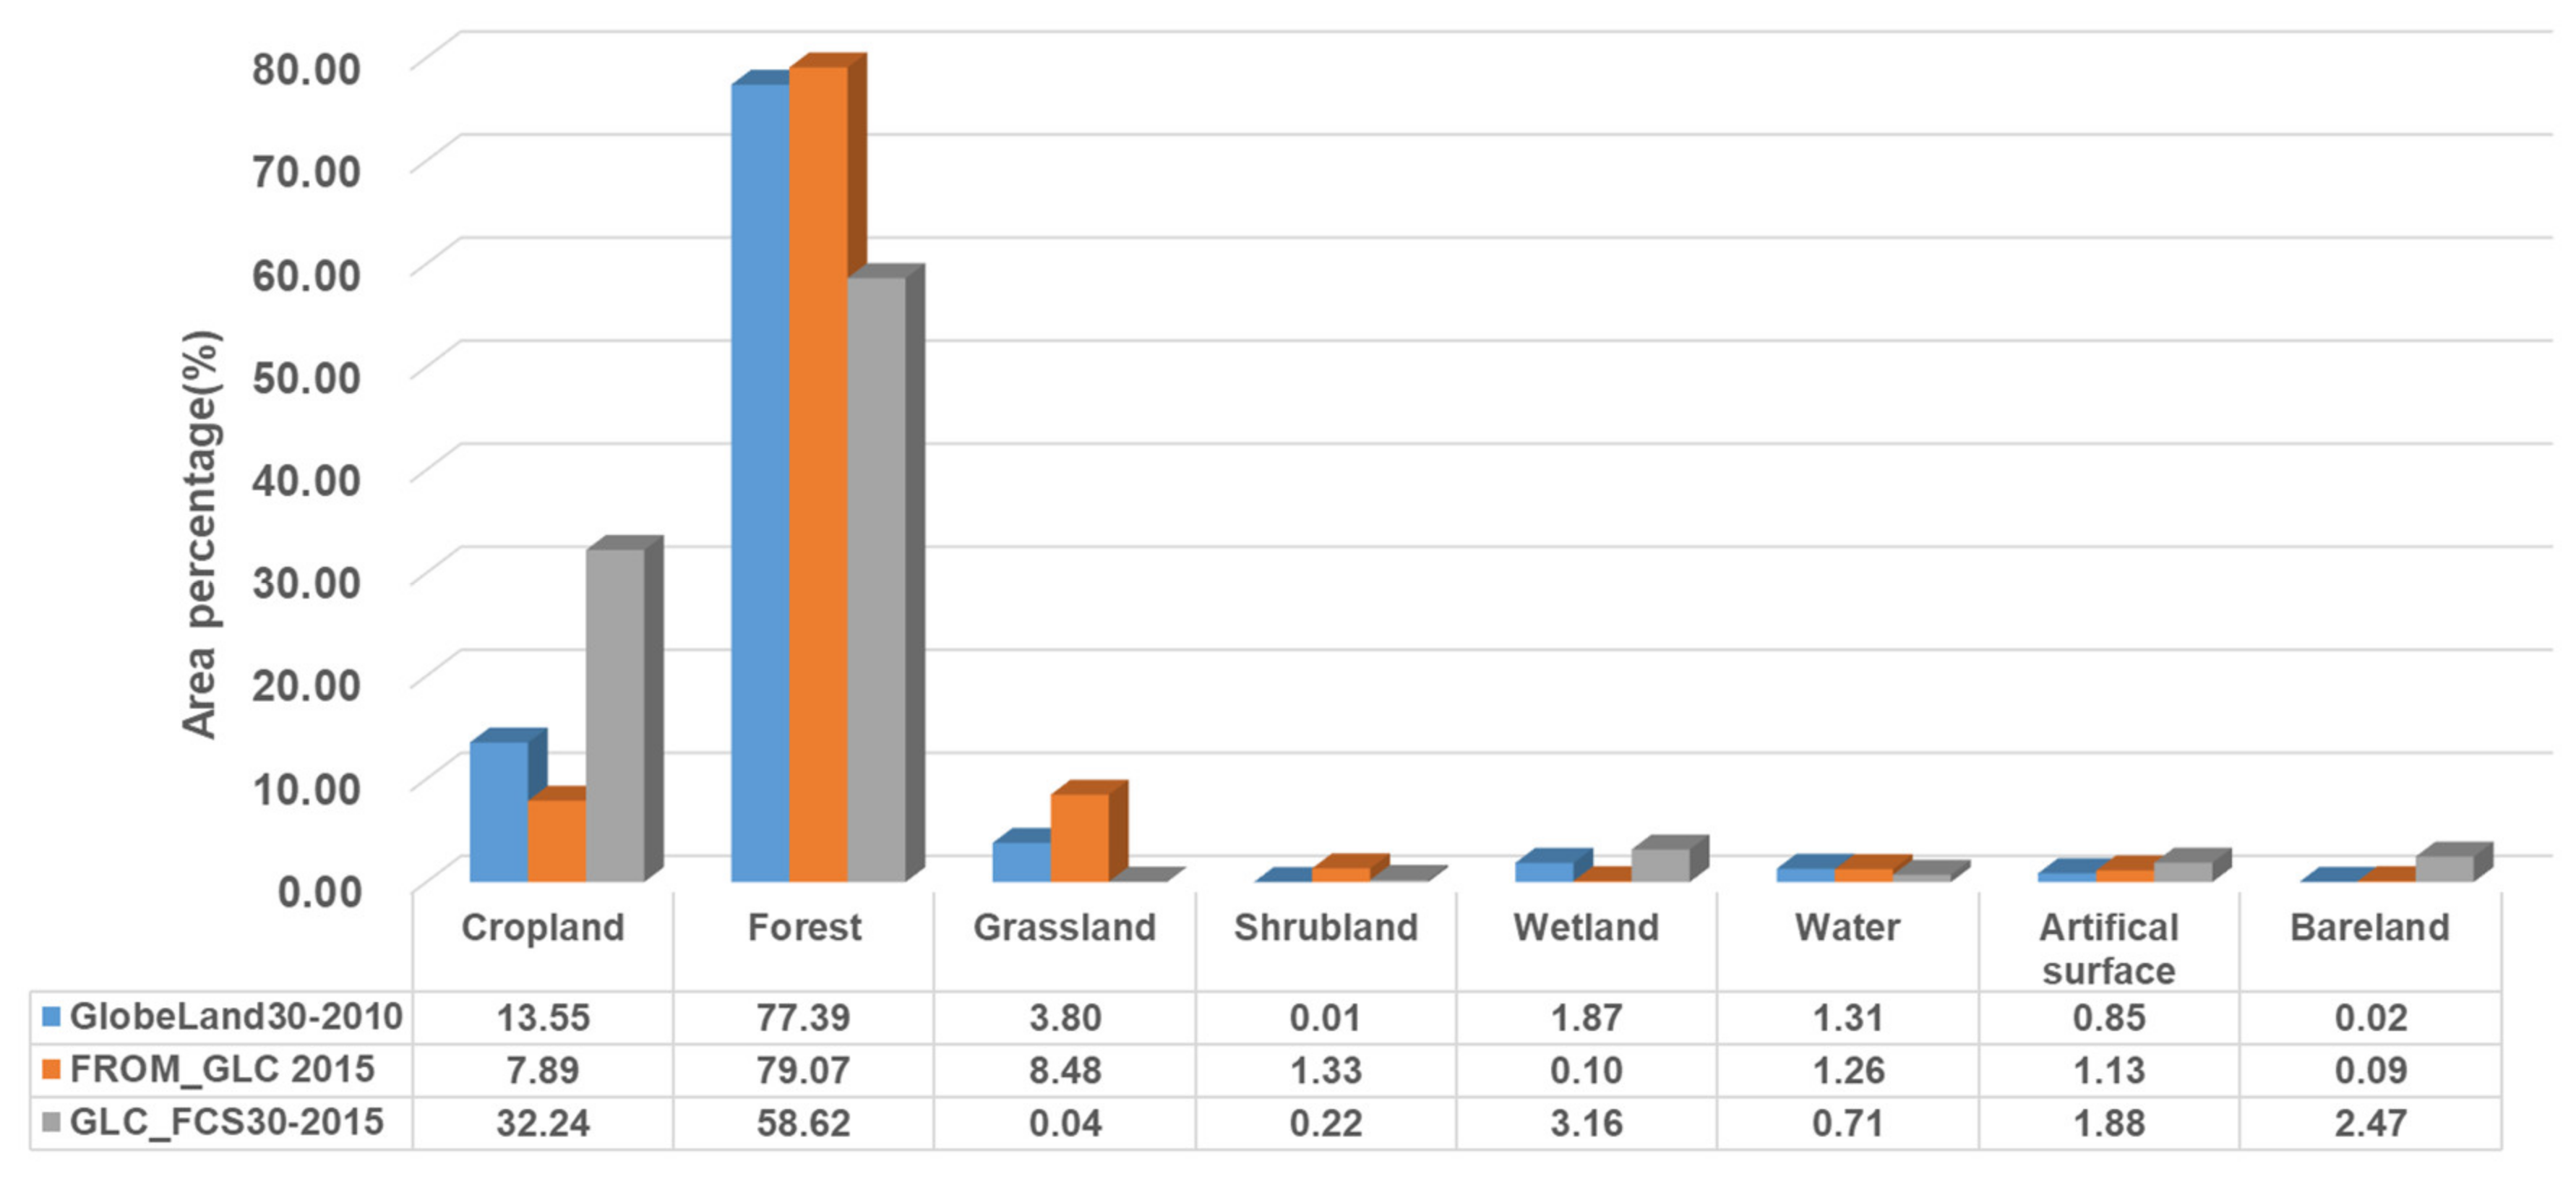
4.1. Area Consistency Analysis

Figure 5 presents the area statistics of the three land cover products in Indonesia. This figure reveals that all of these products generated basically the same type of Indonesia land cover pattern, i.e., the distribution of forest land cover types in the study area predominates, while the cropland, grassland, shrubland, and other types have smaller distributions. The GlobeLand30-2010 and FROM_GLC2015 products produced highly consistent forest area coverage, with area proportions of 77.39% and 79.07%, respectively. The water and artificial surface types of the three products were highly consistent, with water area proportions of 1.31% (GlobeLand30-2010), 1.26% (FROM_GLC2015), and 0.71% (GLC_FCS30-2015), and the proportions of artificial surface area were 0.85% (GlobeLand30-2010), 1.13% (FROM_GLC2015), and 1.88% (GLC_FCS30-2015). The consistencies of cropland, grassland, shrubland, and other land cover types among the three products were relatively low. By calculating the correlation coefficient of area composition for any two of the three land cover products (Table 5), the area composition correlation coefficient of the GlobeLand30-2010 and FROM_GLC2015 products was determined to be the highest, 0.99, while that of the GLC_FCS30-2015 and FROM_GLC2015 products was found to be the lowest, 0.89.

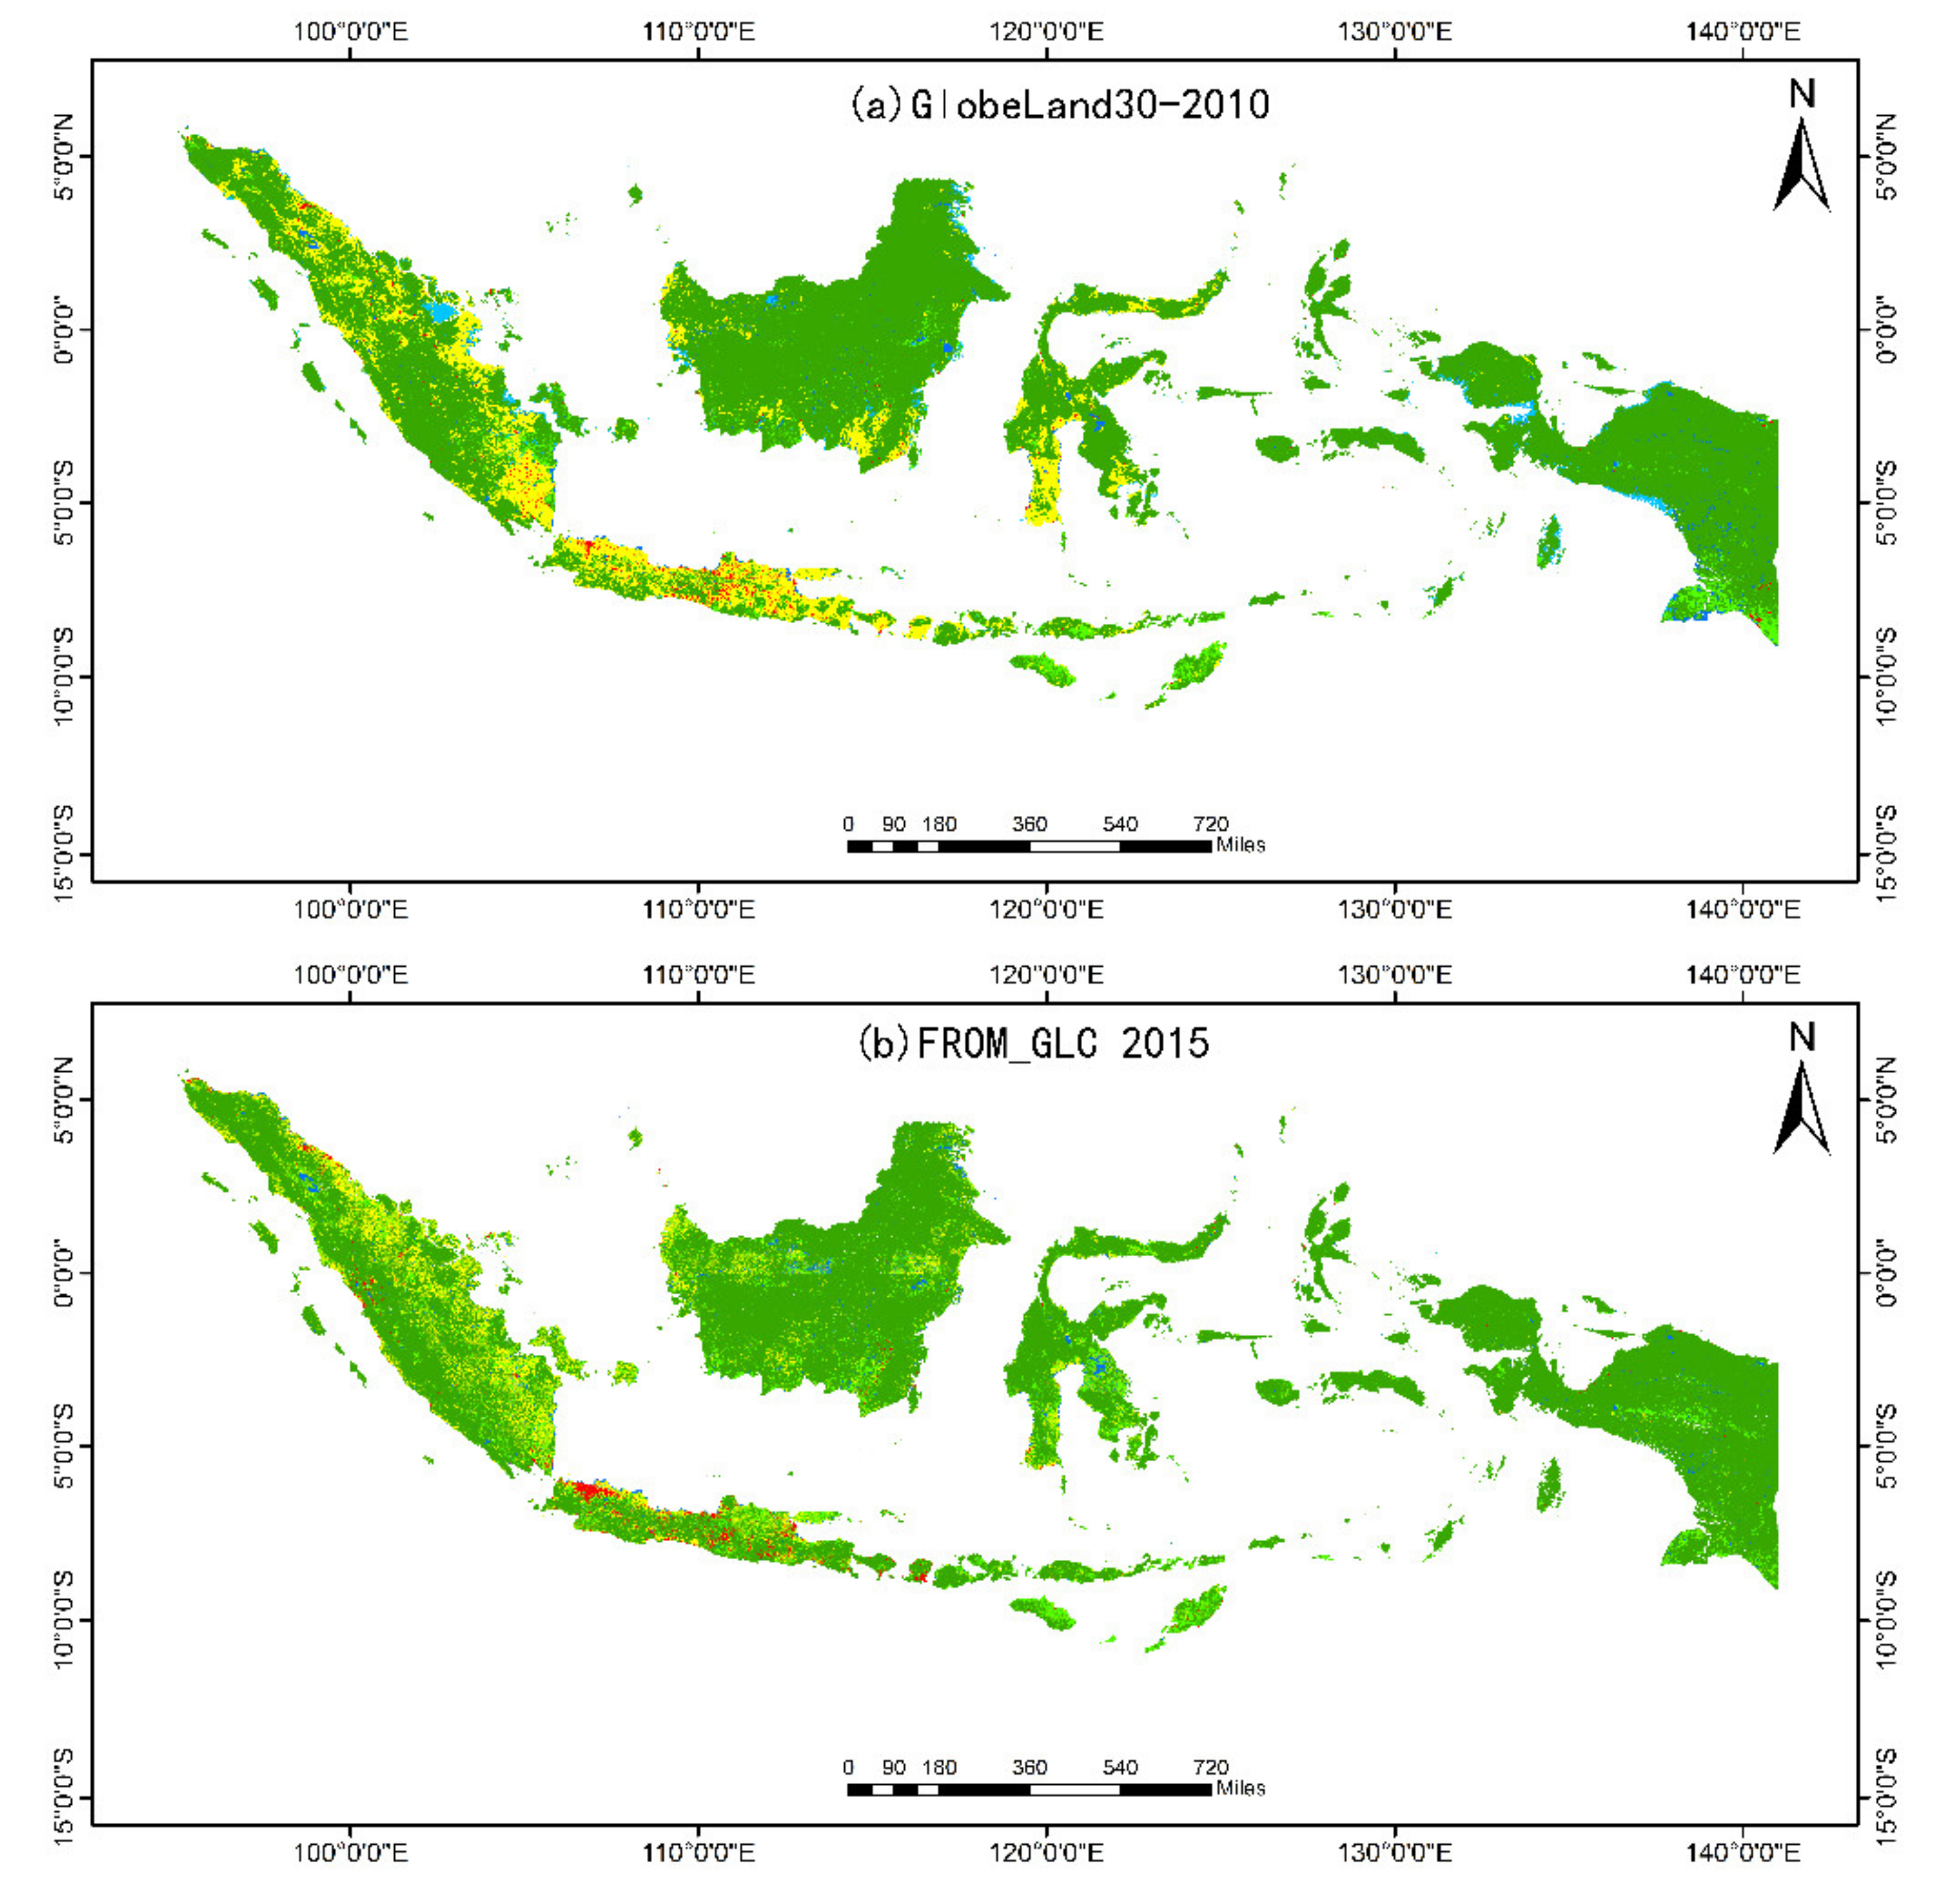
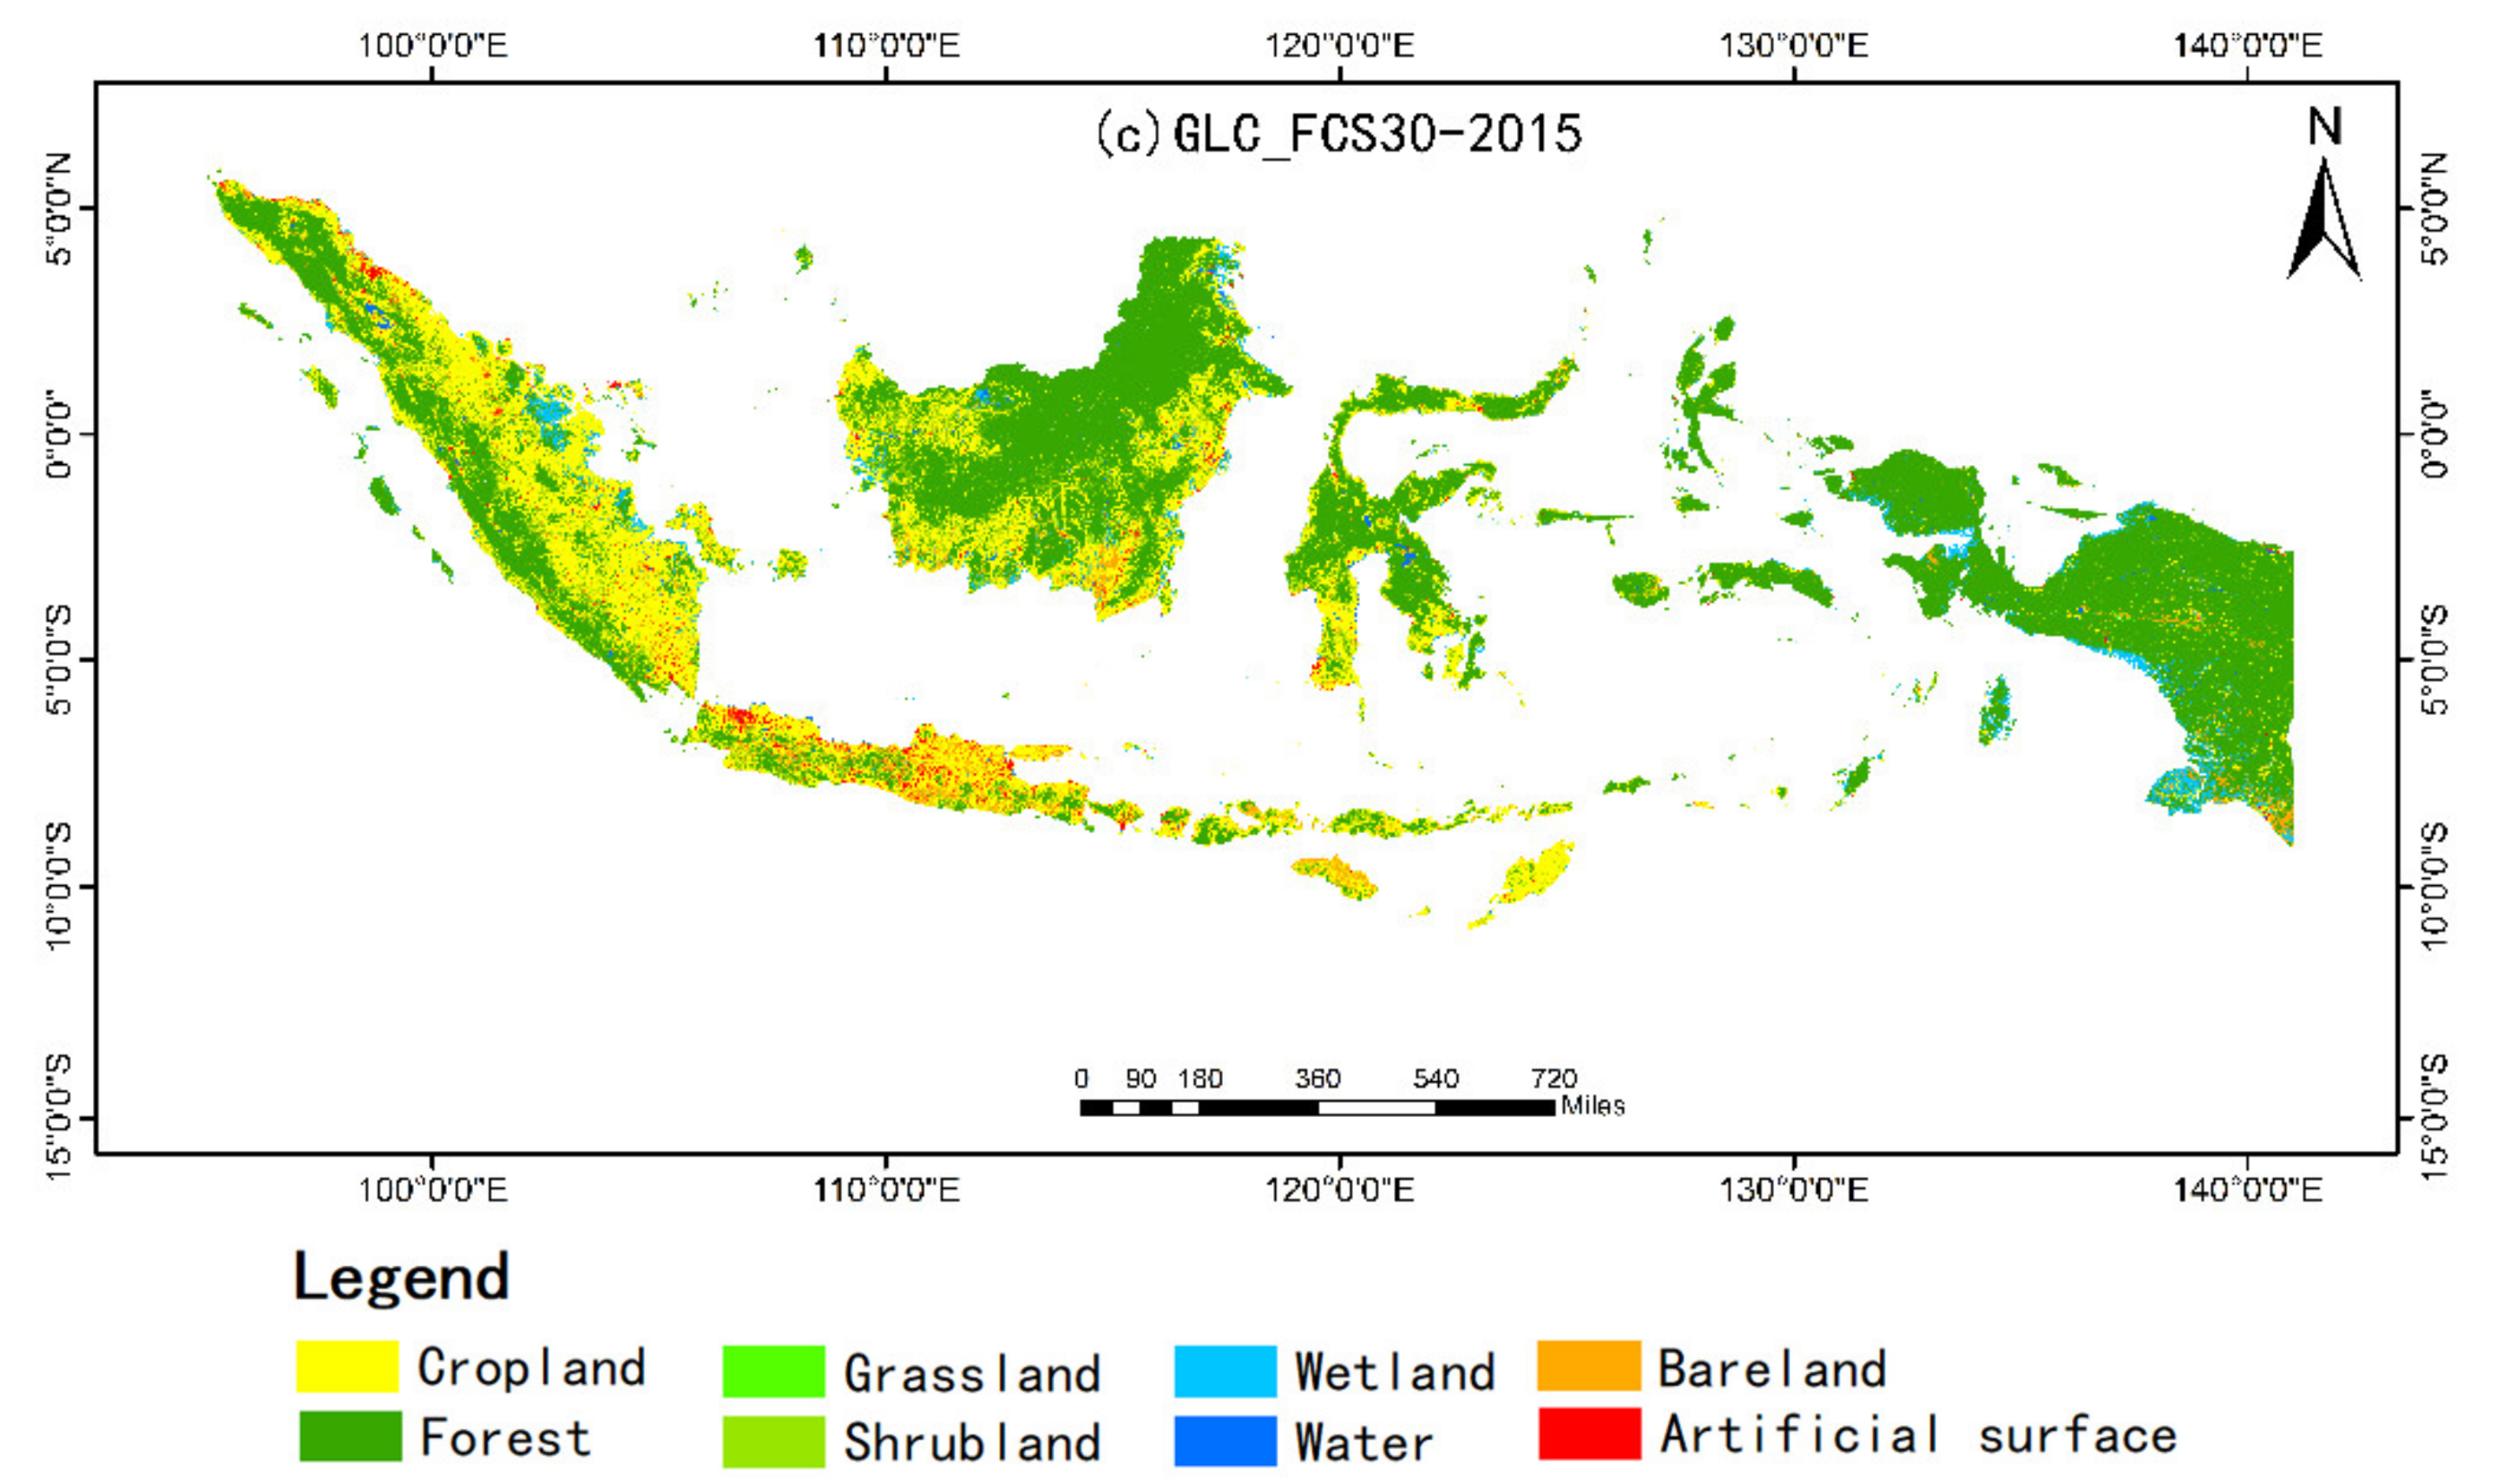
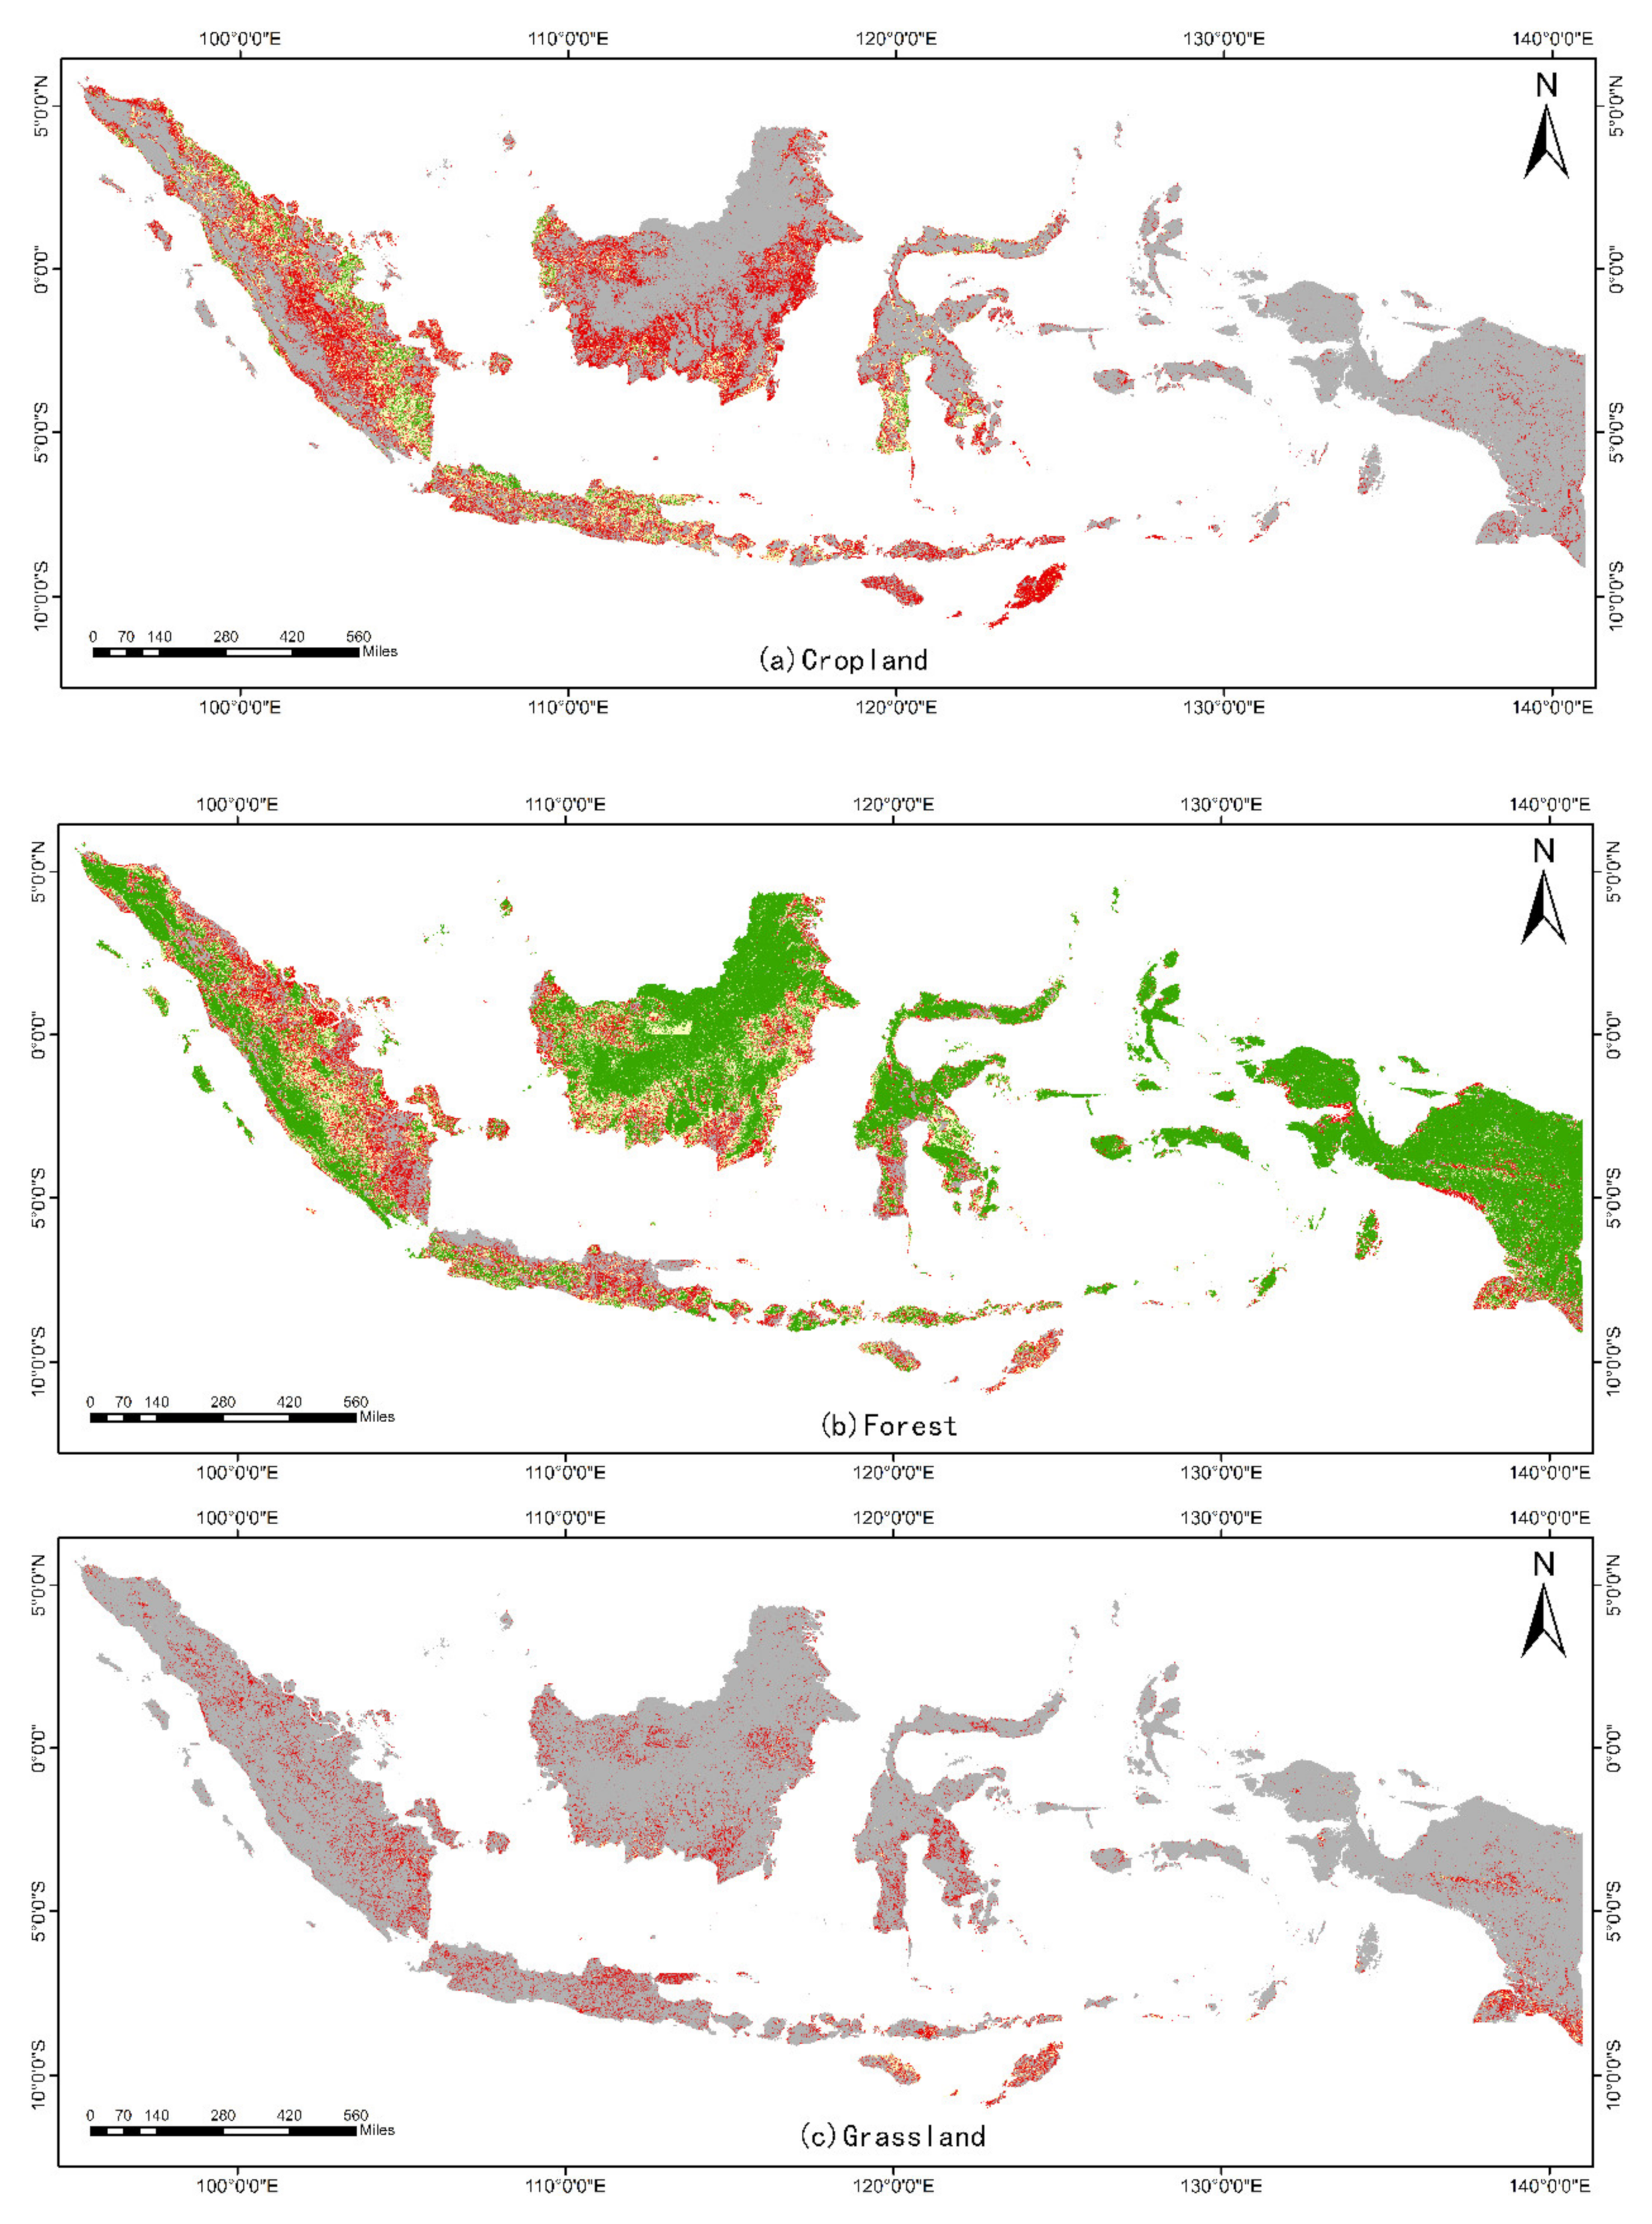
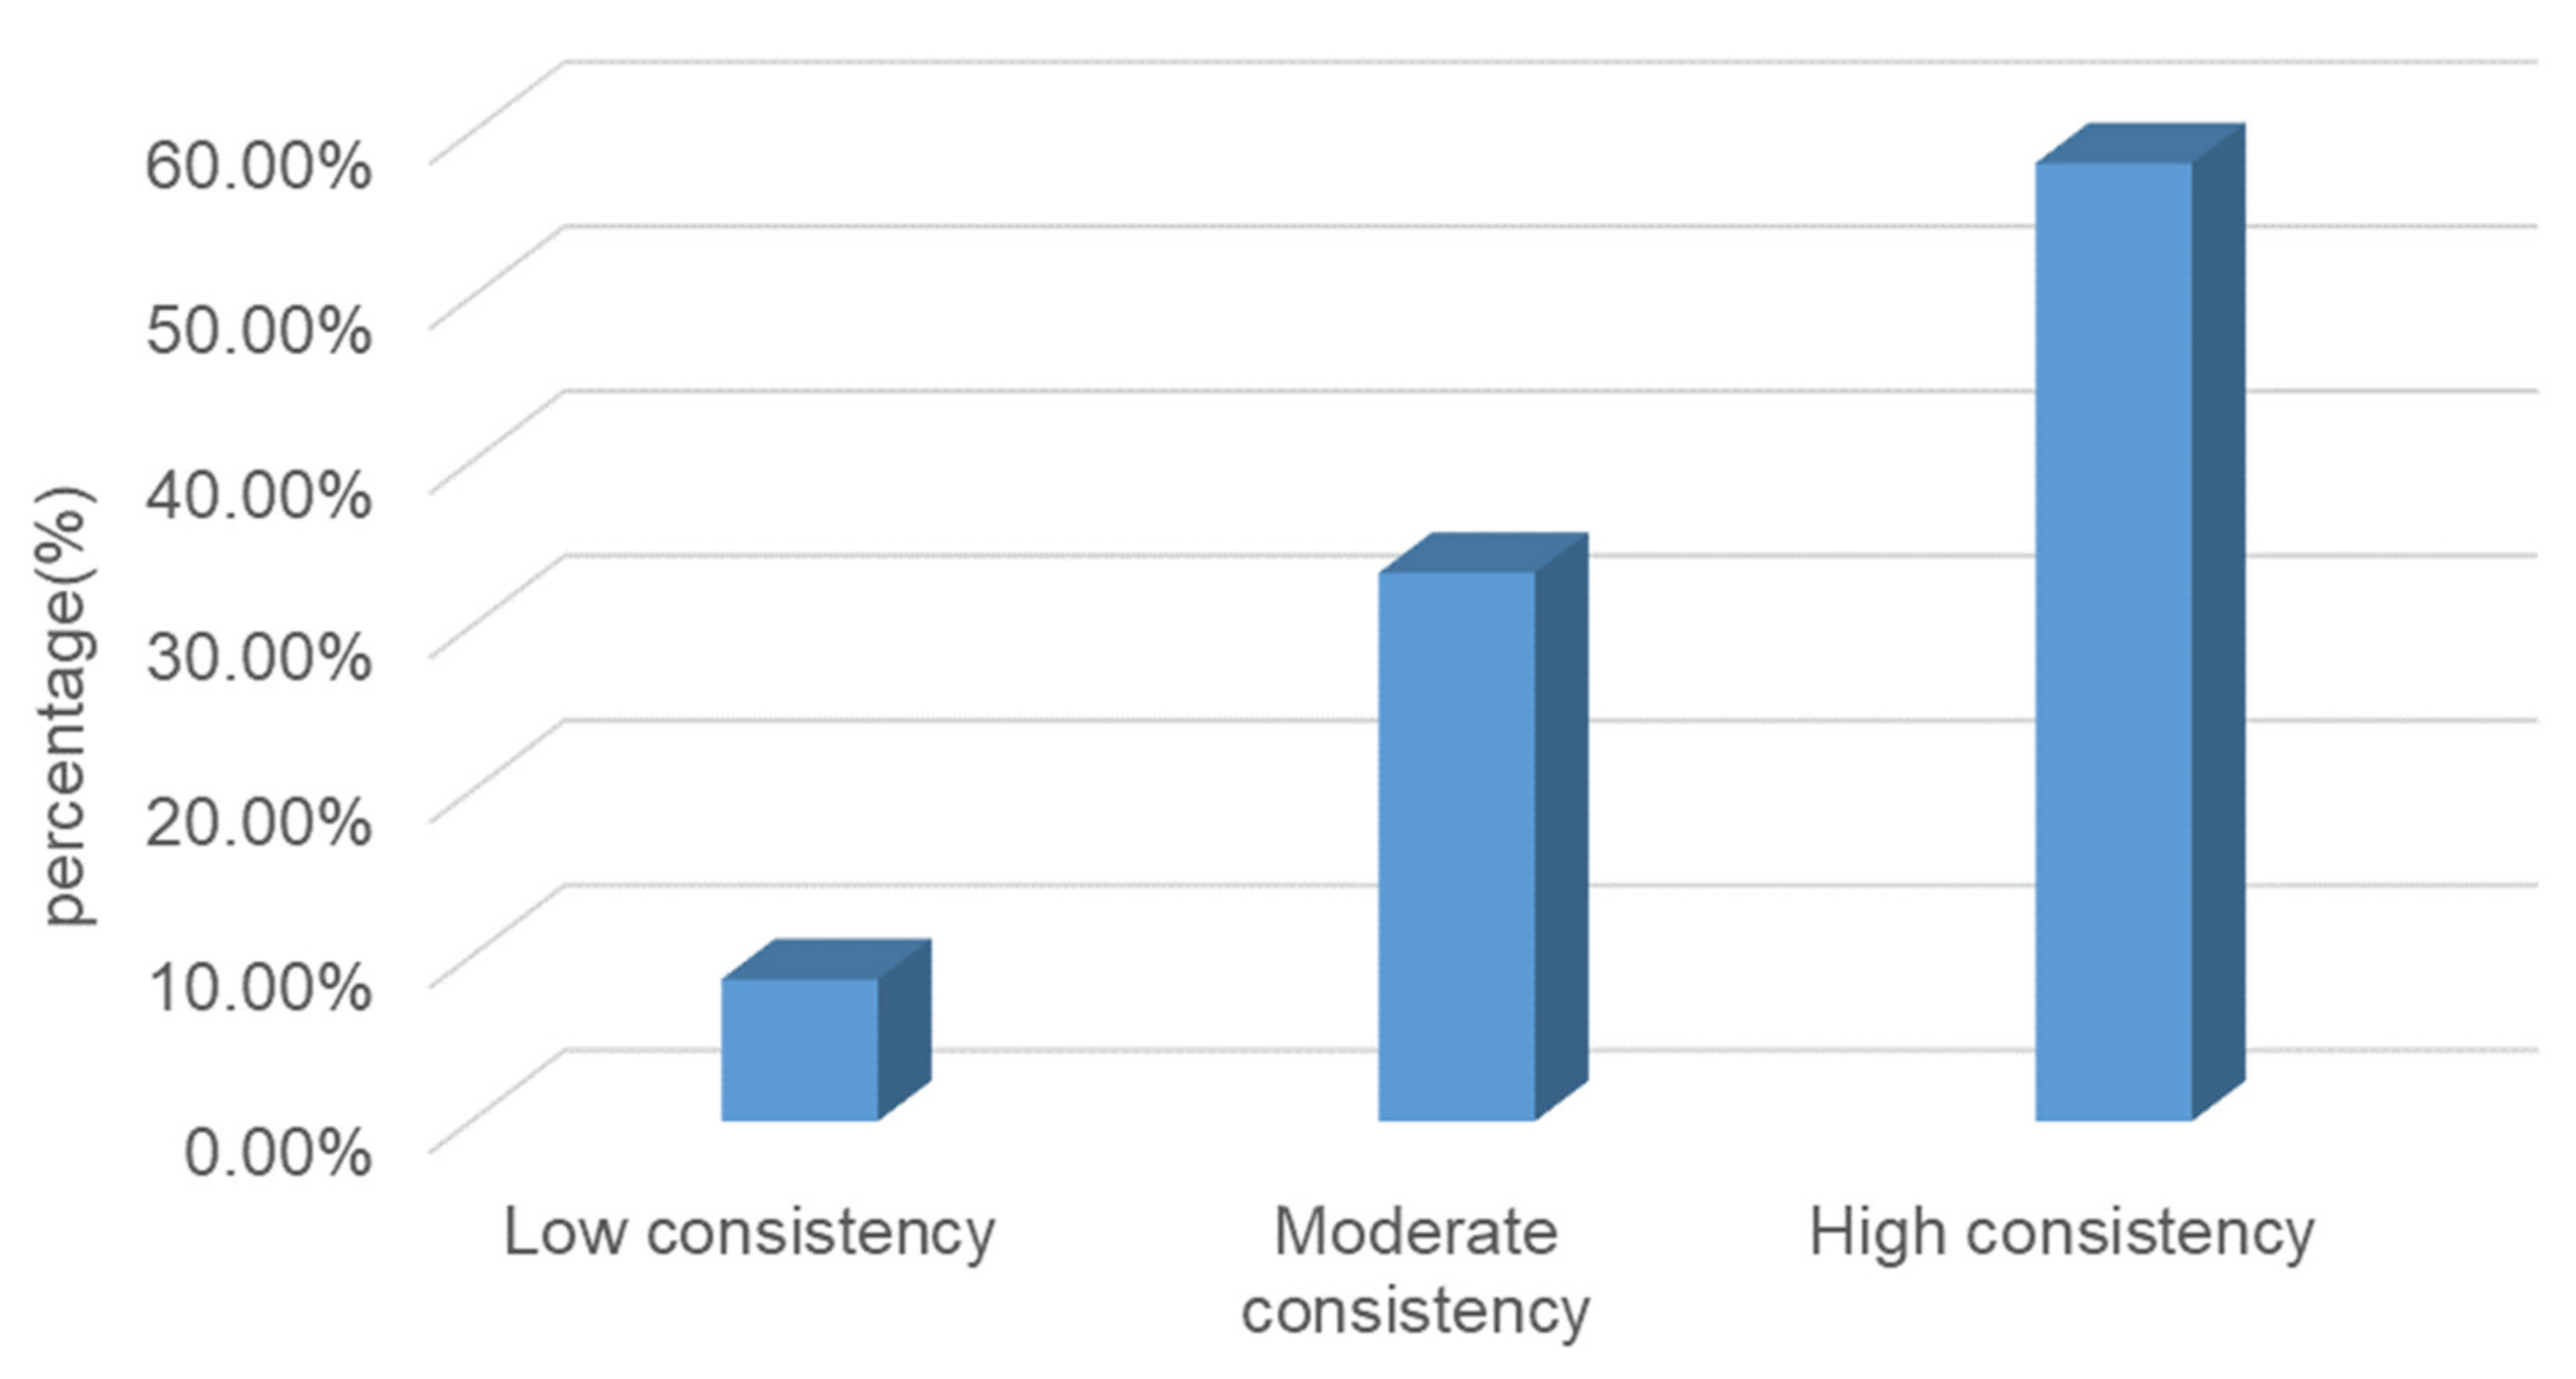
4.2. Consistency Analysis of Spatial Patterns

As the largest country in Southeast Asia, Indonesia is rich in natural resources due to its location in the contact zone between the Eurasian and Pacific plates, a region featuring frequent crustal movements and numerous volcanoes [46]. Figure 6 and Figure 7 illustrate the spatial consistency distributions and area statistics of several major cover types from the three land cover products in the study area. For cropland types (Figure 6a), the highly consistent regions of the three products were mainly distributed on northwestern Java, eastern Sumatra, and southwestern Sulawesi. The percentage of highly consistent area to the total area of the study area was 3.15% (Figure 7a). On eastern, western, and northwestern Kalimantan, central Sumatra, Java, and Nusa Tenggara, the consistency of cropland for the three products was low. For forest types (Figure 6b), all of the products exhibited high consistency on Papua, Maluku, central Sulawesi, and central and northern Kalimantan. From Figure 7b, the percentage of highly consistent area of forest to the total area of the study area was 54.21%. For grassland types (Figure 6c), the three land cover products differed greatly, with the percentage of highly consistent area to the total area of the study area only 0.004% (Figure 7c). The low consistency areas were distributed in the border areas of forest and cropland types on Java and other coastal areas. For the artificial surface type (Figure 6d), the consistency of the three products was found to be relatively low. The highly consistent area was mainly distributed in the Jakarta area of Java, and the consistency area accounted for 0.29% of the study area (Figure 7d).
Based on the consistency analysis of each land cover type, the consistency of all types for the three products in Indonesia was further analyzed (Figure 8 and Figure 9). The results revealed that the area ratios of the three land cover products for high-consistency areas, moderate-consistency areas, and low-consistency areas were 58.14%, 33.25%, and 8.61%, respectively. The high-consistency areas were mainly distributed on Papua Island, with forest land as the main cover type, and in the central and northern regions of Kalimantan island, with the proportions of the high-consistency areas on each island to the total study area totaling 18.05% and 17.05%, respectively. Meanwhile, low consistency of the three land cover products was found in the eastern, southern, and northwestern regions of Kalimantan, and the alluvial plains of eastern Sumatra and Java. The main cover types in these low-consistency areas were cropland, artificial surface, and grassland.

4.3. Spatial Consistency at Different Elevations

In order to analyze the influence of topographic and geomorphologic features on the precision of land cover products, the spatial consistency distribution results of the three land cover products obtained in Section 4.2 were superimposed with different elevations to obtain the spatial consistency distribution law under different elevations. Figure 10 shows the distribution law of low consistency for several major land cover types at different elevations. It was discovered that the low consistency of cropland, forest, grassland, and artificial surface types among the three products was mainly concentrated in the elevation range of <200 m. The proportions of the areas of low-consistency regions of each type to the total area of the corresponding low-consistency regions were 79.30%, 83.64%, 72.69%, and 85.25%, respectively. With reference to Figure 12, the consistency of each type of the three land cover products is low in the area with the elevation is <200 m which accounts for 61.19% of the total area of the study area. When the elevation is >200 m, however, the low-consistency area of each type decreases significantly, with the area ratios of the low-consistency areas <≈10%.
Figure 11 shows the distribution law of the overall low consistency area of the three products at different elevations. For all of Indonesia, the low-consistency area was mainly distributed at elevations < 200 m, accounting for 80.22% of the total low-consistency area. These areas were mainly located on Sumatra, Java, and Kalimantan. Therefore, as with the distribution law of low consistency of different types at different elevation levels, the overall consistency of the three land cover products was the lowest in the area with the elevation of <200 m which accounts for 61.19% (Figure 12) of the total area of the study area, and the land cover types varied greatly among the different products. The low consistency of the three products across the entire study area was significantly less when the elevation was >200 m, particularly when the elevation was >2000 m, where the low-consistency area only accounted for 1.50% of the total low-consistency area, and forest was the main land cover type.
From the above analysis, the low consistency of each type or total of the three land cover products decreases with the decrease of the percentage of elevation grade area. That is, the low consistency is highest in the range of elevation <200 m with the largest proportion of area, and decreases with the decrease of the percentage of elevation grade area.

4.4. Precision Comparison of Different Products

4.4.1. Relative Precision

Table 6, Table 7 and Table 8 are the confusion matrices between combinations of two of the three products, showing that the overall accuracy of any two of the three products was <73%, and the kappa coefficient was less than 0.30. The overall accuracy and kappa coefficient between the FROM_GLC2015 and GlobeLand30-2010 products were the highest, with respective values of 72.24% and 0.22, which is consistent with the conclusion regarding the area correlation coefficients of the different product types obtained in Section 4.1. The analysis of the various land cover types revealed that the consistency of the forest land cover type between the FROM_GLC2015 and GLC_FCS30-2015 products was the highest, and the mapping accuracy was 95.81%, while the mapping accuracy of the forest between the GLC_FCS30-2015 and GlobeLand30-2010 was the lowest, with a value of 70.03%. The consistency levels of the grassland and water types between the FROM_GLC2015 and GLC_FCS30-2015 products were high, with mapping accuracies of 73.33% and 83.31%, respectively. For cropland, the consistency between the GLC_FCS30-2015 and GlobeLand30-2010 products was high, and the mapping accuracy was 68.36%, but the user accuracy was only 29.35%.

4.4.2. Absolute Precision

The absolute accuracy of the three land cover products was evaluated using the sample points obtained by field investigation and artificial encryption. The results revealed that the overall accuracy and kappa coefficient of the GLC_FCS30-2015 product were the highest, with values of 65.59% and 0.55, respectively (Table 9), followed by the GlobeLand30-2010 product, with overall accuracy and kappa coefficient values of 61.65% and 0.49, respectively (Table 10). The overall accuracy and kappa coefficient values of the FROM_GLC2015 product were the lowest, with respective values of 57.71% and 0.46 (Table 11). For the various land cover types, the mapping accuracies of the cropland, forest, and artificial surface types of the GLC_FCS30-2015 product were high, with levels ranging from 83.21% to 99.07%, while the mapping accuracies of the grassland, shrubland, and bareland types were <15%. For the FROM_GLC2015 and GlobeLand30-2010 products, the mapping accuracies of the forest and artificial surface types ranged from 78.50% to 96.25%, while the grassland and shrubland types were lower. In addition, the accuracy of the bareland for GlobeLand30 and the wetland for FROM_GLC is 0, indicating that these two types have not been correctly classified.

5. Discussion

Given that the tropical rainforest climate zone is the world’s largest biological gene bank, changes in its land cover not only reflect its surface natural environment, but also directly affect the global environment, especially human living conditions. Remote sensing mapping technology can now provide data support for related research. In this study, we performed a comprehensive evaluation and analysis of three freely available global land cover products, in general, there is low consistency among these products, possibly as a result of the following:
(1) Data sources. Differences in remote sensing images will affect the consistency between different products. The GlobeLand30-2010 product is classified using single Landsat TM/ETM remote sensing images combined with HJ-1A/B remote sensing images, the FROM_GLC2015 product is classified using only single Landsat TM/ETM/OL remote sensing images, while the GLC_FCS30-2015 product is classified using time series Landsat OLI remote sensing images. Our absolute accuracy evaluation revealed that the mapping accuracy of the land cover products obtained with time series Landsat imagery (Table 9) was higher than that obtained with single-period Landsat imagery (Table 10 and Table 11). At the same time, the fact that the complex cloudy and rainy weather conditions in the tropical rainforest climate area seriously impact the acquisition of high-quality remote sensing images cannot be ignored, which directly affects the accuracy of subsequent classification. Moreover, we found that the area composition correlation coefficient between the GlobeLand30-2010 and FROM_GLC2015 products (Table 5) as well as the relative accuracy were highest (Table 6). It shows that the inconsistency caused by the dynamic change of land cover is much smaller than that caused by different institutions, different data sources, and different classification methods.
(2) Classification systems. The global land cover classification system was established for global classification by taking full account of global land cover characteristics, which inevitably leads to the limitations of its application to unique geographical locations such as tropical rainforest climate zones [47]. The GlobeLand30-2010 product classification system only includes 10 first-class categories, while the classification systems of the FROM_GLC2015 and GLC_FCS30-2015 products are more refined. There are differences in the definitions of some land cover types among the classification systems of these products. For example, for the shrubs of various vegetation type in the tropical rainforest climate zone, the GlobeLand30-2010 product clearly defines land with shrub coverage > 30% and desert shrub coverage > 10% in desert areas as shrubs, while the GLC_FCS30-2015 and FROM_GLC2015 products only define evergreen shrubland and deciduous shrubland, and do not explicitly provide the vegetation coverage values. Differences in the definitions of these vegetation types resulted in low consistencies of the grassland, shrubland, and bareland types among the three products.
(3) Classification strategies and methods. There are some differences in the classification strategies and methods used in the three global land cover products, which will have an impact on consistency. The GlobeLand30-2010 product is constructed using a single-type classification, followed by an integrated classification strategy. The classification method based on “pixel-object-knowledge” is used to classify each type one-by-one, including pixel-based classification, object-based filtering, and human–computer interaction verification to fully utilize the advantages of various classification algorithms and make full use of knowledge and human experience in order to improve classification quality. In addition, this method effectively reduces the classification errors caused by the same objects having different spectra and different objects having the same spectrum [18]. However, the classification strategies and methods adopted by the GlobeLand30-2010 product not only create a large workload, but also require a great deal of human input. The FROM_GLC2015 and GLC_FCS30-2015 products are generated using random forest classification algorithms that are rated as the most robust in global land cover mapping [48,49]. The FROM_GLC2015 product first divides the Earth into 16 regions, and then DEM data, Slope data, Landsat images, and the first global multi-season sample set [50] are used for training classification. Moreover, nighttime light data are introduced to improve the accuracy of impervious types. The FROM_GLC2015 product, however, is extracted scene-by-scene and stitched scene-by-scene during the entire extraction process. The final classification results exhibit severe banding, which seriously affects the overall accuracy. The GLC_FCS30-2015 product proposes a global spatial-temporal spectral library (GSPECLib) using temporal MCD43A4 [20] reflectance products and CCI_LC2015 [51] surface cover products. When constructing the GSPECLib, CCI_LC coverage products are utilized to provide category information for the spectral features satisfying the conditions. Then, based on the geographic location of the GSPECLib, along with the time series Landsat data and the auxiliary terrain data integrated by the Google Earth Engine (GEE) cloud platform, the random forest multi-temporal classification model is trained region-by-region, and the global 30-m high-resolution surface cover classification results are obtained. The classification technology of the GLC_FCS30-2015 product obtains a continuous spatial distribution pattern of ground objects, effectively eliminating the banding problem in the single-period classification results and achieving higher overall accuracy than the other two products.
(4) Other factors. The consistency of different products is high for land cover types with obvious spectral and texture features (such as water and artificial surfaces). For the various vegetation types in the tropical rainforest climate zone, such as forest, shrubs, and grassland, due to the small differences in spectral and textural characteristics and the similar life forms, different types often display the same spectrum, making it more difficult for optical remote sensing to yield accurate classifications. Therefore, the consistency of these confusing types is low.
Analysis revealed that these global land cover products exhibit better mapping accuracy for the dominant forest types in tropical rainforest climate regions such as Indonesia. Users can select one of the products as their data source for relevant research. However, the special climatic and geographical features in the tropical rainforest climate region, such as cloudy and rainy weather, as well as the common occurrence of the same object having different spectra and different objects having the same spectrum, increase the difficulty of remote sensing interpretation. Therefore, for remote sensing interpretation of the tropical rainforest climate region, only relying on a single optical remote sensing image for classification leads to a very large error. It is therefore necessary to integrate multiple data sources (such as SAR and LiDAR data) in order to avoid interference from clouds and rain. Furthermore, the introduction of auxiliary data (such as DEM data) to prior regional divisions of tropical rainforest climate zones may help to improve classification accuracy.

6. Conclusions

In order to provide a reference for the selection of suitable land cover data required by many studies in tropical rainforest climate regions, this study performed precision evaluation and consistency analysis of three global land cover products, reaching the following conclusions: (1) the performances of the three products on Indonesia’s overall land cover type are basically the same. There is a strong area correlation between different products, with a correlation coefficient better than 0.89. (2) The overall spatial consistency of the three products is low, with the highly consistent area accounting for 58% of the total area of Indonesia. This high-consistency area is mainly distributed on Papua Island, as well as the central and northern parts of Kalimantan, with forest as the main land cover type. The low-consistency area is mainly distributed in the more complex areas with elevations < 200 m, such as eastern Sumatra, Java, and the eastern, southern, and northwestern parts of Kalimantan. The grassland, shrubland, forest, cropland, artificial surface, and other land cover types of these areas are staggered and affected by human activities. Therefore, attempts to improve classification accuracy should focus on these areas. (3) The absolute accuracy evaluation experiment of three products shows that the GLC_FCS30-2015 product displays the highest overall accuracy in Indonesia (65.59%), the GlobeLand30-2010 product exhibits the second-highest overall accuracy (61.65%), and the FROM_GLC2015 product has the lowest overall accuracy (57.71%). For forests and artificial surfaces, the classification accuracy of the three products is higher and land cover users can choose any of these products when conducting related research on these land cover types. The GLC_FCS30-2015 product exhibits better classification accuracy for cropland types, with its mapping accuracy in Indonesia reaching 85.28%. The mapping accuracies of the three products are low for grassland, shrubland, bareland, and wetland types, however, indicating that land cover mappers should focus on ways to improve the accuracy of these types. In general, the accuracy levels of these three global land cover products in Indonesia are not ideal, especially for grassland, shrubland, bareland, and wetland land cover types. Hence, these products are not suitable for land cover change studies in Indonesia.
With the development of remote sensing technology, different production agencies and organizations are constantly introducing new and higher-resolution land cover products. In view of the differences between these multi-source remote sensing land cover products, the use of data fusion technology to improve the accuracy of these products will be the main development trend of global land cover mapping in the future.

Author Contributions

Conceptualization, Z.W., L.S., and X.Y.; methodology, Z.W., L.S., and J.K.; software, J.K, Y.M., and J.W.; validation, J.K. and L.S.; formal analysis, J.K. and Z.W.; investigation, Z.W. and J.K.; resources, X.Y.; data curation, J.K.; writing—original draft preparation, J.K.; writing—review and editing, Z.W., L.S., and X.Y.; visualization, J.K. and Y.M.; supervision, L.S. and X.Y.; project administration, X.Y.; funding acquisition, X.Y. All authors have read and agreed to the published version of the manuscript.

Funding

This study was supported by the National Key Research and Development Program of China, Grant No. 2016YFB0501404; the CAS Earth Big Data Science Project, Grant No. XDA19060303; the National Science Foundation of China, Grant No. 41671436, and the Innovation Project of LREIS, Grant No. O88RAA01YA.

Acknowledgments

The authors sincerely thank to the production agencies that provide free land cover datasets.

Conflicts of Interest

The authors declare no conflicts of interest.

References

  1. Erb, K.H.; Luyssaert, S.; Meyfroidt, P.; Pongratz, J.; Don, A.; Kloster, S.; Kuemmerle, T.; Fetzel, T.; Fuchs, R.; Herold, M. Land management: Data availability and process understanding for global change studies. Glob. Chang. Biol. 2017, 23, 512–533. [Google Scholar] [CrossRef] [PubMed] [Green Version]
  2. Tolessa, T.; Senbeta, F.; Kidane, M. The impact of land use/land cover change on ecosystem services in the central highlands of Ethiopia. Ecosyst. Serv. 2017, 23, 47–54. [Google Scholar] [CrossRef]
  3. Franklin, J.; Serra-Diaz, J.M.; Syphard, A.D.; Regan, H.M. Big data for forecasting the impacts of global change on plant communities. Glob. Ecol. Biogeogr. 2017, 26, 6–17. [Google Scholar] [CrossRef]
  4. De Noblet-Ducoudré, N.; Boisier, J.-P.; Pitman, A.; Bonan, G.; Brovkin, V.; Cruz, F.; Delire, C.; Gayler, V.; Van den Hurk, B.; Lawrence, P. Determining robust impacts of land-use-induced land cover changes on surface climate over North America and Eurasia: Results from the first set of LUCID experiments. J. Clim. 2012, 25, 3261–3281. [Google Scholar] [CrossRef] [Green Version]
  5. Kayet, N.; Pathak, K.; Chakrabarty, A.; Sahoo, S. Spatial impact of land use/land cover change on surface temperature distribution in Saranda Forest, Jharkhand. Modeling Earth Syst. Environ. 2016, 2, 127. [Google Scholar] [CrossRef] [Green Version]
  6. Keola, S.; Andersson, M.; Hall, O. Monitoring economic development from space: Using nighttime light and land cover data to measure economic growth. World Dev. 2015, 66, 322–334. [Google Scholar] [CrossRef]
  7. Sterling, S.M.; Ducharne, A.; Polcher, J. The impact of global land-cover change on the terrestrial water cycle. Nat. Clim. Chang. 2013, 3, 385–390. [Google Scholar] [CrossRef]
  8. Cao, Q.; Yu, D.; Georgescu, M.; Han, Z.; Wu, J. Impacts of land use and land cover change on regional climate: A case study in the agro-pastoral transitional zone of China. Environ. Res. Lett. 2015, 10, 124025. [Google Scholar] [CrossRef]
  9. Hou, K.; Li, X.; Wang, J.J.; Zhang, J. An analysis of the impact on land use and ecological vulnerability of the policy of returning farmland to forest in Yan’an, China. Environ. Sci. Pollut. Res. 2016, 23, 4670–4680. [Google Scholar] [CrossRef]
  10. Salazar, A.; Baldi, G.; Hirota, M.; Syktus, J.; McAlpine, C. Land use and land cover change impacts on the regional climate of non-Amazonian South America: A review. Glob. Planet. Chang. 2015, 128, 103–119. [Google Scholar] [CrossRef]
  11. Watt, P.; Donoghue, D. Measuring forest structure with terrestrial laser scanning. Int. J. Remote Sens. 2005, 26, 1437–1446. [Google Scholar] [CrossRef]
  12. Almeida, C.A.d.; Coutinho, A.C.; Esquerdo, J.C.D.M.; Adami, M.; Venturieri, A.; Diniz, C.G.; Dessay, N.; Durieux, L.; Gomes, A.R. High spatial resolution land use and land cover mapping of the Brazilian Legal Amazon in 2008 using Landsat-5/TM and MODIS data. Acta Amaz. 2016, 46, 291–302. [Google Scholar] [CrossRef]
  13. Yifang, B.; Gong, P.; Gini, C. Global land cover mapping using Earth observation satellite data: Recent progresses and challenges. ISPRS J. Photogramm. Remote Sens. (Print) 2015, 103, 1–6. [Google Scholar]
  14. Laurin, G.V.; Liesenberg, V.; Chen, Q.; Guerriero, L.; Del Frate, F.; Bartolini, A.; Coomes, D.; Wilebore, B.; Lindsell, J.; Valentini, R. Optical and SAR sensor synergies for forest and land cover mapping in a tropical site in West Africa. Int. J. Appl. Earth Obs. Geoinf. 2013, 21, 7–16. [Google Scholar] [CrossRef]
  15. Abdikan, S.; Sanli, F.B.; Ustuner, M.; Calò, F. Land cover mapping using sentinel-1 SAR data. Int. Arch. Photogramm. Remote Sens. Spat. Inf. Sci. 2016, 41, 757. [Google Scholar] [CrossRef]
  16. Zhong, B.; Ma, P.; Nie, A.; Yang, A.; Yao, Y.; Lü, W.; Zhang, H.; Liu, Q. Land cover mapping using time series HJ-1/CCD data. Sci. China Earth Sci. 2014, 57, 1790–1799. [Google Scholar] [CrossRef]
  17. Zhang, X.; Liu, L.; Chen, X.; Xie, S.; Gao, Y. Fine land-cover mapping in china using landsat datacube and an operational speclib-based approach. Remote Sens. 2019, 11, 1056. [Google Scholar] [CrossRef] [Green Version]
  18. Chen, J.; Chen, J.; Liao, A.; Cao, X.; Chen, L.; Chen, X.; He, C.; Han, G.; Peng, S.; Lu, M. Global land cover mapping at 30 m resolution: A POK-based operational approach. ISPRS J. Photogramm. Remote Sens. 2015, 103, 7–27. [Google Scholar] [CrossRef] [Green Version]
  19. Gong, P.; Wang, J.; Yu, L.; Zhao, Y.; Zhao, Y.; Liang, L.; Niu, Z.; Huang, X.; Fu, H.; Liu, S. Finer resolution observation and monitoring of global land cover: First mapping results with Landsat TM and ETM+ data. Int. J. Remote Sens. 2013, 34, 2607–2654. [Google Scholar] [CrossRef] [Green Version]
  20. Friedl, M.A.; Sulla-Menashe, D.; Tan, B.; Schneider, A.; Ramankutty, N.; Sibley, A.; Huang, X. MODIS Collection 5 global land cover: Algorithm refinements and characterization of new datasets. Remote Sens. Environ. 2010, 114, 168–182. [Google Scholar] [CrossRef]
  21. Bartholomé, E.; Belward, A.S. GLC2000: A new approach to global land cover mapping from Earth observation data. Int. J. Remote Sens. 2005, 26, 1959–1977. [Google Scholar] [CrossRef]
  22. Hankui, K.; Zhang, D.; Roy, P. Using the 500 m MODIS land cover product to derive a consistent continental scale 30 m Landsat land cover classification. Remote Sens. Environ. 2017, 197, 15–34. [Google Scholar] [CrossRef]
  23. Yin, D.; Nickovic, S.; Sprigg, W.A. The impact of using different land cover data on wind-blown desert dust modeling results in the southwestern United States. Atmos. Environ. 2007, 41, 2214–2224. [Google Scholar] [CrossRef]
  24. Pérez-Hoyos, A.; García-Haro, F.J.; San-Miguel-Ayanz, J. A methodology to generate a synergetic land-cover map by fusion of different land-cover products. Int. J. Appl. Earth Obs. Geoinf. 2012, 19, 72–87. [Google Scholar] [CrossRef]
  25. Tsendbazar, N.; De Bruin, S.; Herold, M. Assessing global land cover reference datasets for different user communities. ISPRS J. Photogramm. Remote Sens. 2015, 103, 93–114. [Google Scholar] [CrossRef]
  26. Rendenieks, Z.; Tērauds, A.; Nikodemus, O.; Brūmelis, G. Comparison of input data with different spatial resolution in landscape pattern analysis–A case study from northern Latvia. Appl. Geogr. 2017, 83, 100–106. [Google Scholar] [CrossRef]
  27. Liang, D.; Zuo, Y.; Huang, L.; Zhao, J.; Teng, L.; Yang, F. Evaluation of the consistency of MODIS Land Cover Product (MCD12Q1) based on Chinese 30 m GlobeLand30 datasets: A case study in Anhui Province, China. ISPRS Int. J. Geo-Inf. 2015, 4, 2519–2541. [Google Scholar] [CrossRef] [Green Version]
  28. Song, H.; Zhang, X. Precision analysis and validation of multi-sources landcover products derived from remote sensing in China. Trans. Chin. Soc. Agric. Eng. 2012, 28, 207–214. [Google Scholar]
  29. Song, H.; Zhang, X. Exploratory analysis of category accuracy for multi-sources land cover products. Res. Soil Water Conserv. 2015, 22, 36–41. [Google Scholar]
  30. Kuenzer, C.; Leinenkugel, P.; Vollmuth, M.; Dech, S. Comparing global land-cover products–implications for geoscience applications: An investigation for the trans-boundary Mekong Basin. Int. J. Remote Sens. 2014, 35, 2752–2779. [Google Scholar] [CrossRef] [Green Version]
  31. Liang, L.; Liu, Q.; Liu, G.; Li, H.; Huang, C. Accuracy Evaluation and Consistency Analysis of Four Global Land Cover Products in the Arctic Region. Remote Sens. 2019, 11, 1396. [Google Scholar] [CrossRef] [Green Version]
  32. Kang, J.; Sui, L.; Yang, X.; Wang, Z.; Huang, C.; Wang, J. Spatial Pattern Consistency among DifferentRemote-Sensing Land Cover Datasets: A Case Studyin Northern Laos. ISPRS Int. J. Geo-Inf. 2019, 8, 201. [Google Scholar] [CrossRef] [Green Version]
  33. Giri, C.; Zhu, Z.; Reed, B. A comparative analysis of the Global Land Cover 2000 and MODIS land cover data sets. Remote Sens. of Environ. 2005, 94, 123–132. [Google Scholar] [CrossRef]
  34. Herold, M.; Mayaux, P.; Woodcock, C.E.; Baccini, A.; Schmullius, C. Some challenges in global land cover mapping: An assessment of agreement and accuracy in existing 1 km datasets. Remote Sens. Environ. 2008, 112, 2538–2556. [Google Scholar] [CrossRef]
  35. Hua, T.; Zhao, W.; Liu, Y.; Wang, S.; Yang, S. Spatial consistency assessments for global land-cover datasets: A comparison among GLC2000, CCI LC, MCD12, GLOBCOVER and GLCNMO. Remote Sens. 2018, 10, 1846. [Google Scholar] [CrossRef] [Green Version]
  36. Zeyuan, X.; Qinghui, L.; Zhonglin, X. Consistency of Land Cover Data Derived from Remote Sensing in Xinjiang. J. Geo-Inf. Sci. 2019, 21, 127–136. [Google Scholar]
  37. Qi, W.; Yang, X.; Li, Z.; Li, Y.; Yang, F. Correlation of topography and land use type distribution: Taking Jinggangshan region in Jiangxi Province for an example. Remote Sens. Inf. 2018, 33, 64–71. [Google Scholar]
  38. Yi, L.; Zhang, G. Object-oriented remote sensing imagery classification accuracy assessment based on confusion matrix. In Proceedings of the 2012 20th International Conference on Geoinformatics, Hong Kong, China, 15–17 June 2012. [Google Scholar]
  39. Ismail, M.H.; Jusoff, K. Satellite data classification accuracy assessment based from reference dataset. Int. J. Comput. Inf. Sci. Eng. 2008, 2, 96–102. [Google Scholar]
  40. Hsiao, L.H.; Cheng, K.S. Assessing uncertainties in accuracy of landuse classification using remote sensing images. ISPRS Int. Arch. Photogramm. Remote Sens. Spat. Inf. Sci. 2013, 40, 19–23. [Google Scholar] [CrossRef] [Green Version]
  41. Niu, Z.; Shan, Y.; Gong, P. Accuracy evaluation of two global land cover data sets over wetlands of China. In Proceedings of the XXII Congress of the International Society for Photogrammetry and Remote SensingThe XXII Congress of the International Society for Photogrammetry and Remote Sensing, Melbourne, Australia, 25 August–1 September 2012. [Google Scholar] [CrossRef] [Green Version]
  42. Liu, Q.; Zhang, Y.; Liu, L.; Li, L.; Qi, W. Accuracy evaluation of the seven land cover data in Qiangtang Plateau. Geogr. Res. 2017, 36, 2061–2074. [Google Scholar]
  43. Zhao, Y.; Gong, P.; Yu, L.; Hu, L.; Li, X.; Li, C.; Zhang, H.; Zheng, Y.; Wang, J.; Zhao, Y. Towards a common validation sample set for global land-cover mapping. Int. J. Remote Sens. 2014, 35, 4795–4814. [Google Scholar] [CrossRef]
  44. Huang, Y.; Liao, S. Regional accuracy assessments of the first global land coverdataset at 30-meter resolution: A case study of Henan province. Geogr. Res. 2016, 35, 1433–1446. [Google Scholar]
  45. Fritz, S.; McCallum, I.; Schill, C.; Perger, C.; See, L.; Schepaschenko, D.; Velde, M.v.d.; Kraxner, F.; Obersteiner, M. Geo-Wiki: An online platform for improving global land cover. Environ. Model. Softw. 2012, 31, 110–123. [Google Scholar] [CrossRef]
  46. Djaenudin, D.; Oktaviani, R.; Hartoyo, S.; Dwiprabowo, H. Modelling of land allocation behavior in Indonesia. Procedia Environ. Sci. 2016, 33, 78–86. [Google Scholar] [CrossRef] [Green Version]
  47. Congalton, R.G.; Gu, J.; Yadav, K.; Thenkabail, P.; Ozdogan, M. Global land cover mapping: A review and uncertainty analysis. Remote Sens. 2014, 6, 12070–12093. [Google Scholar] [CrossRef] [Green Version]
  48. Li, C.; Wang, J.; Wang, L.; Hu, L.; Gong, P. Comparison of classification algorithms and training sample sizes in urban land classification with Landsat thematic mapper imagery. Remote Sens. 2014, 6, 964–983. [Google Scholar] [CrossRef] [Green Version]
  49. Feng, D.; Zhao, Y.; Yu, L.; Li, C.; Wang, J.; Clinton, N.; Bai, Y.; Belward, A.; Zhu, Z.; Gong, P. Circa 2014 African land-cover maps compatible with FROM-GLC and GLC2000 classification schemes based on multi-seasonal Landsat data. Int. J. Remote Sens. 2016, 37, 4648–4664. [Google Scholar] [CrossRef]
  50. Li, C.; Gong, P.; Wang, J.; Zhu, Z.; Biging, G.S.; Yuan, C.; Hu, T.; Zhang, H.; Wang, Q.; Li, X. The first all-season sample set for mapping global land cover with Landsat-8 data. Sci. Bull. 2017, 62, 508–515. [Google Scholar] [CrossRef] [Green Version]
  51. Defourny, P.; Kirches, G.; Brockmann, C.; Boettcher, M.; Peters, M.; Bontemps, S.; Lamarche, C.; Schlerf, M.; Santoro, M. Land Cover CCI: Product User Guide Version 2. 2018. Available online: https://www.esa-landcover-cci.org/?q=webfm_send/84 (accessed on 4 May 2019).
Figure 1. Digital elevation model (DEM) map of Indonesia.
Remotesensing 12 01410 g001
Figure 2. Spatial distributions of the three land cover products in Indonesia: (a) GlobeLand30-2010, (b) FROM_GLC 2015, and (c) GLC_FCS30-2015.
Remotesensing 12 01410 g002aRemotesensing 12 01410 g002b
Figure 3. Spatial distribution of field survey sample points and route.
Remotesensing 12 01410 g003
Figure 4. Spatial distribution of verification samples: (a) sample points in 2010 and (b) sample points in 2015.
Remotesensing 12 01410 g004
Figure 5. Area comparisons of different products.
Remotesensing 12 01410 g005
Figure 6. Spatial consistency distributions of major land cover types in the study area: (a) cropland, (b) forest, (c) grassland, and (d) artificial surface.
Remotesensing 12 01410 g006aRemotesensing 12 01410 g006b
Figure 7. Percentage of consistent areas of major land cover types in the study area: (a) cropland, (b) forest, (c) grassland, and (d) artificial surface
Remotesensing 12 01410 g007
Figure 8. Spatial consistency distributions of all land cover types in the study area.
Remotesensing 12 01410 g008
Figure 9. Consistency area percentage of all land cover types in the study area.
Remotesensing 12 01410 g009
Figure 10. Distributions and area percentage of low-consistency areas of the main land cover types at different elevations: (a) cropland, (b) forest, (c) grassland, and (d) artificial surface.
Remotesensing 12 01410 g010aRemotesensing 12 01410 g010b
Figure 11. Distributions and area percentage of low-consistency areas of all land cover types at different elevations.
Remotesensing 12 01410 g011aRemotesensing 12 01410 g011bRemotesensing 12 01410 g011c
Figure 12. Area percentage of elevation grade relative to the study area.
Remotesensing 12 01410 g012
Table 1. Main parameters of different products.
NameResolution (m)Number of CategoriesTimeMethodOverall Accuracy (%) Production InstitutionSensorSatelliteArea
GlobeLand30-201030102010POK (based on
pixels, objects, and
knowledge rules)
80.3National
Geomatics
Center of
China
TM/ETM+Landsat/ HJ-1A/BGlobal
FROM_GLC201530262015Random forest77.3Tsinghua
University
TM/ETM+/ OLILandsatGlobal
GLC_FCS30-201530302015Random forest81.4Institute of Remote Sensing and Digital Earth, Chinese Academy of SciencesOLILandsatGlobal
Table 2. Original classification systems and codes for different land cover products.
CodeGlobeLand30-2010CodeFROM_GLC2015CodeGLC_FCS30-2015
10Cropland10Cropland10Rainfed cropland
20Forest11Rice paddy11Herbaceous cover
30Grassland12Greenhouse12Tree or shrub cover (orchard)
40Shrubland13Other20Irrigated cropland
50Wetland14Orchard50Evergreen broadleaf forest
60Water body15Bare farmland60Deciduous broadleaf forest
70Tundra20Forest61Open deciduous broadleaf forest (0.15 < fc < 0.4)
80Artificial surface21Broadleaf, leaf-on62Closed deciduous broadleaf forest (fc > 0.4)
90Bareland22Broadleaf, leaf-off70Evergreen needleleaf forest
100Permanent snow and ice23Needleleaf, leaf-on71Open evergreen needleleaf forest (0.15 < fc < 0.4)
24Needleleaf, leaf-off72Closed evergreen needleleaf forest (fc > 0.4)
25Mixed leaf, leaf-on80Deciduous needleleaf forest
26Mixed leaf, leaf-off81Open deciduous needleleaf forest (0.15 < fc < 0.4)
30Grassland82Closed deciduous needleleaf forest (fc > 0.4)
31Pasture90Mixed-leaf forest (broadleaf and needleleaf)
32Natural grassland120Shrubland
33Grassland, leaf-off121Evergreen shrubland
40Shrubland122Deciduous shrubland
41Shrubland, leaf-on130Grassland
42Shrubland, leaf-off140Lichens and mosses
50Wetland150Sparse vegetation (fc < 0.15)
51Marshland152Sparse shrubland (fc < 0.15)
52Mudflat153Sparse herbaceous (fc < 0.15)
53Marshland, leaf-off180Wetland
60Water190Impervious
70Tundra200Bare area
71Scrub and brush tundra201Consolidated bare area
72Herbaceous tundra202Unconsolidated bare area
80Impervious surface210Water body
90Bareland220Permanent ice and snow
100Snow/Ice250Filled value
101Snow
102Ice
120Cloud
Table 3. Merged classification system and its correspondence with the original classification system.
TypeGlobeLand30-2010FROM_GLC2015GLC_FCS30-2015
10 Cropland1011,13,14,1510,11,12,20
20 Forest2021,22,23,24,2550,60,62,70,80
30 Grassland3032,33130
40 Shrubland4041,42120,121,122
50 Wetland5051,52,53180
60 Water6060210
80 Artificial surface8080190
90 Bareland9090150,200
Table 4. Elevation grades.
Grade12345
Elevation (m)<200200–500500–10001000–2000>2000
Table 5. Area correlation coefficients between different products.
ProductGlobeLand30-2010 FROM_GLC2015GLC_FCS30-2015
GlobeLand30-20101.000.990.93
FROM_GLC20150.991.000.89
GLC_FCS30-20150.930.891.00
Table 6. Confusion matrix between FROM_GLC2015 and GlobeLand30-2010 (FROM_GLC2015 provides the reference data).
Reference Data
Evaluation dataType1020304050608090UA (%)
1063,765,33582,319,8446,118,72111512,239,8502,376,2963,453,69441,43339.78
20145,564,8811,373,581,26249,231,240510624,370,31914,443,1127,324,310102,27285.07
3044,575,022102,117,49116,319,96912,8361,889,0552,687,9422,468,20865,2089.59
407,100,84716,508,6902,417,365686266,216348,253459,57579770.00
50622,442841,257108,7389138,80579,01730,97610707.62
604,569,14213,144,409955,971481,504,8434,062,357261,072650416.58
8013,422,9304,631,981609,4481936110,888375,7853,470,854386115.34
9065,9051,705,58442,1240988627,66413,2661680.01
PA (%)22.8086.1321.533.150.4616.6519.850.07
OA (%)72.24
Kappa0.22
Note: 10: Cropland; 20: Forest; 30: Grassland; 40: Shrubland; 50: Wetland; 60: Water; 80: Artificial surface; 90: Bareland.
Table 7. Confusion matrix between FROM_GLC2015 and GLC_FCS30-2015 (FROM_GLC2015 provides the reference data).
Reference Data
Evaluation dataType1020304050608090UA (%)
10136,155,87417,841,0067289541,2721,792,536544,4466,761,4293,147,25881.63
20393,567,4211,186,613,850116,8012,788,98156,464,435975,7287,536,83822,571,82271.03
30115,951,87921,723,043641,586992,3415,185,234710,48211,035,48422,462,7830.36
4016,181,0776,198,06919,559125,2071,183,17844,0341,082,4503,192,5840.45
501,180,904289,290112018,980293,11492,95541,84674,18314.71
607,542,2404,372,74445,605150,3411,411,56812,313,442317,371183,70046.75
8010,098,892372,18727,29525,01695,18187,96112,771,650610,76253.02
90496,4091,116,04115,672587312,79011,733227,40753,5832.76
PA (%)19.9995.8173.332.700.4483.3132.110.10
OA (%)64.28
Kappa0.29
Note: 10: Cropland; 20: Forest; 30: Grassland; 40: Shrubland; 50: Wetland; 60: Water; 80: Artificial surface; 90: Bareland.
Table 8. Confusion matrix between GLC_FCS30-2015 and GlobeLand30-2010 (GLC_FCS30-2015 provides the reference data).
Reference Data
Evaluation dataType1020304050608090UA (%)
10191,298,294400,714,22333,572,49718,7197,580,6818,267,85710,263,784144,52329.35
2049,454,7911,117,265,05523,515,0606107,639,1408,253,5711,919,93951,03692.48
303483781,58683,371017123796318919.53
40320,1463,428,270552,875095,03273,60810,91320350.00
503,959,52829,880,6646,070,1361413,438,4852,595,123195,36515,38023.93
602,720,8716,033,115519,312251,009,8793,447,387118,337219924.89
8020,053,44510,881,4631,068,9830275,915817,5064,336,331253211.58
9012,011,53026,485,0649,972,7002642395,965827,048639,15110,8760.02
PA (%)68.3670.030.110.0044.1514.2024.804.76
OA (%)65.74
Kappa0.29
Note: 10: Cropland; 20: Forest; 30: Grassland; 40: Shrubland; 50: Wetland; 60: Water; 80: Artificial surface; 90: Bareland.
Table 9. GLC_FCS30-2015 confusion matrix.
Reference Data
Evaluation dataType1020304050608090UA (%)
1047596120721212617148.82
20145557642240382.96
300070000463.64
4081110050138.46
509140033160244.59
60500012600097.74
8024010001061373.61
902212105101624.24
PA (%)85.2883.214.466.8562.2660.1999.0714.55
OA (%)65.59
Kappa0.55
Note: 10: Cropland; 20: Forest; 30: Grassland; 40: Shrubland; 50: Wetland; 60: Water; 80: Artificial surface; 90: Bareland.
Table 10. GlobeLand30-2010 confusion matrix.
Reference Data
Evaluation dataType1020304050608090UA (%)
10335164260218171566.34
2014763373431613556456.72
303512366192202523.23
40000260000100.00
5054007140122.58
60411092281093.44
80140270284275.68
90000000000.00
PA (%)62.0495.0523.3818.3113.2154.4278.500.00
OA (%)61.65
Kappa0.49
Note: 10: Cropland; 20: Forest; 30: Grassland; 40: Shrubland; 50: Wetland; 60: Water; 80: Artificial surface; 90: Bareland.
Table 11. FROM_GLC2015 confusion matrix.
Reference Data
Evaluation dataType1020304050608090UA (%)
10182168401711375.52
201566427312729644958.15
3015166391940145117.85
406076310224.00
50000002000.00
6010210529611489.97
8051150012871052.41
90000000012100.00
PA (%)32.7396.2540.134.110.0068.5281.3110.81
OA (%)57.71
Kappa0.46
Note: 10: Cropland; 20: Forest; 30: Grassland; 40: Shrubland; 50: Wetland; 60: Water; 80: Artificial surface; 90: Bareland.

