Letter

Scale Impact of Soil Moisture Observations to Noah-MP Land Surface Model Simulations

1
ESSIC/CISESS, University of Maryland College Park, College Park, MD 20740, USA
2
NOAA NESDIS Center for Satellite Applications and Research, College Park, MD 20740, USA
*
Author to whom correspondence should be addressed.
Remote Sens. 2020, 12(7), 1169; https://doi.org/10.3390/rs12071169
Submission received: 28 February 2020 / Revised: 31 March 2020 / Accepted: 2 April 2020 / Published: 6 April 2020
(This article belongs to the Special Issue Satellite Hydrological Data Products and Their Applications)

Abstract

:
Due to the limitations of satellite antenna technology, current operational microwave soil moisture (SM) data products are typically at tens of kilometers spatial resolutions. Many approaches have thus been proposed to generate finer resolution SM data using ancillary information, but it is still unknown if assimilation of the finer spatial resolution SM data has beneficial impacts on model skills. In this paper, a synthetic experiment is thus conducted to identify the benefits of SM observations at a finer spatial resolution on the Noah-MP land surface model. Results of this study show that the performance of the Noah-MP model is significantly improved with the benefits of assimilating 1 km SM observations in comparison with the assimilation of SM data at coarser resolutions. Downscaling satellite microwave SM observations from coarse spatial resolution to 1 km resolution is recommended, and the assimilation of 1 km remotely sensed SM retrievals is suggested for NOAA National Weather Service and National Water Center.

Graphical Abstract

1. Introduction

Soil moisture (SM) is an important variable in coupled climate models and numerical weather prediction systems due to its impacts on land–atmosphere water, energy and carbon exchanges [1,2,3]. In situ observations reasonably track the SM status, but they are limited at local and even site scales [3]. The constraints of the traditional in situ observations can be compensated for by remote sensing technology that has shown the unique value of providing quantitative SM estimations at larger scales.
Optical and thermal infrared satellite SM sensing started in 1970, and several approaches were developed to exploit the relationships between surface reflectance and the SM [4,5,6]. However, these empirical relationships-based SM observations are significantly impacted by the soil spectral characteristics, and could not be obtained on cloudy days [7]. Microwave satellite technologies were thus developed to archive accurate SM retrievals [8,9,10]. However, active microwave radars are typically impacted by surface roughness and vegetation structure [11], and passive microwave-radiometers-based SM estimations are generally at tens of kilometers resolutions due to the limitations of satellite antenna technology [12,13,14].
Aiming to advance the use of microwave SM retrievals over local and regional scales, many downscaling approaches have been proposed to produce finer resolution satellite SM data [15,16,17,18,19]. Particularly, observations from other satellite sensors at finer spatial resolution are used as ancillary inputs to achieve accurate fine spatial resolution SM [20,21]. The feasibilities and notable advantages of the developed downscaling approaches have been evaluated with in situ observations. However, comprehensive assessments on the advantages and disadvantages of the finer resolution SM observations are hampered by the limitations of in situ sites’ spatial distributions, and the uncertainties from the scale discrepancy and quality of the ancillary observations. Considering the spatial inhomogeneity [22,23], the downscaled satellite soil moisture data may benefit from direct inter-comparisons over the original coarse spatial resolution observations. There are also lots of open scientific questions related to understanding the impacts of assimilating finer spatial resolution SM observations on model performance, model requirements for finer spatial resolution SM observations and the operational application of finer spatial resolution SM observations.
To address these questions, SM estimations at different spatial resolutions are synthetically generated in this paper, and the impacts of assimilating finer resolution SM observations on Noah-MP model skills are then examined. The Noah-MP [24] land surface model (LSM) is a component of the National Water Model (NWM) that provides 1-km spatial resolution streamflow predictions over the entire continental United States (CONUS). The goal of this study is to identify the needs of finer spatial resolution SM data in the sequential SM data assimilation system, and in turn to investigate the potential application of higher spatial resolution SM observations in the operational models.

2. Method

2.1. Noah-MP Land Surface Model

The Noah-MP LSM was developed to improve the Noah model that has been widely used in operational numerical weather prediction (NWP) and climate models. The Noah-MP model uses a separate vegetation canopy and multiple options for land–atmosphere interaction processes to accommodate numerous combinations of parameterization schemes for an ensemble representation of processes in nature [24]. It has been used in the WRF-Hydro model that is the core of the National Water Model (NWM) system. Similar to the Noah model, the Noah-MP also has four soil layers with thicknesses of 10, 30, 60, and 100 cm.
The Land Information System (LIS) is a software framework developed by the National Aeronautics and Space Administration (NASA). The LIS integrates the use of ground and satellite observations, along with the advanced LSMs and computing tools, to accurately characterize land surface states and fluxes [25]. LIS version 7.2 integrates the Noah-MP version 3.6 that has the same dynamic core with the Noah-MP model used in the operational WRF-Hydro model. Based on the LIS platform, the Noah-MP version 3.6 was employed to conduct the synthetic experiment in this paper.

2.2. Synthetic Experiment

A synthetic experiment is designed to evaluate the impacts of assimilating different spatial resolution SM data. Based on the Noah-MP model, the basic structure is [26]: (1) a control run (CTR) is conducted as a single realization to represent the “true” state of the Noah-MP model, using the optimal meteorological forcing data. (2) According to Table 1, the Noah-MP is driven by the perturbed meteorological forcing data and state variables, referred as open loop run (OLP). This indicates that the Noah-MP model runs without the benefits of data assimilation under suboptimal forcing and initialization conditions, with the assumption that a systematic error in model output between perturbed and unperturbed forcing and state conditions should not be caused by adding unbiased uncertainties in the ensemble Kalman Filter (EnKF) data assimilation system [27]. (3). In the data assimilation (DA) cases, synthetic observations at 1, 5, 12.5, 25 and 100 km spatial resolutions are assimilated into the OLP run using the EnKF. To inter-compare the Noah-MP model skills with the benefits of assimilating different resolution synthetic observations, the DA01km, DA05km, DA12km, DA25km and DA100km assimilate 1, 5, 12.5, 25 and 100 km synthetic observations, respectively. As the DA cases were also forced by the same sub-optimal forcing inputs and state variables as those used in the OLP run, the differences between the DA cases and the OLP run are good metrics to evaluate the impacts of data assimilation with. Given the same assimilation strategy and the same forcing data and state variables, the differences among the five DA cases should only come from assimilating different spatial resolution synthetic observations.
Before data assimilation, 1, 5, 12.5 and 100 km synthetic observations were all reprocessed as 25 km spatial resolution. Particularly, synthetic observations from 625 pixels at 1 km resolution, 25 pixels at 5 km resolution and four pixels at 12.5 km resolution were simply averaged into one 25 km resolution pixel. However, the synthetic observations of one pixel at 100 km resolution were used to fill the corresponding four pixels at 25 km resolution. These reprocessed 25 km synthetic observations were then bias-corrected to the CTR run-based 0–10 cm SM climatology using the CDF-matching method with CDFs built for each land grid over the study domain during the study period [28,29].
In this paper, the ensemble size for both of the OLP run and each of the five DA cases was set as 12, as that is the optimal ensemble size for a sequential SM data assimilation system [30]. The CTR run and the Noah-MP model under the ensemble condition were all spun up by cycling five times through the period from January 1st, 2015 to December 31st, 2018. All of them were then conducted over the same period with one hour time step inputs and daily outputs. The daily bias-corrected synthetic observations were assimilated into the Noah-MP model at 00:00Z with updating 0-10 cm SM initialization. All simulations in this paper were forced by precipitation, near-surface air temperature, near-surface wind, downward shortwave/longwave radiation and surface pressure from the Global Data Assimilation System product [31]. Both of the CTR and OLP runs were conducted at 25 km spatial resolution, and all simulations were conducted over a study area from 25° N, 125° W to 50° N, 75° W that was basically a gridded CONUS domain.

2.3. Ensemble Kalman Filter
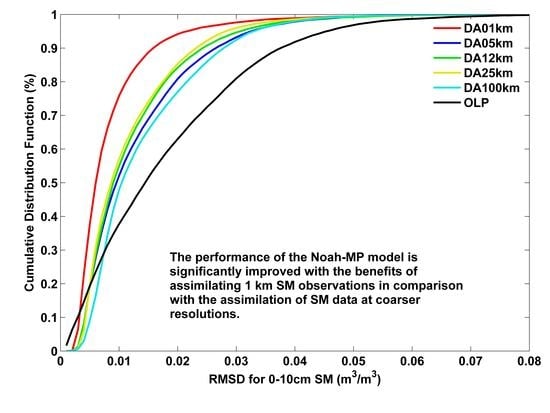
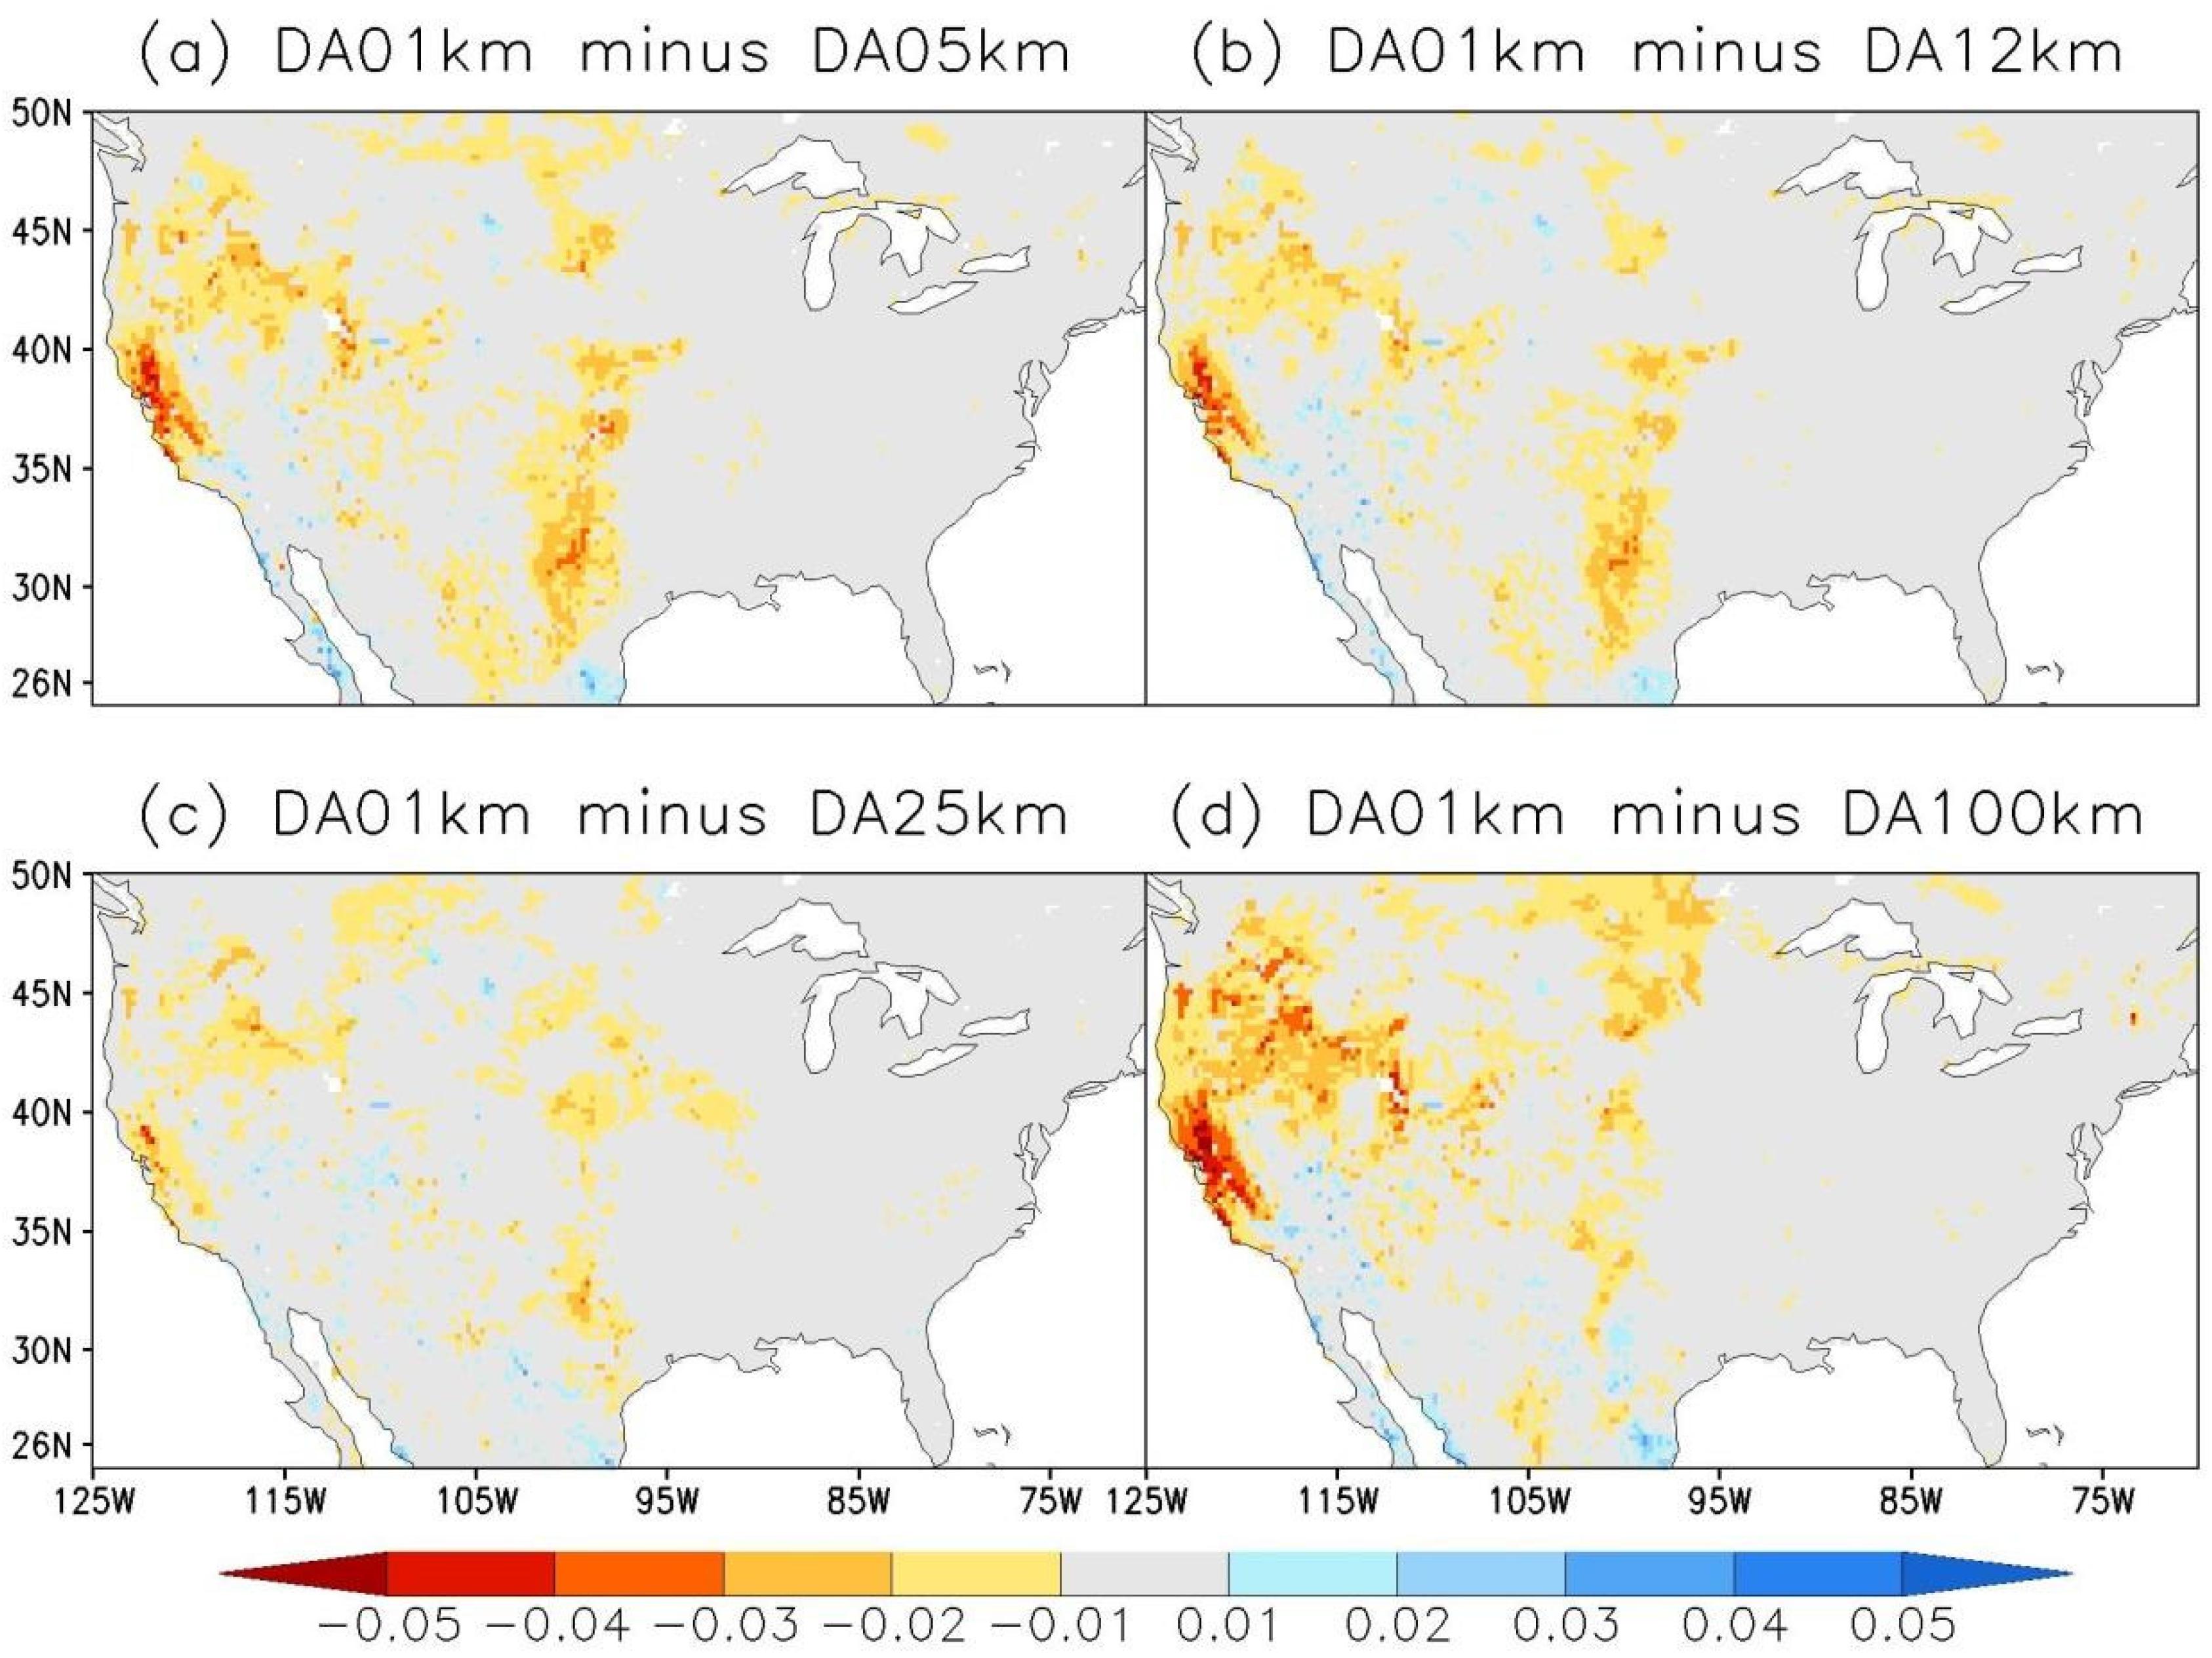
The EnKF has been widely applied in sequential SM data assimilation [30,33]. Given an ensemble of model variable state vectors, the EnKF updates an ensemble forecast step using a Monte Carlo approximation [33]. Based on the perturbed forcing data, state variables and model parameters, the model states (Y) for each ensemble member propagated forward in the forecast step as
Y t + = Y t + K ( M t H Y t )
where the Kalman gain matrix K is given by
K = μ Y t H t T H t μ Y t H t T + μ M t
The matrix M is the observation vector, and the matrix H replies on the observations. The error variance μ Y t was set as a constant value 3% as LIS examples [26].

3. Results

Assuming the CTR run represents the “true” state of the Noah-MP land surface model, Figure 1 documents differences in root mean square differences (RMSDs) for SM simulations in 0-10 cm soil layer during the 2015 to 2018 period. The red color shading indicates that the DA01km performs better than each of the four coarser resolution DA cases, including DA05km, DA12km, DA25km and DA100km, yet the blue color shading means that DA01km shows modest performance. The inter-comparison results present similar patterns with DA01km case, showing significant improvements in 0-10cm SM estimations in the CONUS mid-west areas. Specifically, relative to the DA100km case, the DA01km case exhibits the great improvements as larger than 0.02 m3/m3 in the west CONUS in Figure 1d; whereas the insignificant differences in grey color cover the rest study areas.
Propagating surface information to a deeper soil layer primarily relies on the inherent surface-deeper connection of the LSM. The behaviors of SM simulations for surface soil layer in Figure 1 are well mirrored in the 40–100 cm SM simulations (Figure 2). Specifically, more remarkable RMSD differences can be seen in Figure 2 with the assumption that the CTR run simulations are the “true” state. With regards to mid-west CONUS, DA01km demonstrates a more robust agreement with the CTR run simulations, with significantly reducing RMSD values over each of the four coarser resolution DA cases. With the benefits of assimilating 1 km SM data, improvements on the Noah-MP SM estimations in 40–100 cm soil layer reach to 0.05 m3/m3. However, slight degradations caused by the DA01km case scatter in the southwest and south CONUS.
With respect to the CTR run, Figure 3 exhibits the study domain-averaged probability density function (PDF) as a function of RMSD during the 2015 to 2018 period for 0–10 cm SM, 40–100 cm SM, 0–10 cm soil temperature (ST) and 40–100 cm ST estimations. The statistical distribution function of frequency probability shifting toward the left indicates improvement with raising the probability of lower RMSD values, whereas curves shifting toward the right mean degradations. Relative to the OLP run, the DA01km case shows clear improvements in SM estimations, and 40–100 cm ST simulations with significant increase in the probability of lower RMSDs; yet degradations caused by the DA01km case are found in Figure 3c. Compared to each of the four coarser-resolution DA cases, DA01km is successful in enhancing Noah-MP LSM skills of estimating SM and ST for both 0–10 cm and 40–100 cm soil layers.
Specifically, compared to the OLP run, the study domain-averaged RSMDs for SM simulations in the surface soil layer are significantly reduced by 0.0017 m3/m3 (18.5% reduction) by the DA01km case. Meanwhile, relative to the DA05km, DA12km, DA25km and DA100km cases, the study domain-averaged RSMDs for 0–10 cm SM simulations are significantly reduced by 0.0028 m3/m3 (29.9% reduction), 0.0024 m3/m3 (26.2% reduction), 0.0022 m3/m3 (23.6% reduction), 0.0036 m3/m3 (38.1% reduction) by the DA01km case, respectively. The positive information in the surface soil layer is well propagated to the deeper soil layer. With the benefits of assimilating 1 km SM synthetic data, the study domain-averaged RSMD values for 40–100 cm SM estimations are remarkably decreased by 0.0095 m3/m3 (113.3%), 0.0045 m3/m3 (53.6%), 0.0038 m3/m3 (44.7%), 0.0033 m3/m3 (38.7%) and 0.0056 m3/m3 (66.3%) in comparison with the OLP run, DA05km, DA12km, DA25km and DA100km, respectively.
Compared to the OLP run, however, the study domain-averaged RSMD value for soil temperature is increased 0.16K (12.5 % increase) by the DA01km case. The DA01km case performs modestly over the OLP run, but it takes the best performance in the five DA cases. Relative to the DA05km, DA12km, DA25km and DA100km cases, the study domain-averaged RSMDs for 0-10 cm ST simulations are significantly reduced by 0.15 K (19.1% reduction), 0.14 K (17.9% reduction), 0.10 K (12.8% reduction) and 0.14 K (17.9% reduction), respectively. More remarkable improvements with the benefits of 1 km SM data assimilation are found for 40-100 cm ST simulations. With respect to the CTR run, the study domain-averaged RSMDs are dramatically decreased by 0.62K (82.7%), 0.69K (92.1%), 0.66K (88.8%), 0.47K (82.6%) and 0.61K (82.7%) in comparison with the OLP run, DA05km, DA12km, DA25km and DA100km, respectively. The strong four-year (over 2015-2018 period) consistency of results in Figure 3 indicates that the inter-comparisons in this paper are qualitatively stable and thus likely representative of a longer analysis period.

4. Discussions and Summary

A synthetic experiment was conducted in this paper to investigate the potential impacts of assimilating finer spatial resolution SM data on Noah-MP land surface model performances. The results here demonstrate: (1) With the benefits of assimilating 1 km SM data, Noah-MP model-based SM and ST simulations are significantly improved in comparison with the assimilation of coarser spatial resolution SM data. (2) The LSM used in this paper is the Noah-MP3.6 model, but similar results can be obtained in other LSMs-based SM data assimilation systems due to the foundation of the results here serving as a general synthetic experiment. (3) LSMs are the components of most numerical weather prediction (NWP) and climate models. Given the better performances of SM and ST simulations, it is expected to improve NWP and climate model skills, with the benefits of assimilating 1 km SM observations through their positive impacts on the exchange estimations of water and energy between land surface and atmosphere. (4) LSM outputs such as SM are also critical variables in drought and flood monitoring. In terms of the significant improvements in LSM skills, the capabilities of drought/flood monitoring can be ideally enhanced with the benefits of 1 km SM data assimilation.
Rather than simply asserting that assimilating finer spatial resolution SM data leads to a better performance, it should be noted that the differences among the DA05km, DA12km, DA25km and DA100km cases are relatively small in comparison with the dramatic improvements from the benefits of the DA01km case. This means that downscaling SM observations from coarser spatial resolution to 5 km may not exhibit significant improvements on LSM performance, as expected. Yet, downscaling satellite SM retrievals from coarser spatial resolution to 1 km can ideally enhance LSM skills (Figure 1, Figure 2 and Figure 3).
This synthetic experiment was designed based on a 25 km SM data assimilation system. The land surface variables (for instance: land cover, surface albedo and vegetation index) used in the CTR run, OLP run and DA25 km case were all regridded from 1 to 25 km spatial resolution to satisfy the requirements of the data assimilation system. Although the Noah-MP3.6 model for each case is forced by the same meteorological forcing data, the OLP run and the DA25km are benefited by the same spatial resolution (25 km) land surface variables with the assumption of the 25 km CTR run representing the “truth”, which may result in the performances of the OLP run and DA25km being overestimated in this paper.
In summary, the assimilation of 1 km spatial resolution SM data has a better capacity to improve Noah-MP model performance than the assimilation of any other spatial resolution SM data tested. With respect to the CTR run simulations, the Noah-MP model with the benefits of assimilating 1 km SM data sets is more successful in estimating SM and soil temperature (ST) for both 0–10 cm and 40–100 cm soil layers, reducing the probability of greater RMSD values in comparison with the coarse SM DA cases. Based on this result, downscaling microwave satellite SM observations from coarser spatial resolution to 1 km resolution is recommended, and the assimilation of 1 km remotely sensed SM retrievals is suggested for NOAA National Weather Service and National Water Center.

Author Contributions

J.Y. and X.Z. designed the research and wrote the paper. Both authors reviewed and edited the manuscript. All authors have read and agreed to the published version of the manuscript.

Funding

This work was jointly supported by NOAA’s Climate Program Office’s Modeling, Analysis, Predictions and NOAA JPSS Proving Ground and Risk Reduction (PGRR) Program.

Acknowledgments

We are also grateful to the anonymous reviewers for helping to significantly improve the quality of the manuscript. The manuscript contents are solely the opinions of the authors and do not constitute a statement of policy, decision, or position on behalf of NOAA or the U. S. Government.

Conflicts of Interest

The authors declare that they have no known competing financial interests or personal relationships that could have appeared to influence the work reported in this paper.

References

  1. Koster, R.D.; Dirmeyer, P.A.; Guo, Z.; Bonan, G.; Chan, E.; Cox, P.; Gordon, C.T.; Kanae, S.; Kowalczyk, E.; Lawrence, D.; et al. Regions of strong coupling between soil moisture and precipitation. Science 2004, 305, 1138–1140. [Google Scholar] [CrossRef] [PubMed] [Green Version]
  2. Yin, J.; Zhan, X.; Zheng, Y.; Liu, J.; Hain, C.R.; Fang, L. Impact of quality control of satellite soil moisture data on their assimilation into land surface model. Geophys. Res. Lett. 2014, 41, 7159–7166. [Google Scholar] [CrossRef]
  3. Yin, J.; Zhan, X.; Liu, J.; Schull, M. An intercomparison of Noah model skills with benefits of assimilating SMOPS blended and individual soil moisture retrievals. Water Resour. Res. 2019, 55, 2572–2592. [Google Scholar] [CrossRef]
  4. Bowers, S.; Smith, S. Spectrophotometric determination of soil water content. Soil Sci. Soc. Am. J. 1972, 36, 978–980. [Google Scholar] [CrossRef]
  5. Dalal, R.; Henry, R. Simultaneous determination of moisture, organic carbon, and total nitrogen by near infrared reflectance spectrophotometry. Soil Sci. Soc. Am. J. 1986, 50, 120–123. [Google Scholar] [CrossRef]
  6. Carlson, T.N.; Gillies, R.R.; Perry, E.M. A method to make use of thermal infrared temperature and NDVI measurements to infer surface soil water content and fractional vegetation cover. Remote Sens. Rev. 1994, 9, 161–173. [Google Scholar] [CrossRef]
  7. Srivastava, P.K. Satellite soil moisture: Review of theory and applications in water resources. Water Resour. Manag. 2017, 31, 3161–3176. [Google Scholar] [CrossRef]
  8. Wang, J.R.; Engman, E.T.; Mo, T.; Schmugge, T.J.; Shiue, J.C. The effects of soil moisture, surface roughness, and vegetation on L-Band emissions and backscatter. IEEE Trans. Geosci. Remote Sens. 1987, 25, 825–833. [Google Scholar] [CrossRef]
  9. Jackson, T.J.; Schmugge, T.J. Passive microwave remote sensing system for soil moisture: Some supporting research. IEEE Trans. Geosci. Remote Sens. 1989, 27, 225–235. [Google Scholar] [CrossRef]
  10. Jackson, T.J.; O’Neill, P.E. Attenuation of soil microwave emission by corn and soybeans at 1.4 and 5 GHz. IEEE Trans. Geosci. Remote Sens. 1990, 28, 978–980. [Google Scholar] [CrossRef] [Green Version]
  11. Wagner, W.; Hahn, S.; Kidd, R.; Melzer, T.; Bartalis, Z.; Hasenauer, S.; Julia, F.-S.; Patricia, D.R.; Alexander, J.; Stefan, S.; et al. The ASCAT soil moisture product: A review of its specifications, validation results, and merging applications. Meteorol. Z. 2013, 22, 5–33. [Google Scholar] [CrossRef] [Green Version]
  12. Njoku, E.G.; Jackson, T.J.; Lakshmi, V.; Chan, T.K.; Nghiem, S.V. Soil moisture retrieval from AMSR-E. IEEE Trans. Geosci. Remote Sens. 2003, 41, 215–229. [Google Scholar] [CrossRef]
  13. Kerr, Y.H.; Waldteufel, P.; Wigneron, J.-P.; Delwart, S.; Cabot, F.; Boutin, J.; Escorihuela, M.-J.; Font, J.; Reul, N.; Gruhier, C.; et al. The SMOS mission: New tool for monitoring key elements of the globalwater cycle. Proc. IEEE 2010, 98, 666–687. [Google Scholar] [CrossRef] [Green Version]
  14. Entekhabi, D.; Njoku, E.G.; O’Neill, P.E.; Kellogg, K.H.; Crow, W.T.; Edelstein, W.N.; Entin, J.K.; Goodman, S.D.; Jackson, T.J.; Johnson, J.; et al. The Soil Moisture Active Passive (SMAP) Mission. Proc. IEEE 2010, 98, 704–716. [Google Scholar] [CrossRef]
  15. Merlin, O.; Chehbouni, G.; Kerr, Y.; Goodrich, D. A downscaling method for distributing surface soil moisture within a microwave pixel: Application to the Monsoon’90 data. Remote Sens. Environ. 2006, 101, 379–389. [Google Scholar] [CrossRef]
  16. Merlin, O.; Chehbouni, G.; Walker, J.P.; Panciera, R.; Kerr, Y. A simple method to disaggregate passive microwave based soil moisture. IEEE Trans. Geosci. Remote Sens. 2008, 46, 786–796. [Google Scholar] [CrossRef] [Green Version]
  17. Narayan, U.; Lakshmi, V.; Jackson, T.H. High-resolution change estimation of soil moisture using L-band radiometer and radar observations made during the SMEX02 experiments. IEEE Trans. Geosci. Remote Sens. 2006, 44, 1545–1554. [Google Scholar] [CrossRef]
  18. Zhan, X.; Houser, P.R.; Walker, J.P.; Crow, W. A method for retrieving high resolution soil moisture from Hydros L-Band radiometer and radar observations. IEEE Trans. Geosci. Remote Sens. 2006, 44, 1534–1544. [Google Scholar] [CrossRef]
  19. Entekhabi, D.; Das, N.; Njoku, E.; Yueh, S.; Johnson, J.; Shi, J. Algorithm Theoretical Basis Document L2 & L3 Radar/Radiometer Soil Moisture (Active/Passive) Data Products; Revision A; JPL, California Institute of Technology: Pasadena, CA, USA, 2014.
  20. Kim, J.; Hogue, T.S. Improving spatial soil moisture representation through integration of AMSR-E and MODIS products. IEEE Trans. Geosci. Remote Sens. 2012, 50, 446–460. [Google Scholar] [CrossRef]
  21. Peng, J.; Loew, A.; Zhang, S.; Wang, J.; Niesel, J. Spatial downscaling of satellite soil moisture data using a vegetation temperature condition index. IEEE Trans. Geosci. Remote Sens. 2016, 54, 558–566. [Google Scholar] [CrossRef]
  22. Crow, W.T.; Berg, A.A.; Cosh, M.H.; Loew, A.; Mohanty, B.P.; Panciera, R.; de Rosnay, P.; Ryu, D.; Walker, J.P. Upscaling sparse ground-based soil moisture observations for the validation of coarse-resolution satellite soil moisture products. Rev. Geophys. 2012, 50, RG2002. [Google Scholar] [CrossRef] [Green Version]
  23. Su, C.-H.; Ryu, D.; Dorigo, W.; Zwieback, S.; Gruber, A.; Albergel, C.; Reichle, R.H.; Wagner, W. Homogeneity of a global multisatellite soil moisture climate data record. Geophys. Res. Lett. 2016, 43, 11245–11252. [Google Scholar] [CrossRef] [Green Version]
  24. Niu, G.-Y.; Yang, Z.-L.; Mitchell, K.E.; Chen, F.; Ek, M.B.; Barlage, M.; Kumar, A.; Manning, K.; Niyogi, D.; Rosero, E.; et al. The community Noah land surface model with multiparameterization options (Noah-MP): 1. Model description and evaluation with local-scale measurements. J. Geophys. Res. 2011, 116, D12109. [Google Scholar] [CrossRef] [Green Version]
  25. Kumar, S.V.; Peters-Lidard, L.; Tian, Y.; Reichle, R.; Geiger, J.; Alonge, C.; Eylander, J.; Houser, P. An integrated hydrologic modeling and data assimilation framework. Computer 2018, 41, 52–59. [Google Scholar] [CrossRef]
  26. Kumar, S.V.; Reichle, R.H.; Koster, R.D.; Crow, W.T.; Peters-Lidard, C.D. Role of subsurface physics in the assimilation of surface soil moisture observations. J. Hydrometeor. 2009, 10, 1534–1547. [Google Scholar] [CrossRef]
  27. Ryu, D.; Crow, W.T.; Zhan, X.; Jackson, T.J. Correcting unintended perturbation biases in hydrologic data assimilation. J. Hydrometeor. 2009, 10, 734–750. [Google Scholar] [CrossRef]
  28. Reichle, R.H.; Koster, R.D. Bias reduction in short records of satellite soil moisture. Geophys. Res. Lett. 2004, 31, L19501. [Google Scholar] [CrossRef] [Green Version]
  29. Yin, J.; Zhan, X. Impact of bias-correction methods on effectiveness of assimilating SMAP soil moisture data into NCEP global forecast system using the ensemble kalman filter. IEEE Geosci. Remote Sens. Lett. 2018, 15, 659–663. [Google Scholar] [CrossRef]
  30. Yin, J.; Zhan, X.; Zheng, Y.; Hain, C.; Liu, J.; Fang, L. Optimal ensemble size of Ensemble Kalman Filter in sequential soil moisture data assimilation of land surface model. Geophys. Res. Lett. 2015, 42, 6710–6715. [Google Scholar]
  31. Rodell, M.; Houser, P.R.; Jambor, U.; Gottschalck, J.; Mitchell, K.; Meng, C.-J.; Arsenault, K.; Cosgrove, B.; Radakovich, J.; Bosilovich, M.; et al. The global land data assimilation system. Bull. Am. Meteor Soc. 2004, 85, 381–394. [Google Scholar] [CrossRef] [Green Version]
  32. Peters-Lidard, C.D.; Mocko, D.M.; Garcia, M.; Santanello, J.A.; Tischler, M.A.; Moran, M.S.; Wu, Y. Role of precipitation uncertainty in the estimation of hydrologic soil properties using remotely sensed soil moisture in a semi-arid environment. Water Resour. Res. 2008, 44, W05S18. [Google Scholar] [CrossRef] [Green Version]
  33. Evensen, G. Sequential data assimilation with a nonlinear quasi-geostrophic model using Monte Carlo methods to forecast error statistics. J. Geophys. Res. 1994, 99, 10143–10162. [Google Scholar] [CrossRef]
Figure 1. Differences in control run (CTR) run-based root mean square differences (RMSDs) for 0–10 cm soil moisture (SM) simulations during 2015 to 2018 period: (a) DA01km Minus DA05km, (b) DA01km Minus DA12km, (c) DA01km Minus DA25km, and (d) DA01km Minus DA100km. The red (blue) color indicates DA01km case performs better (worse), while grey color means insignificant.
Remotesensing 12 01169 g001
Figure 2. Differences in CTR run-based root mean square differences (RMSDs) for 40–100 cm soil moisture (SM) simulations during 2015 to 2018 period: (a) DA01km Minus DA05km, (b) DA01km Minus DA12km, (c) DA01km Minus DA25km, and (d) DA01km Minus DA100km. The red (blue) color indicates DA01km case performs better (worse), while grey color means insignificant.
Remotesensing 12 01169 g002
Figure 3. With respect to the CTR run, the study domain-averaged probability density function (PDF) as a function of RMSD during 2015 to 2018 period for: (a) 0–10 cm soil moisture (SM), (b) 40–100 cm SM, (c) 0–10 cm soil temperature (ST), and 40–100 cm ST over 2015–2018 period, and (d) 40–100 cm ST over 2015–2018 period.
Remotesensing 12 01169 g003
Table 1. Perturbations for state parameters and meteorological forcing variables [26,32]. The abbreviations SW and LW indicate short and long wave radiation. SD is standard deviation. The SM1, SM2, SM3, SM4 are 0–10 cm, 10–40 cm, 40–100 cm and 100–200 cm soil moisture.
Perturbation TypeSDCross Correlation for Forcing Variable Perturbations
PrecipitationSWLW
Precipitation0.5 (mm)1.0−0.80.5
SW0.3 (Wm−2)−0.81.0−0.5
LW50 (Wm−2)0.5−0.51.0
Cross Correlation for State Variable Perturbations
Perturbation typeSDSM1SM2SM3SM4
SM1 (0–10 cm)6.00 × 10⁻³ m3m−31.00.60.40.2
SM2 (10–40 cm)1.10 × 10⁻⁴ m3m−30.61.00.60.4
SM3 (40–100 cm)6.00 × 10⁻⁵ m3m−30.40.61.00.6
SM4 (100–200 cm)4.00 × 10⁻⁵ m3m−30.20.40.61.0

