Synergy between Ocean Variables: Remotely Sensed Surface Temperature and Chlorophyll Concentration Coherence


Abstract
1. Introduction
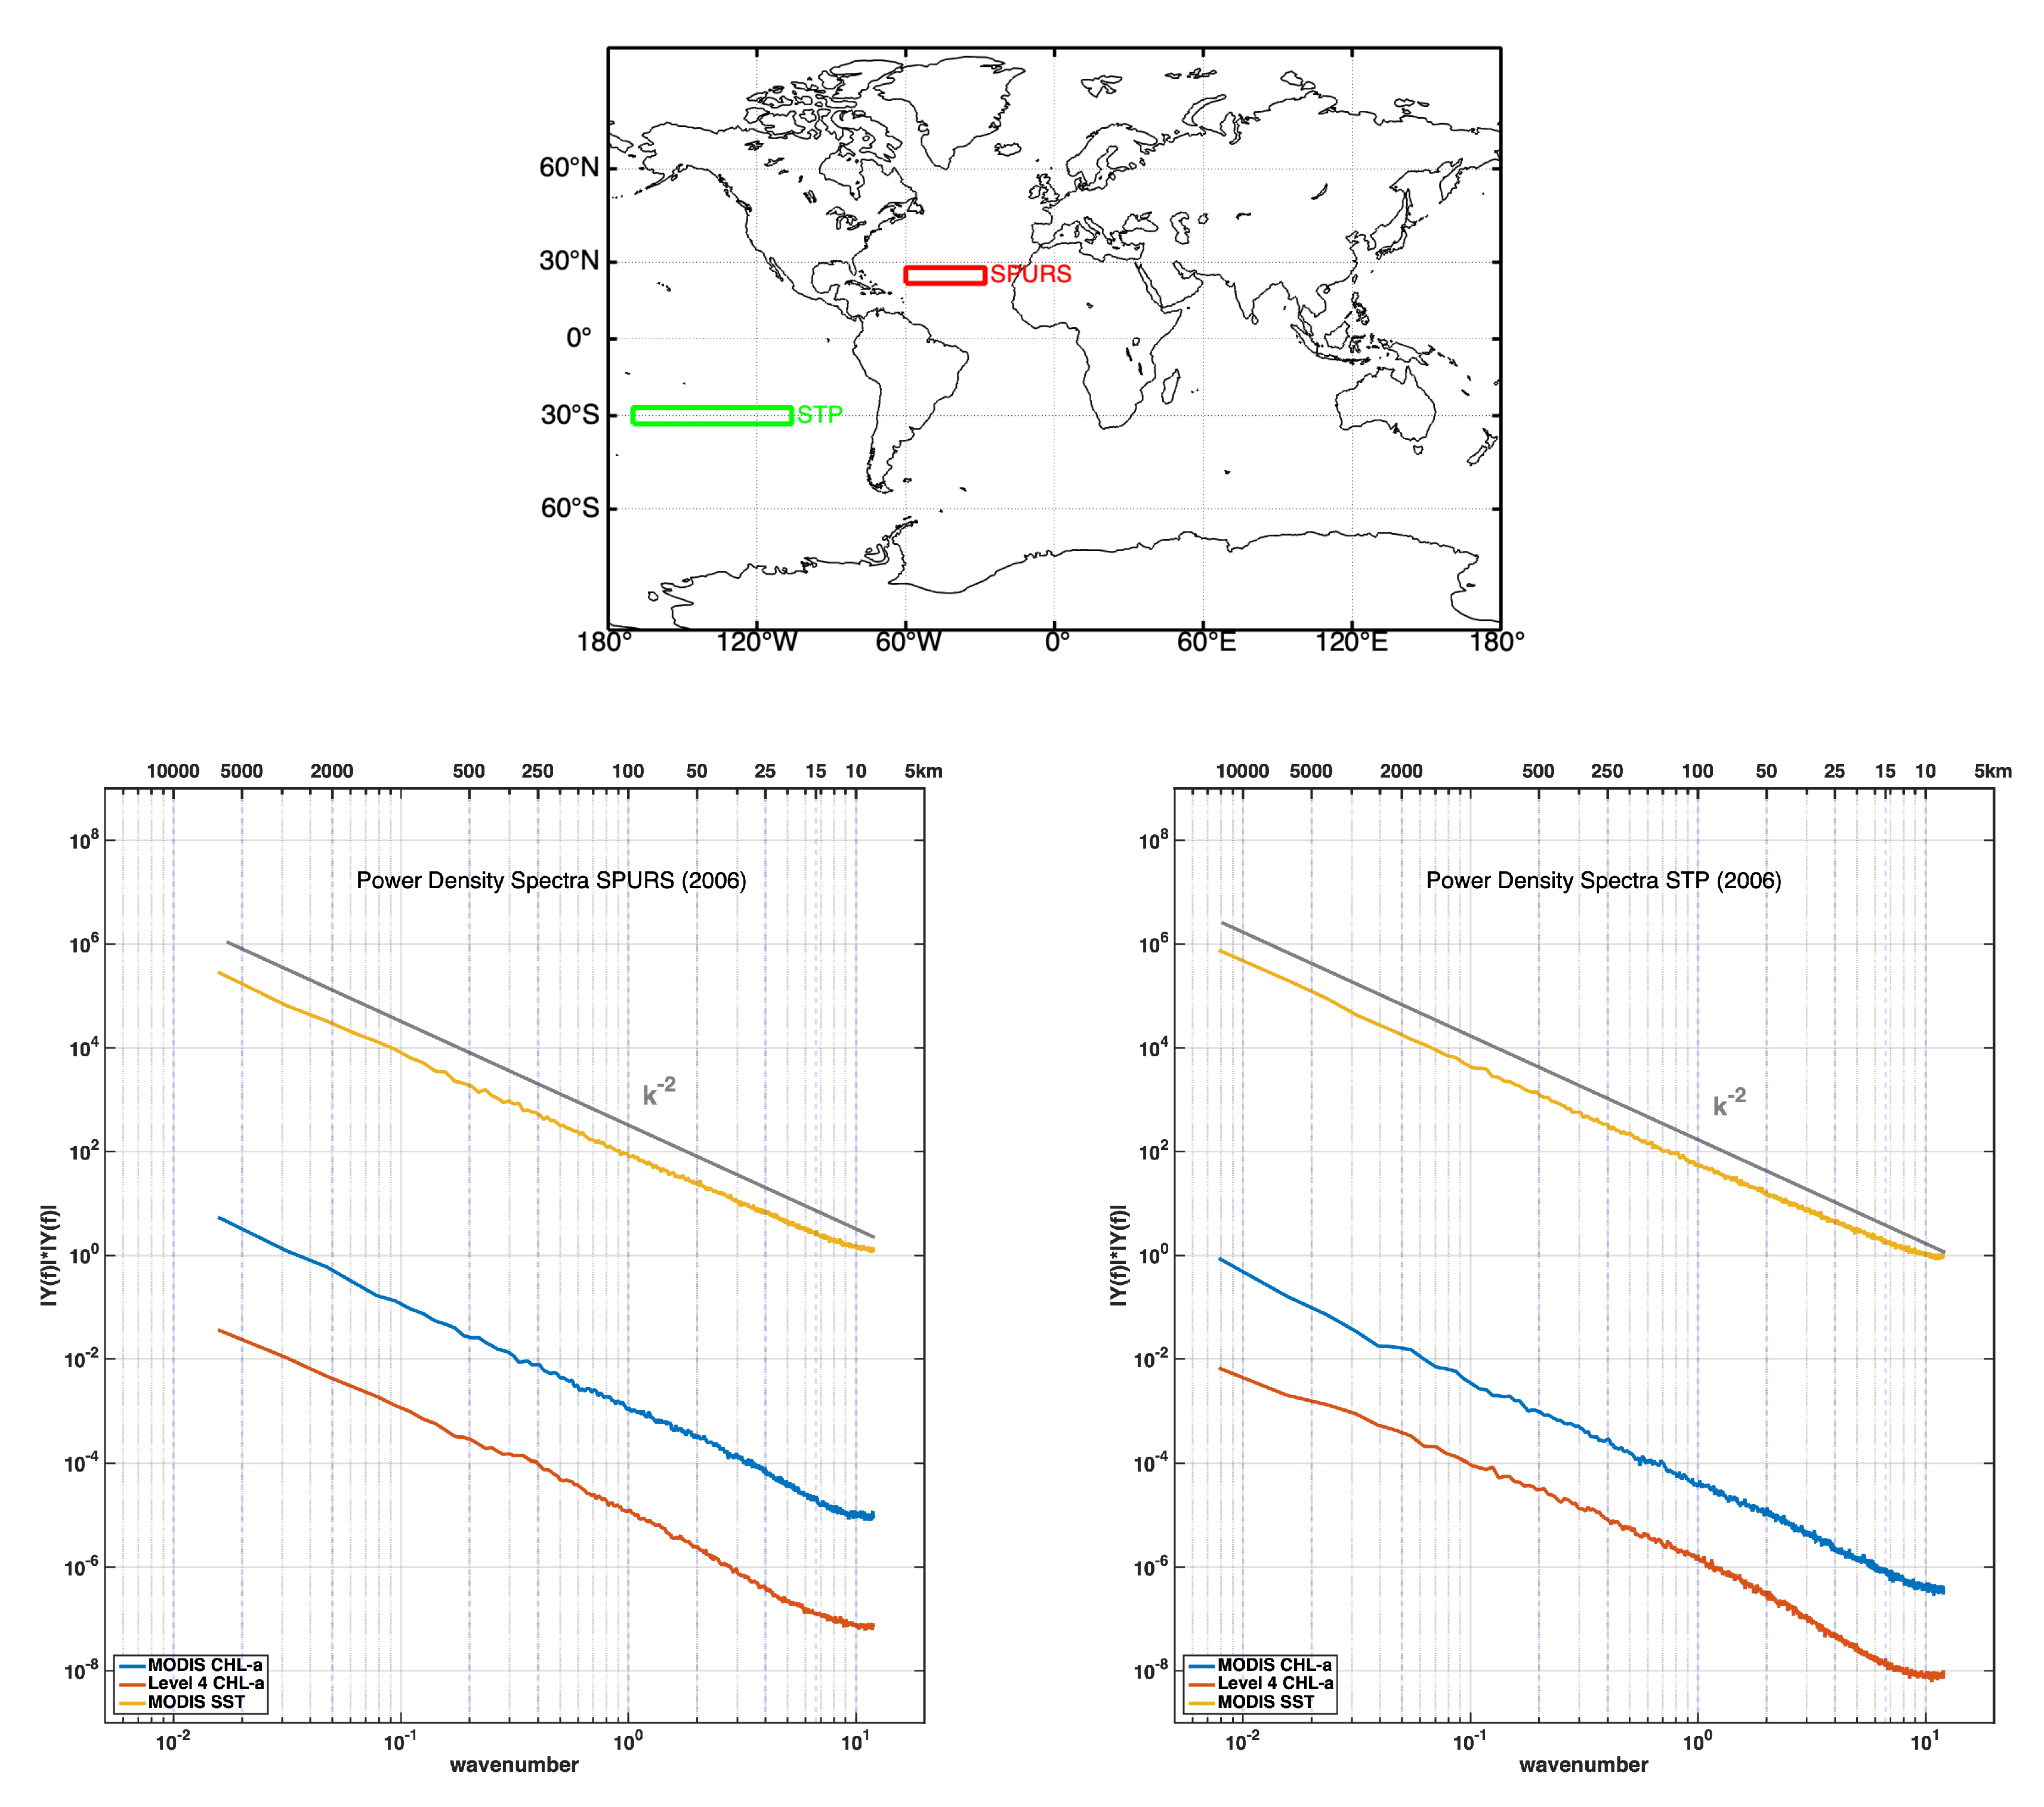
2. Satellite Data
3. Method
3.1. Singularity Analysis
3.2. Fusion Method
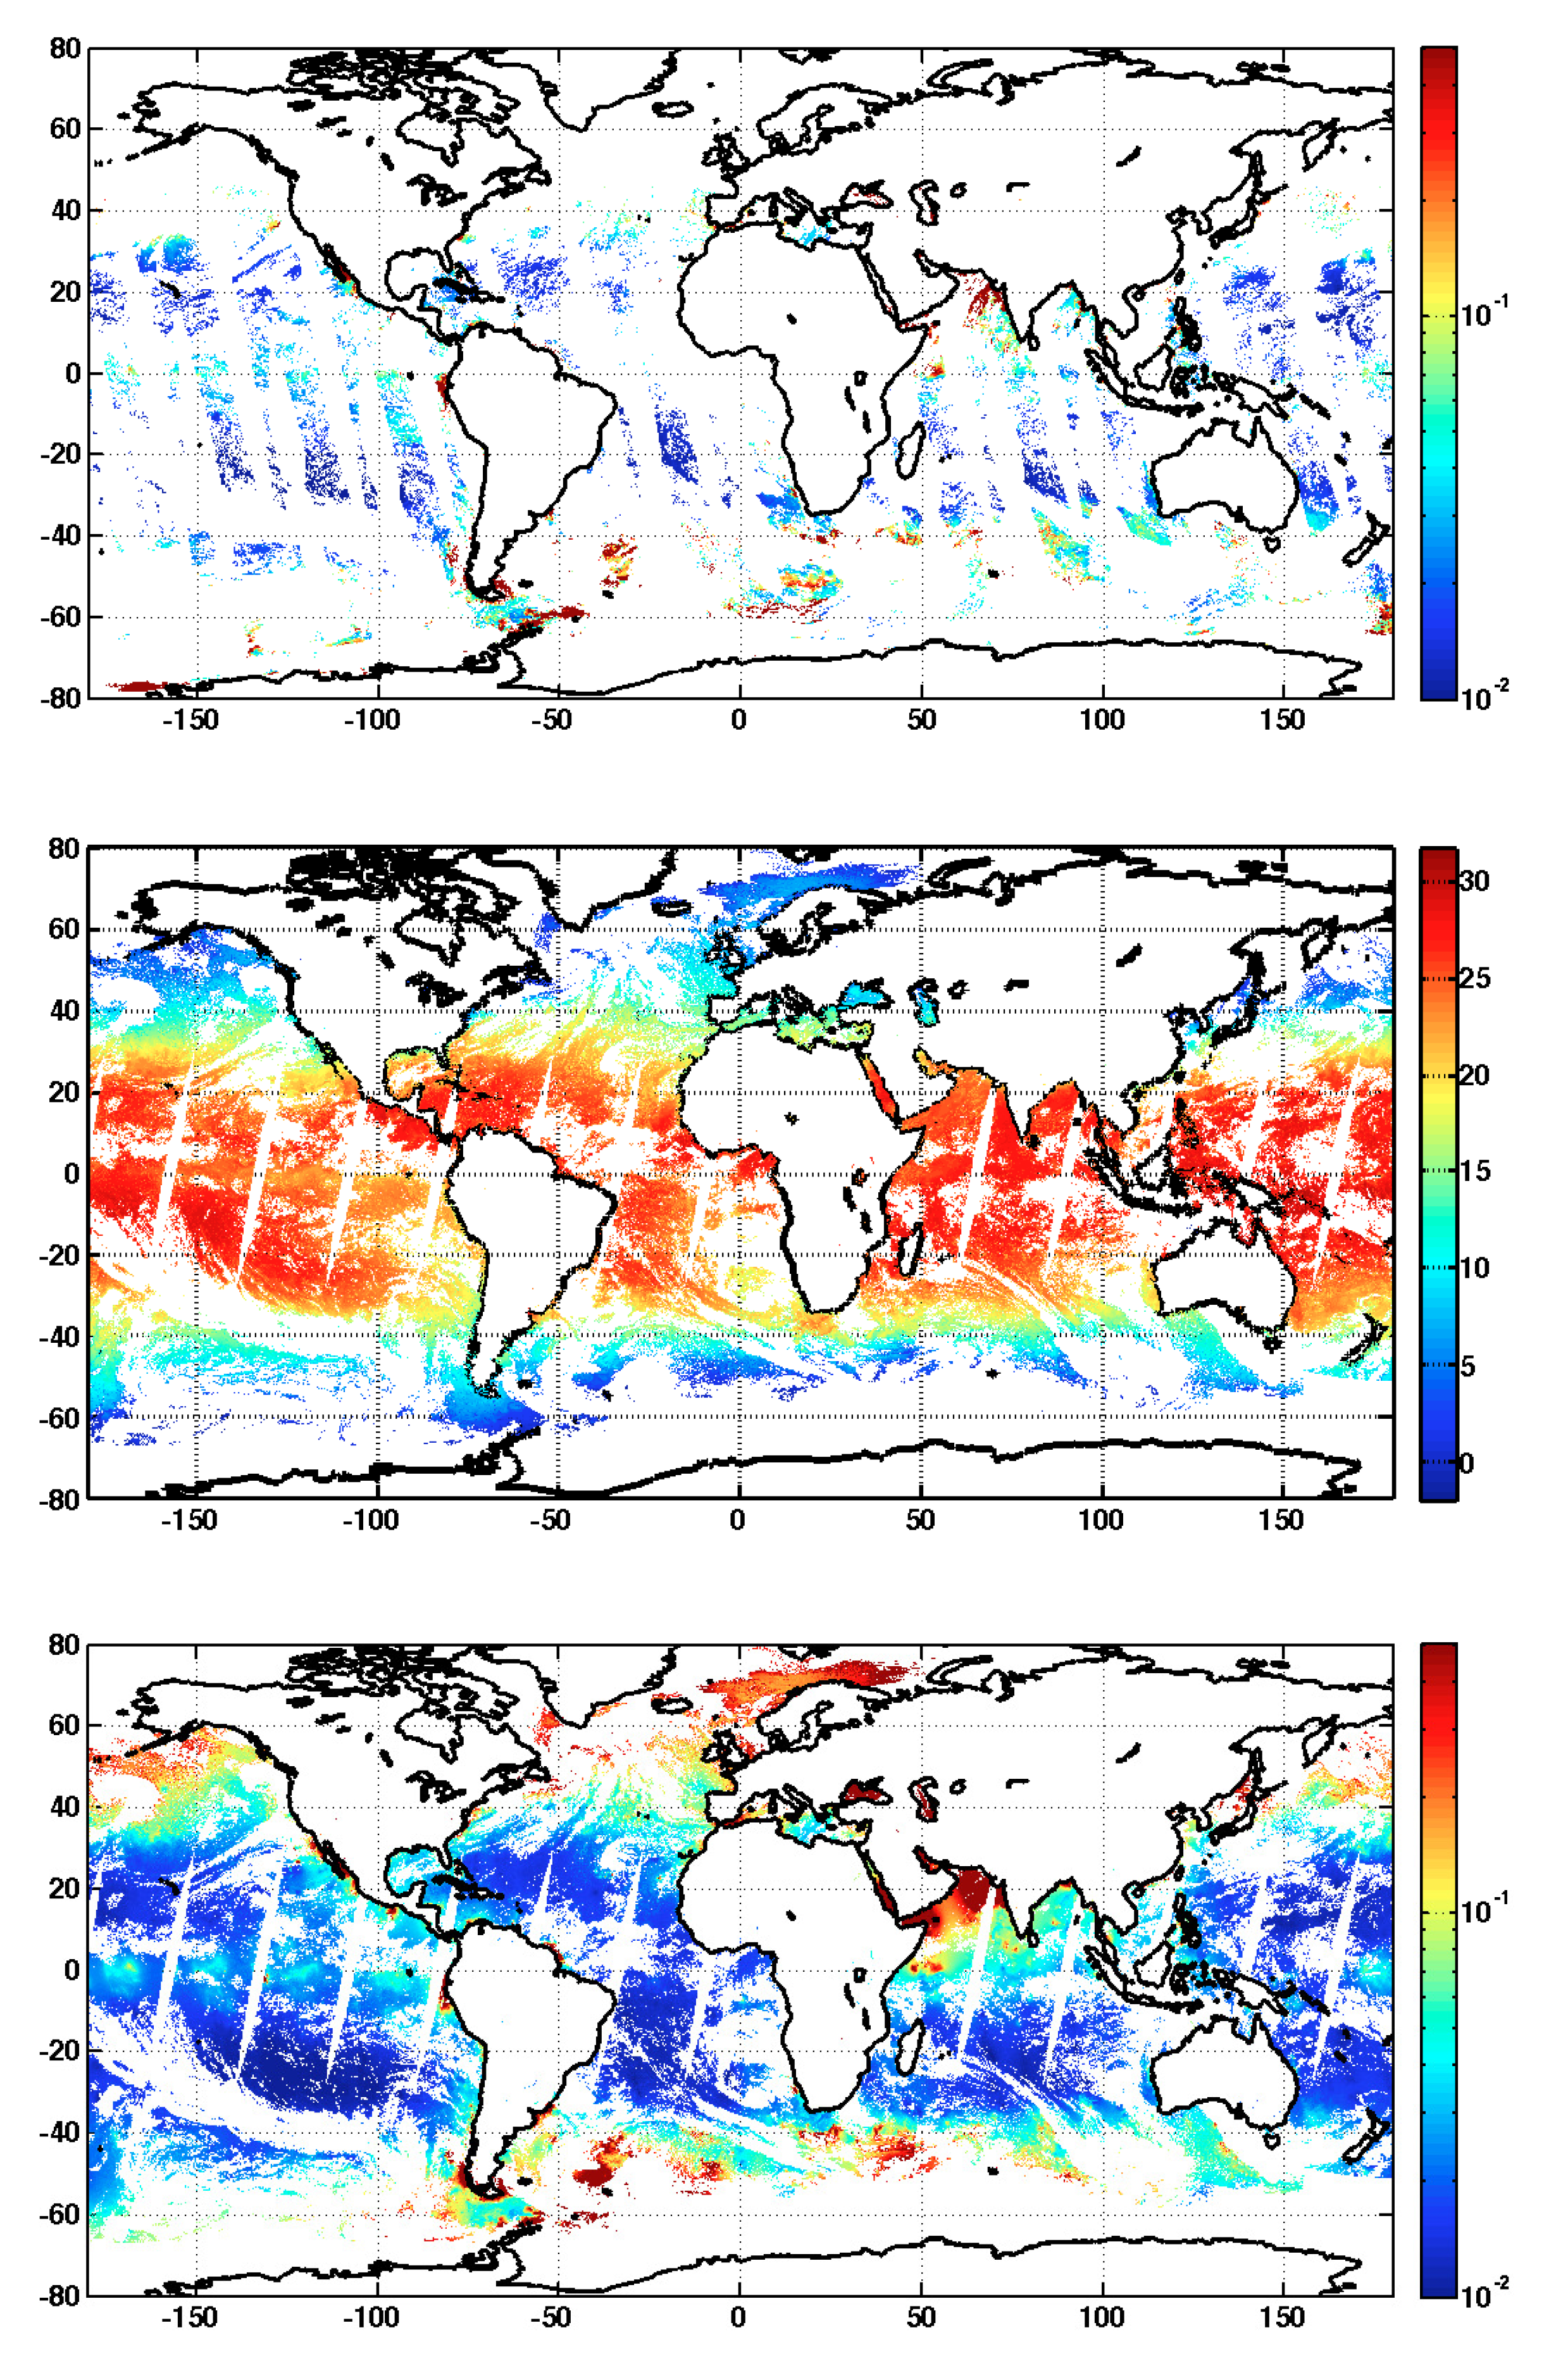
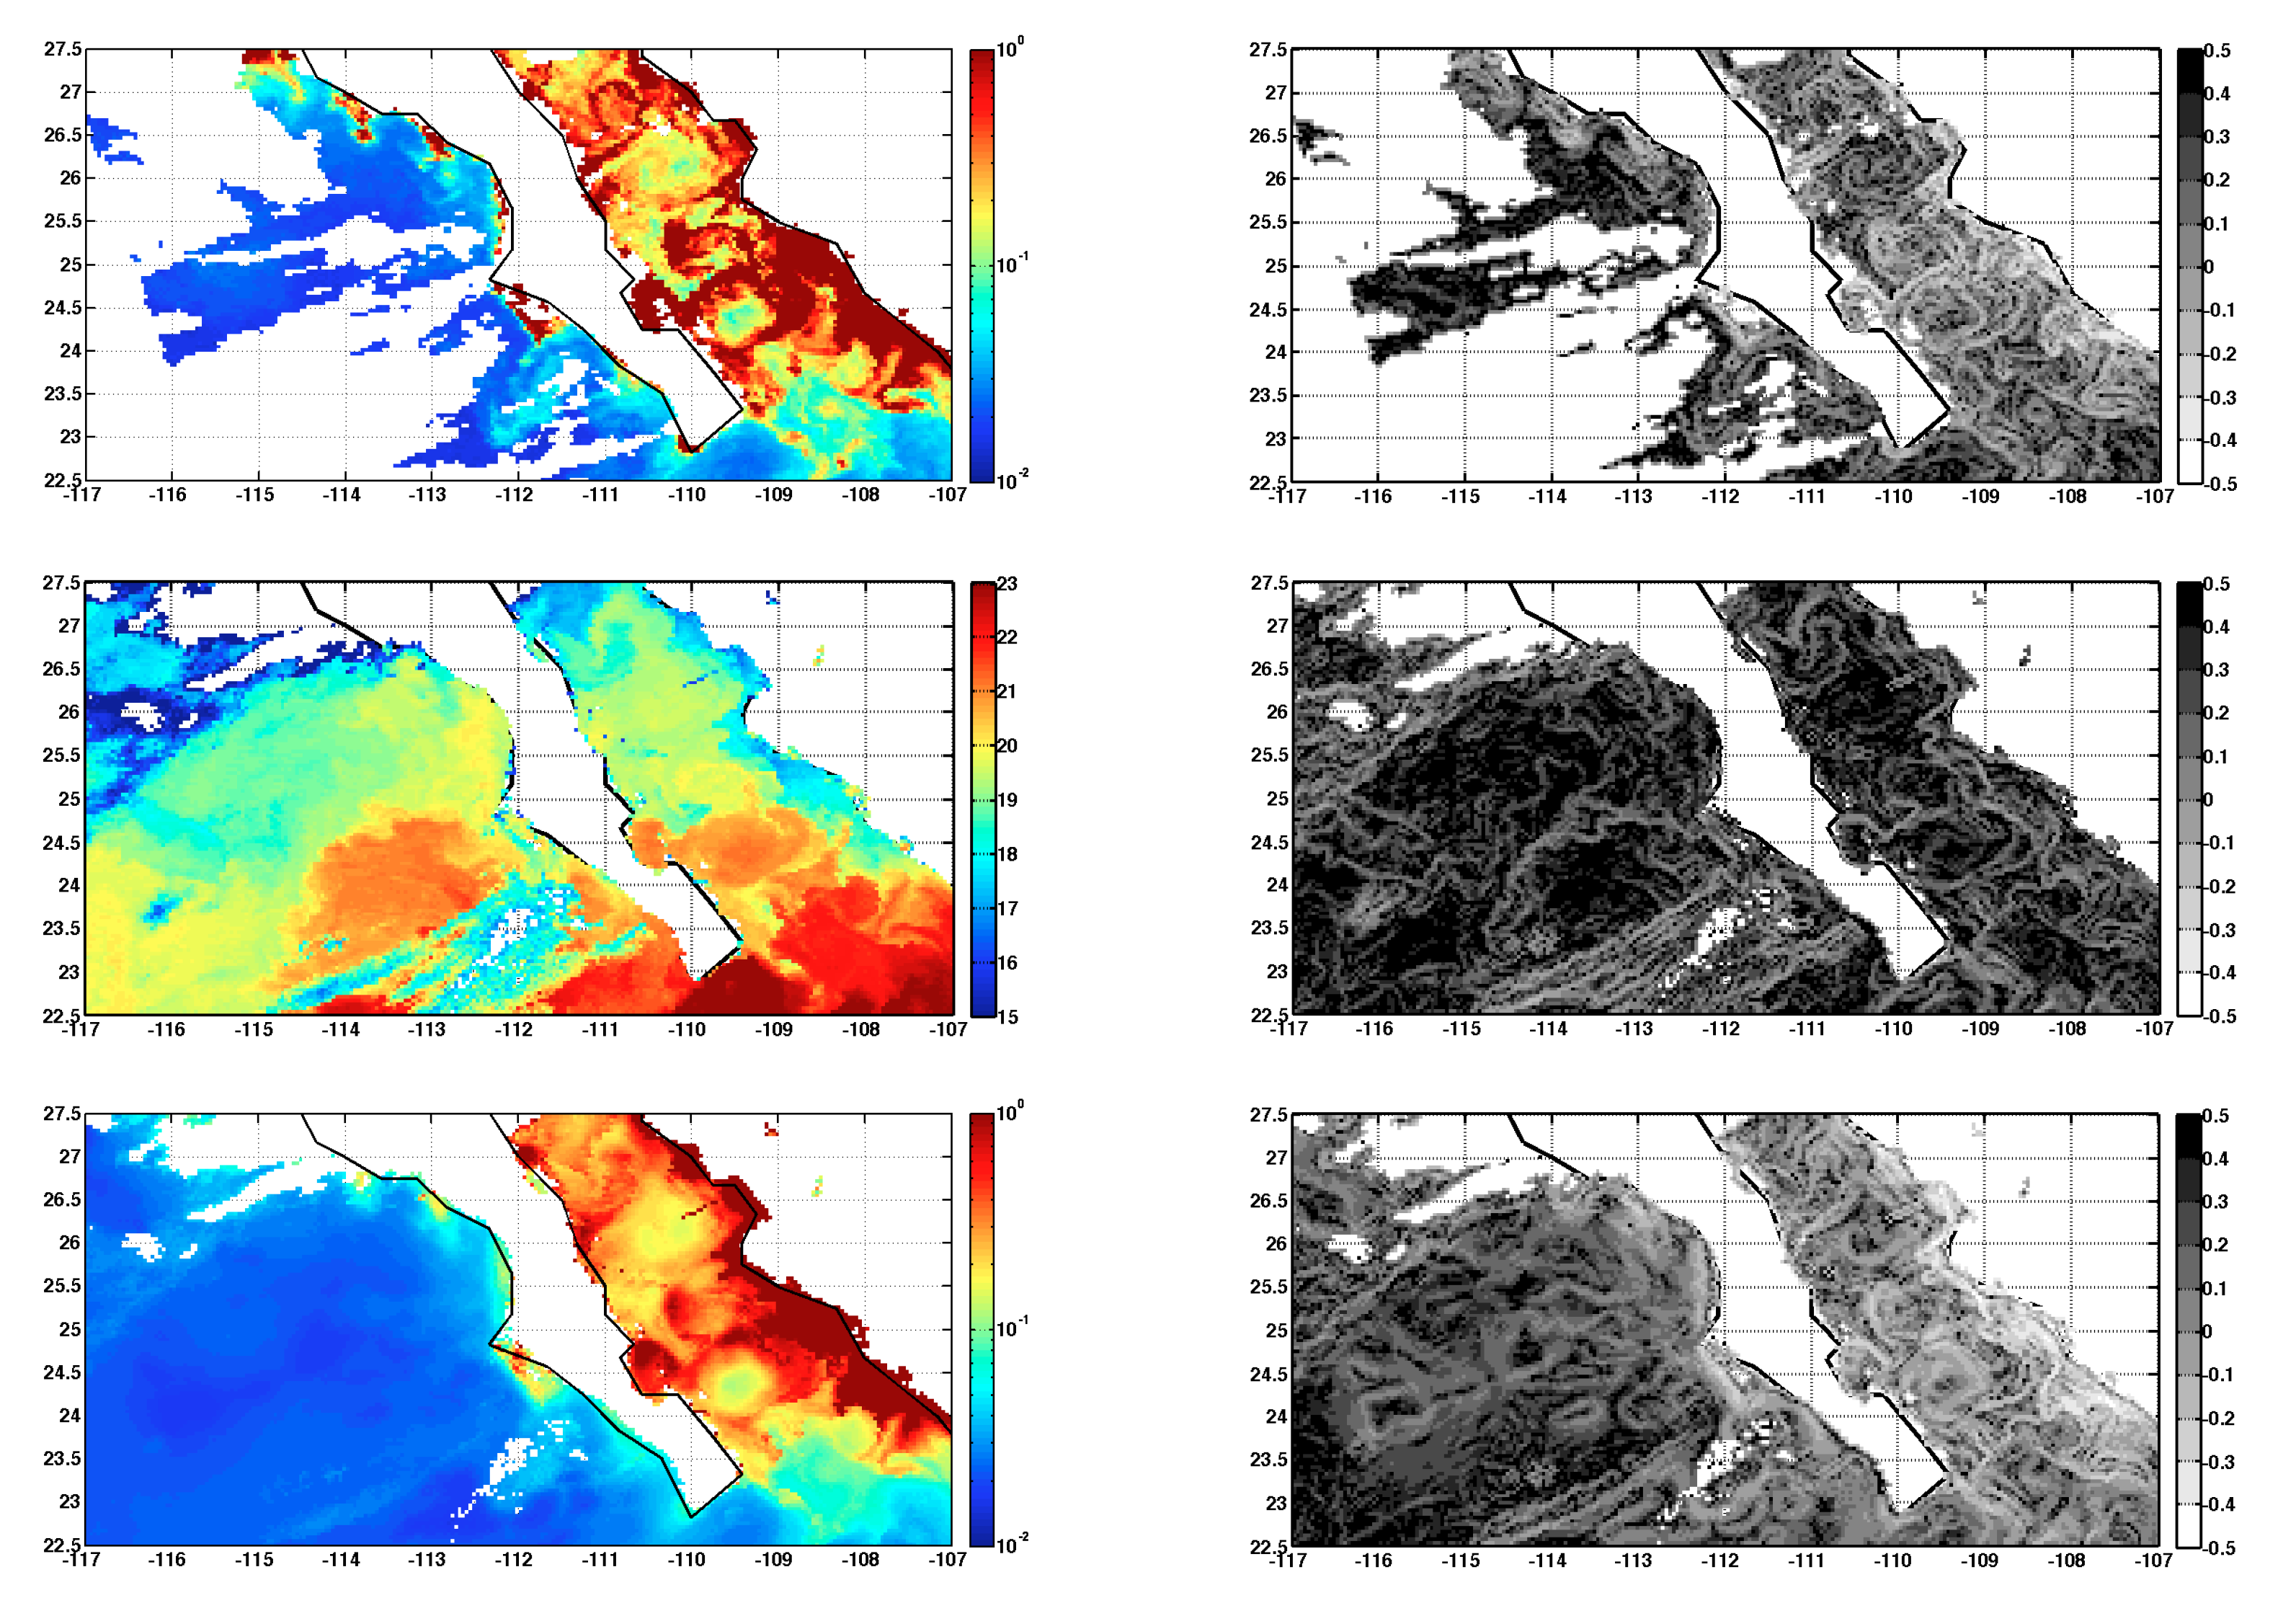
4. Results
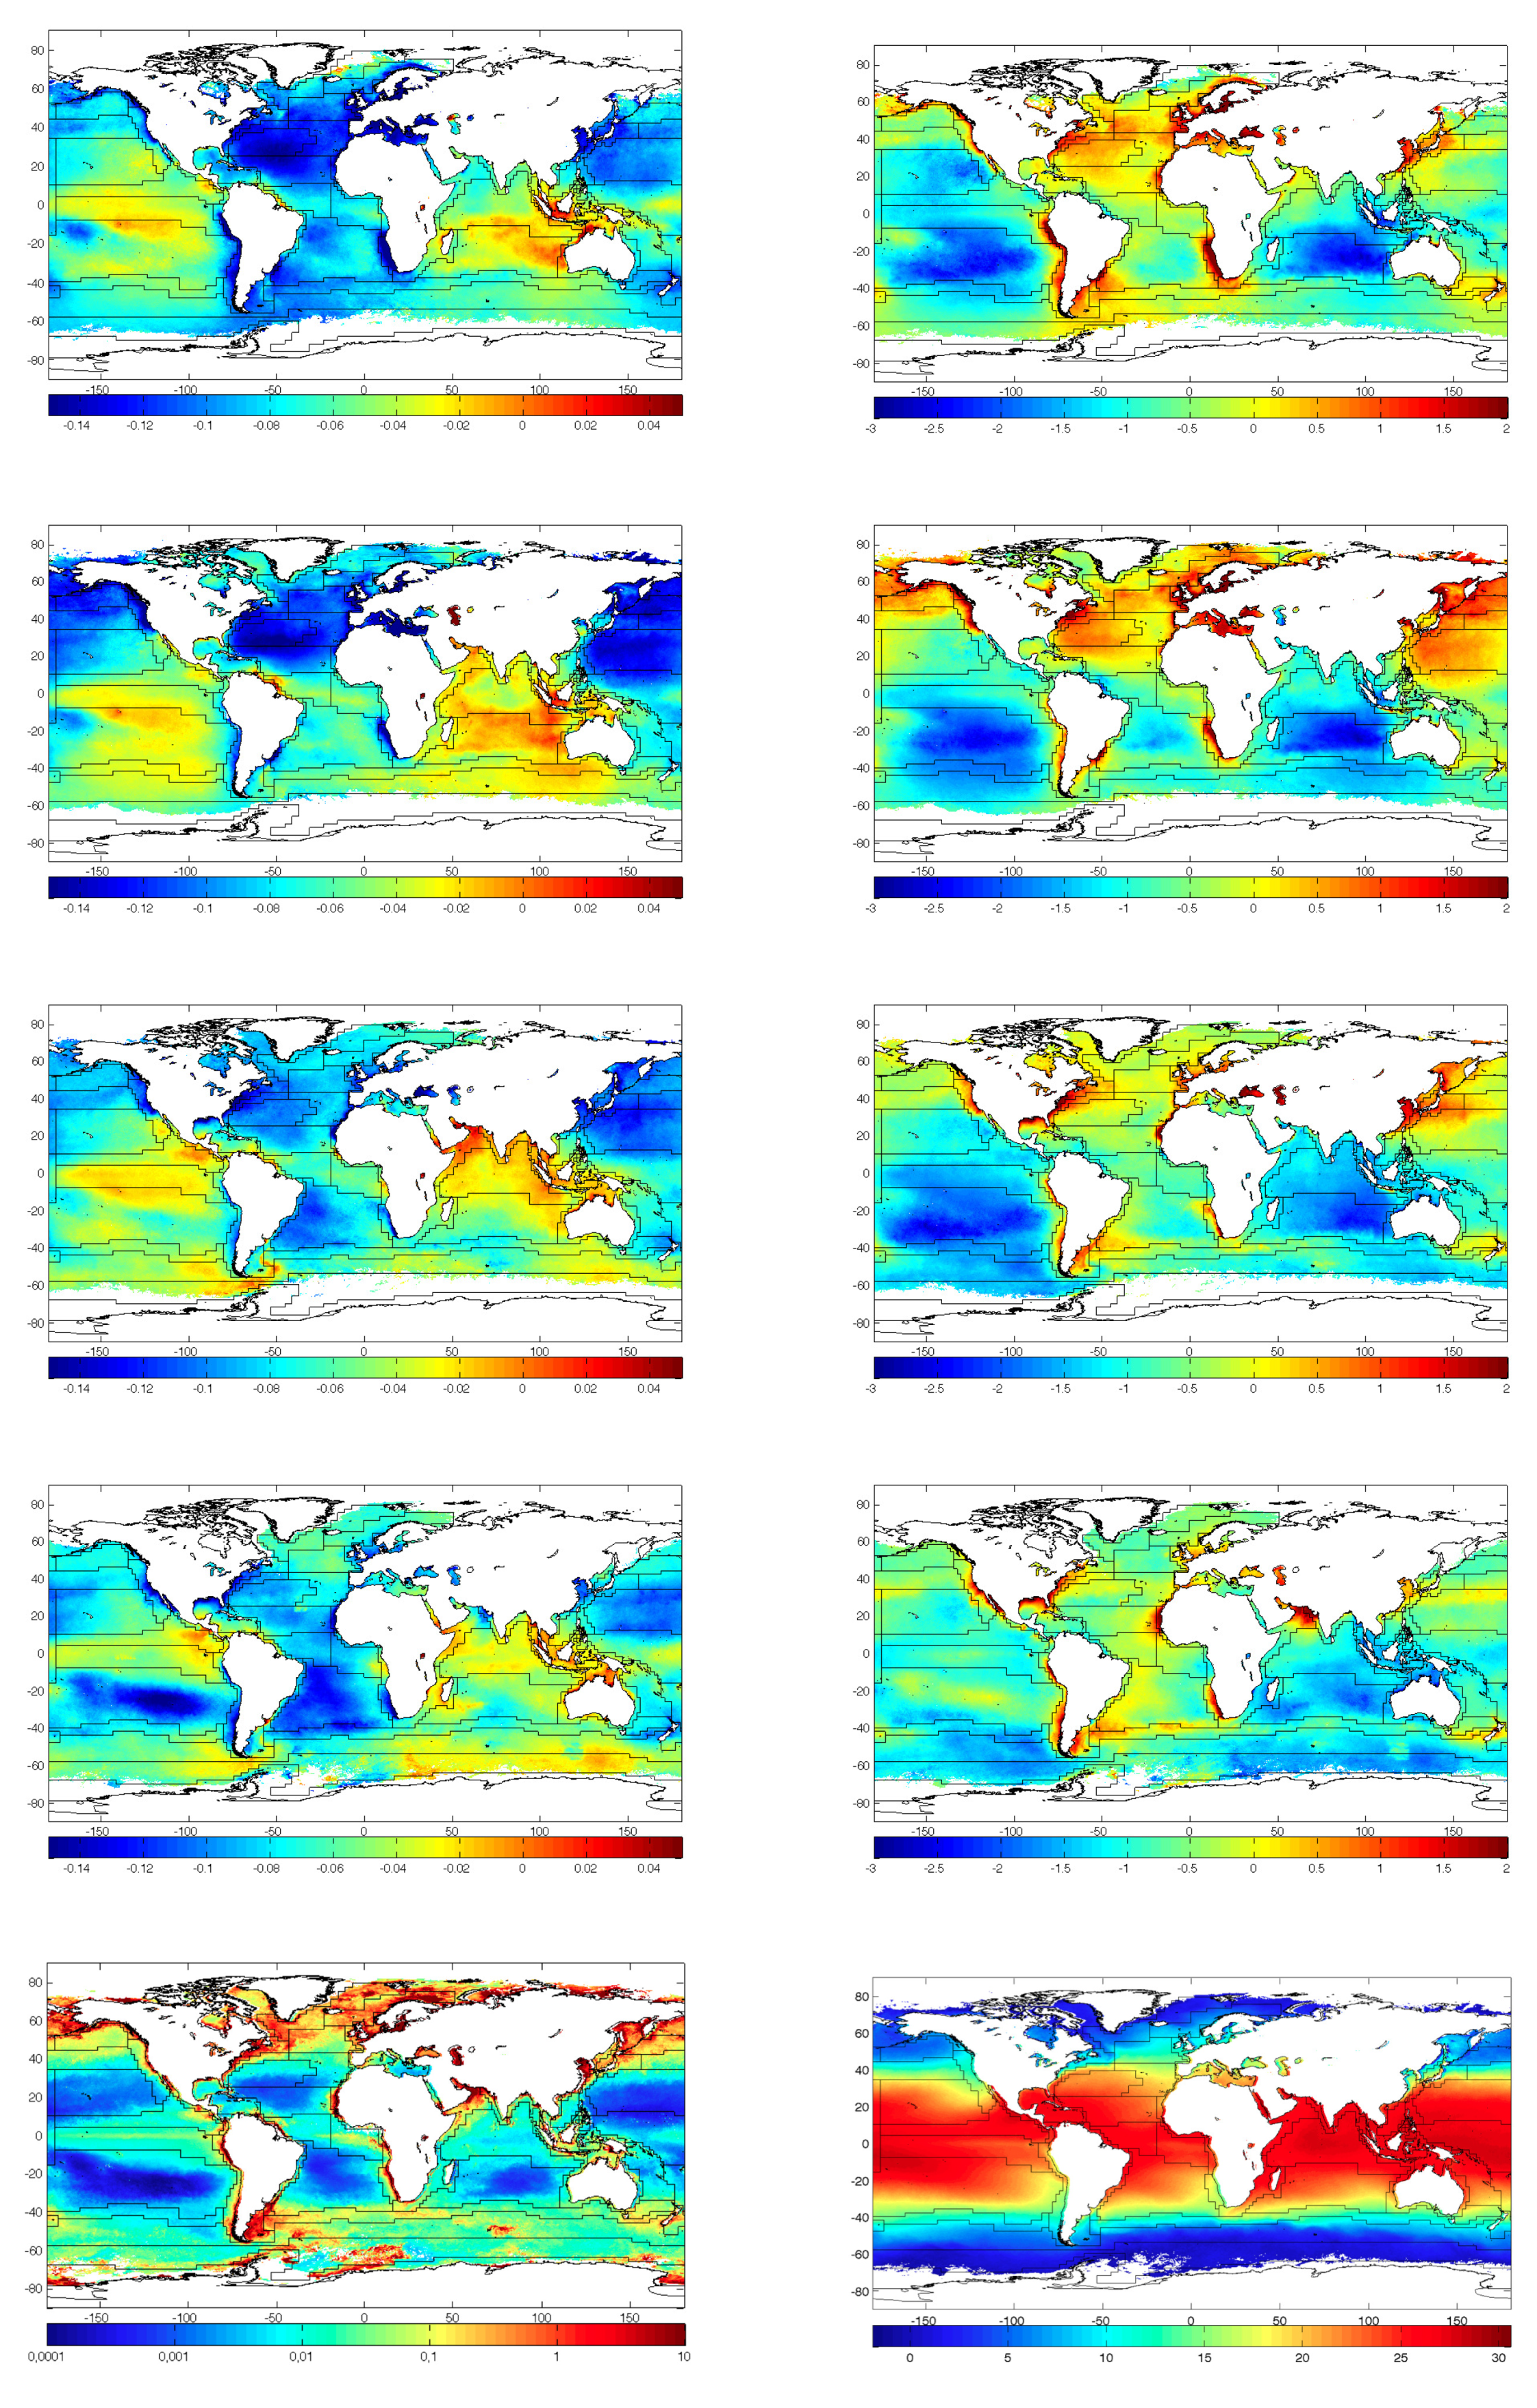
4.1. Scalar Synergy
4.2. Interpretation of Auxiliary Parameters
4.3. Validation of Reconstruction
5. Discussion and Conclusions
Author Contributions
Funding
Acknowledgments
Conflicts of Interest
References
- Smith, T.M.; Reynolds, R.W. Improved extended reconstruction of sst (1854–1997). J. Clim. 2004, 17, 2466–2477. [Google Scholar] [CrossRef]
- Buongiorno, B. A novel approach for the high-resolution interpolation of in situ sea surface salinity. J. Atmos. Ocean. Technol. 2012, 29, 867–879. [Google Scholar]
- Alvera-Azcárate, A.; Barth, A.; Beckers, J.M.; Weisberg, R.H. Multivariate reconstruction of missing data in sea surface temperature, chlorophyll and wind satellite fields. J. Geophys. Res. 2007. [Google Scholar] [CrossRef]
- Sirjacobs, D.A.; Alvera-Azcarate, A.; Barth, G.; Lacroix, Y.; Park, B.; Nechad, K.; Ruddick, J.-M.B. Cloud filling of ocean colour and sea surface temperature remote sensing products over the southern north sea by the data interpolating empirical orthogonal functions methodology. J. Sea Res. 2011, 65, 114–130. [Google Scholar] [CrossRef]
- Jouini Lévy, M.M.; Crépon, M.; Thiria, S. Reconstruction of satellite chlorophyll images under heavy cloud coverage using a neural classification method. Remote. Sens. Environ. 2013, 131, 232. [Google Scholar] [CrossRef]
- Fablet, R.; Huynh Viet, P.; Lguensat, R.; Horrein, P.H.; Chapron, B. Spatio-Temporal Interpolation of Cloudy SST Fields Using Conditional Analog Data Assimilation. Remote. Sens. 2018, 10, 2310. [Google Scholar] [CrossRef]
- Lguensat, R.; Teo, P.; Ailliot, P.; Pulido, M.; Fablet, R. The analog data assimilation. Mon. Weather Rev. 2017, 145, 4093–4107. [Google Scholar] [CrossRef]
- Crocke, E.R.W.; Matthews, D.; Baldwin, D. Computing ocean surface currents from infrared and ocean color imagery. IEEE Trans. Geosci. Remote Sens. 2007, 45, 435–447. [Google Scholar] [CrossRef]
- Isern‐Fontanet, J.; Turiel, A.; García‐Ladona, E.; Font, J. Microcanonical multifractal formalism: Application to the estimation of ocean surface velocities. J. Geophys. Res. 2007, 112, C05024. [Google Scholar] [CrossRef]
- Turiel, A.H.; Pérez-Vicente, C. Microcanonical multifractal formalism: A geometrical approach to multifractal systems. Part I: Singularity analysis. J. Phys. 2008, 41, 015501. [Google Scholar] [CrossRef]
- Denman, K.L.; Abbott, M.A. Time scales of pattern evolution from cross-spectrum analysis of advanced very high resolution radiometer and coastal zone color scanner imagery. J. Geophys. Res. 1994, 99, 7433–7442. [Google Scholar] [CrossRef]
- Doney, S.C.; Glover, D.M.; McCue, S.J.; Fuentes, M. Mesoscale variability of SeaWiFS satellite Ocean Color: Global Patterns and spatial scales. J. Geophys. Res. 2003, 108, 6.1–6.15. [Google Scholar] [CrossRef]
- Nieves, V.C.; Llebot, A.; Turiel, J.; Solé, E.; García-Ladona, M.; Estrad, M.; Blasco, D. Common turbulent signature in sea surface temperature and chlorophyll maps. Geophys. Res. Lett. 2007, 34, L23602. [Google Scholar] [CrossRef]
- Frisch, U. Turbulence: The Legacy of A.N. Kolmogorov; Cambridge University Press: Cambridge, MA, USA, 1995. [Google Scholar]
- Turiel, A.; Parga, N. The multi-fractal structure of contrast changes innatural images: From sharp edges to textures. Neural Comput. 2000, 12, 763–793. [Google Scholar] [CrossRef] [PubMed]
- Olmedo, E.J.; Martínez, M.; Umbert, N.; Hoareau, M.; Portabella, J.; Ballabrera-Poy, A. Improving time and space resolution of smos salinity maps using multifractal fusion. Remote. Sens. Environ. 2016, 180, 246–263. [Google Scholar] [CrossRef]
- Umbert, M.; Hoareau, N.; Turiel, A.; Ballabrera-Poy, J. New blending algorithm to synergize ocean variables: The case of SMOS sea surface salinity maps. Remote. Sens. Environ. 2014, 146, 172–187. [Google Scholar] [CrossRef]
- Brown, O.; Minnett, P.J. Modis Infrared Sea Surface Temperature Algorithm Algorithm Theoretical Basis Document. Version 2.0. Available online: https://modis.gsfc.nasa.gov/data/atbd/atbd_mod25.pdf (accessed on 2 April 2020).
- Campbell, J.W. The lognormal distribution as a model for bio-optical variability in the sea. J. Geophys. Res. 1995, 100, 237–254. [Google Scholar] [CrossRef]
- Turiel, A.; Nieves, V.; García-Ladona, E.; Rio, M.H.; Larnicol, G. The multifractal structure of satellite temperature images can be used to obtain global maps of ocean currents. Ocean. Sci. 2009, 5, 447–460. [Google Scholar] [CrossRef]
- Valdez-Holguin, J.E.; Lara-Lara, J.R. Primary productivity in the gulf of california effects of el 350 niño 1982–1983 event. Cienc. Mar. 1987, 13, 34–50. [Google Scholar] [CrossRef]
- Longhurst, A.R. Ecological Geography of the Sea; Academic Press: Cambridge, MA, USA, 1998. [Google Scholar]
- Hoareau, N.; Turiel, A.; Portabella, M.; Ballabrera-Poy, J.; Vogelzang, J. Singularity power spectra: A method to assess geophysical consistency of gridded products—application to sea-surface salinity remote sensing maps. IEEE Trans. Geosci. Remote. Sens. 2018, 56, 5525–5536. [Google Scholar] [CrossRef]


| R | ||||||||||||||||
|---|---|---|---|---|---|---|---|---|---|---|---|---|---|---|---|---|
| JFM | AMJ | JAS | OND | JFM | AMJ | JAS | OND | JFM | AMJ | JAS | OND | JFM | AMJ | JAS | OND | |
| CA | 0.15 | 0.67 | 0.77 | 0.74 | 0.20 | 0.07 | 0.08 | 0.06 | 0.70 | 0.04 | 0.03 | 0.02 | 0.73 | 0.08 | 0.09 | 0.06 |
| BG | 0.47 | 0.93 | 0.91 | 0.93 | 0.35 | 0.14 | 0.13 | 0.11 | 0.27 | 0.03 | 0.02 | 0.02 | 0.47 | 0.15 | 0.13 | 0.12 |
| CL | 0.19 | 0.89 | 0.80 | 0.88 | 0.22 | 0.04 | 0.04 | 0.04 | 0.72 | 0.02 | 0.03 | 0.03 | 0.75 | 0.05 | 0.05 | 0.06 |
| EP | 0.25 | 0.94 | 0.94 | 0.94 | 0.17 | 0.04 | 0.03 | 0.03 | 0.42 | 0.01 | 0.02 | 0.01 | 0.46 | 0.04 | 0.04 | 0.03 |
| NA | 0.33 | 0.88 | 0.91 | 0.86 | 0.16 | 0.09 | 0.10 | 0.07 | 0.47 | 0.02 | 0.01 | 0.01 | 0.50 | 0.10 | 0.10 | 0.07 |
© 2020 by the authors. Licensee MDPI, Basel, Switzerland. This article is an open access article distributed under the terms and conditions of the Creative Commons Attribution (CC BY) license (http://creativecommons.org/licenses/by/4.0/).
Share and Cite
Umbert, M.; Guimbard, S.; Ballabrera Poy, J.; Turiel, A. Synergy between Ocean Variables: Remotely Sensed Surface Temperature and Chlorophyll Concentration Coherence. Remote Sens. 2020, 12, 1153. https://doi.org/10.3390/rs12071153
Umbert M, Guimbard S, Ballabrera Poy J, Turiel A. Synergy between Ocean Variables: Remotely Sensed Surface Temperature and Chlorophyll Concentration Coherence. Remote Sensing. 2020; 12(7):1153. https://doi.org/10.3390/rs12071153
Chicago/Turabian StyleUmbert, Marta, Sebastien Guimbard, Joaquim Ballabrera Poy, and Antonio Turiel. 2020. "Synergy between Ocean Variables: Remotely Sensed Surface Temperature and Chlorophyll Concentration Coherence" Remote Sensing 12, no. 7: 1153. https://doi.org/10.3390/rs12071153
APA StyleUmbert, M., Guimbard, S., Ballabrera Poy, J., & Turiel, A. (2020). Synergy between Ocean Variables: Remotely Sensed Surface Temperature and Chlorophyll Concentration Coherence. Remote Sensing, 12(7), 1153. https://doi.org/10.3390/rs12071153