Article

Automatic 3D Landmark Extraction System Based on an Encoder–Decoder Using Fusion of Vision and LiDAR

Department of Multimedia Engineering, Dongguk University-Seoul, 30 Pildong-ro 1-gil, Jung-gu, Seoul 04620, Korea
*
Author to whom correspondence should be addressed.
Remote Sens. 2020, 12(7), 1142; https://doi.org/10.3390/rs12071142
Submission received: 20 February 2020 / Revised: 30 March 2020 / Accepted: 2 April 2020 / Published: 3 April 2020
(This article belongs to the Special Issue Point Cloud Processing in Remote Sensing)

Abstract

:
To provide a realistic environment for remote sensing applications, point clouds are used to realize a three-dimensional (3D) digital world for the user. Motion recognition of objects, e.g., humans, is required to provide realistic experiences in the 3D digital world. To recognize a user’s motions, 3D landmarks are provided by analyzing a 3D point cloud collected through a light detection and ranging (LiDAR) system or a red green blue (RGB) image collected visually. However, manual supervision is required to extract 3D landmarks as to whether they originate from the RGB image or the 3D point cloud. Thus, there is a need for a method for extracting 3D landmarks without manual supervision. Herein, an RGB image and a 3D point cloud are used to extract 3D landmarks. The 3D point cloud is utilized as the relative distance between a LiDAR and a user. Because it cannot contain all information the user’s entire body due to disparities, it cannot generate a dense depth image that provides the boundary of user’s body. Therefore, up-sampling is performed to increase the density of the depth image generated based on the 3D point cloud; the density depends on the 3D point cloud. This paper proposes a system for extracting 3D landmarks using 3D point clouds and RGB images without manual supervision. A depth image provides the boundary of a user’s motion and is generated by using 3D point cloud and RGB image collected by a LiDAR and an RGB camera, respectively. To extract 3D landmarks automatically, an encoder–decoder model is trained with the generated depth images, and the RGB images and 3D landmarks are extracted from these images with the trained encoder model. The method of extracting 3D landmarks using RGB depth (RGBD) images was verified experimentally, and 3D landmarks were extracted to evaluate the user’s motions with RGBD images. In this manner, landmarks could be extracted according to the user’s motions, rather than by extracting them using the RGB images. The depth images generated by the proposed method were 1.832 times denser than the up-sampling-based depth images generated with bilateral filtering.

Graphical Abstract

1. Introduction

Three-dimensional (3D) digital environments are provided to take advantage of various platforms such as remotely controlled unmanned aerial vehicles and autonomous vehicles [1,2,3,4,5,6]. To generate a 3D digital world with realistic models of urban and natural environments, light detection and ranging (LiDAR) or vision-based point clouds are used to recognize motions of objects such as users in the real environment. To recognize the user’s motion with the point cloud, it is necessary to extract 3D landmarks of the user’s point cloud.
To recognize a user’s motions, nearby 3D landmarks are extracted by analyzing a red green blue (RGB) image or a 3D point cloud using deep learning [7,8,9,10]. Labeled 3D landmarks must be labeled for RGB images or 3D point clouds to train the deep learning network. Thus, a method for extracting 3D landmarks without the labels would be very useful.
Captured RGB images are analyzed with an encoder–decoder model to recognize a user’s motions, and two-dimensional (2D) landmarks of the user’s motions are automatically extracted [11,12,13,14]. The boundary of the user’s motions is handled as the user’s motions representing the user’s body in three dimensions. If there is a change in the boundary of the user’s motions but there is no difference in the RGB images, it is difficult to compare the user’s motions based on the 2D landmarks from the RGB images. For example, there is no difference in 2D landmarks between a user’s motion with similar RGB images, such as a user’s motion with a hand moving forward than the user’s body, and a user’s motion with a hand moving behind the user’s body. Because the boundary of the user’s motion is not considered, 3D landmarks cannot be extracted. Therefore, there is a need for a method for extracting 3D landmarks by considering the boundary of the user’s motions.
The boundary of the user motion cannot be measured with RGB images, which can be addressed by using both the RGB image and a 3D point cloud measured by a LiDAR [15,16,17,18]. Depending on the number of laser sensors attached to the LiDAR and different distances between the LiDAR and the user, the number of data points in a 3D point cloud is variety. When generating any depth image via up-sampling [16], there will be differences in the level of the detail of the depth image depending on the number of measured points in a 3D point cloud. There is a need for a method for generating reliable depth images without variations resulting from the number of points of a 3D point cloud.
This paper proposes a system that automatically extracts 3D landmarks without manual supervision. It uses RGB images and 3D point clouds collected with a vision system and a LiDAR, respectively, to recognize a user’s motions and does not depend on the number of points in the 3D point cloud. The depth image provides the boundary of the user’s motion. By utilizing the difference between the background RGB image and the RGB image that captures a user’s motion, the depth image of the user’s motion is generated by correcting the disparities in the 3D point cloud. Based on these depth images, 3D landmarks of the user’s motions are automatically extracted with an improved encoder–decoder model; the 3D landmarks are generated by the trained encoder.
The contributions of the proposed system are as follows:
  • In existing deep learning research, manual supervision is needed to extract 3D landmarks. By using 3D point clouds and an RGB-based encoder–decoder model, 3D landmarks can be extracted automatically without manual supervision. These 3D landmarks can be utilized for modeling user’s motions without manual supervision.
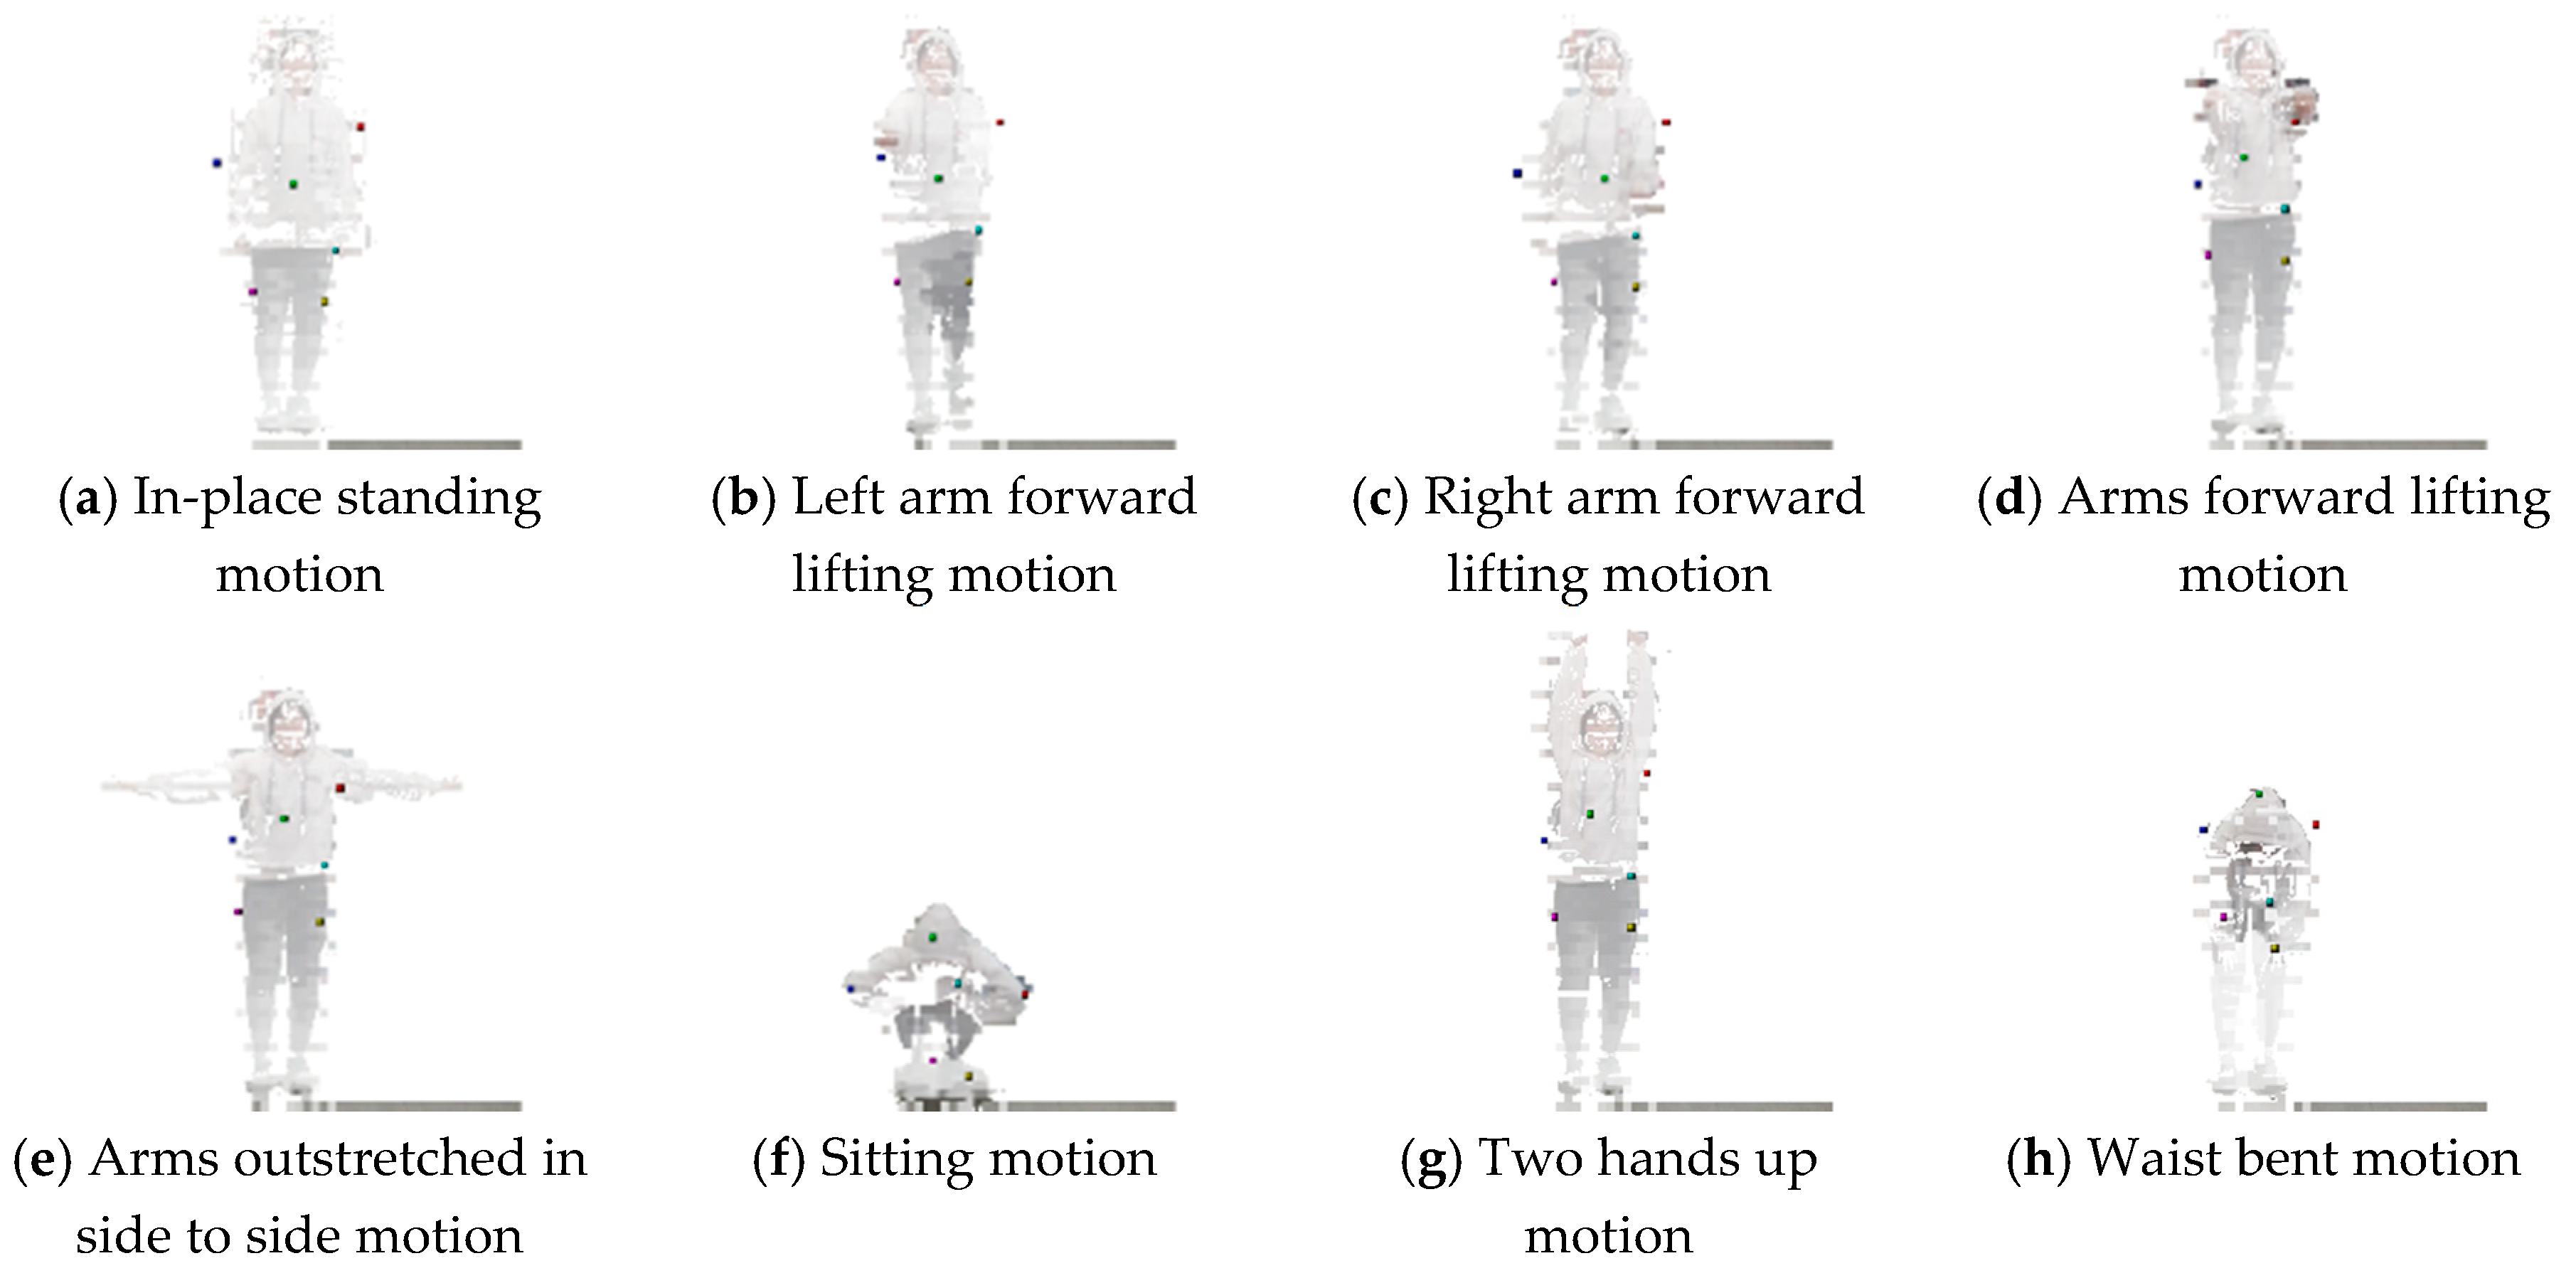
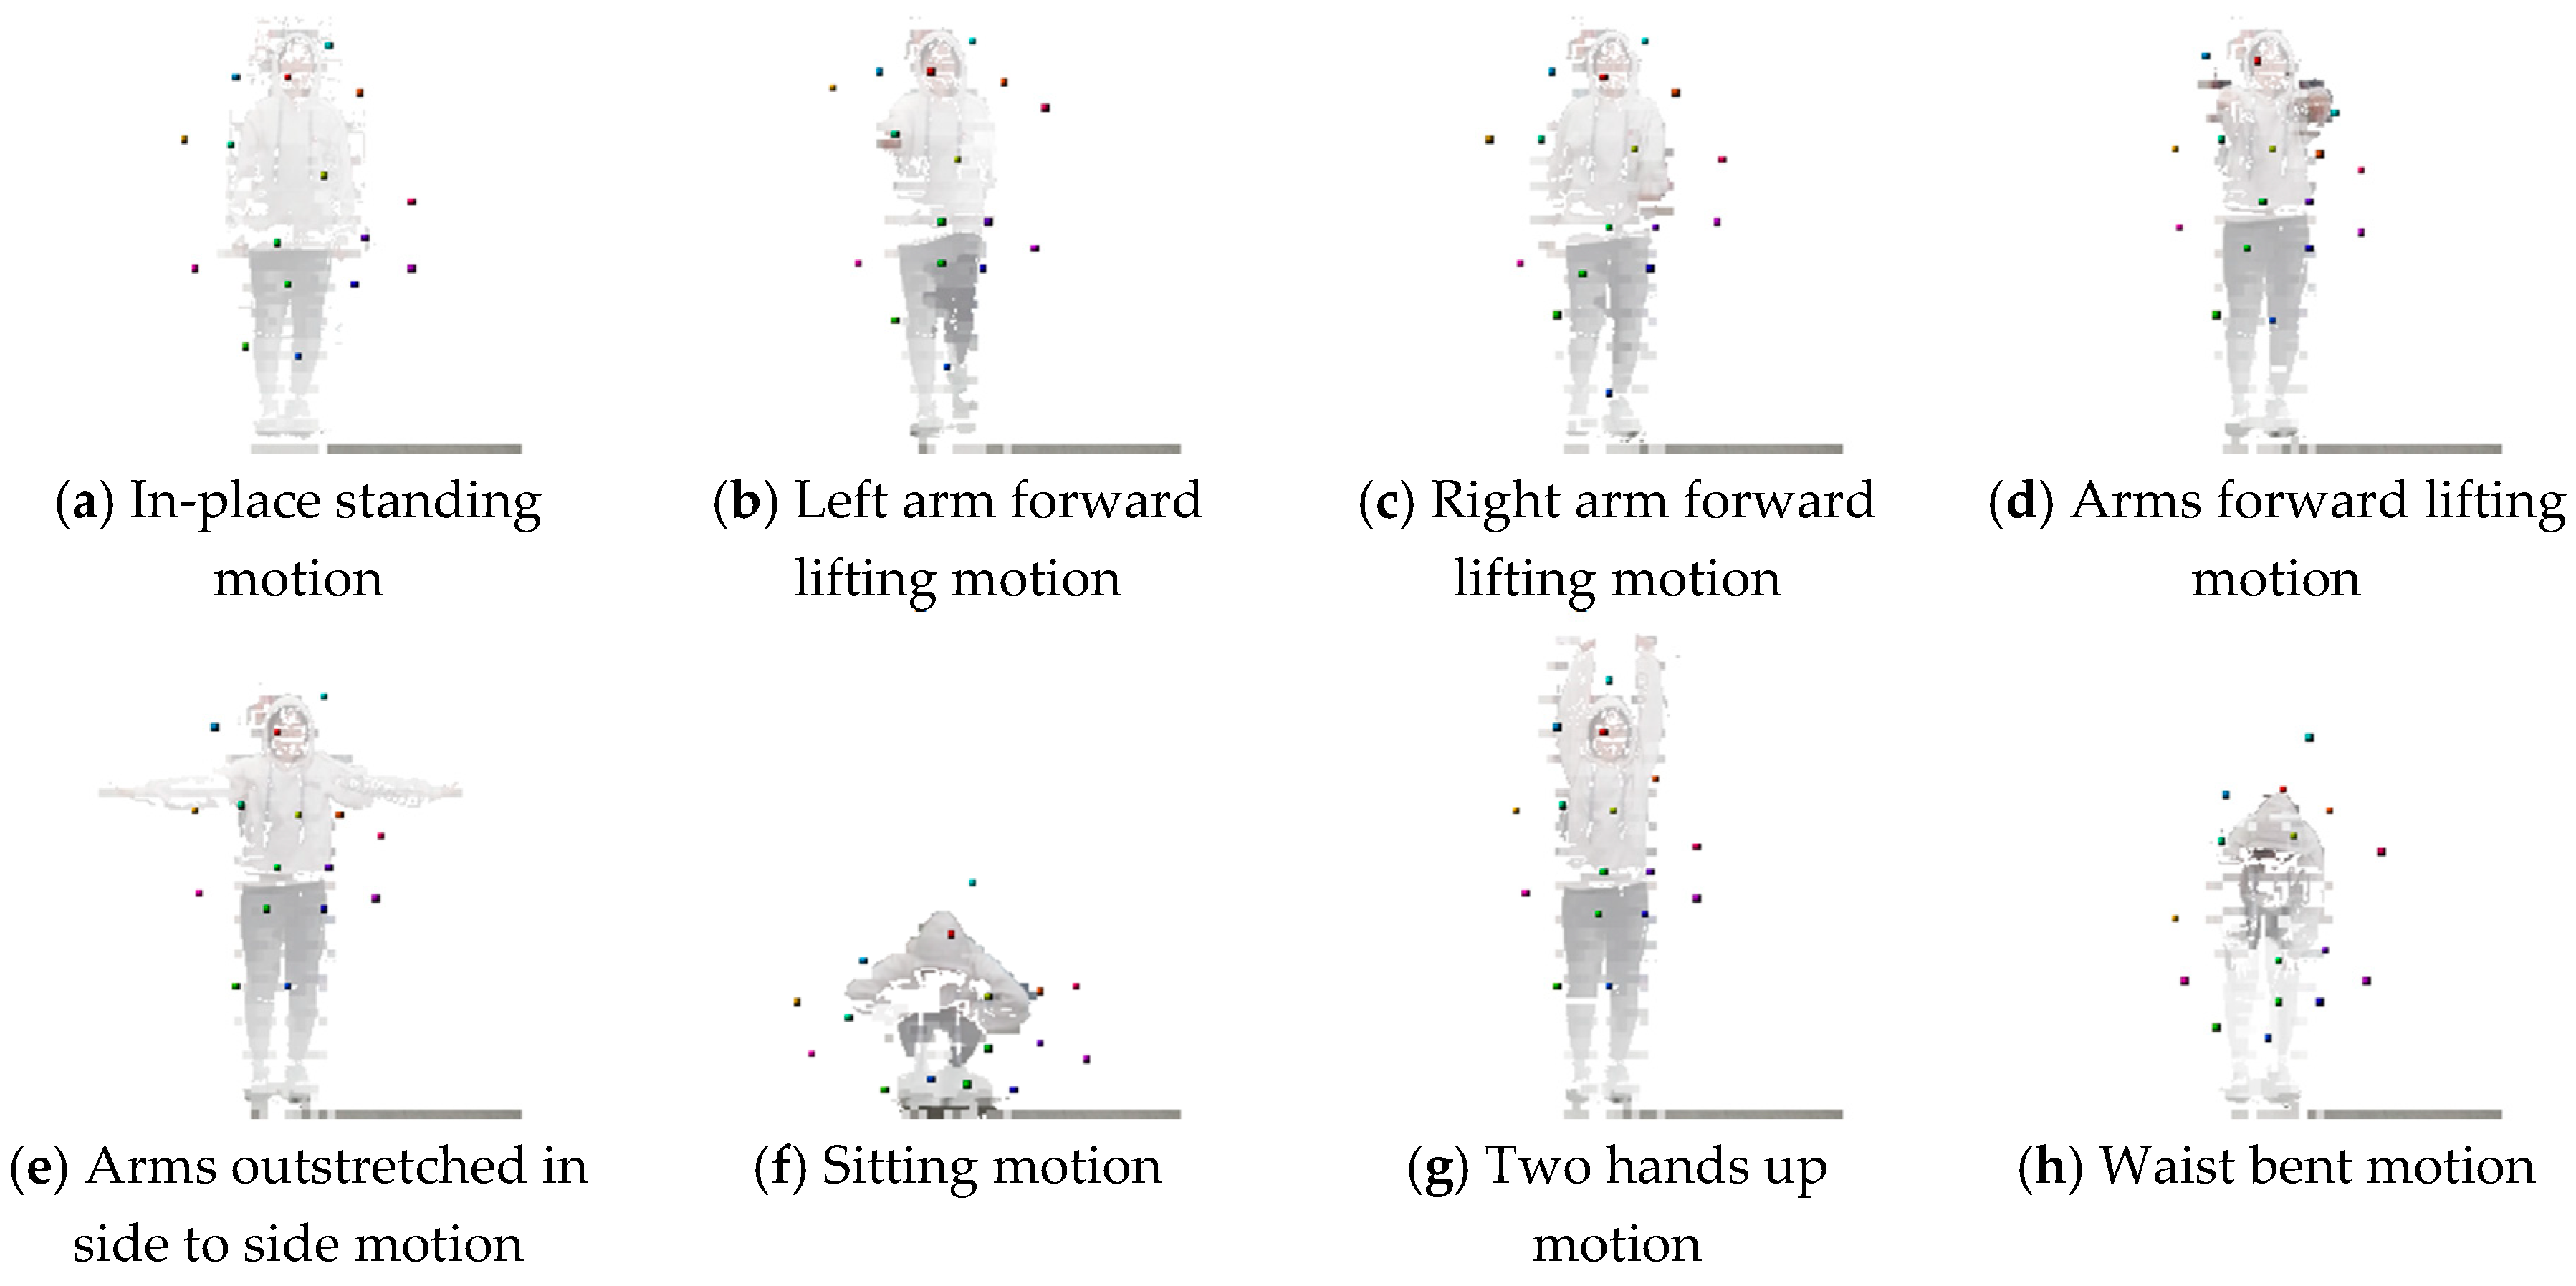
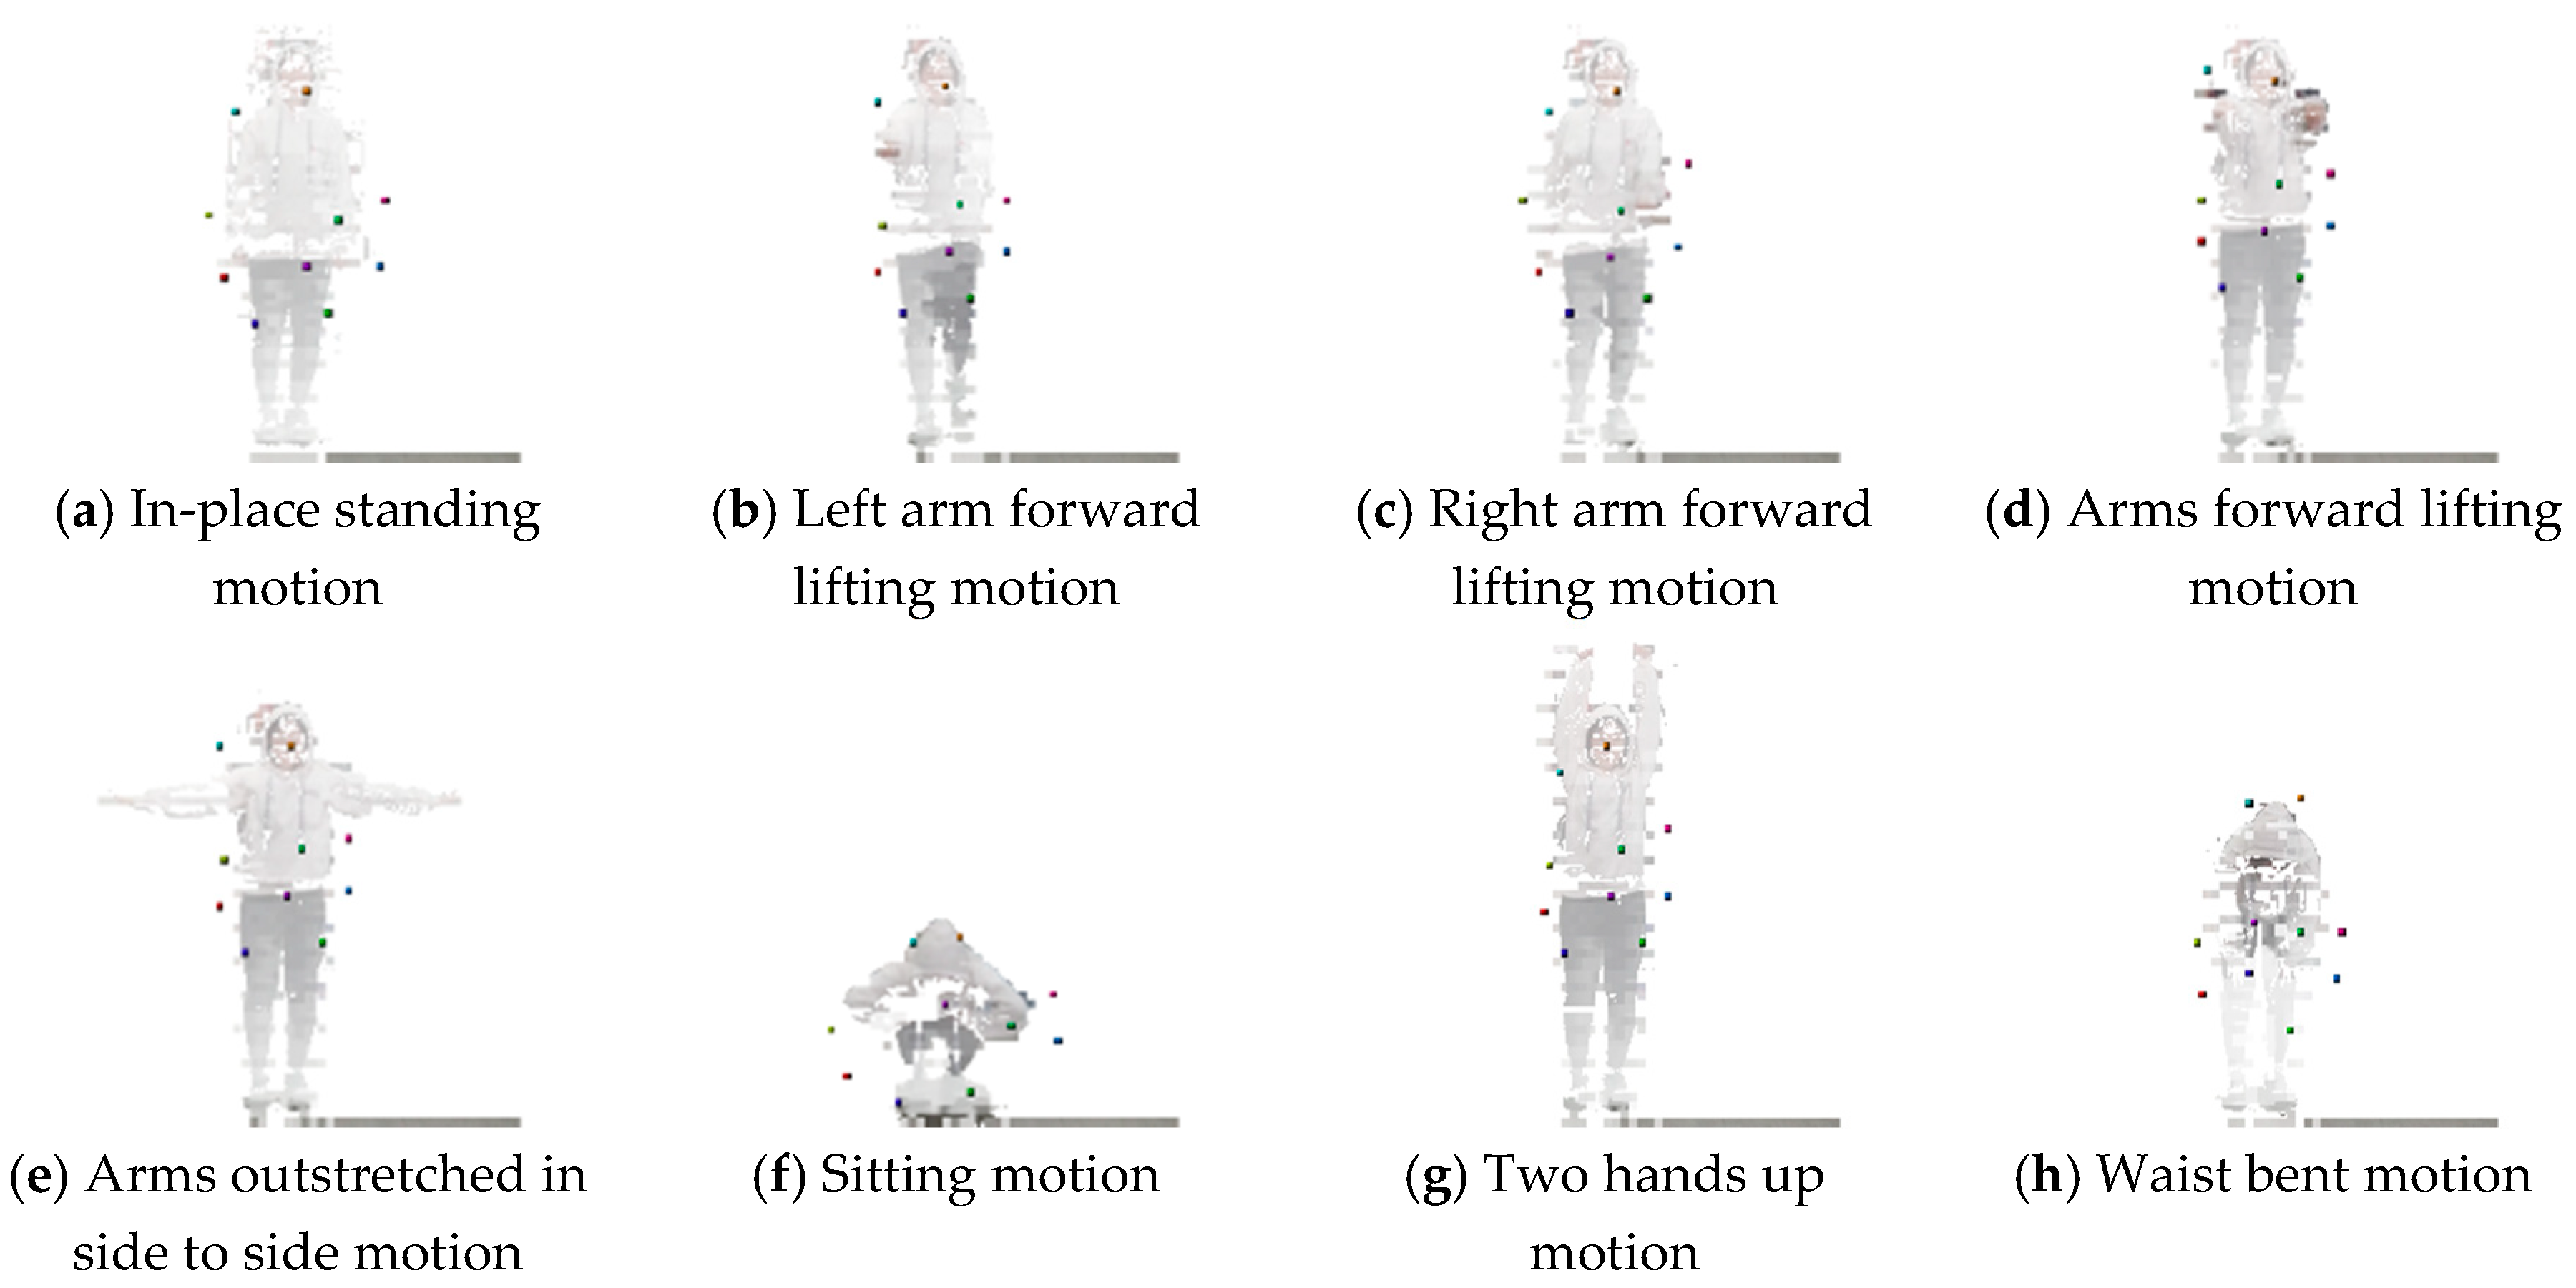
  • When observing the user’s motion through 2D landmarks, it is difficult to show the motion difference in forward and backward motions; 3D landmarks can express various user’s motions. They can evaluate the user’s motion by further reflecting the user’s body.
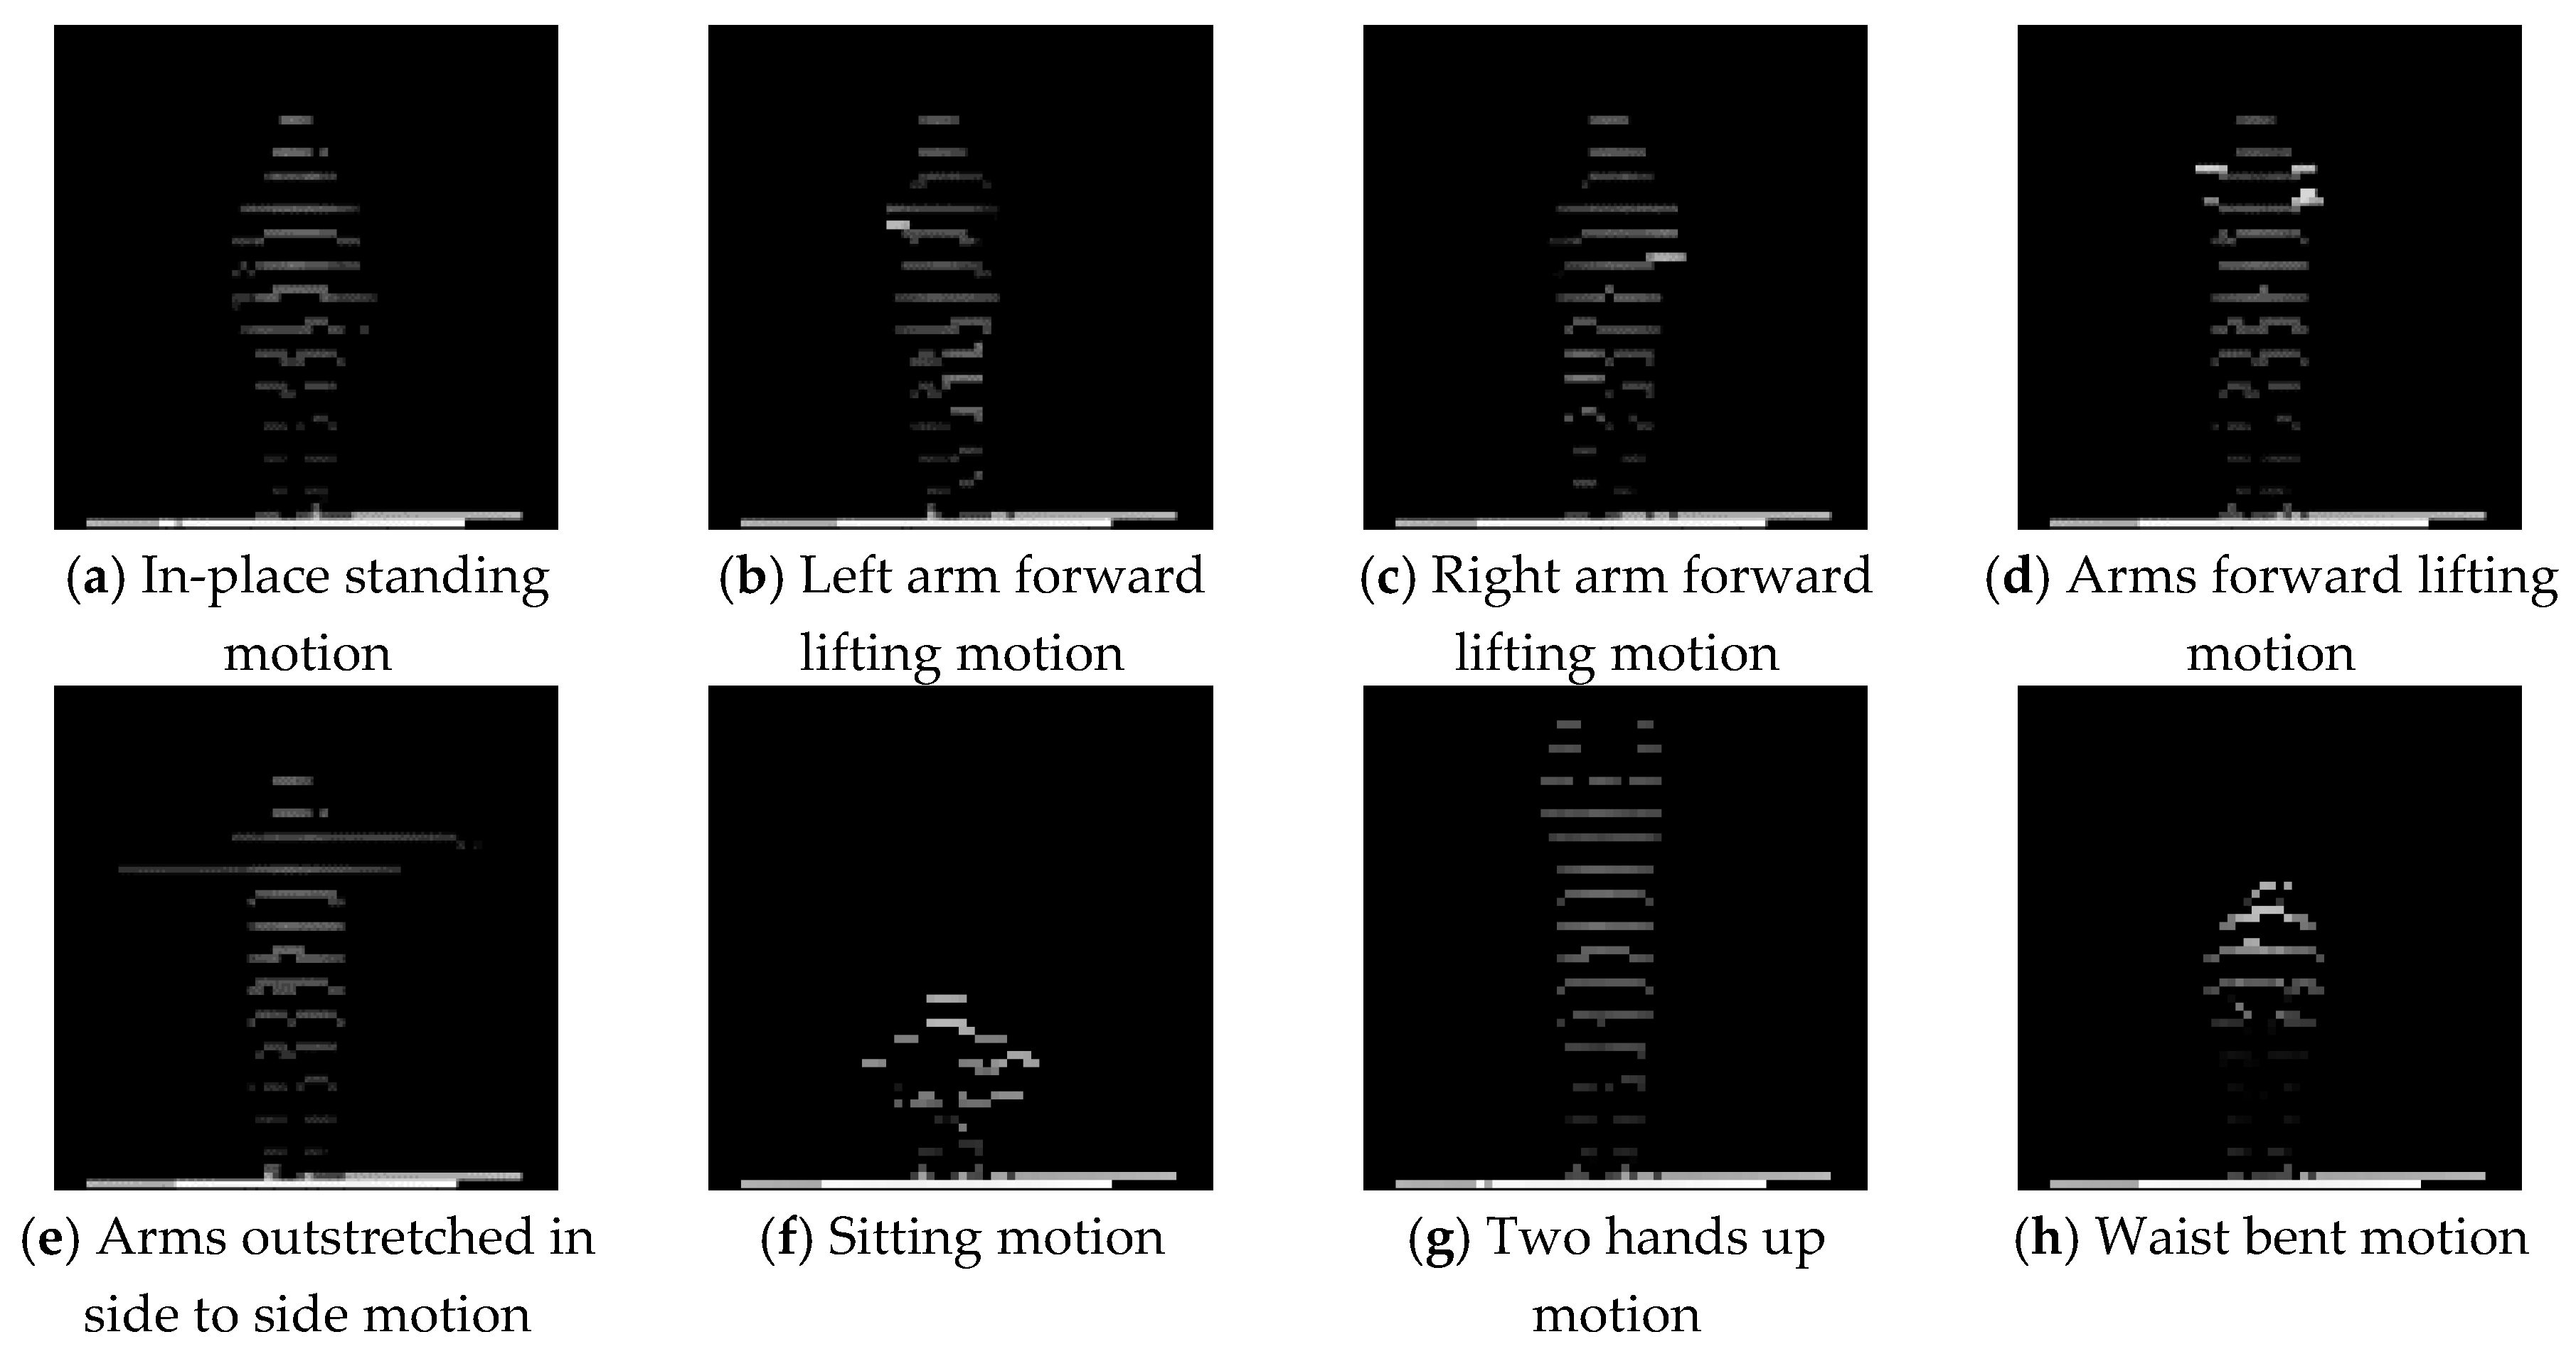
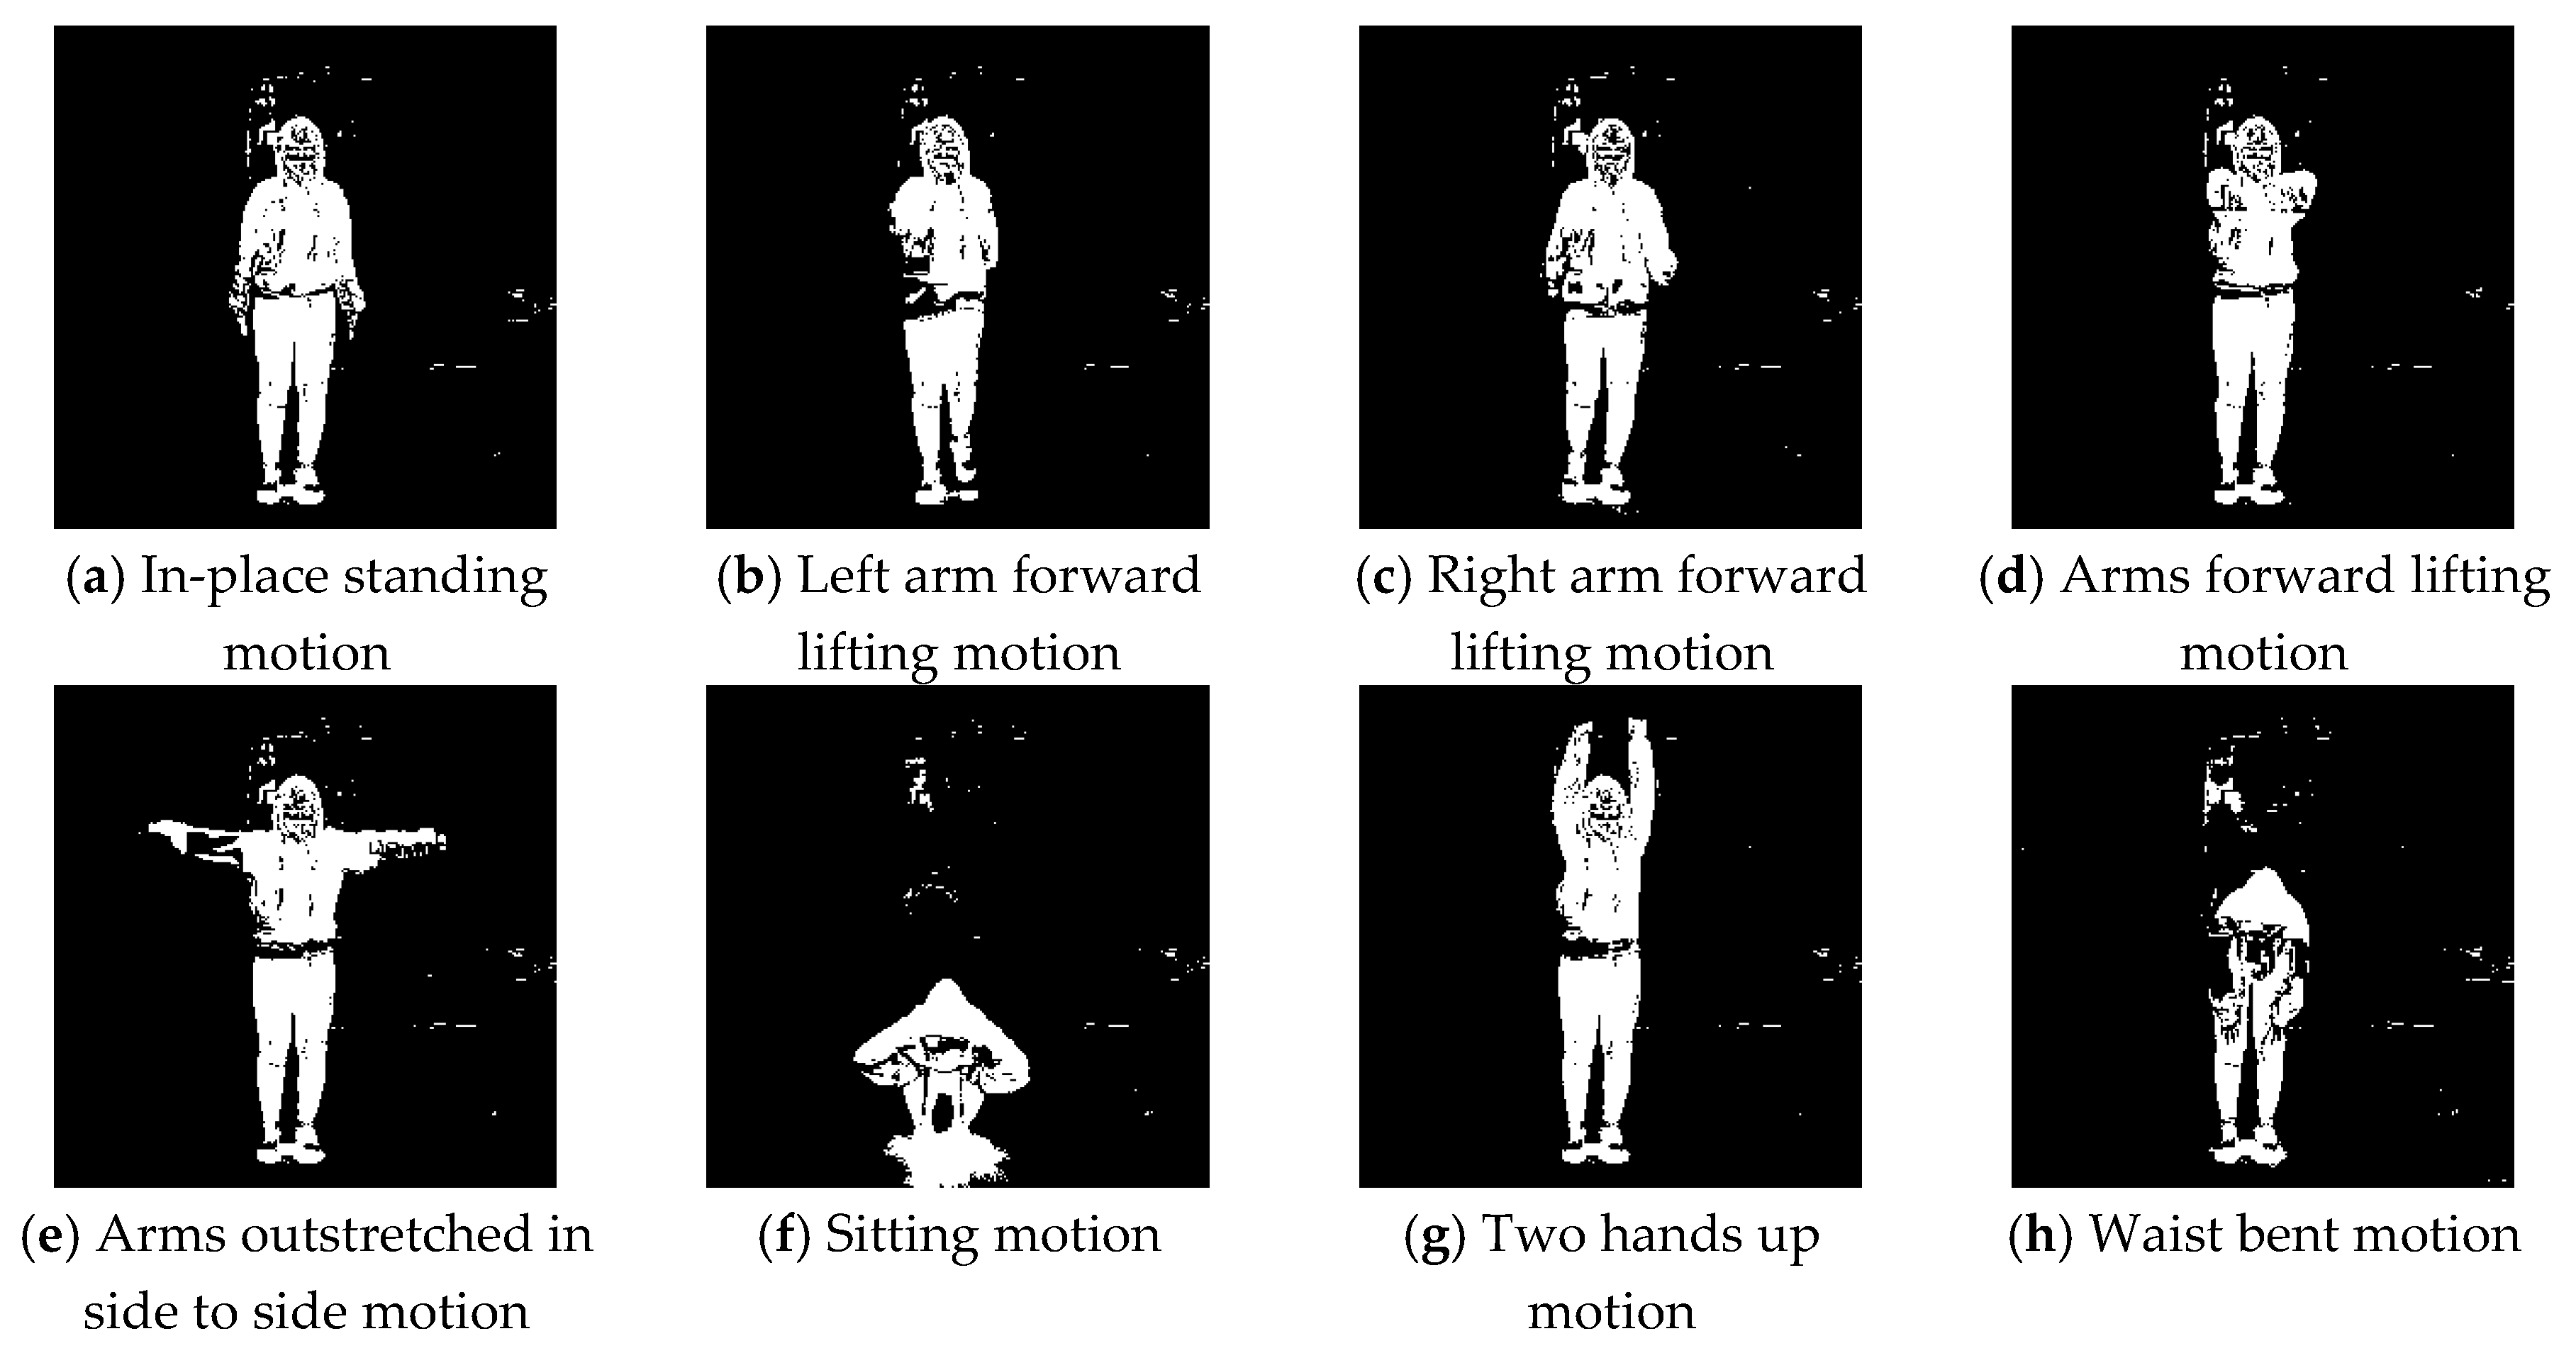
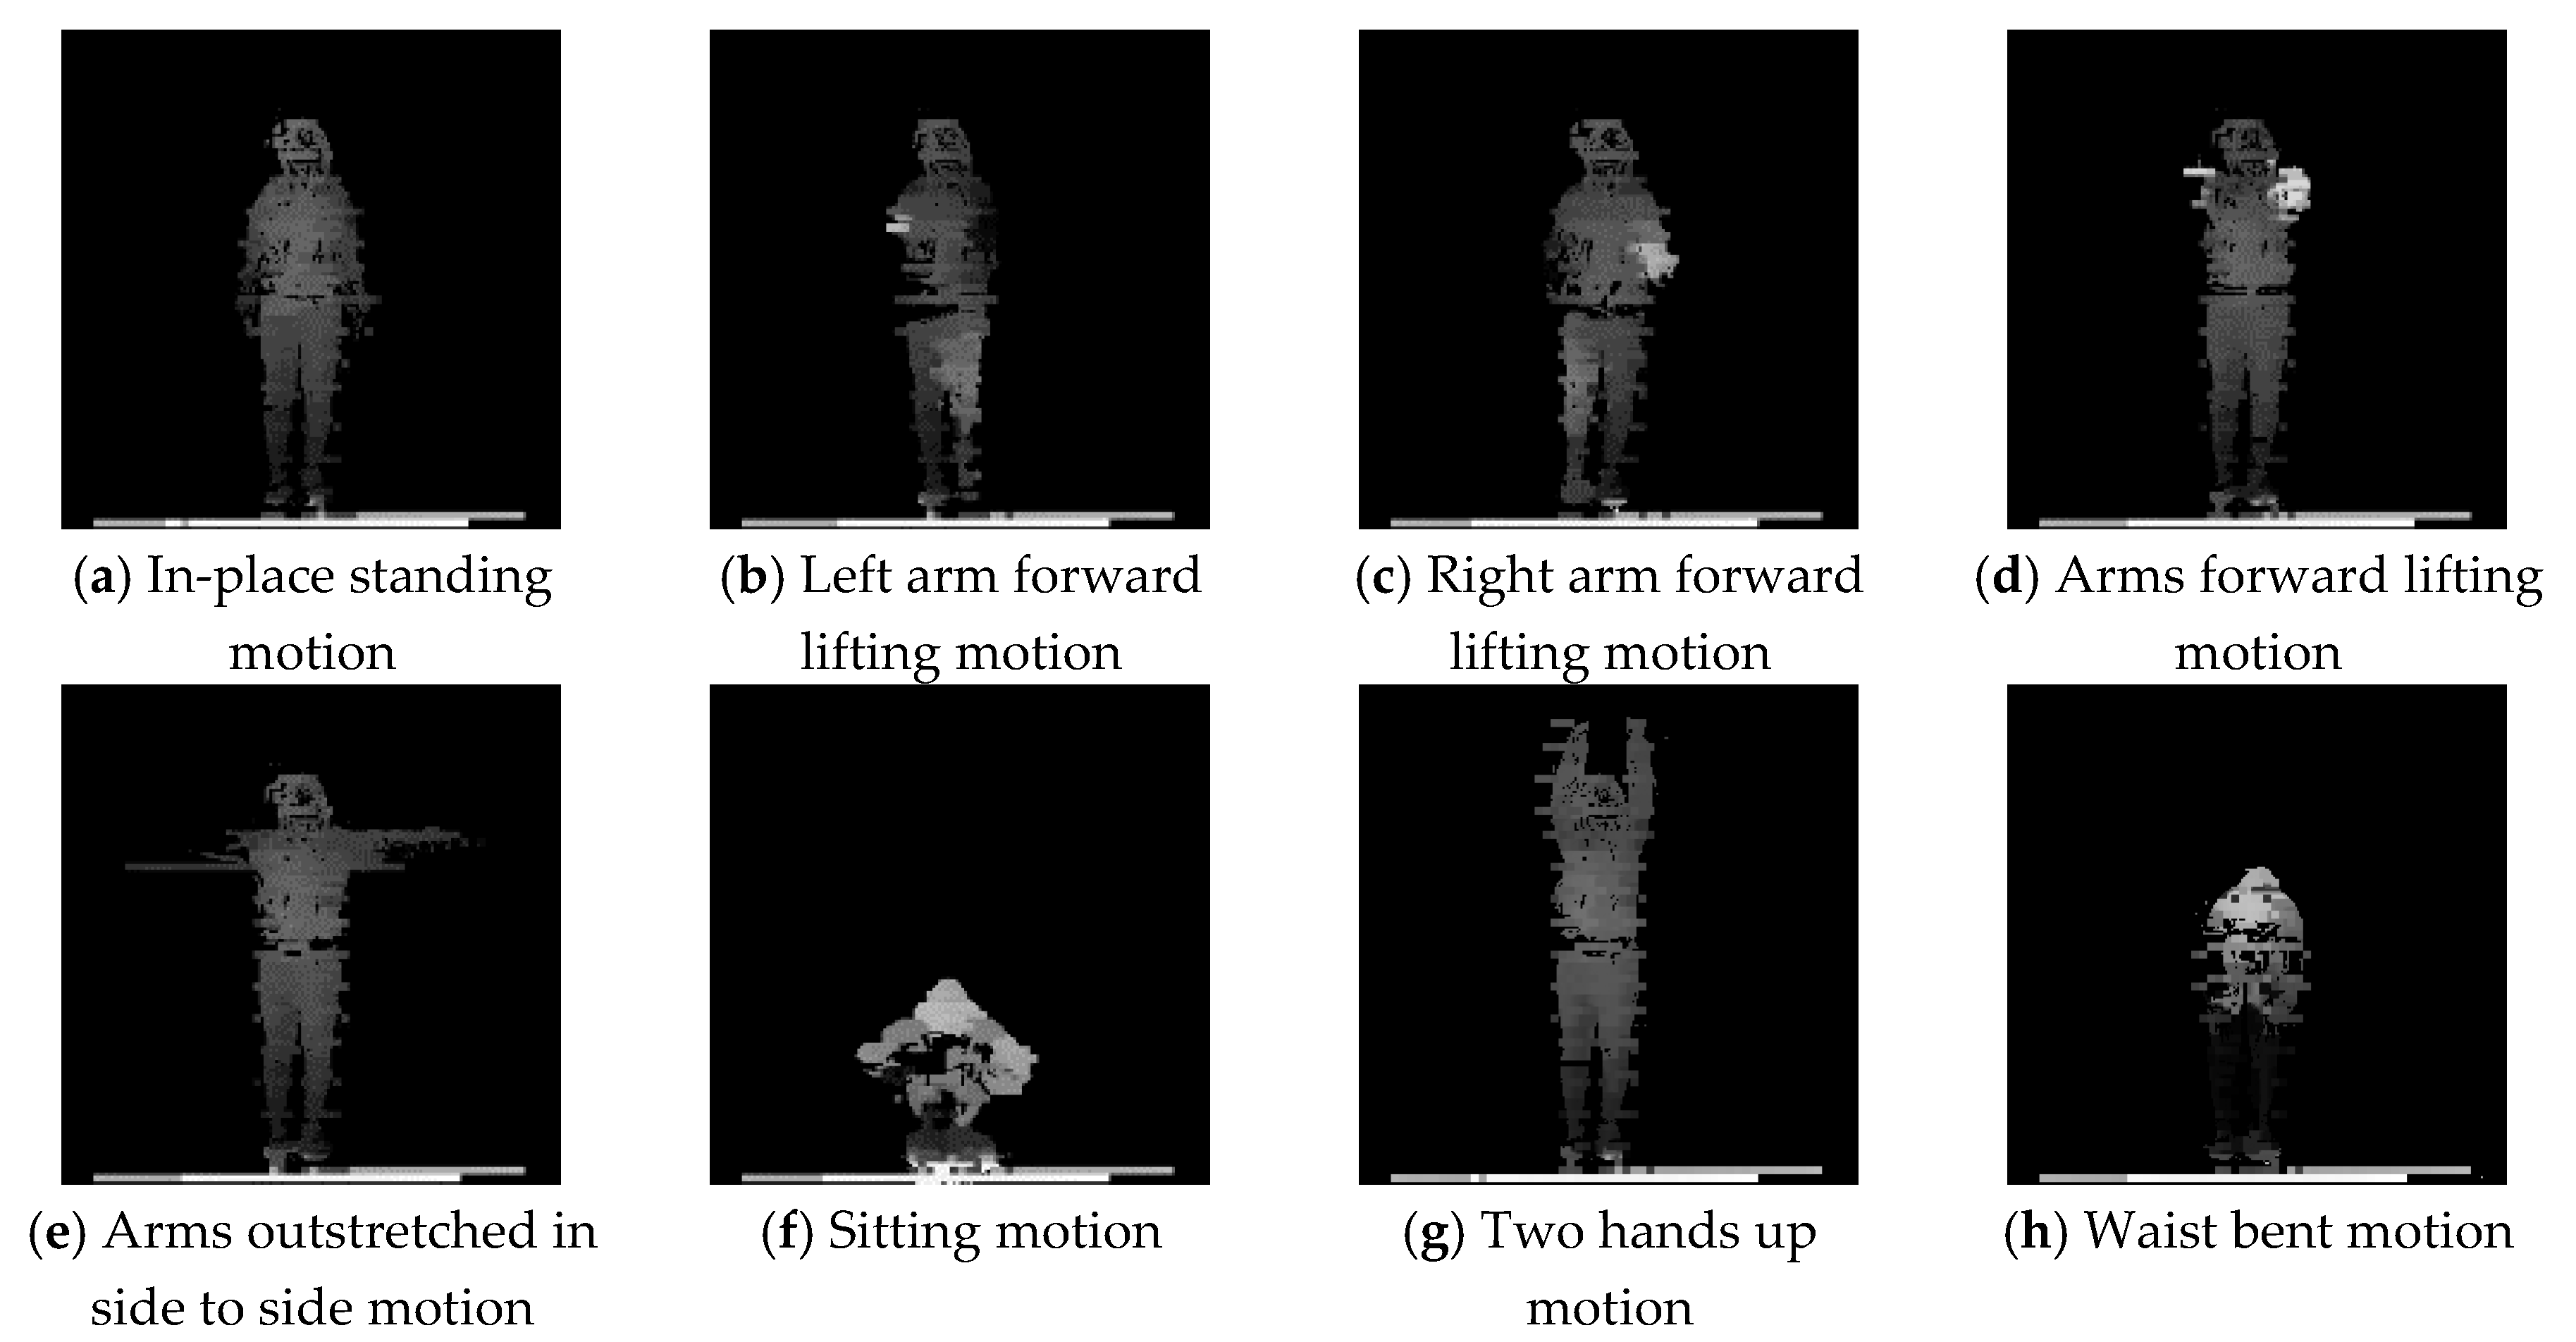
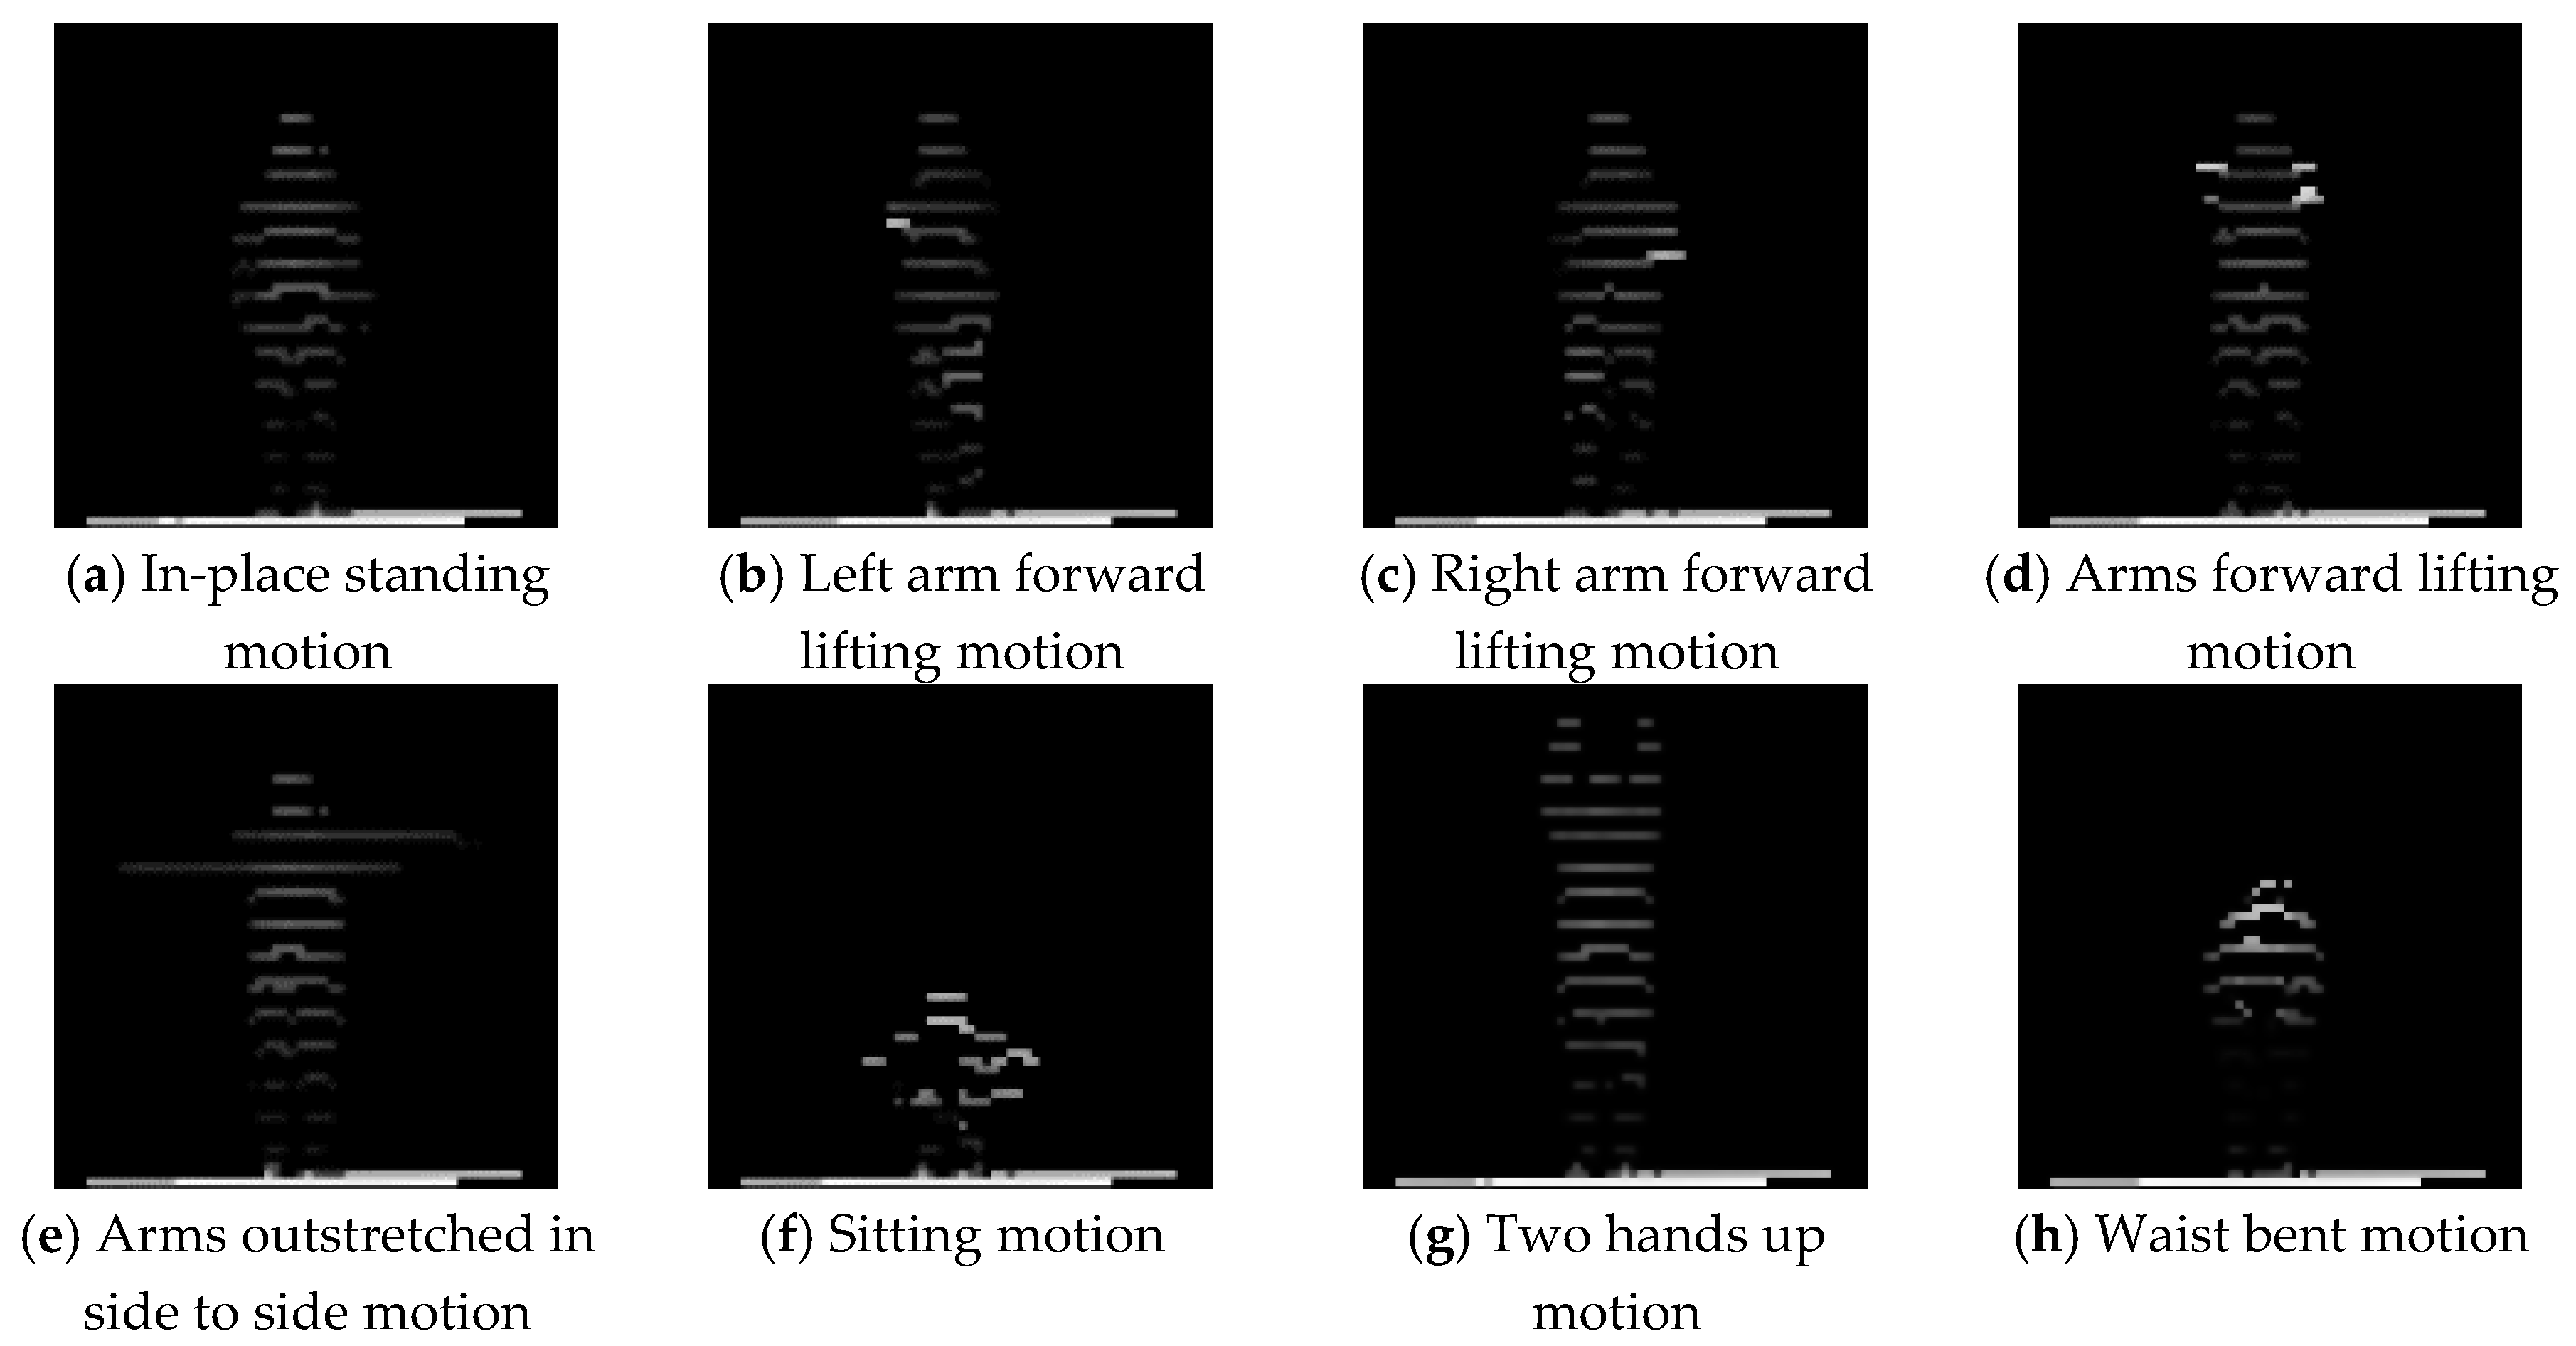
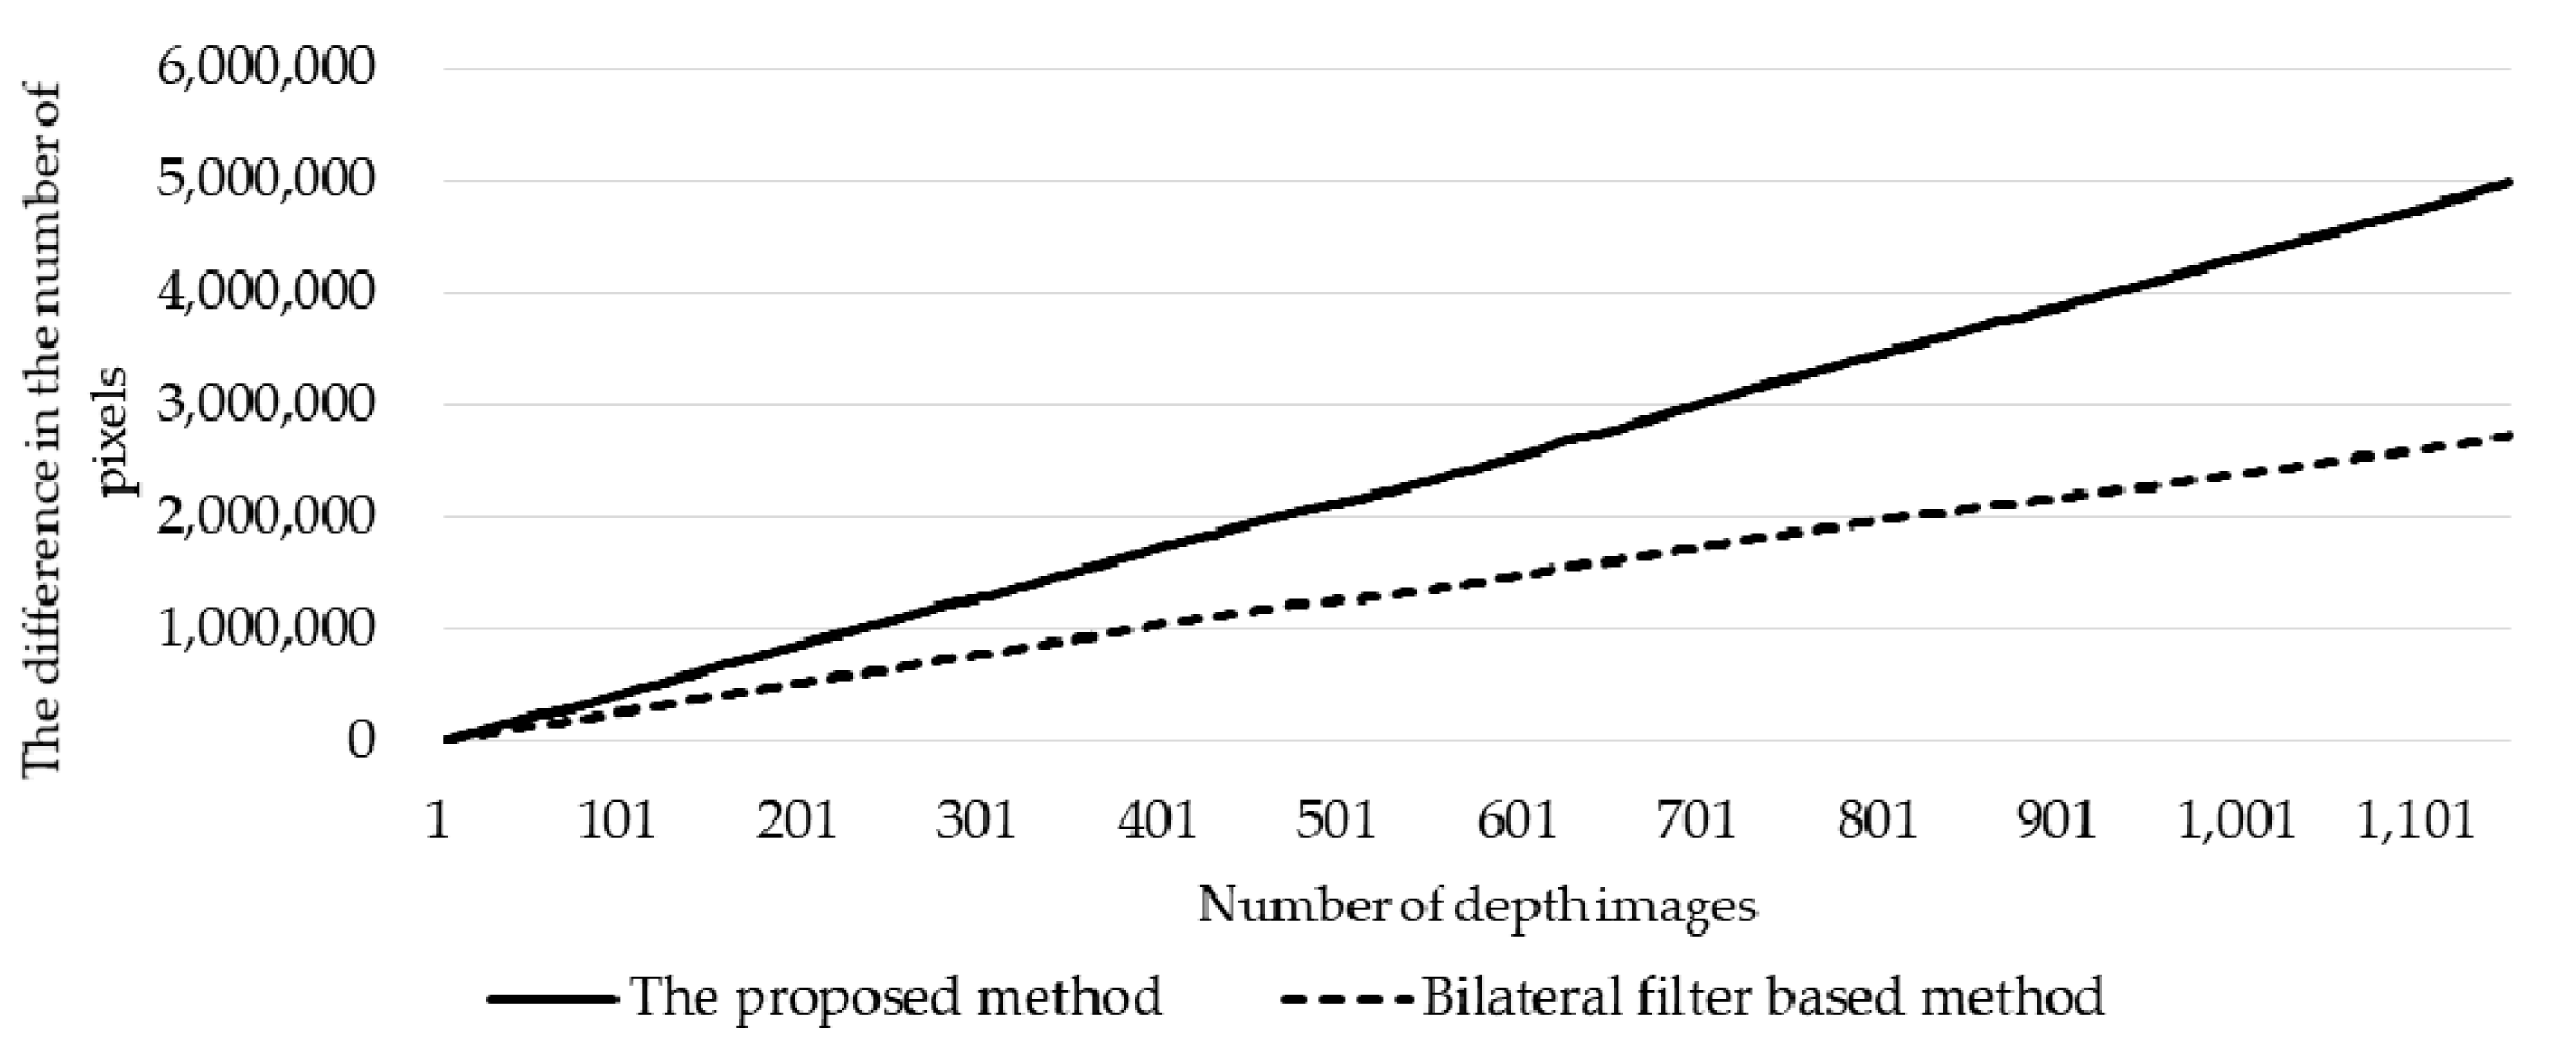
  • The up-sampling method using bilateral filtering produces a depth image dependent on the number of points in a 3D point cloud of a user’s motion. However, the proposed method reduces the dependency on the number of points of a 3D point cloud. Hence, the depth image better represents the boundary of the user’s motion. The depth image can be generated by removing the disparities of a 3D point cloud.
The remainder of this paper is organized as follows: Section 2 describes a method for extracting landmarks and generating a depth image. Section 3 introduces a system for generating automatic 3D landmarks using an encoder–decoder model with depth images and RGB images. Section 4 describes the validation of the proposed method using 3D point clouds and RGB images collected from the user’s motions. Finally, Section 5 provides conclusions.

2. Related Works

This section introduces methods for extracting landmarks using supervised learning and unsupervised learning. Up-sampling methods for generating depth images by correcting disparities between 3D point clouds are also explained.

2.1. Landmark Extraction Using Supervised Learning

The deep learning model analyzes RGB images and provides 3D poses of the user’s motions [10,11]. A 2D pose is calculated by a pre-trained deep learning model using the RGB image. 3D poses are obtained by converting 2D poses to 3D one through epipolar geometry [10]. The 2D pose is converted into a 3D pose by a trained deep learning model [11]. A study evaluated whether the 3D poses of the user’s motions obtained by the deep learning model are actually representative of the user’s motions, and thus, confirmed that useful 3D poses are provided [19]. An encoder model is trained to extract pose, boundary, and camera parameters of an RGB image. By using the extracted parameters, a 3D pose including the user’s appearance is generated. The actual user’s 3D poses and the generated user’s pose are compared by a discriminator to determine whether the actual user can express it. However, to train a deep learning model that extracts 3D poses, a dataset that provides 3D poses for RGB images is required. If only RGB images are used, the 3D pose for the boundary of the user’s motion cannot be predicted reliably.
To consider the boundary of the user’s motions by analyzing 3D point clouds [20,21], a collection of them is used to infer 3D landmarks with a deep learning model. The 3D landmarks are provided by inputting the 3D point cloud into the trained deep learning model, and, to reduce the noise, it is possible to train the 3D point clouds by preprocessing them and generating voxels. However, if no part of the 3D point clouds depicts the user’s motions, it is impossible to infer and identify 3D landmarks.
A dataset that provides 3D landmarks by analyzing in advance RGB images or 3D point clouds is required. To collect datasets that provide 3D landmarks of a user’s motions, manual supervision and a motion capture device are needed.

2.2. Landmark Extraction Using Unsupervised Learning

There are methods that use two RGB images for automatically extracting 2D landmarks without manual supervision [13,14]. 2D landmarks are obtained by extracting the features of the RGB image using an encoder–decoder model. The encoder extracts the features of an RGB image, and the decoder generates another reconstructed RGB image using the features extracted from the encoder model; thus, 2D landmarks are obtained using the features extracted from the encoder model. The trained decoder model can provide RGB images suitable for the user’s motion based on the features extracted from the encoder. However, if only RGB images are used, the boundary of the user’s motion cannot be considered, and 3D landmarks are not provided.
There is a method providing 3D landmarks from the analysis of 3D models [22]. The method involves changing the camera perspective based on the 3D models, thereby providing a depth image of the 3D models. By sampling the depth image, 3D landmarks are specified for the appropriate portions of the 3D model. In a real environment, however, 3D models cannot be provided, and 3D landmarks are assigned even though the 3D models are not completely constructed. The 3D landmarks are extracted using the 3D model for an RGB image [23]. However, a 3D model of the RGB image must be provided in advance.
There is a need for a method for measuring the boundary of a user’s motions in real-time and providing 3D landmarks without manual supervision. The method must take into account the boundary of the user’s motions without 3D models of the RGB images.

2.3. Depth Image Generation Using Up-Sampling

To solve the problem of disparities in the 3D point cloud, some methods consider the external features of objects by generating depth images [15,16,17]; here, up-sampling is performed using bilateral filtering to generate depth images. By using bilateral filtering, the depth value, which is not measured, is predicted using the surrounding pixel information. However, if the point density of the 3D point cloud collected during the up-sampling process is limited, the collected 3D point cloud may exhibit areas in which data are not available. In addition, the performance of the up-sampling may vary depending on the number of points in the 3D point cloud collected. When up-sampling is performed, detail may be lost, and some features may not be represented. Thus, there is a need for a up-sampling method that is not sensitive to the number of 3D point clouds collected.

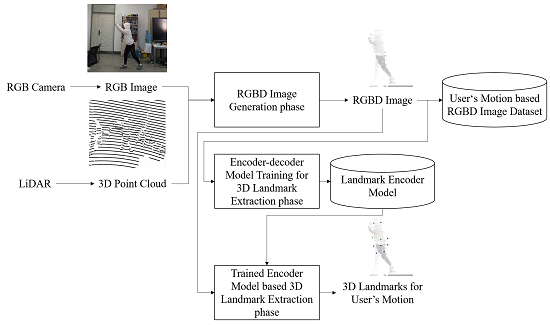
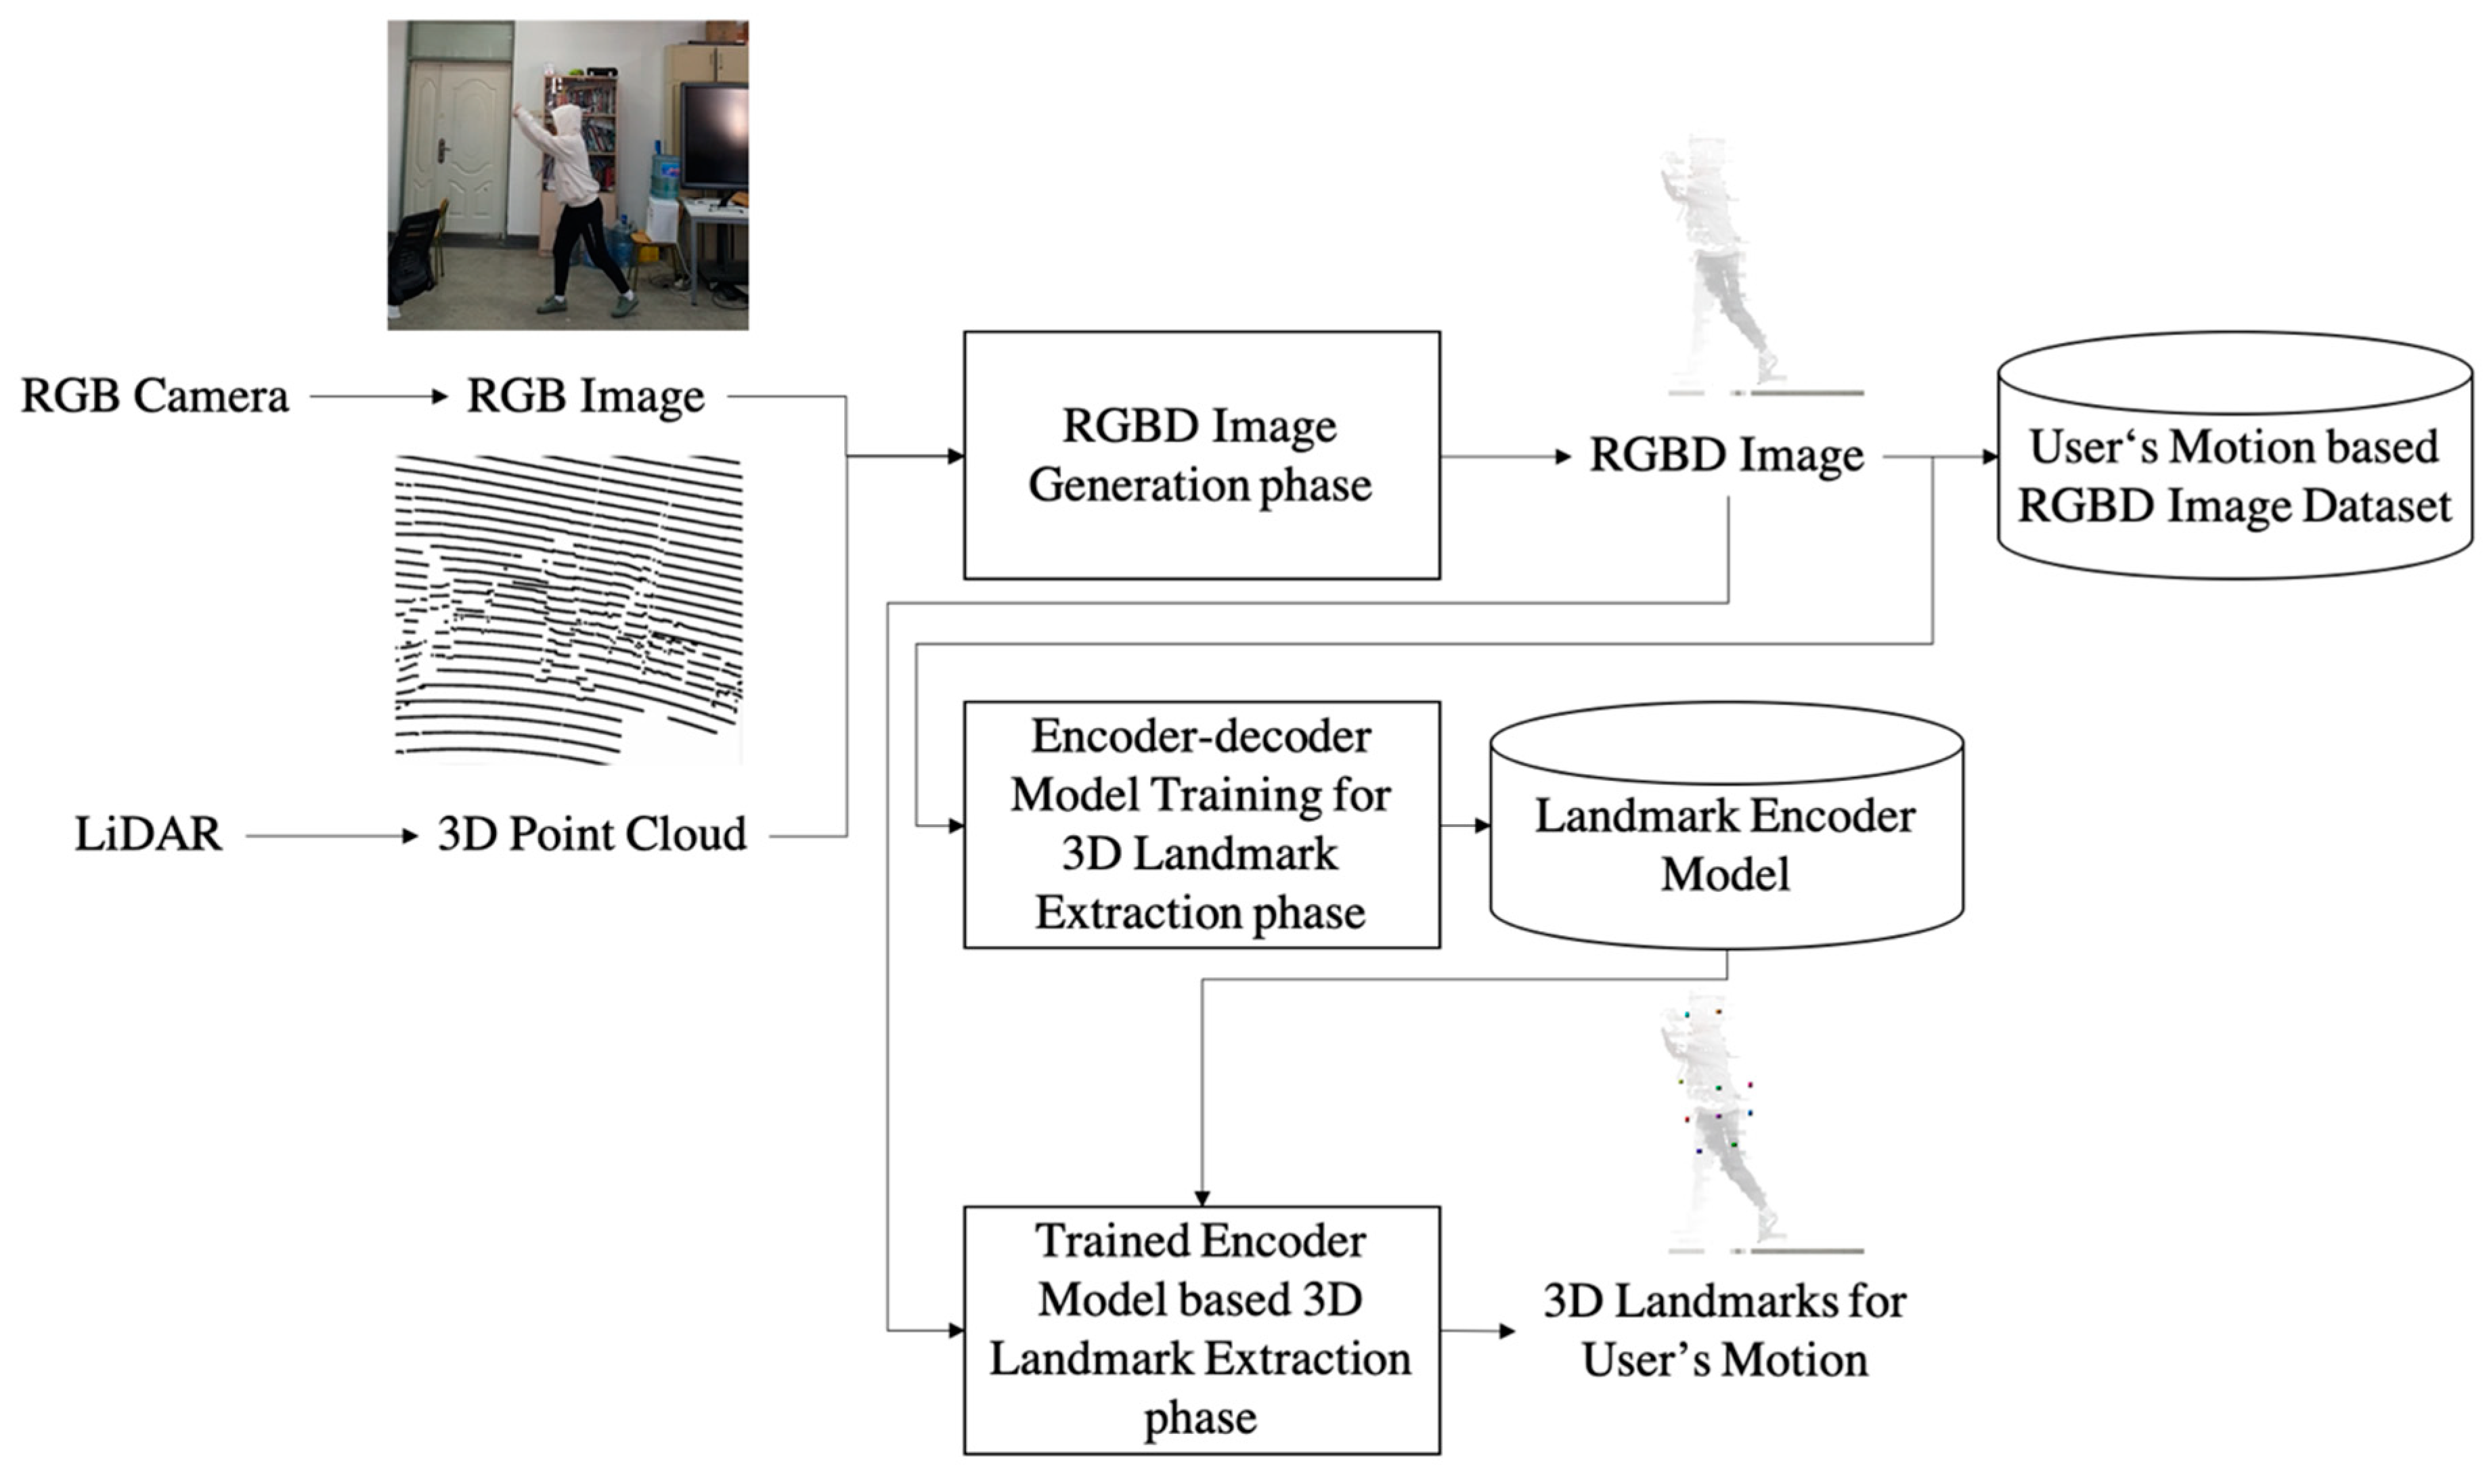
3. Encoder–Decoder-Based 3D Landmark Automatic Extraction System using 3D Point Clouds and RGB Images

This section describes a system for automatically extracting 3D landmarks of user’s motions based on 3D point clouds and RGB images. A boundary is used to represent the user’s appearance, such as the user’s clothing, hands, and head. A depth image provides the boundary of the user’s motion, and the depth image is generated from the collected 3D point cloud and the difference image generated from the background image and collected RGB image. An RGB depth (RGBD) image is generated to extract 3D landmarks from the generated depth image and the collected RGB image. An improved encoder–decoder model is trained for extracting 3D landmarks using the generated user’s RGBD images. 3D landmarks for user motions are extracted based on the trained encoder model and using the RGBD images.

3.1. Overview

The process of extracting 3D landmarks for user motions using 3D point clouds and RGB images from a LiDAR and an RGB camera is shown in Figure 1. In RGBD Image Generation phase, an RGBD image, including the user’s image and the user’s boundary, is generated. To generate the RGBD image, a depth image is generated representing the user’s boundary; this is based on a 3D point cloud collected with the LiDAR and utilizes the user’s RGB image collected with the RGB camera. When generating the depth image by up-sampling the 3D point cloud, some disparities are rectified; however, there is a limit in the improvements with the LiDAR measurement method. The depth image is generated using an RGB image to correct the disparities of the 3D point cloud.
In the Encoder–Decoder Model Training for 3D Landmark Extraction phase, an improved encoder–decoder model is trained using the generated RGBD images. In the previous encoder–decoder model [14], 2D landmarks were extracted using RGB images; here, the model is improved to extract 3D landmarks by inputting RGBD images.
In Trained Encoder Model based 3D Landmark Extraction phase, 3D landmarks of the RGBD image generated using the trained encoder are extracted. The depth value of the RGBD image is used to extract the 3D landmarks by using the coordinates of landmarks in the RGBD image based on the trained encoder. The 3D landmarks are provided for recognizing a user’s motions.

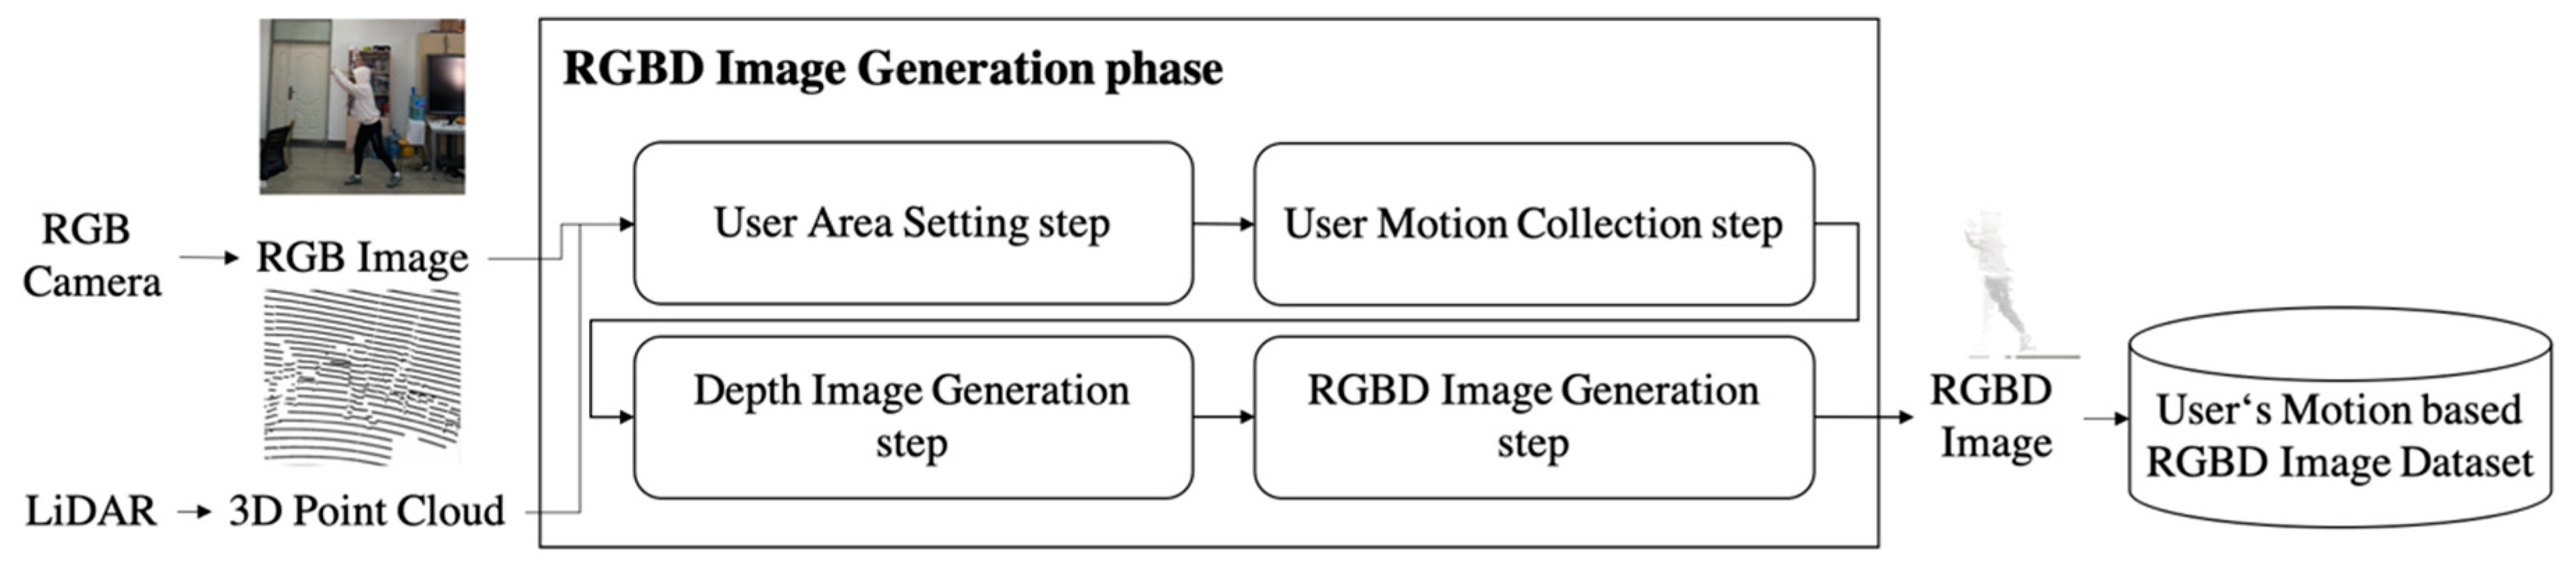
3.2. RGBD Image Generation Phase

In RGBD Image Generation phase, a method for generating an RGBD image using a 3D point cloud and an RGB image is described in Figure 2. In User Area Setting step, the space in which the user exists in the 3D point cloud is set. The RGB camera and LiDAR are fixed and placed in front of the user to shoot the user as shown in Figure 3. The 3D point cloud is collected as the distance to the object is measured the LiDAR by using laser irradiation and reflection. The 3D point cloud in the 3D space where the user is located is collected. The area of the 3D space in which the user is located is defined with variables x m i n , x m a x , y m i n , y m a x , z m i n , and z m a x . In the 3D point cloud, x m i n , x m a x   represents the size of x ;   y m i n , y m a x represents the size of y; and z m i n , z m a x represents the size of z. ( x m i n , x m a x ) and ( y m i n , y m a x ) are the same as the area of a 2D image captured with the RGB camera. The background image of the environment in which the user is located is defined as Background Image I b , and this is recorded to extract the image of the user.
In User Motion Collection step, a 3D point cloud and an RGB image are collected. Based on the LiDAR, a user’s 3D point cloud is defined with Points P t composed of P t = [ P t , 1 ,   P t , 2 , ] . One point in the 3D point cloud is defined as Point P t , 1 , and P t , 1 is recorded with LiDAR as a 3D position and has the components P t , 1 = [ p t , 1 , x ,   p t , 1 , y ,   p t , 1 , z ] . In the 3D point cloud collected from the LiDAR, a 3D point cloud in the 3D space defined with x m i n , x m a x , y m i n , y m a x , z m i n , and z m a x is stored as the set of P t . The RGB image is defined and stored as Image I t and collected by photographing the user with the RGB camera. In this paper, the 3D point cloud and RGB image were collected after appropriate calibration [24]. Because the positions of the LiDAR and RGB camera are different, the collected 3D point clouds and RGB images are modified so that measurements at the same position are obtained. In addition, because the collection time for each sensor is different, it was synchronized.
In Depth Image Generation step, a depth image is generated from the 3D point cloud and the difference generated from the RGB image as shown in Algorithm 1. The depth image representing the boundary of the user’s motion is defined as Depth Image D t , and, because of the noise in a 3D point cloud, the size of the voxel is defined as Voxel Size θ to express it as one value. The 3D point clouds in a voxel are set identically, and it is defined as Voxel V t . V t is set based on the 3D space parameters x m i n , x m a x , y m i n , y m a x , z m i n , z m a x , and θ and V t are described as shown in Equation (1). All values in V t are set to zero. P t is found in V t , and the value of V t with the P t increases by 1.
[ v t , 1 , 1 , 1 ,   ,     v t , |   x m a x x m i n | θ + 1 , | y m a x y m i n | θ + 1 , | z m a x z m i n | θ + 1 ]
D t is calculated using V t . As shown in Equation (2), D t , x , y is set by grouping the values of z where each group has the same value of x and the same value of y, and normalizing the average of the grouped values of z from the maximum z m a x and the minimum z m i n .
D t , x , y = A v e r a g e ( v t , x , y ) z m i n z m a x z m i n × 255
The depth image generated through the 3D point cloud represents user motion; however, there are parts with disparities leading to loss of depth value. A difference image resulting from a comparison of the gray value of I b and the gray value of I t   is used to find the area where the user is located, as shown in Equation (3). The image is of the same background and depends on the user’s location or external appearance, but there may be differences in the gray values. The image resulting from the difference between the image and the background is defined and stored as Difference Depth Image D t V . When calculating D t V , a parameter for considering the noise of the image is defined as the Exception Noise ρ v . The gray values I b and I t are set to 255 if the difference is greater than ρ v , and 0 if the difference is smaller.
D t V = { i f   ( C h a n g e T o G r a y ( I b ) C h a n g e T o G r a y ( I t   ) > ρ v ) 255 e l s e                                                                                                                                                                                       0  
where ChangeToGray produces gray values by averaging red, green, and blue values. All pixel values included in the image are compared.
Any pixel in D t with value 0 and any pixel in D t V for which value was set to 255 are considered to be unknown-depth pixels d t , x , y . Consideration Count Ν is the number of peripheral depth values needed to determine the depth of the unknown-depth pixel, and the closest Ν depth values in D t are used to determine the depth value of the unknown-depth pixel d t , x , y . This process considers the distance between the pixels, as shown in Equation (4). Exception Distance ρ d is defined to avoid considering the depth when the distance between pixels is too great; if the difference between is greater than ρ d , the known pixel depth is not used to assign the unknown-depth. ρ d is set by the user’s settings. D t is added with the value of the unknown-depth Image D t .
d t , x , y = n = 1 N ( T o t a l D i s t a n c e Ν t h D i s t a n c e T o t a l D i s t a n c e × d t , x , y )
where TotalDistance is the sum of the distance differences for N nearby pixels, NthDistance is the distance difference from the nth closest pixel, and x and y are the coordinates of the nth closest pixel.
In RGBD Image Generation step, the RGBD image is generated by using an RGB image and a depth image measured from the user’s motion. An RGBD image is defined as Fusion Image C t and consists of D t and I t   , an initial setting for inputting the RGBD image to an encoder–decoder. C t combines the collected I t and generated D t provided for analyzing the user’s motion.
Algorithm 1: Pseudocode for depth image generation
FUNCTION GenerateDepthImage with P t , I t , I b
BEGIN
 SET V t ←CALL InitializeVoxel
 SET V t ←CALL AddPointsInVoxel( P t )
 SET D t ←CALL InitializeDepthImage
 FOR y←0 to height of D t
  FOR x←0 to width of D t
   SET D t , x , y = A v e r a g e ( v t , x , y ) z m i n z m a x z m i n × 255
  END
 END
 SET I t ←CALL ChangeToGray( I t )
 SET I b ←CALL ChangeToGray( I b )
 SET D t V ←CALL InitializeDifferenceImage
 FOR y←0 to height of I t
  FOR x←0 to width of I t
   IF i t , x , y - i b , x , y > ρ v THEN
    SET d t , x , y V ←255
   ELSE
    SET d t , x , y V ←0
   END
  END
 END
 SET D t ←CALL InitializeDepthImage
 FOR y←0 to height of D t
  FOR x←0 to width of D t
   IF d t , x , y is Equal 0 and d t , x , y V is Equal 255 THEN
    SET DepthValueList←CALL FindKnownDepthPixel
    SET TotalDistance←CALL CalculateTotalDistance(DepthValueList)
    FOR n←0 to N
     SET ΝthDistance←CALL CalculateNthDistance( d t , x , y )
     SET d t , x , y ←ADD T o t a l D i s t a n c e Ν t h D i s t a n c e T o t a l D i s t a n c e × d t , x , y
   END
  END
 END
 SET D t ←CALL AdddDepthImage( D t ,   D t )
 RETURN D t
END

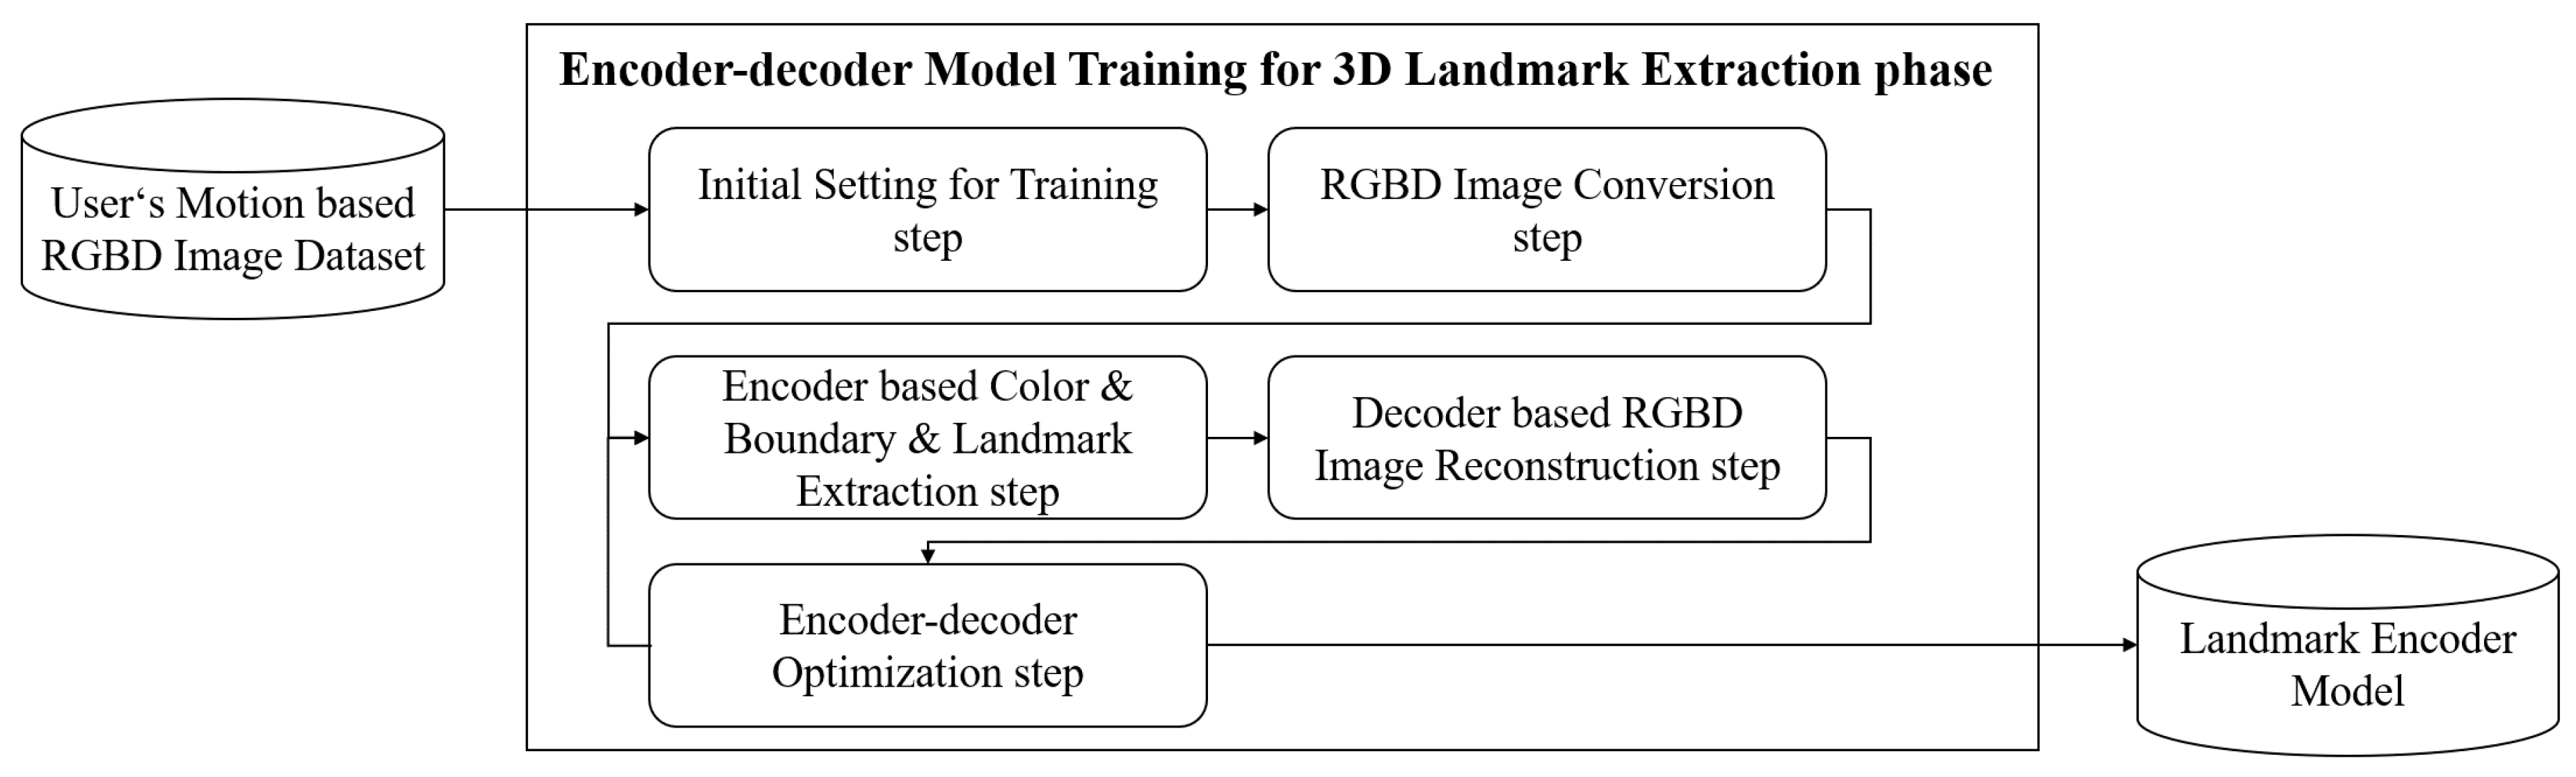
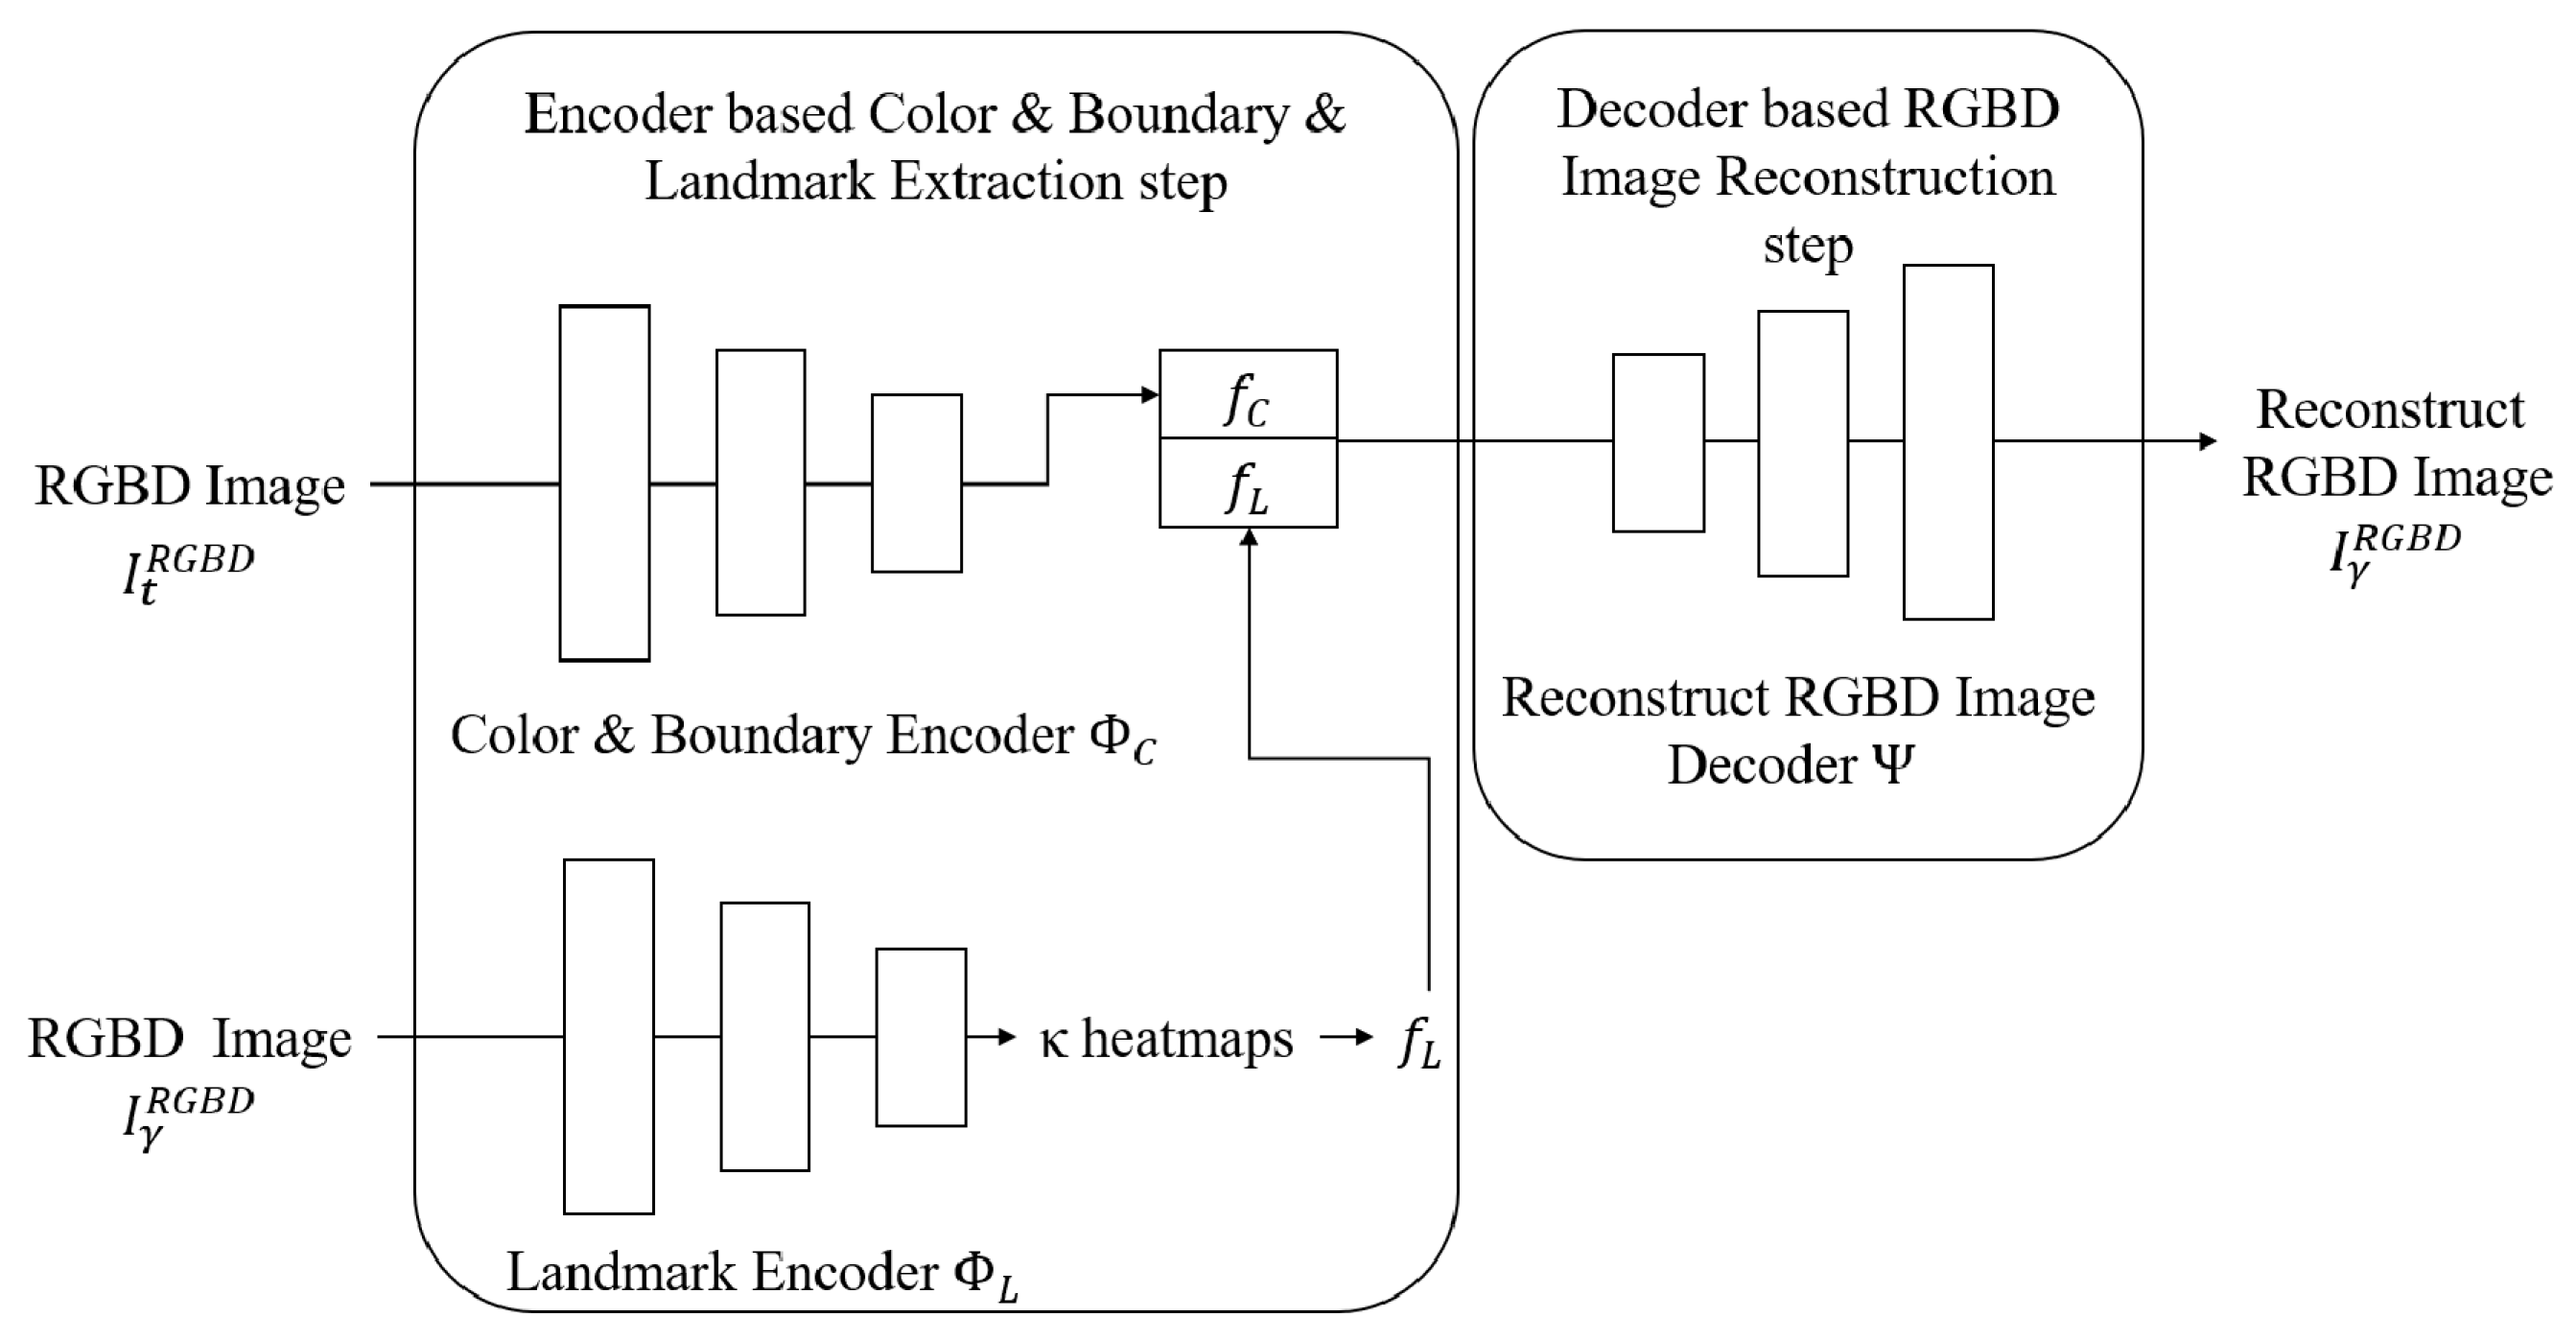
3.3. Encoder–Decoder Model Training for 3D Landmark Extraction Phase

A process for training an encoder–decoder to extract 3D landmarks for a generated RGBD image is shown in Figure 4. An earlier encoder–decoder model [14] has been improved to extract 3D landmarks using an RGBD image. In Initial Setting for Training step, an initial setting is established for inputting an RGBD image into the encoder–decoder model. The number of landmarks is defined as κ , which is the number of locations that have features for analyzing user motions. The size of the RGBD image for inputting into the encoder–decoder model is defined as size [ ε x ,   ε y ] , which is set to the input size of the encoder–decoder model.
In RGBD Image Conversion step, the RGBD image is resized for use with the encoder–decoder model. C t size is converted to the size [ ε x ,   ε y ]   of the image used by the encoder–decoder model, and the resized C t is input into the encoder of the encoder–decoder model.
In the Encoder-Based Color and Boundary and Landmark Extraction step, the features of landmark, color, and boundary are extracted from the RGBD image, as shown in Figure 5. The Color and Boundary Encoder extracts the color and boundary of the input RGBD image as shown in Equation (5), where Φ C is the Color and Boundary Encoder, and f C is a feature of the color and boundary of the user motion to be extracted. Φ C is an encoding model for extracting the feature of color and boundary using C t . C t is compressed through Φ C .
f C = Φ C ( C t )
The Landmark Encoder extracts landmarks using the RGBD image, as shown in Equation (6). Φ L is Landmark Encoder. Φ L is an encoding model for extracting landmarks using C γ . Φ C is expressed as one feature, but Φ L extracts κ features. A heatmap contains the influence of a landmark. κ heatmaps are generated through Φ L . The heatmap is a gray image of the same size as the RGBD image. A landmark is determined as the maximum value among the pixels of the heatmap. f L is a feature of landmarks set for reconstruction, and f L , κ includes the κ th feature of a landmark.
f L = F i n d M a x i m u m I n H e a t m a p ( Φ L ( C γ ) )
In Decoder-Based RGBD Image Reconstruction step, the RGBD image is reconstructed to feature the color, boundary, and features of the landmarks using the Reconstruct RGBD Image Decoder. A reconstructed RGBD image is represented as the Reconstructed Image C γ . The Reconstruct RGBD Image Decoder reconstructs C γ based on the color and boundary of an C t that will generate user motion for C γ and provides the landmarks, as shown in Equation (7). Ψ is composed of a decoder model. It trains to reconstruct C γ using the inputted features.
C γ = Ψ ( f C ,   f L )
In the encoder–decoder optimization step, the Color and Boundary Encoder, Landmark Encoder, and Reconstruct RGBD Image Decoder are optimized by comparing the reconstructed RGBD image with the original RGBD image. The encoder–decoder is trained to minimize the difference between the two RGBD images ( C γ ,   C γ ) . If the learning rate is greater than the set learning rate or the training progress is completed, the Color and Boundary Encoder model, Landmark Encoder model, and Reconstruct RGBD Image Decoder model are stored. If not, the process loops back to the Color and Boundary and Landmark Extraction processes.

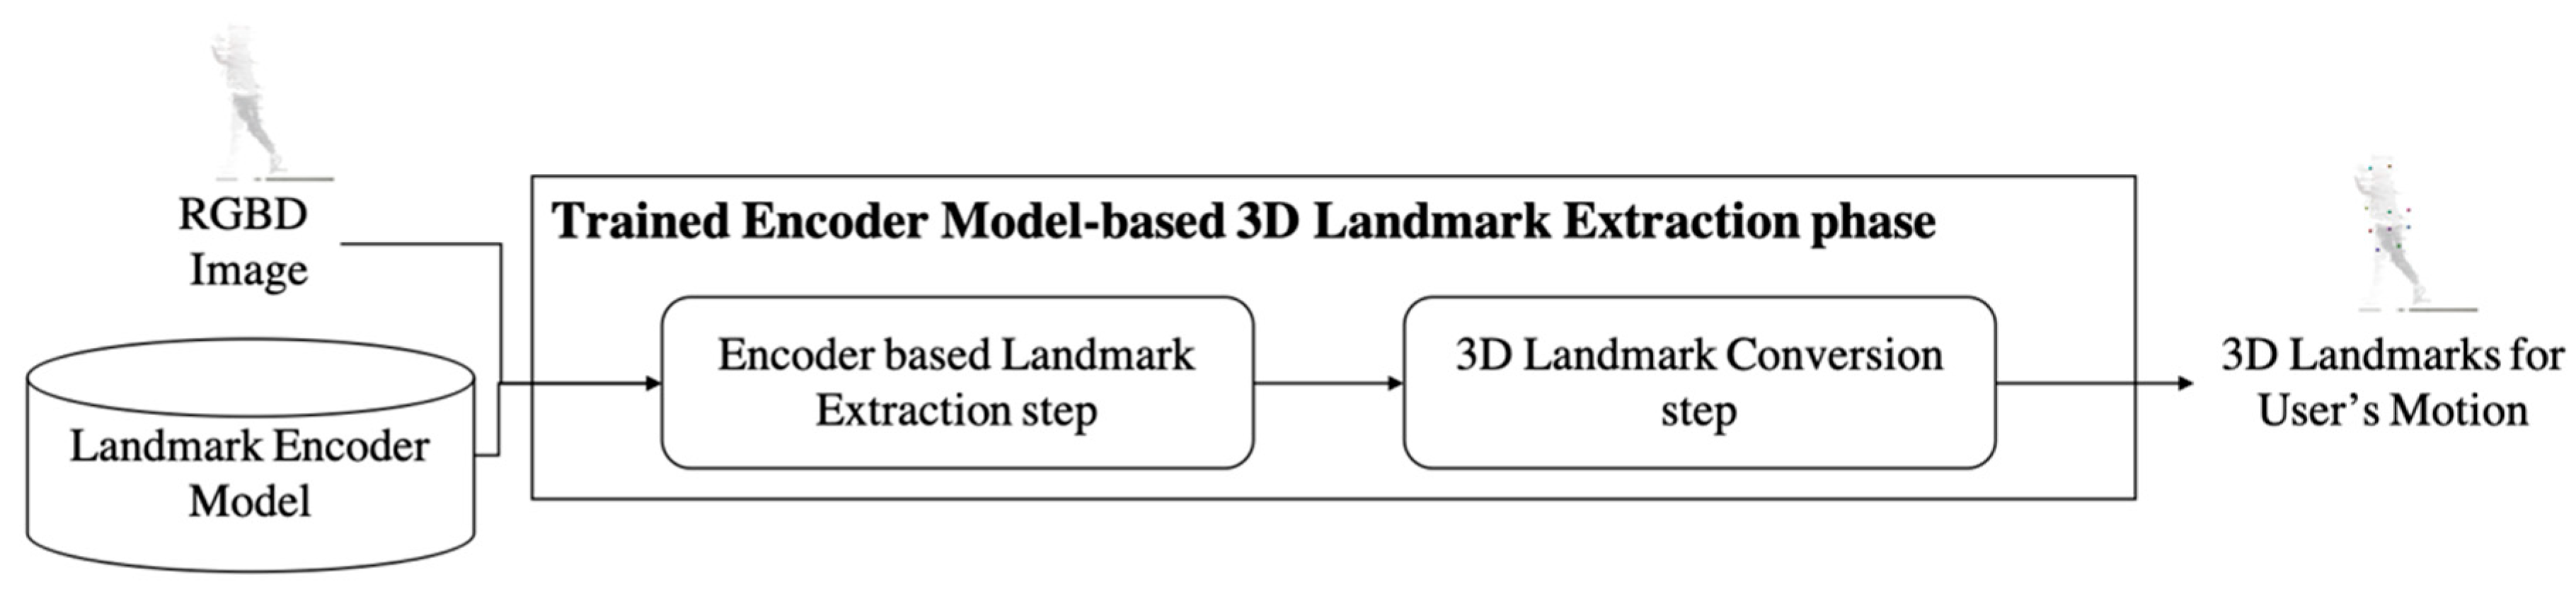
3.4. Trained Encoder Model-Based 3D Landmark Extraction Phase

The process of automatically generating 3D landmarks using the trained Landmark Encoder model and an RGBD image is described in Figure 6. In the Encoder-Based Landmark Extraction step, the landmarks for RGBD images are extracted using the trained Landmark Encoder model. Equation (6) is used to extract the calculated feature of landmarks f L for the pixels with the maximum values in the κ heatmaps.
In 3D Landmarks Conversion step, 3D landmarks are converted using a feature of the landmarks extracted by the Landmark Encoder model. The depth value for the image is used in the RGBD image to convert the value of z for the added 3D landmarks using a feature of landmarks f L . A κ th 3D landmark is defined as the 3D Landmark P t ,   κ L and uses the same coordinate system as in the 3D point cloud. As in Equation (8), the feature of landmarks f L is configured as a 3D landmark.
P t ,   κ L = [ | x m a x x m i n | × f L , κ , x ε x ,   | y m a x y m i n | × f L , κ , y ε y ,   | z m a x z m i n | × D t , x , y 255   ]
where x, y is a location in the image with the maximum value of the pixel at f L , κ .

4. Experiments

In this section, 3D point clouds collected by a LiDAR and the RGB camera images are evaluated for extracting 3D landmarks without manual supervision. The LiDAR and the RGB camera were used to collect the user’s motions, and the RGBD image was generated by using the collected 3D point cloud and RGB image. An encoder–decoder model used to extract 3D landmarks using RGBD images is introduced here and the training results are explained. The results obtained in extracting 3D landmarks with the trained encoder are also presented.

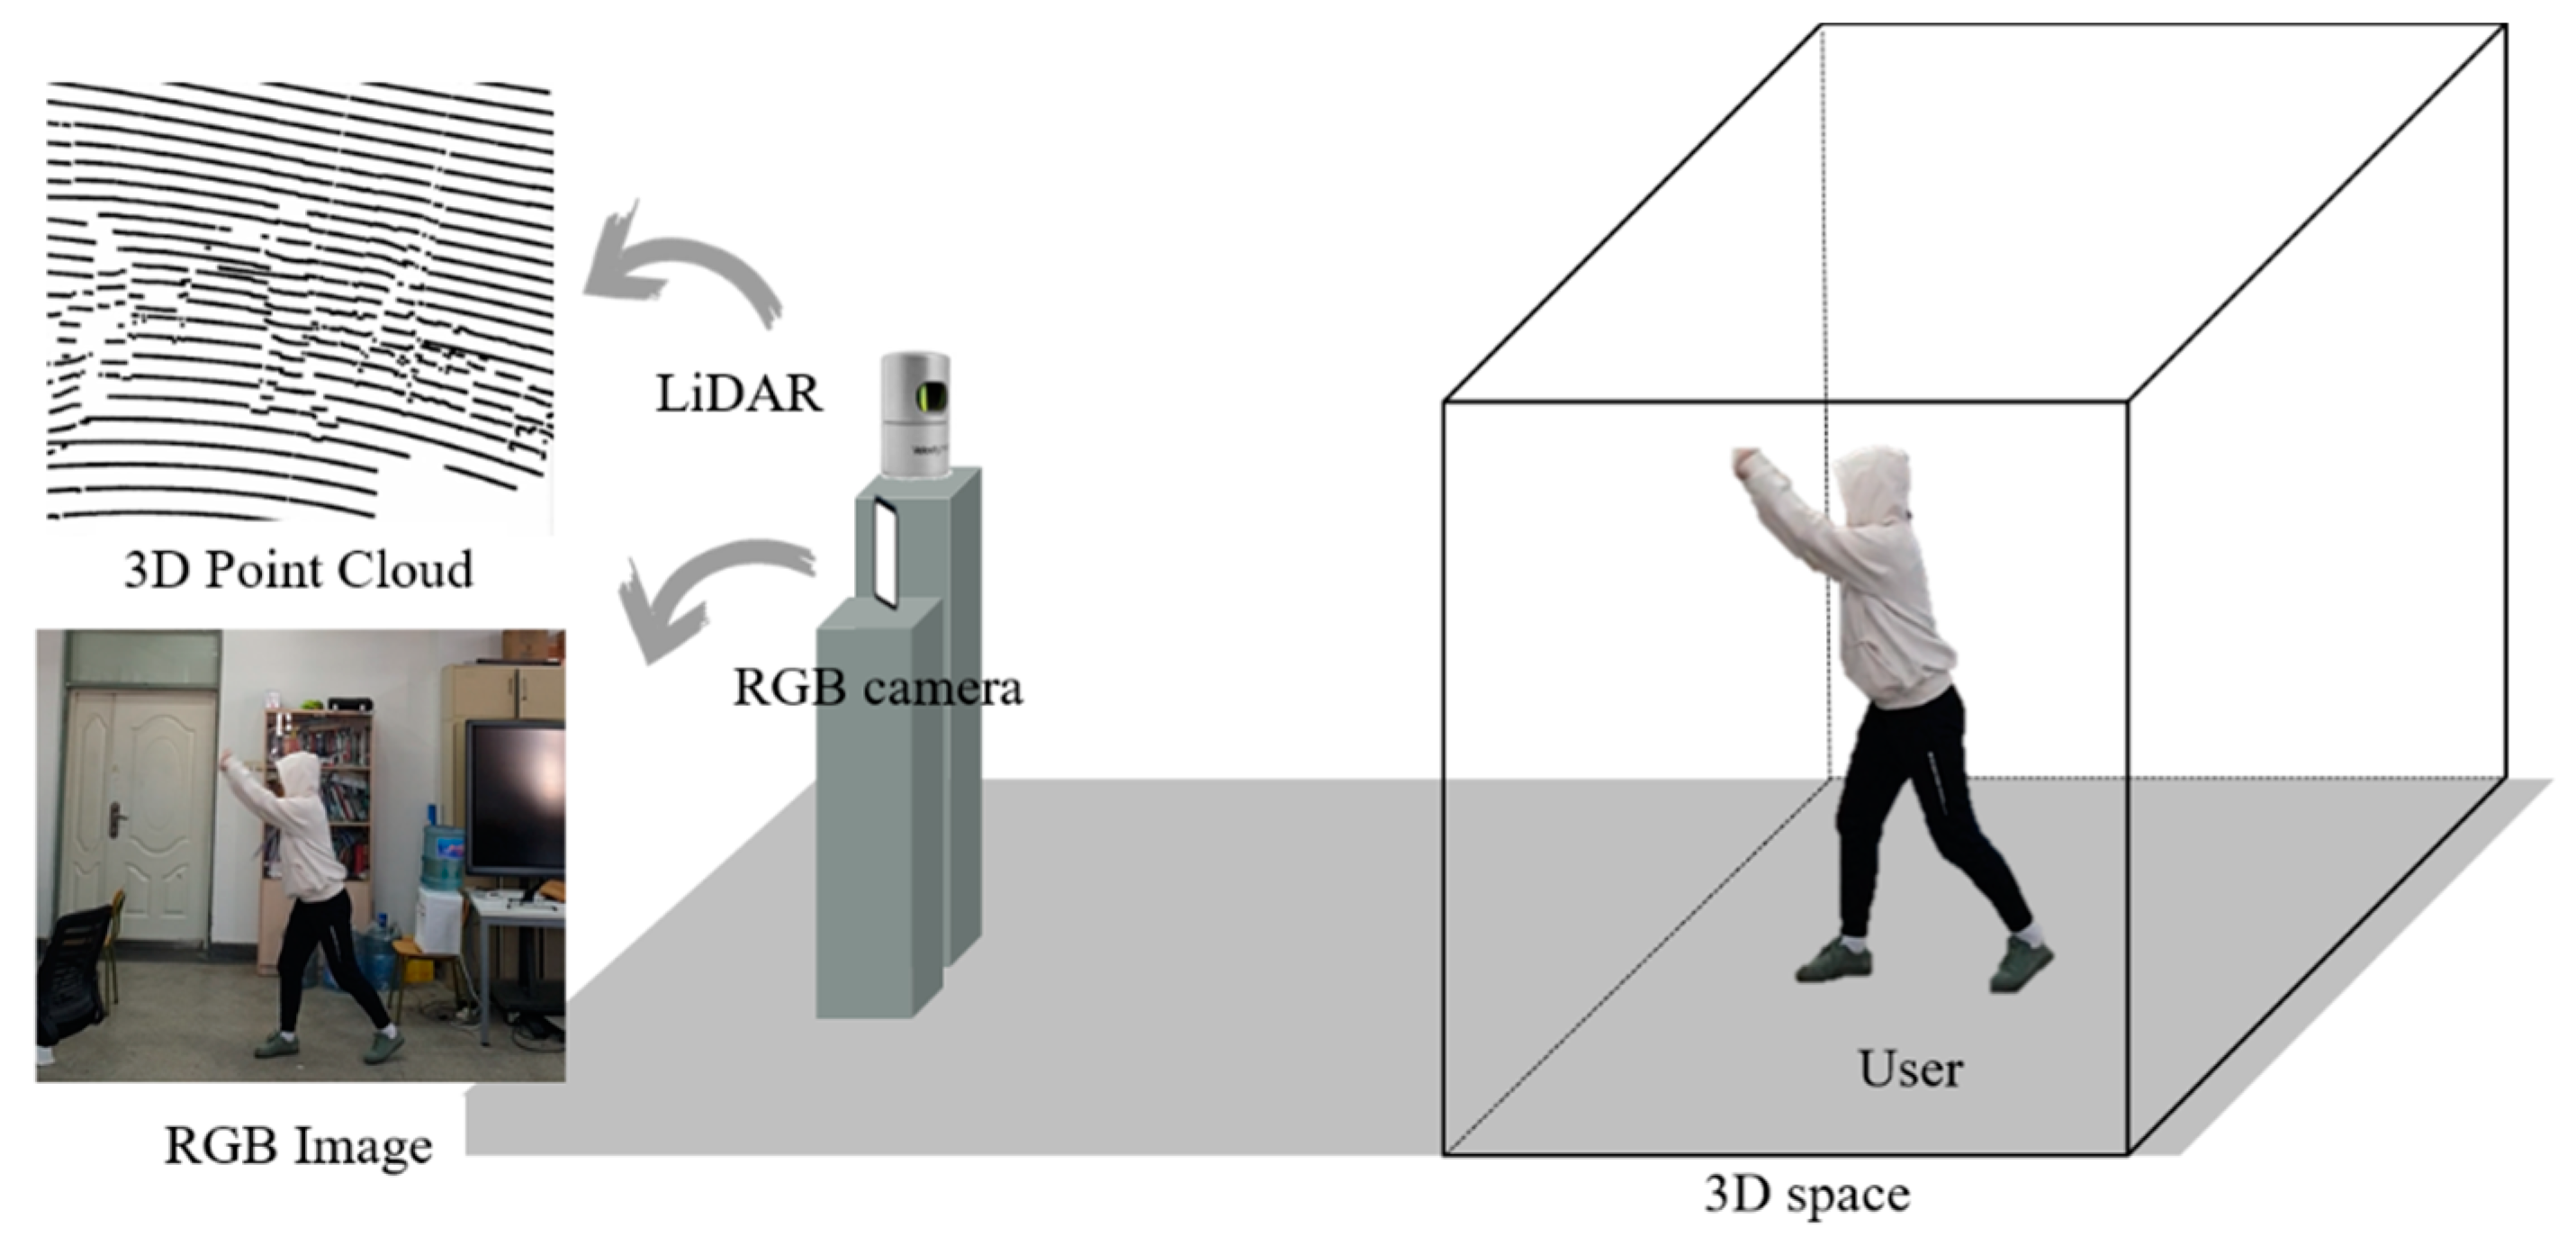
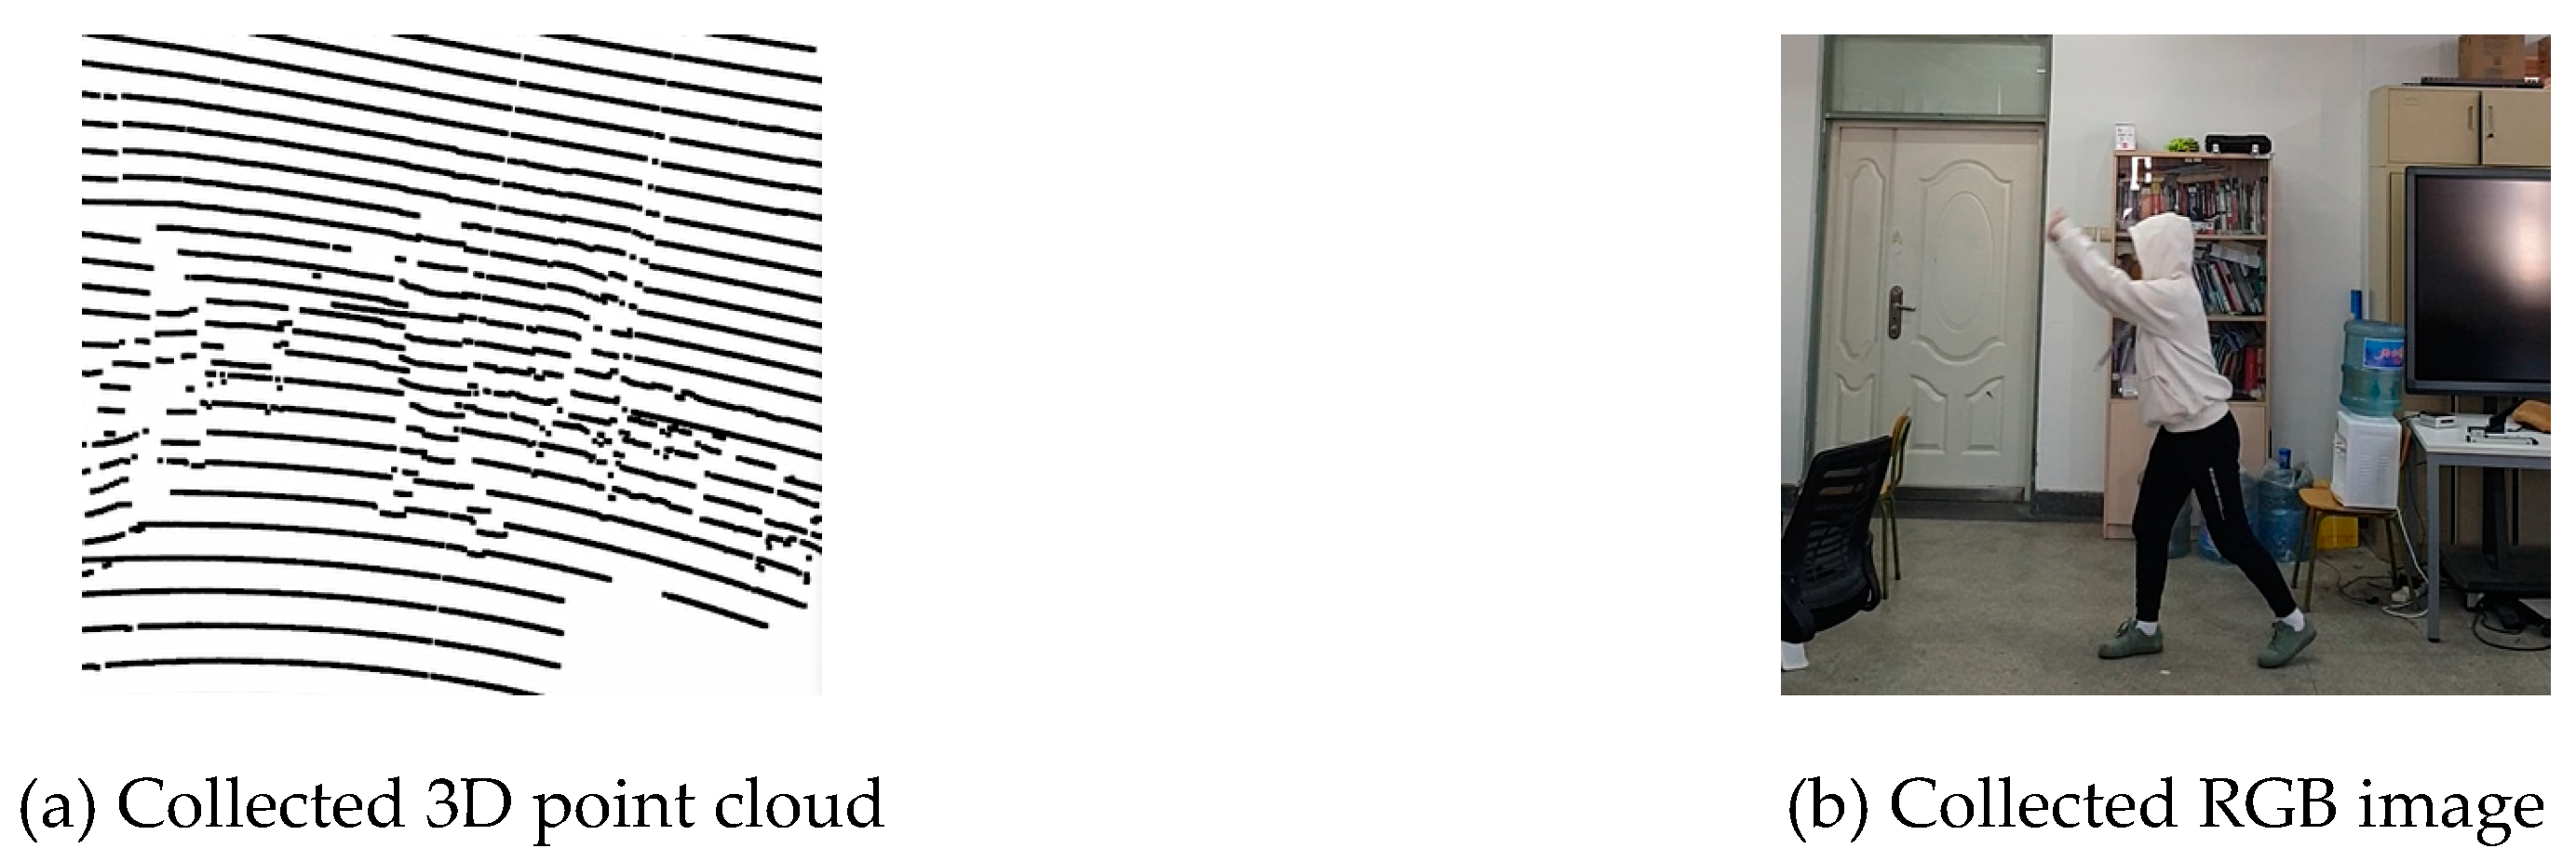
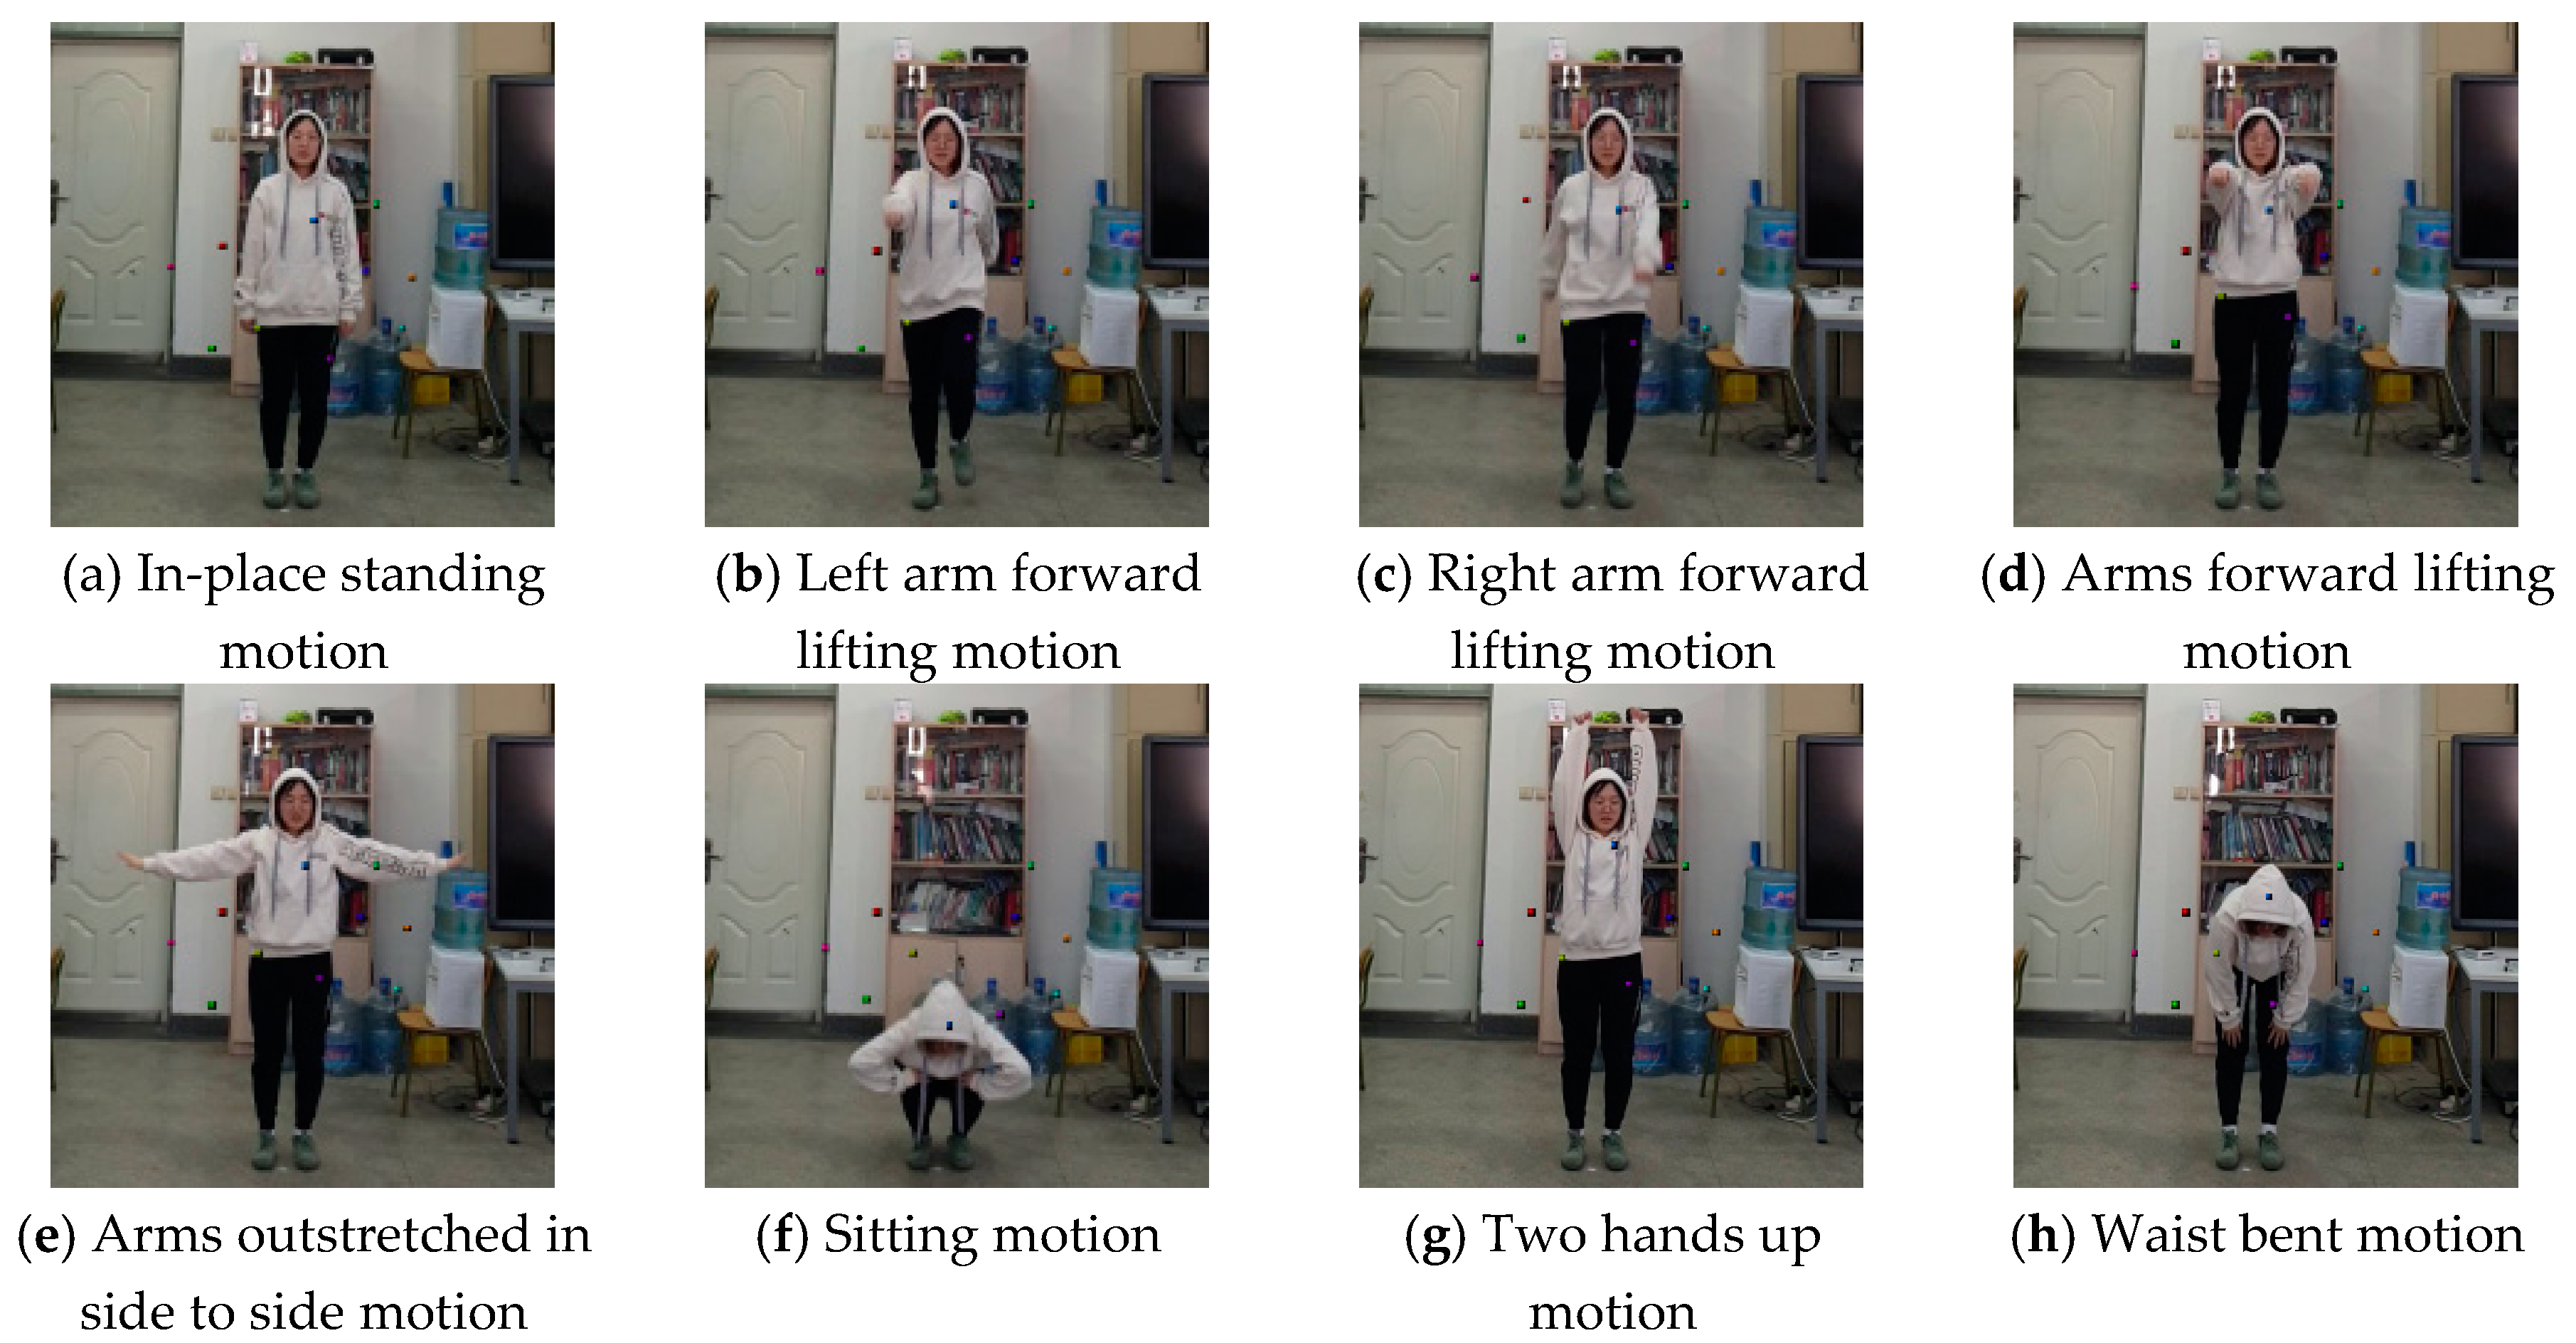
4.1. Experimental Environment and 3D Point Cloud and RGB Image Acquisition Results

To measure the user’s motion, a LiDAR was used to collect 3D point clouds using an HDL-32E sensor, and RGB images were collected with the RGB camera of a Galaxy S9 plus. The LiDAR and the RGB camera photographed the user’s motion at the height of 1.5 meters; the user’s entire body was photographed as long as a separation distance of at least 6 m was maintained, and the distance between the user and the LiDAR and RGB camera was measured to be approximately 7 m in this experiment. The 3D point cloud measured by the LiDAR has a problem in that the LiDAR cannot measure all the user’s motions. The collected 3D point cloud provides only the body parts of the user close to LiDAR.
The user’s motion was collected during the process of the Korean National Gymnastics event. The 3D point cloud and RGB image are shown in Figure 7, and the user’s motion was measured by the LiDAR’s 13 laser sensors. The distance between the points in the user’s motion measured by different laser sensors is approximately 10 cm. During the National Gymnastics event, a user’s motion within 1 meter of the starting position was performed. A total of 1150 training 3D point clouds and images were collected while the user participated in the Korean National Gymnastics event.

4.2. RGBD Image Generation Phase Results

Figure 8 shows the depth images projected on the x-y plane based on the value accumulated in a voxel in a 3D point cloud in the user’s space. The depth image was white when the body was close to the LiDAR, and black when the body was far. The 3D point clouds could estimate the boundary of the user’s motions. In most users’ motions, about 13 laser sensors of LiDAR measured the user’s motion as shown in Figure 8a–e. In Figure 8e, only one laser sensor of LiDAR was used. When the user’s body has the smallest motion as shown in Figure 8f, about 5 laser sensors of LiDAR were used. When the user’s body has the largest motion as shown in Figure 8g, about 16 laser sensors of LiDAR were used. As shown in Figure 8h, 10 laser sensors of LiDAR were used to collect 3D point cloud. The number of laser sensors of LiDAR used depends on the user’s motions.
To calculate the different images, a background image of the environment in which the user would be present was collected in advance. The differences between the background image and the RGB images are shown in Figure 9. As shown in Figure 9e, the image of the user’s body was not extracted where the color of the user’s clothes was similar to the background image. The color of the right arm of the user had a background color similar to that of the user’s clothes; therefore, the difference image was not properly extracted. A change in lighting similar to the shadow generated by the user’s body, as shown in Figure 9f, caused a difference even in the absence of a user. In the proposed method, depth image was a dependence on the result of the difference image. There is a need for an improved method for stably extracting difference images.
The improved depth images using the difference images are shown in Figure 10. To calculate the depth value of a pixel in the difference image, the nearest 4 pixel values for the depth image generated by a 3D point cloud were used. When the distance between the nearest 4 pixels from the difference pixel was 7 or more, the other pixels’ depths were not reflected. Owing to the difference in lighting, it was possible to remove the pixel as the difference if it was located outside the user’s location. As shown in Figure 10e, the part where the difference image was not extracted could not be corrected. Correction was possible only when four or more pixels had depth values in all directions of the pixel to be corrected. When too few 3D point clouds were provided, correction could not be performed.
The depth image generated by up-sampling based on bilateral filtering [16] is shown in Figure 11. To up-sample the 3D point cloud-based depth image, the bilateral filter’s diameter was set to 7. Up-sampling with bilateral filtering could not distinguish the user’s body because of the spacing between the unmeasured parts. When comparing the voxel-based depth image of Figure 8 with the depth image of Figure 11, the actual measured depth value became dark because of the depth value of the unmeasured parts. In the proposed method, a depth value from a pixel with a difference image and surrounding pixels has the advantage of being able to provide a depth value similar to that of the surrounding pixels.
The numbers of additional pixels characterized in the proposed method and the bilateral filtering method are compared in Figure 12. The 3D point cloud-based depth image provided an average of 3342.6771 pixels, and the proposed depth image provided an average of 7687.2071 pixels. In the depth image generated with bilateral filtering, an average of 5713.6205 pixels were provided. The depth images from the proposed method provided 4,991,865 more pixels than were present in the 3D point cloud-based depth images, and bilateral filtering provided 2,724,214 more pixels than were present in the 3D point cloud-based depth images. In the proposed method, there were many pixels with a depth value, which implies that the detailed user’s body was expressed.

4.3. Encoder–Decoder Model Training for 3D Landmark Extraction Phase Results

The results of training the encoder–decoder model using RGBD and RGB images are summarized in Table 1. κ was set to 6 to account for two arms, two legs, body, and head. When κ is 6, 3D landmarks are set on the legs and body as shown in Figure 13. Considering that the 3D poses were set to 16 based on the skeleton, the losses observed before κ was 16 were compared as shown in Figure 14. The smaller the value of κ, the lower the loss between 3D landmarks. When κ was 10, 3D landmarks were provided at the user’s head in many motions, as shown in Figure 15. Because 3D landmarks are provided at the head of the user’s motions when κ was 10, the system was trained by setting κ to 10 when extracting landmarks from RGB images [14]. The alignment loss was the smallest when training to extract landmarks from RGB images; this is because landmarks are set in the background rather than in the user’s motions, as shown in Figure 16. When using RGBD images, because the background is removed owing to the depth value, training was performed so that landmarks were extracted by focusing on the user’s motion rather than using the RGB image. However, the loss is measured to be relatively high because the RGBD image has one more dimension than the RGB image.

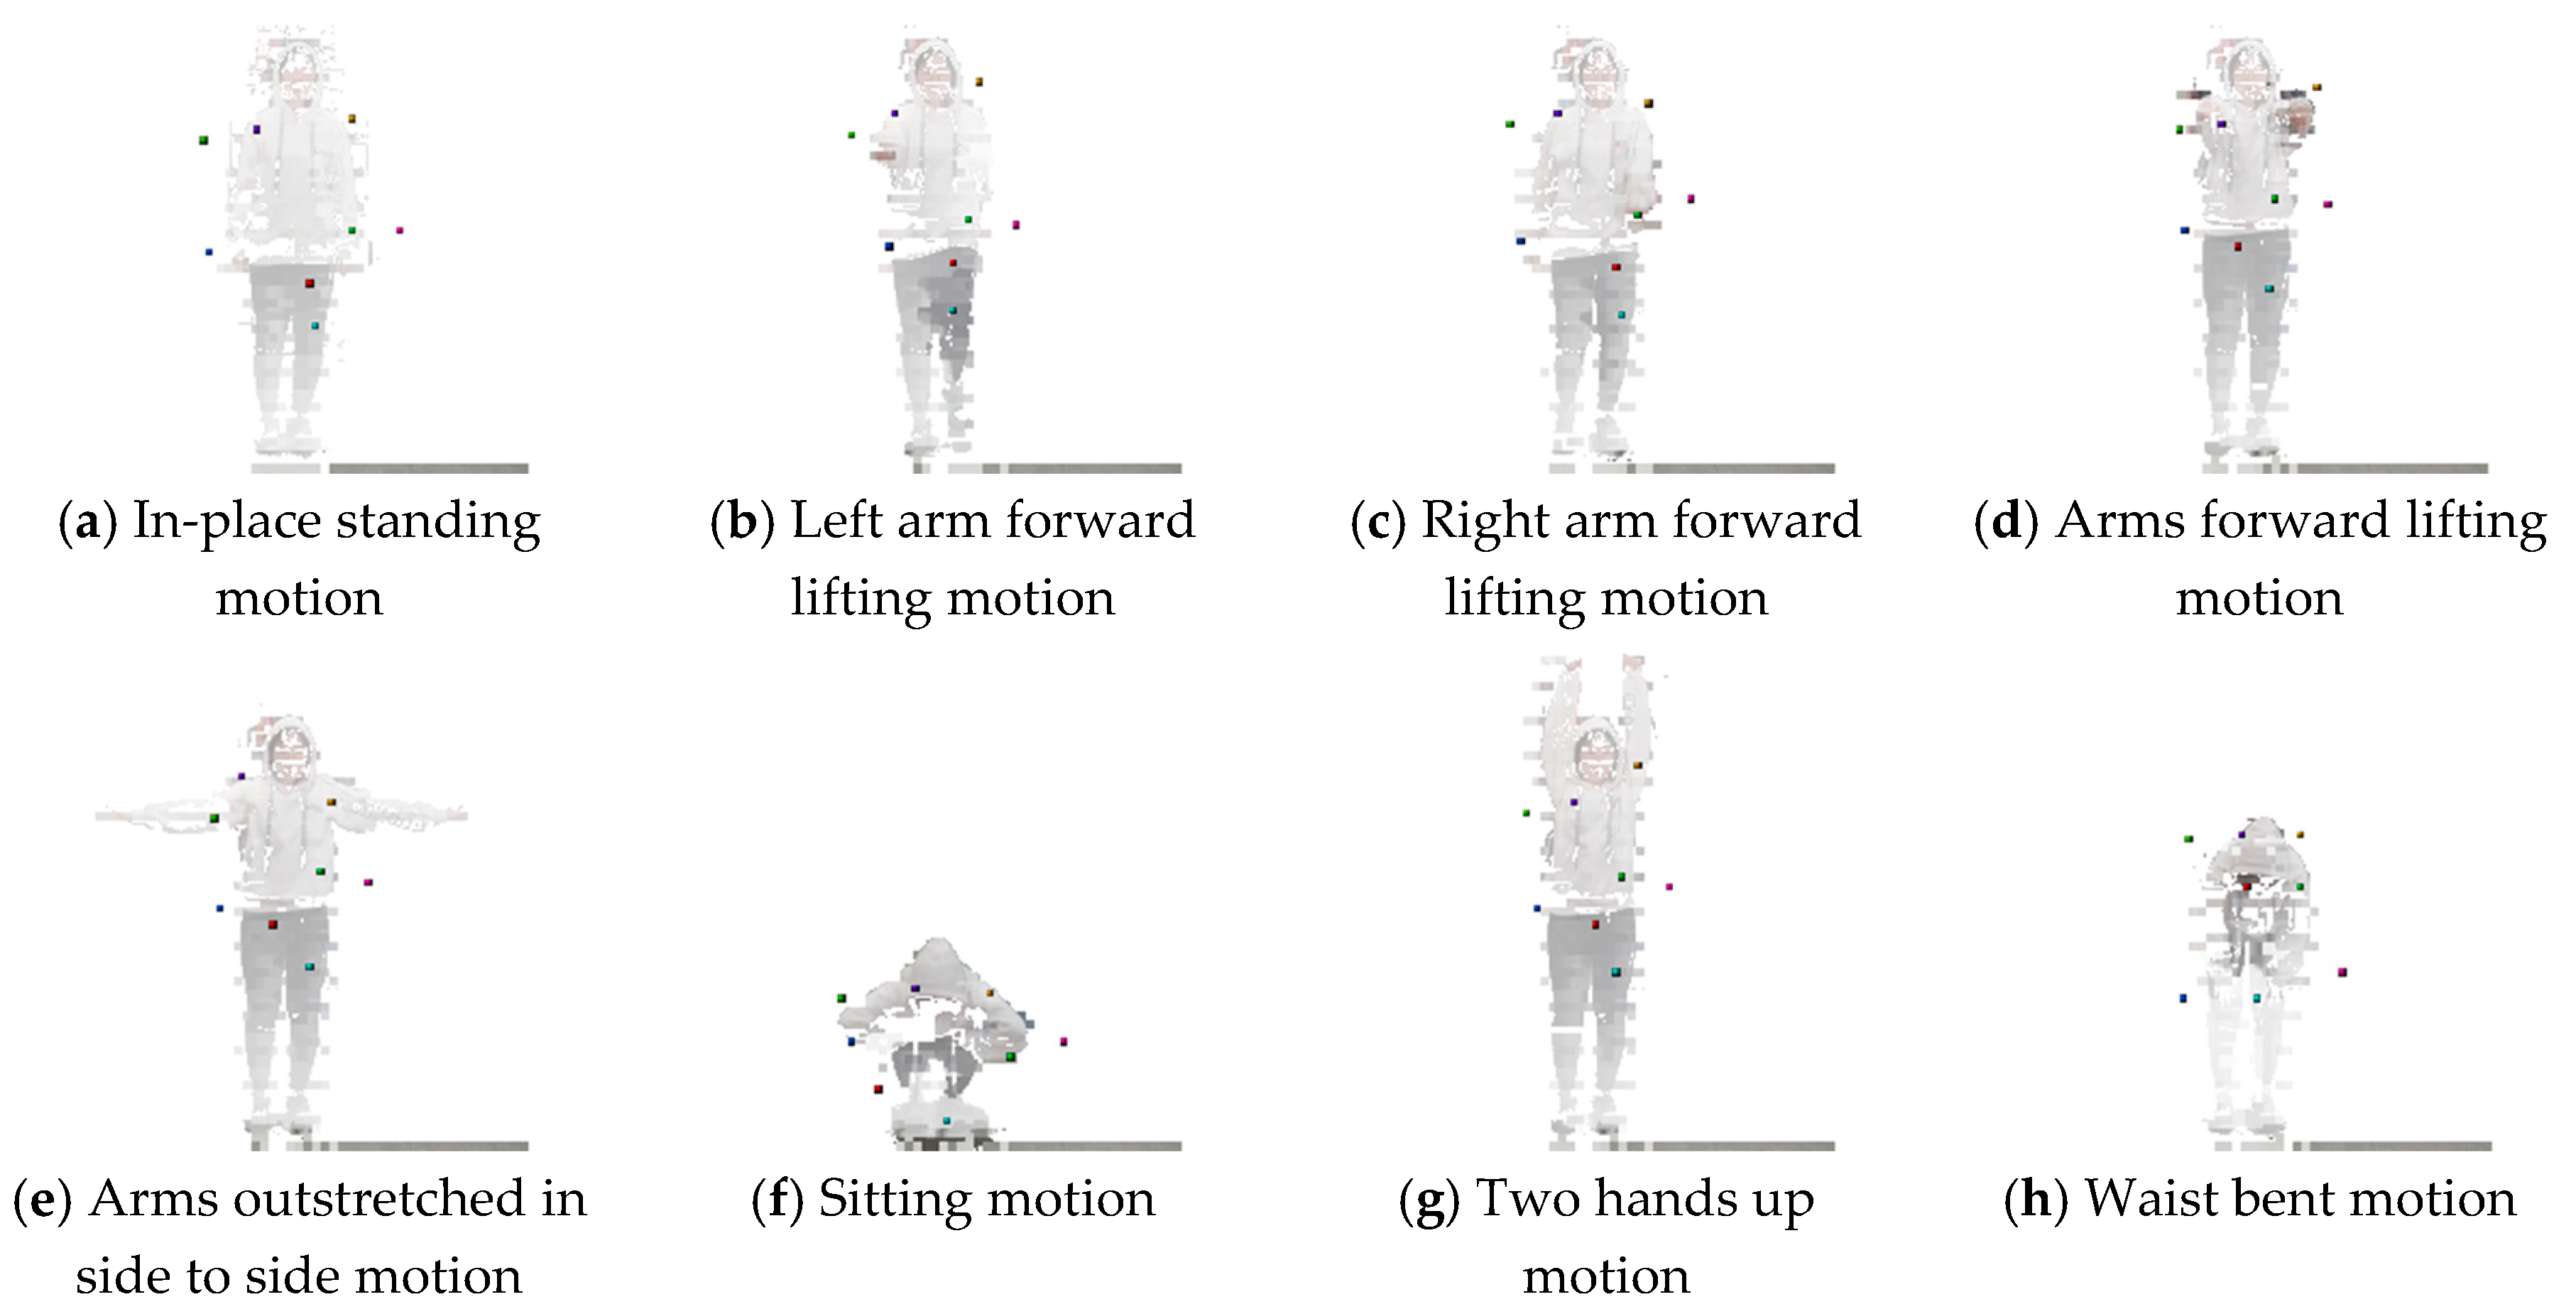
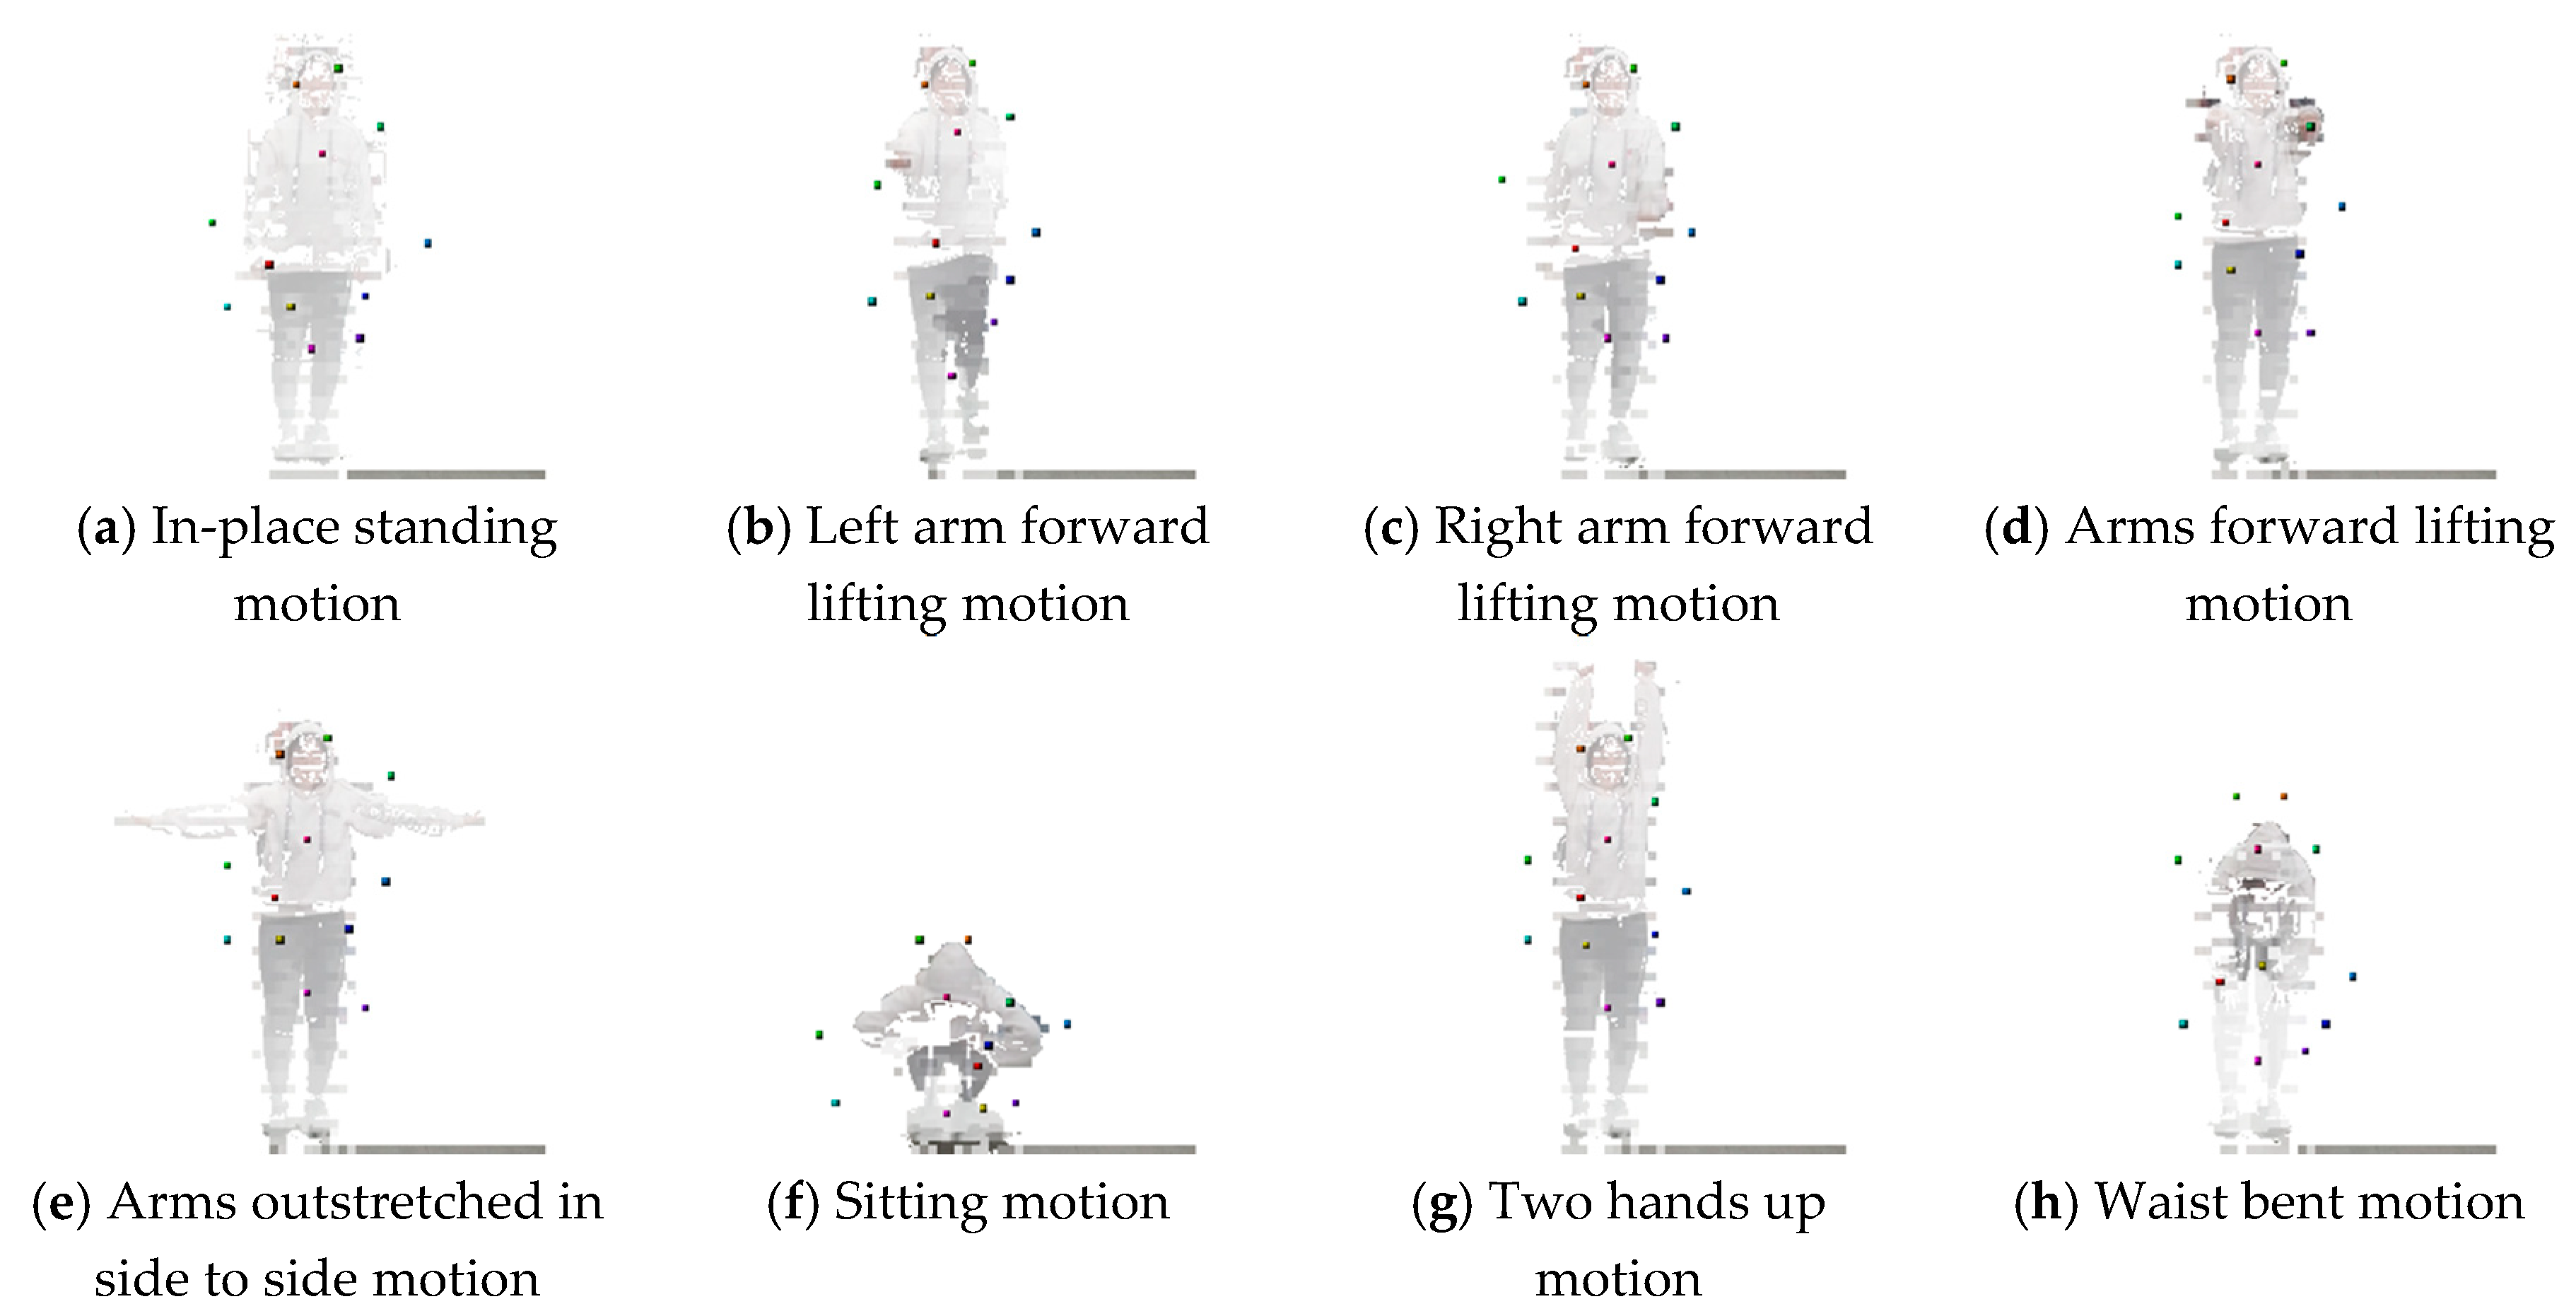
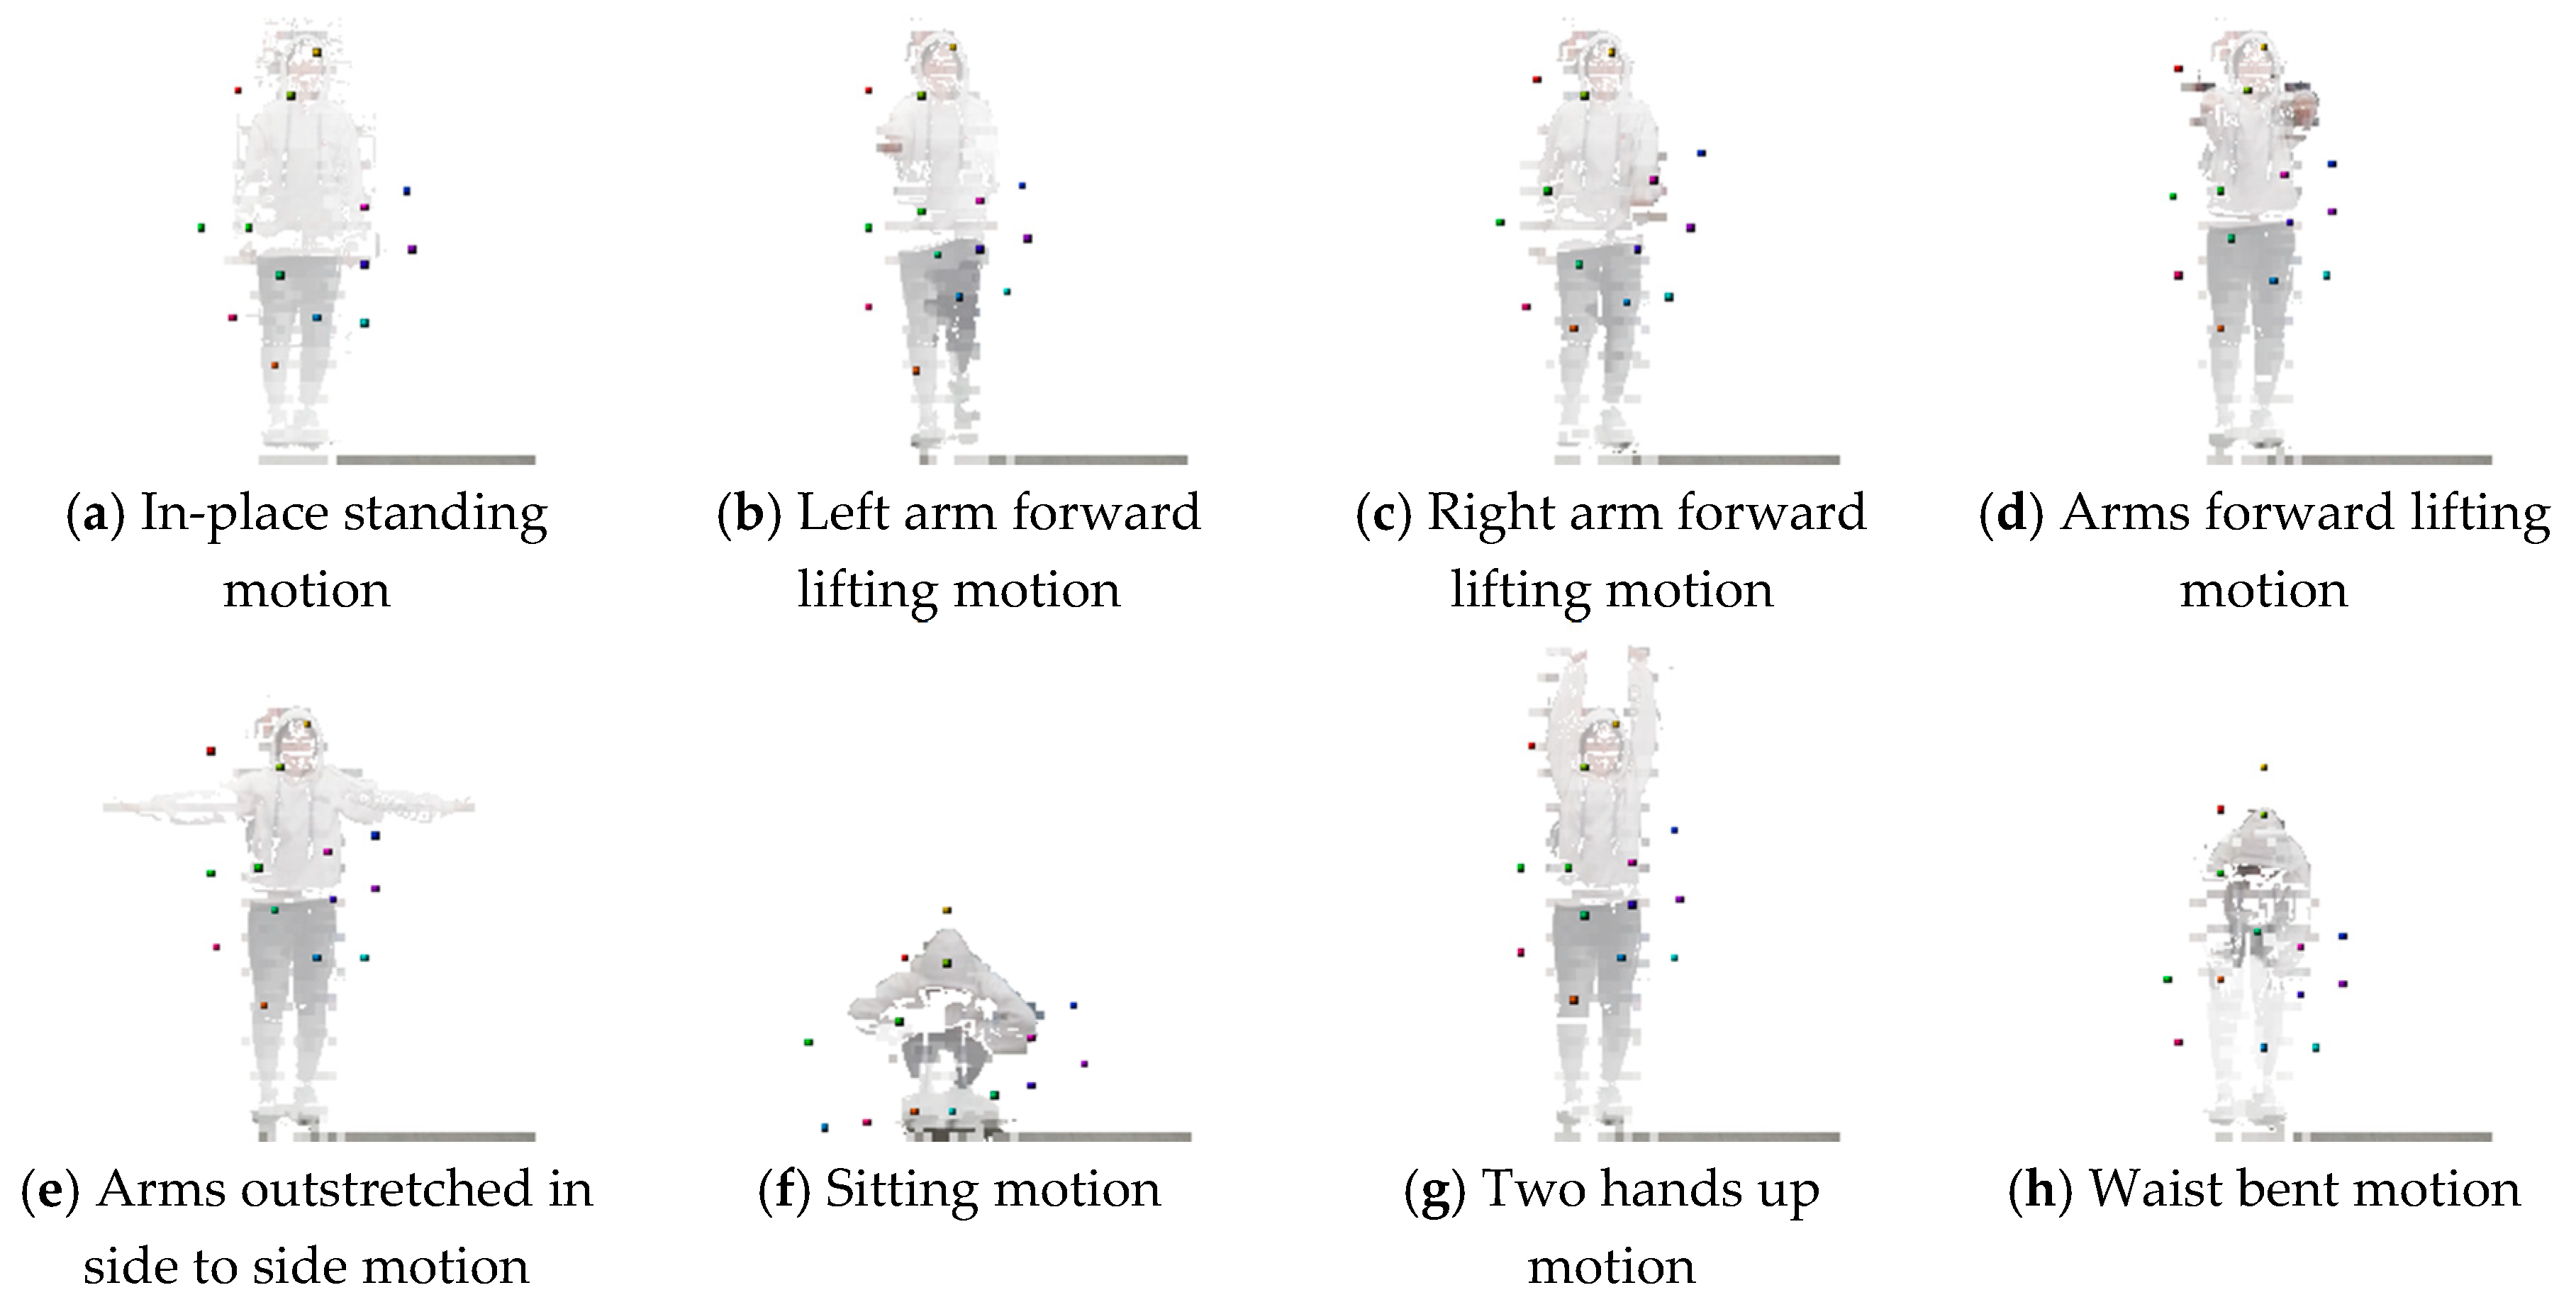
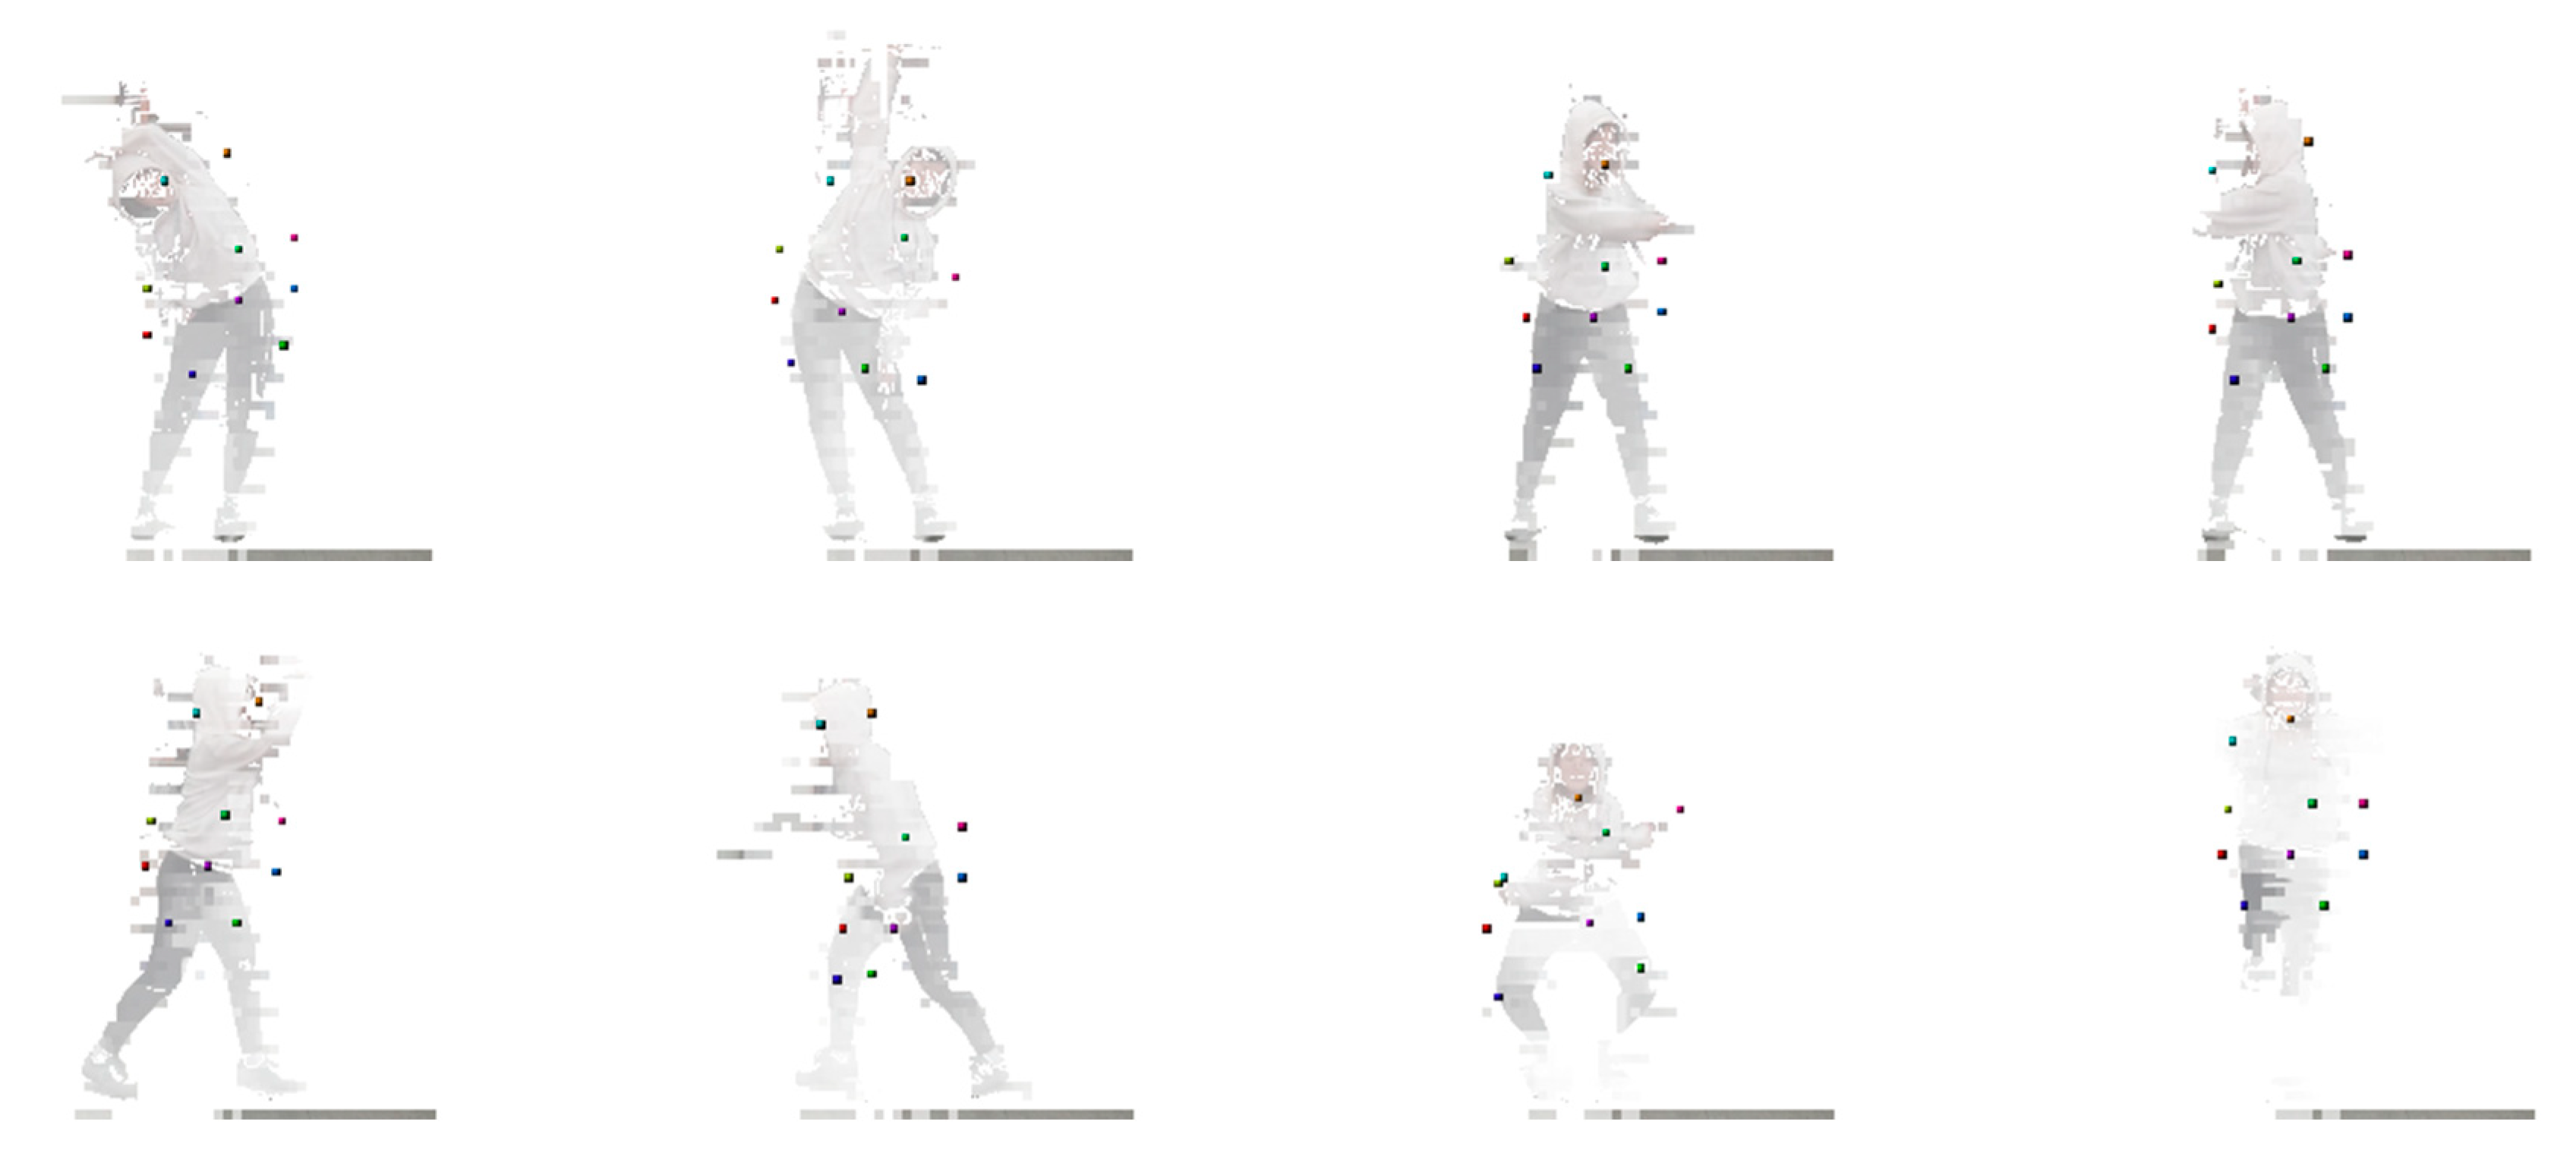
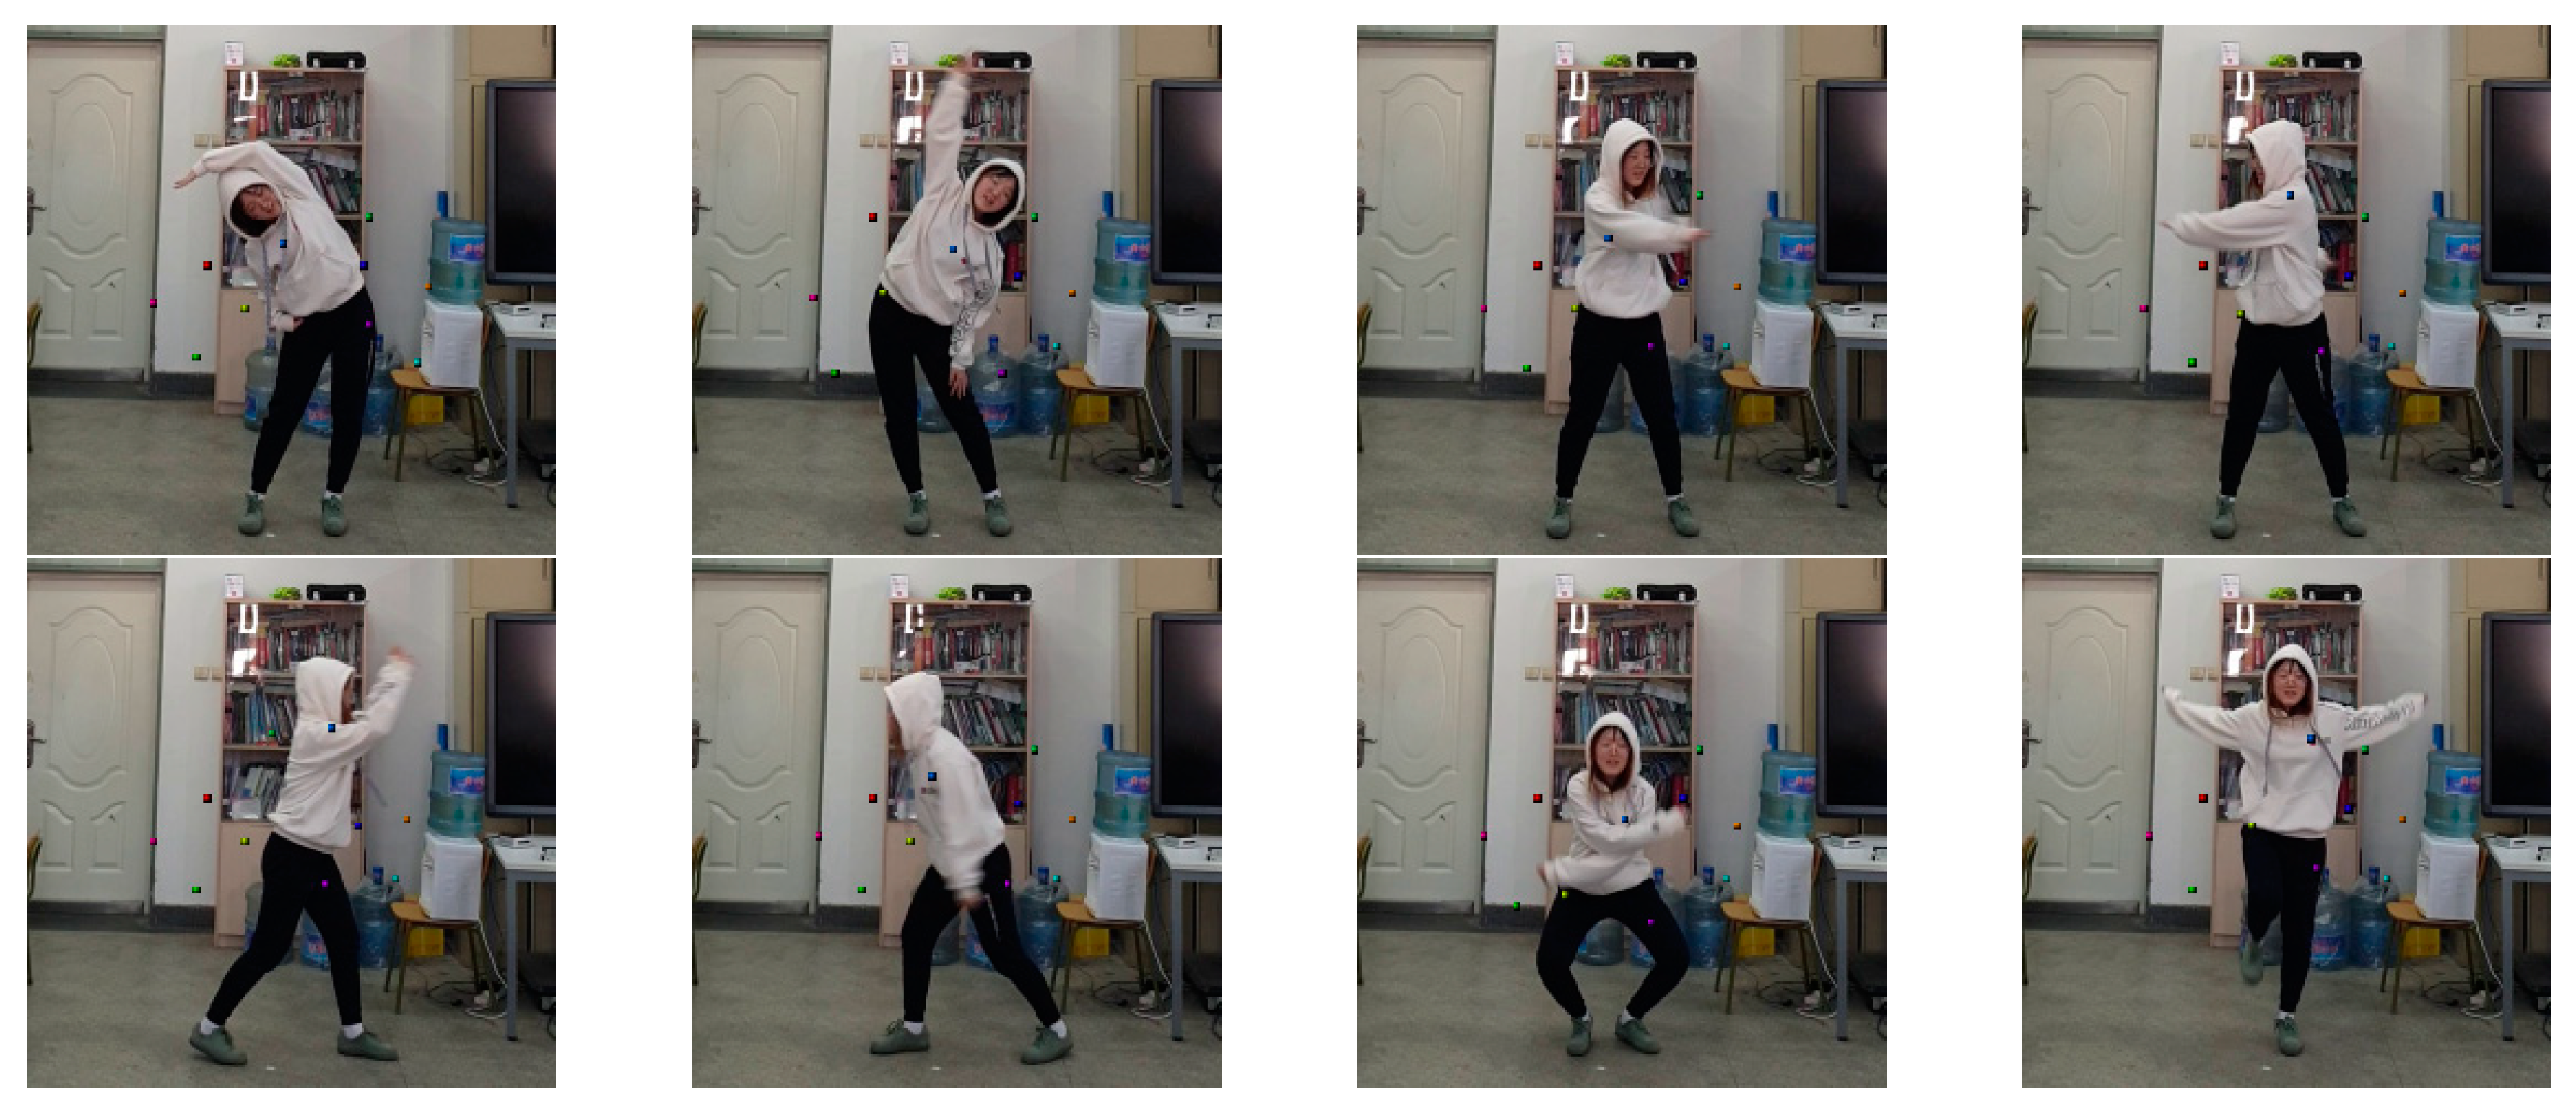
4.4. Trained Encoder Model-based 3D Landmark Extraction Phase Results

The extraction result of 3D landmarks of a user’s motion was analyzed according to the number of κ’s. As the number of κ increased, 3D landmarks were added around the user’s upper and lower body. 3D landmarks were set in the non-user’s body as a certain number was exceeded. When κ was 6, 3D landmarks were set up on one right leg, two on the left leg, one near each arm, and one in the center of the upper body as shown in Figure 13. When κ was 8, one 3D landmark is set next to the left arm instead of the user’s body as shown in Figure A1. Upper body-oriented 3D landmarks were set when κ was 6. When κ was 10, 12, 14, and 16, 3D landmarks were set evenly between the upper body and the lower body as shown in Figure 15, Figure A2, Figure A3 and Figure 13. The 3D landmarks set in the non-body part were set to 2 when κ was 10, 3 when κ was 12, and 5 when κ was 14 and 16 as listed in Table 2. 3D landmarks could not be set properly when the size of the body changes, such as when the body is folded when a user sits.
Although arm movement was important in the user’s motions, 3D landmarks were sometimes not generated on the arm because the arm was not always shot in the RGBD images or RGB images. When automatically extracting the 3D landmarks, the movement of the body was determined to be important, and 3D landmarks around the body were provided as shown in Figure 15. It was possible to confirm that 3D landmarks moved according to the movement of the body. When extracting landmarks with RGB images [14], there is a problem as landmarks are photographed with respect to the surrounding environment instead of with respect to the user’s body as shown in Figure 16. However, the proposed method had the advantage of being photographed around the user’s body, and 3D landmarks could be provided using depth image values for the generated landmarks.
For the proposed method, when κ was 10, approximately three 3D landmarks were set in the non-body part as shown in Table 2. However, when setting landmarks using RGB images, approximately seven landmarks were set up outside the user’s body. The position of the 3D landmarks was changed according to the motion of the user’s upper body or lower body as shown in Figure 15 and Figure A4. In addition, it was confirmed that 3D landmarks set at a location other than the user’s body change according to the user’s motion. However, when using RGB images, the landmarks of the user’s body were changed according to the user’s motions, but the landmarks were not changed. For the proposed method, it seems that the landmarks were not set in the background, unlike the landmarks extracted with the RGB image, because the landmarks were changed according to the user’s motion. If the size of the user’s body was different, the reason why the landmarks were not properly set was judged by the fact that the 3D point cloud cannot measure the entire body of the user. There is a need for a method to estimate the user’s entire body through a 3D point cloud.

5. Conclusions

A method for automatically extracting 3D landmarks is proposed for evaluating a user’s motions. To consider the boundary of the user’s motions, the motions were collected using 3D point clouds and RGB images. A method for generating a depth image that corrects the disparities of a 3D point cloud has been described. By using the difference image, the user’s position was located to calculate the unmeasured depth values. An improved encoder–decoder model was proposed for analyzing 3D landmarks using RGBD images. It was ultimately shown that 3D landmarks can be obtained for comparing user motions. In order to evaluate the user’s motions, it was possible to extract 3D landmarks with focus on the user’s motions. In order to provide the boundary of the user’s motions, the density of the depth image generated by the 3D point cloud based on LiDAR has been improved. It can be used to extract features for evaluating the user’s motions by utilizing the proposed method. When it is necessary to follow the user’s motions, such as dancing and games, it can be used in the process of comparing the user’s motions. It can also be used to evaluate objects in motion, such as humans.
Depth images were generated with the average depth pixel densities 1.3 times greater than those obtained with bilateral filtering, and 2.29 times higher than those of existing 3D point cloud-based depth images. The higher the pixel density in the depth image, the more accurately the depth image expresses the user’s body. The generated depth image had been a problem that a performance difference occurs depending on a difference image from background image and collected RGB image. When using RGBD images, it was confirmed that landmarks evaluating the user’s motions could be provided more effectively than with RGB images. In the proposed method, 80% of the set 3D landmarks were set in the user’s body; however, when setting the landmarks using RGB images, 30% of the landmarks were set in the user’s body. When using the RGBD images, landmarks could be provided to the user’s body about 2.6 times as much as using RGB images. There should always be a user, and there was a problem in that 3D landmarks were extracted even when there is no user. An error in 3D landmarks occurred when the user’s body was covered by another body.
Further work is needed to improve the problem that 3D landmarks are not extracted for the whole user’s motion because of the unmeasured part of the user’s motion. There is a need for a method to obtain 3D landmarks by predicting a portion not measured by one LiDAR and RGB camera. There is a need for a method for generating a 3D model using the measured 3D point cloud and RGB image of the user’s motion and for extracting 3D landmarks using the generated 3D model. There is a need for a way to compare user’s motions using 3D landmarks. In the process of comparing the user’s motion, a method of normalizing 3D landmarks when the user’s body size is different is required.

Author Contributions

Funding acquisition, Y.S.; Methodology, J.K. and Y.S.; Project administration, Y.S.; Software, J.K.; Validation, J.K. and Y.S.; Visualization, J.K.; Writing—original draft, J.K.; Writing—review & editing, Y.S. All authors have read and agreed to the published version of the manuscript.

Funding

This research was supported by the MSIT(Ministry of Science, ICT), Korea, under the High-Potential Individuals Global Training Program)(2019-0-01585) supervised by the IITP(Institute for Information and Communications Technology Planning and Evaluation).

Conflicts of Interest

The authors declare no conflict of interest.

Appendix A

Figure A1. 3D landmarks generated when κ was 8.
Remotesensing 12 01142 g0a1
Figure A2. 3D landmarks generated when κ was 12.
Remotesensing 12 01142 g0a2
Figure A3. 3D landmarks generated when κ was 14.
Remotesensing 12 01142 g0a3

Appendix B

Figure A4. 3D landmarks generated when κ was 10 using RGBD images.
Remotesensing 12 01142 g0a4
Figure A5. 2D landmarks generated when κ was 10 using RGB images.
Remotesensing 12 01142 g0a5

References

  1. Song, W.; Zou, S.; Tian, Y.; Sun, S.; Fong, S.; Cho, K.; Qiu, L. A CPU-GPU Hybrid System of Environment Perception and 3D Terrain Reconstruction for Unmanned Ground Vehicle. J. Inf. Process. Syst. 2018, 14, 1445–1456. [Google Scholar]
  2. Kwak, J.; Sung, Y. Autonomous UAV Flight Control for GPS-Based Navigation. IEEE Access 2018, 6, 37947–37955. [Google Scholar] [CrossRef]
  3. Kwak, J.; Sung, Y. End-to-End Controls using K-Means Algorithm for 360-Degree Video Control Method on Camera-Equipped Autonomous Micro Aerial Vehicles. Appl. Sci. 2019, 9, 4431. [Google Scholar] [CrossRef] [Green Version]
  4. Sangaiah, A.K.; Medhane, D.V.; Han, T.; Hossain, M.S.; Muhammad, G. Enforcing Position-based Confidentiality with Machine Learning Paradigm through Mobile Edge Computing in Real-time Industrial Informatics. IEEE Trans. Ind. Inform. 2019, 15, 4189–4196. [Google Scholar] [CrossRef]
  5. Sangaiah, A.K.; Medhane, D.V.; Bian, G.B.; Ghoneim, A.; Alrashoud, M.; Hossain, M.S. Energy-Aware Green Adversary Model for Cyber Physical Security in Industrial System. IEEE Trans. Ind. Inform. 2020, 16, 3322–3329. [Google Scholar] [CrossRef]
  6. Sangaiah, A.K.; Hosseinabadi, A.A.R.; Sadeghilalimi, M.; Zhang, W. Energy Consumption in Point-Coverage Wireless Sensor Networks via Bat Algorithm. IEEE Access 2019, 7, 180258–180269. [Google Scholar] [CrossRef]
  7. Zhang, F.; Wu, T.; Pan, J.; Ding, G.; Li, Z. Human Motion Recognition based on SVM in VR Art Media Interaction Environment. Hum.-Cent. Comput. Inf. Sci. 2019, 9, 1–15. [Google Scholar] [CrossRef]
  8. Yao, Z.; Liu, Y.; Ji, Z.; Sun, Q.; Lasang, P.; Shen, S. 3D Driver Pose Estimation Based on Joint 2d-3d Network. In Proceedings of the 2019 IEEE International Conference on Image Processing (ICIP), Taipei, Taiwan, 22–25 September 2019. [Google Scholar]
  9. Kang, N.; Bai, J.; Pan, J.; Qin, H. Interactive Animation Generation of Virtual Characters using Single RGB-D Camera. Vis. Comput. 2019, 35, 849–860. [Google Scholar] [CrossRef]
  10. Kocabas, M.; Karagoz, S.; Akbas, E. Self-Supervised Learning of 3D Human Pose using Multi-view Geometry. In Proceedings of the IEEE Conference on Computer Vision and Pattern Recognition (CVPR), Long Beach, CA, USA, 16–20 June 2019. [Google Scholar]
  11. Chen, X.; Lin, K.; Liu, W.; Qian, C. Weakly-Supervised Discovery of Geometry-Aware Representation for 3D Human Pose Estimation. In Proceedings of the IEEE Conference on Computer Vision and Pattern Recognition (CVPR), Long Beach, CA, USA, 16–20 June 2019. [Google Scholar]
  12. Siarohin, A.; Lathuiliere, S.; Tulyakov, S.; Ricci, E.; Sebe, N. Animating Arbitrary Objects via Deep Motion Transfer. In Proceedings of the IEEE Conference on Computer Vision and Pattern Recognition (CVPR), Long Beach, CA, USA, 16–20 June 2019. [Google Scholar]
  13. Zhang, Y.; Guo, Y.; Jin, Y.; Luo, Y. Unsupervised Discovery of Object Landmarks as Structural Representations. In Proceedings of the IEEE Conference on Computer Vision and Pattern Recognition (CVPR), Salt Lake City, UT, USA, 18–22 June 2018. [Google Scholar]
  14. Jakab, T.; Gupta, A.; Bilen, H.; Vedaldi, A. Unsupervised Learning of Object Landmarks through Conditional Image Generation. In Proceedings of the Thirty-second Conference on Neural Information Processing Systems (NIPS), Montreal, QC, Canada, 3–8 December 2018. [Google Scholar]
  15. Scholosser, J.; Chow, C.K.; Kira, Z. Fusing LIDAR and Images for Pedestrian Detection using Convolutional Neural Networks. In Proceedings of the IEEE International Conference on Robotics and Automation. In Proceedings of theh International Conference on Robotics and Automation (ICRA), Stockholm, Sweden, 16–21 May 2016. [Google Scholar]
  16. Courtois, H.; Aouf, N. Fusion of Stereo and Lidar Data for Dense Depth Map Computation. In Proceedings of the 2017 Workshop on Research, Education and Development of Unmanned Aerial Systems (RED UAS), Linköping, Sweden, 3–5 October 2017. [Google Scholar]
  17. Premebida, C.; Carreira, J.; Batista, J.; Nunes, U.J. Pedestrian Detection Combining RGB and Dense LiDAR Data. In Proceedings of the 2014 IEEE/RSJ International Conference on Intelligent Robots and Systems (IROS 2014), Chicago, IL, USA, 14–18 September 2014. [Google Scholar]
  18. Gao, H.; Cheng, B.; Wang, J.; Li, K.; Zhao, J.; Li, D. Object Classification Using CNN-Based Fusion of Vision and LIDAR in Autonomous Vehicle Environment. IEEE Trans. Ind. Inform. 2018, 14, 4224–4231. [Google Scholar] [CrossRef]
  19. Kanazawa, A.; Black, M.J.; Jacobs, D.W.; Malik, J. End-to-end Recovery of Human Shape and Pose. In Proceedings of the IEEE Conference on Computer Vision and Pattern Recognition (CVPR), Salt Lake City, UT, USA, 18–22 June 2018. [Google Scholar]
  20. Ge, L.; Cai, Y.; Weng, J.; Yuan, J. Hand PointNet: 3D Hand Pose Estimation using Point Sets. In Proceedings of the IEEE Conference on Computer Vision and Pattern Recognition (CVPR), Salt Lake City, UT, USA, 18–22 June 2018. [Google Scholar]
  21. Moon, G.; Chang, J.Y.; Lee, K.M. V2V-PoseNet: Voxel-to-Voxel Prediction Network for Accurate 3D Hand and Human Pose Estimation from a Single Depth Map. In Proceedings of the IEEE Conference on Computer Vision and Pattern Recognition (CVPR), Salt Lake City, UT, USA, 18–22 June 2018. [Google Scholar]
  22. Georgakis, G.; Karanam, S.; Wu, Z.; Kosecka, J. End-to-end Learning of Keypoint Detector and Descriptor for Pose Invariant 3D Matching. In Proceedings of the IEEE Conference on Computer Vision and Pattern Recognition (CVPR), Salt Lake City, UT, USA, 18–22 June 2018. [Google Scholar]
  23. Georgakis, G.; Karanam, S.; Wu, Z.; Ernst, J.; Kosecka, J. Learning Local RGB-to-CAD Correspondences for Object Pose Estimation. In Proceedings of the IEEE Conference on Computer Vision and Pattern Recognition (CVPR), Long Beach, CA, USA, 16–20 June 2019. [Google Scholar]
  24. Park, Y.; Yun, S.; Won, C.S.; Cho, K.; Um, K.; Sim, S. Calibration between Color Camera and 3D LIDAR Instruments with a Polygonal Planar Board. Sensors 2014, 14, 5333–5353. [Google Scholar] [CrossRef] [PubMed] [Green Version]
Figure 1. Process of extracting 3D landmarks using a 3D point cloud and an RGB image.
Remotesensing 12 01142 g001
Figure 2. Process for generating RGBD image.
Remotesensing 12 01142 g002
Figure 3. Placement of a LiDAR and an RGB camera for shooting a user.
Remotesensing 12 01142 g003
Figure 4. Encoder–decoder model training process using RGBD image.
Remotesensing 12 01142 g004
Figure 5. Encoder–decoder model using RGBD image.
Remotesensing 12 01142 g005
Figure 6. 3D landmark extraction process of RGBD image using trained encoder.
Remotesensing 12 01142 g006
Figure 7. 3D point cloud and an RGB image measured using a LiDAR and an RGB camera.
Remotesensing 12 01142 g007
Figure 8. Depth images generated based on voxel.
Remotesensing 12 01142 g008
Figure 9. Difference images generated by the difference between the background image and the collected RGB images.
Remotesensing 12 01142 g009
Figure 10. Depth images generated by the proposed method.
Remotesensing 12 01142 g010
Figure 11. Depth images generated by up-sampling 3D point clouds-based depth images bilateral filtering.
Remotesensing 12 01142 g011
Figure 12. Comparison of 3D point cloud-based depth image, the improved density of the proposed method’s depth image, and up-sampled depth image based on the bilateral filter are accumulated.
Remotesensing 12 01142 g012
Figure 13. 3D landmarks generated when κ was 6.
Remotesensing 12 01142 g013
Figure 14. 3D landmarks generated when κ was 16.
Remotesensing 12 01142 g014
Figure 15. 3D landmarks generated when κ was 10.
Remotesensing 12 01142 g015
Figure 16. 2D landmarks generated when κ was 10.
Remotesensing 12 01142 g016
Table 1. Loss calculated using the encoder–decoder model.
RGBD ImageRGB Image
681012141610
Align loss26.921234.534334.048644.092246.091464.323918.3621
Decay loss0.54250.54930.55760.56710.56850.57610.5493
Diversity loss0.02830.09270.10500.21340.26250.42700.0973
Table 2. Location of landmark extraction.
RGBD ImageRGB Image
681012141610
Number of landmarks in body part68899113
Number of landmarks in non-body part--23557

