Abstract
Understanding the often-heterogeneous land cover in urban areas is critical for, among other things, environmental monitoring, spatial planning, and enforcement. Recently, several earth observation satellites were developed with an enhanced spatial resolution that provides for precise and detailed representations of image objects. Morphological image analysis techniques provide useful tools for extracting spatial features from high-resolution, remotely sensed images. This study investigated the efficacy of mathematical morphological (MM) techniques in the land cover classification of a heterogeneous urban landscape using very high-resolution pan-sharpened Pleiades imagery. Specifically, the study evaluated two morphological profiles (MP) techniques (i.e., concatenation of morphological profiles (CMPs) and multi-morphological profiles (MMPs)) in the classification of a heterogeneous urban land cover. The overall accuracies for CMP were 83.14% and 83.19% over the two study areas. Similarly, the MMP overall accuracies were 84.42% and 84.08% for the two study sites. The study concluded that CMP and MMP can greatly improve the classification of heterogeneous landscapes that typify urban areas by effectively representing the structural landscape information necessary for discriminating related land cover classes. In general, similar and visually acceptable results were produced for land cover classification using either CMP or MMP image analysis techniques
1. Introduction
Understanding the often-heterogeneous land cover in urban areas is critical for environmental management, urban spatial planning, and optimal and sustainable use of urban landscapes [1,2,3]. Traditionally, methods used for urban land cover classification involve enumeration, observation, and field surveys. However, these methods are often costly, tedious, time-consuming, and unsuitable for large spatial extents [4,5]. The recent advancement in space-borne remote sensing technology provides the capability to quickly acquire high spatial resolution images that provide opportunities for detailed analysis for urban applications such as the often-challenging urban land cover delineation [6]. Hence, to increase the accuracy of urban landscapes, the recent proliferation of high spatial resolution sensors necessitates a further exploration of various techniques commonly classified into pixel- and object-based approaches.
Pixel-based image classification techniques have been widely adopted for land cover delineation [7,8,9,10,11,12,13,14,15,16]. Most pixel-based classification methods only utilize the spectral information in the pixels for classification of land cover. Notably, the efficacy of spectrally based pixel-based techniques is limited by landscape heterogeneity typified by urban areas and the ever-increasing suite of high spatial resolution imagery associated with recent sensor advancement. Improved spatial information with ground sampling distance (GSD) less than 2 m, for instance, is inherent in current sensor advancements, such as SPOT 6&7, Pleiades, and IKONOS, and is likely to increase within class spectral variability and interclass spectral confusion, hence lower classification accuracies [17,18,19]. Whereas advanced machine learning algorithms such as support vector machine, artificial neural network, and decision tree have been known to generate significant accuracy in urban land cover mapping [20], their dependence on statistical information does not allow for exploitation of the rich spatial information that characterize the high spatial resolution sensors. According to Lillesand [9], their inability to exploit spatial or contextual information related to the pixel impedes optimum performance in a heterogeneous urban landscape [9]. As an alternative, object-based image analysis (OBIA) techniques were developed to exploit contextual information inherent in heterogeneous landscapes. The increasing popularity of OBIA is attributed to their ability to utilize image spatial characteristics such as tone, shape, pattern, and context. Typically, two distinct methods utilize spatial information from an image: region-based, such as the Grey Level Co-Occurrence Matrix (GLCM), and edge/window-based techniques, such as the Canny edge and Sobel operator. Commonly, edge-based and region-based segmentation are used to partition discrete surface spectral characteristics. Edge-based segmentation, on the other hand, seeks boundaries by distinguishing areas within the image and segments of the complete enclosure by edge pixels [21]. Consequently, pixels that characterize objects can either form part of the in-segment or constitute a segment as its boundary [22]. However, the major limitations related to edge-based techniques are insensitivity to noise and are edge-based, hence they are highly dependent on the analysis window which blurs the borders of textured regions [18,21].
Morphological image analysis techniques, generally referred to as mathematical morphology (MM) [23], exploit the spatial domain in images using various techniques based on set theory to estimate and measure many useful geometrical features such as shape, size, and connectivity [21,23]. These techniques are developed based on concatenation of mathematical operations grounded in a set of operations such as union, intersection, complementation, and translations [23]. These operators include erosion, dilation, opening, closing rank filters (including median filters), and top hat transforms [24]. They are defined in an abstract structure known as an infinite lattice [24], which is an assumption that an image consists of structures which can be handled by set theory. Morphological image analysis techniques provide useful tools for extracting spatial features from high-resolution remotely sensed images [2,3,4,5]. These techniques include a family of morphological profiles (MPs) and its advances that include extended morphological profiles (EMPs), derivative of morphological profiles (DMPs), multi-morphological profiles (MMPs), concatenation of morphological profiles (CMPs), attribute profiles (APs), and extended attribute profiles (EAPs) [4,5,6,7,8]. These MP techniques process images based on many different types of features such as purely geometric, textural, and contrast-based analysis [25]. Morphological-based image analysis has the potential to address challenges arising from pixel-based and OBIA by integrating the pixel, region, and object-based image analysis [26,27,28,29,30]. Hence, the objective of this study was to test the efficacy of CMP and MMP’s ability to preserve structural information as well as discriminate land cover classes in a heterogeneous urban landscape.
2. Materials and Methods
The experiments were carried out using Pleiades data sets over two areas: Boksburg in Ekurhuleni and Sunninghill in Johannesburg, both within the Gauteng Province of South Africa (Figure 1). The two cities constitute the fastest growing urban areas on the African continent, mainly attributed to migration from other parts of the country and the continent. The cities are characterized by a heterogeneous urban landscape, where households are increasing hence placing a huge demand on their economic and social infrastructure. Residential areas range from luxurious wooded suburbs to shanty towns and squatter settlements. The two subset images used in this study contain the typical urban landscape that include residential and industrial buildings, roads, and vegetation.
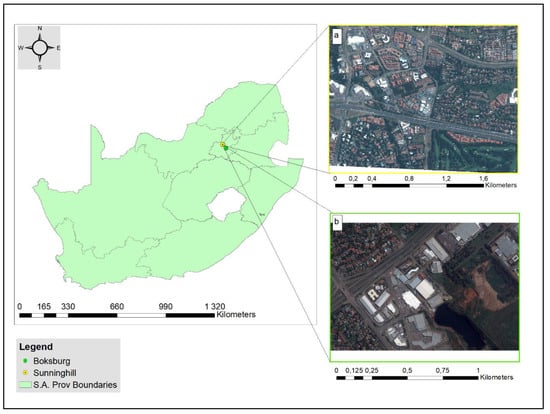
Figure 1.
The study areas for the land-cover classification subset: (a) Sunninghill and (b) Boksburg.
2.1. Data set and processing
Very high-resolution pan-sharpened Pleiades (0.5 m) data were explored for the study. Table 1 shows the details of images acquired for the study. The imagery was acquired on 12 February and 13 December 2015, covering Boksburg and Sunninghill, respectively. The data were procured from Airbus through the South African National Space Agency (SANSA). The Pleiades imagery comprises four spectral bands from the visible (430) to the near-infrared region (950 nm). The datasets were received already stored in 11 bits per pixel and delivered as 16 bits Geo Tiff, hence allowed for increased discrimination of subtle spectral differences among objects. The images were received already georeferenced and corrected for off-nadir acquisition and terrain effects on delivery. The pan-sharpened imagery was used for the analysis. The aerial photos obtained from the National Geo-Spatial Information (NGI) in South Africa were used for validation. Given that the satellite images were acquired in 2015 and the aerial photos were captured in 2012, a ground validation was undertaken in 2016 to confirm samples of existing land cover classes extracted from the aerial photos and to update samples where inconsistencies existed due to land cover change. This approach was used due the unavailability of high-resolution reference data for 2015.

Table 1.
Very high-resolution Pleiades spectral combinations.
The land cover classes were grouped into seven major urban classes: Vegetation (grass), Vegetation (trees), Roads, Building, Water, Shadow, and Bare Land (Table 2).
Table 2.
Land cover classes and their description.
2.2. Morphological Profiles Methods
Morphological profiles based on CMP and MMP were applied in this study. A morphological profile is composed of repetitive transformation of an opening profile and a closing profile . The morphological opening profile of an image is an array of n openings performed on the original image using a series of structuring element (SE) with increasing sizes of radius and is defined as:
where is the opening by reconstruction with an SE of radius size and is the total number of openings. By duality, the morphological closing profile of an image is an array of n closing performed on the original image using a series of SE with increasing sizes of radius composed by n levels can be indicated by:
where is the closing by reconstruction with SE of radius size and is the total number of openings. By collating the opening profile and closing profile, a morphological profile (MP) is realized.
Opening and closing profiles are generated from gray level images using opening and closing by reconstruction operators, where represent the radius of disk-shaped or weighed square-shaped SE of a fixed shape with an increasing structuring element (SE) which is commonly used in the literature [31,32,33,34]. When joining opening and closing profiles, both of the same size n, a morphological profile is obtained [34]. An MP is generally applied to the analysis of a single band image (e.g., panchromatic), and its extension to multispectral images is referred to as extended morphological profile (EMP). An EMP is constructed by a series of MPs built on base images which contain few bands but represent most of the information that is relevant for discrimination purposes [34]. Therefore, EMPs of first principal component (PC) can be formalized by:
where I comprise a set of the n-dimensional base images derived using principal component.
Multi-morphological profiles (MMPs) are an extension of EMP obtained using different types of morphological profiles stacked together. The filtering operation implemented in EMPs is based on the evaluation of how a given image is computed for every connected component of a gray scale image I for a given value.
where EMP () comprise a set of the n-dimensional base images derived using principal component [31,32,33,34].
A morphological profile based on the concatenation of MPs is defined by a combination of morphological geodesic opening and closing operations of different sizes. A CMP is constructed differently from EMPs and MMPs. Both EMP and MMP analyses rely on PCA transformation to reduce dimensionality, and CMPs are based on the analysis of an image without the addition of linear or non-linear data dimensionality reduction techniques. The concatenation of various MPs without the use of image transform techniques can be defined as follows:
where comprise a set of the n-dimensional original base images not filtered by PCA.
Both CMP and EMP morphological profiles, aimed at multiscale decomposition of satellite imagery and scene simplification, were implemented in this study. Principal component analysis (PCA) was used for the transformation of multispectral and pan-sharpened Pleiades imagery to identify patterns in the data and reduce the dimensionality. A EMP was constructed by a series of MPs built on base images which contains few bands but represent most of the information which is relevant for discrimination [5]. Principal component analysis generates base images by analyzing the covariance matrix of the original multispectral images [5,12]. A MMP is an extension of EMP obtained using different types of morphological profiles stacked together. The filtering operation implemented in EMPs is based on the evaluation of how a given image is computed for every connected component of a greyscale image for a given value. A morphological profile based on the concatenation of MPs was defined by a combination of morphological geodesic opening and closing operations by reconstruction of different sizes. The implementation of the methodology is described in Section 2.2.1 below.
2.2.1. Image Processing and Parameter Settings
The multispectral and pan-sharpened imagery was transformed into a single component using algorithm PCA to derive EMPs for each band. The PC was used, because it contains more than 99% of the total variance of the data set. The analysis for the images was performed using a set of MM algorithms developed within the MATLAB environment and classified using the maximum likelihood algorithm in the ENVI software. The morphological filters’ opening and closing based on reconstruction were calculated using a square structural element, and the same analysis was performed using a disk structural element with a radius range from two to nine with a step of one pixel. The same analysis was performed using morphological reconstruction based on sequential application of differing structural element size but using the same shape, either a square or a disk, respectively.
The square implementation of the filter was separable and incremental, while the circular implementation was incremental. The algorithm for opening and closing by reconstruction were used to construct MPs. In both experiments, an 18 dimensional morphological profile (MP) was created using a disk structuring element and a square structuring element for each band. Then, the 18 dimensional MPs were transformed into a few image bands using PCA algorithms for multispectral and the pan-sharpened data set. To extend the morphological profile to a multispectral and pan-sharpened image, the first PCA component was used to generate a base image to run EMP on the images. The EMP transforms were based on the ordering of connected components that best represented each object in the scene. The MMP was constructed based on the concatenation of various EMPs (Figure 2B), while the second CMP was constructed based on the concatenation of MPs without using PCA. This was compared with MMP based on the concatenation of EMPs and maximum likelihood used for classification of the data to generate results.
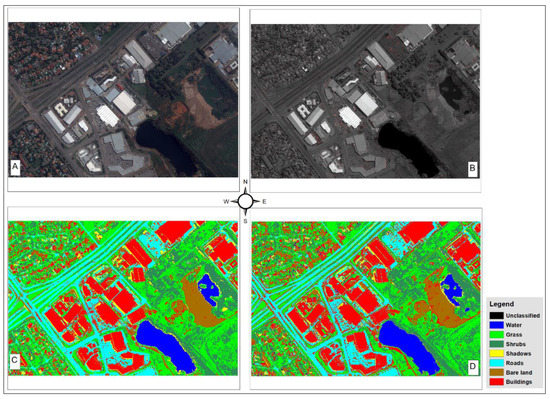
Figure 2.
Pleiades image and classification results: (A) original Pleiades imagery; (B) filtered imagery using Morphological Profile (MP); (C) concatenation of morphological profiles (CMP) classified imagery; and (D) multi-morphological profiles (MMP) classified imagery.
2.3. Accuracy assessment
Firstly, the shape, thematic, edge, and position (STEP) similarity matrix and the confusion matrices were used to access the accuracy of the results. Secondly, a confusion matrix was used to assess how well the classifiers performed by deriving a series of descriptive–analytical statistics [15]. Lastly, to test the performance of the classifiers, a McNemar test of comparison was performed.
The accuracy of the classification was assessed based on geometric and thematic accuracy using the STEP similarity matrix as suggested by Lizarazo [16]. This was done to determine which technique produced the most accurate similarity matrix and structural information preservation of land cover objects. Thematic and geometric accuracy assessment was done to validate how both methods performed in preserving the structural information of land cover objects without distorting edge information. The reference sample units were the same as the segments (i.e., polygons) rather than pixels so that the units were directly comparable to the map segments (see Table 3). To select a region of interest (ROI) for reference objects, points were randomly extracted from 0.5 m aerial imagery acquired from the South African Chief Directorate: National Geo-Spatial Information. One hundred points were randomly generated using QGIS 2.16.1 and spatial objects containing these random points digitized (reference polygon) at a scale of 1:600 to increase the level of object shape delineation (Figure 1). A field survey was conducted to resolve ambiguities resulting from photointerpretation.
Table 3.
Number of samples per class for training and test set for the two data sets.
The STEP similarity matrix assesses the thematic and geometric accuracy by measuring the geometric form, thematic attributes, exterior and interior boundaries, centroids position of classified and reference objects using shape, thematic, edge, and positional accuracy [17]. The STEP system uses the correspondence between sampled and referenced objects which is established by overlaying reference object(s) (digitized polygons) and their corresponding classified object(s). When a reference object matches one or several classified objects, such a classified object is a correctly classified object (CCO). This is considered a shape, theme, edge, and positional similarity to a given reference object(s). Otherwise, the classified object is referred to as misclassified object (MCO). In this regard, MCO has a shape, thematic, edge, and positional similarity with a reference object equal to 0%.
2.4. Comparing classifier performance
The area weighted error matrix and McNemar test were used to compare accuracy measurements received from the STEP similarity matrix and the confusion matrix. The accuracy results measured using the STEP similarity matrix were weighted. An area-weighted error matrix, as suggested by MacLean and Congalton [18], takes into account the area rather than the count of polygons used in STEP. An area weight error matrix was used instead of the actual area to compensate for unequal probability sampling proposed in the method. In the area weight error matrix, the individual cells reflect the weighted area of the reference units that fall into such cells, similar to how the overall accuracy is computed in the error matrix [18].
Lastly, the McNemar test was used instead of the commonly used z test on kappa coefficient to evaluate/or determine the map with the highest classification results. Kappa coefficient was not used for this study, because the reference samples used were the same for both CMP and MMP. Therefore, it was not appropriate to use the kappa coefficient, because it assumes that independent samples are used in their calculations [19].
3. Results
A STEP similarity matrix was used to determine the potential of MMP and CMP in discriminating a heterogeneous urban land cover. Specifically, the study sought to discriminate heterogeneous urban land cover types as well as preserving geometrical characteristics of the structures. This was done by comparing thematic and geometric properties of classified objects on a cell-by-cell basis. Each cell was split into quarters to store in a Morton order the four similarity metrics for each classified object which were shape, thematic, edge, and positional similarity of the classified objects. The classification accuracies were obtained by considering the thematic and geometric properties reported in Table 4, Table 5, Table 6 and Table 7.
Table 4.
Overall thematic and geometric accuracy results of (a) CMP and (b) MMP over Boksburg.
Table 5.
Overall thematic and geometric accuracy results of (a) CMP and (b) MMP over Sunninghill.
Table 6.
The (a) CMP and (b) MMP classification accuracy results over Boksburg.
Table 7.
The (a) CMP and (b) MMP classification accuracy results over Sunninghill.
The major visual difference interpreted among the thematic maps produced by CMP and MMP algorithms was the amount of thematic misclassified buildings with bare land (Figure 2A,C,D). Observation, based on field survey and available aerial imagery, revealed that this area is predominantly covered by impervious surfaces, bare land/mining dumps, and eucalyptus trees. Small dams also exist in the area. Figure 2C shows that CMP misclassified small water bodies with shadows, whereas Figure 2D shows that MMP discriminated small water bodies from shadows. However, bare lands/mine dumps were often mixed with buildings in both classified maps (Figure 2C,D). Similar results are shown for an alternative study site (Figure 3).
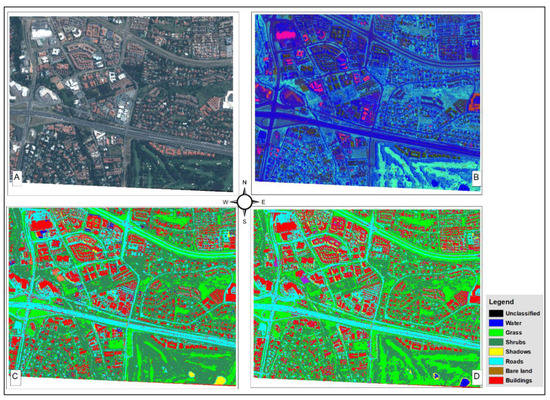
Figure 3.
The classification results of the CMPs and MMPs algorithms in a different area (Sunninghill): (A) original Pleiades imagery; (B) filtered imagery using MP; (C) CMP classified imagery; (D) and MMP classified imagery.
The overall weight error matrix classification accuracies obtained for CMP and MMP to evaluate thematic and geometrical characteristics accuracy of objects in the classification of a heterogeneous urban land cover are reported in Table 4. Thematic and geometrical characteristics were evaluated by considering the shape, thematic, edge, and positional similarity of classified image features. The overall area weight error matrix results were calculated using the STEP similarity matrix. In a STEP similarity matrix, a value of 1 indicates a correctly classified object, while a value of 0 indicates a misclassified object (MCO), hence it suggests a poor shape, thematic, edge or positional similarity of the object.
Table 4 and Table 5 show the overall thematic and geometric accuracy for CMP and MMP computed on the test set. From the analysis in Table 4 and Table 5, it is evident that CMP outperformed MMP in terms of shape, thematic, and edge accuracy for most artificial features. However, for natural features or features without clear boundaries, both CMP and MMP achieved poor shape, edge, and positional accuracy. In terms of shape accuracy, most artificial features, such as buildings/roads and natural features with clear boundaries, such as water, were correctly classified by CMP, achieving high accuracies of 0.86 for buildings, 0.85 for roads, and 0.77 for water, compared to MMP reaching poor shape overall accuracies of 0.22 for buildings, 0.47 for roads, and 0.68 for water. Similar occurrences for edge and thematic accuracy were evident, where artificial features were correctly classified by CMP compared to MMP. However, when evaluating accuracy for the natural features or features without clear boundaries, such as grassland, trees, and shadows, both techniques indicated a poor shape, edge, and positional accuracy. Most low classification accuracy for MMP arise from the geometrical accuracy, which indicates poor preservation of features by MP after its extension to MMP.
The second accuracy assessment was performed for each classification map produced in the study. To evaluate how well both algorithms correctly classified the thematic categories in a heterogeneous urban landscape (i.e., the percentage of correctly classified samples), analysis of the categories was performed to evaluate how well both CMP and MMP utilized statistical information from the dataset to discriminate land cover classes. Table 6 and Table 7 show detailed confusion matrices of classification accuracies for CMP and MMP, respectively. The CMP and MMP classification accuracy results over Boksburg and Sunninghill were similar as shown in Table 6 and Table 7. Overall, accuracies for CMP were 83.14% and 83.19% for Boksburg and Sunninghill, respectively. Similarly, the MMP overall accuracies were 84.42% and 84.08% for Boksburg and Sunninghill, respectively.
Overall, both CMP and MMP performed almost similarly for artificial objects, such as buildings and roads, in terms of overall classification accuracy. The accuracy assessment shows the overall accuracies of 83% for CMP and 84% for MMP classification. Producer accuracy for water and built-up areas were highest in comparison to other classes in both classifiers, where CMP produced 94% and 90% as compared to 92% and 91% for MMP. Producer accuracy for shadows and grassland was lower for both classifiers, with CMP achieving 40% and 57%, respectively, and MMP achieving 58% and 62%, respectively. However, a relative difference existed among the classifiers when evaluating the individual classes. Individual class type’s producer accuracy indicated fairly high classification accuracy for MMP compared to CMP. A 95% confidence limit revealed a wide variability and overlap in overall accuracy reported between CMP and MMP classification results. Based on this result, the lowest-performing classification model, CMP, was within the range of the best performing MMP.
Based on a comparison among predictions made with optimized feature transformation techniques based on the use of PCA and without the use of PCA, the McNemar test indicated that the difference between CMP and MMP was not statistically significant (p > 0.05).
4. Discussion
This study evaluated the performance of two MM techniques, MMP and CMP, based on a reconstruction approach. The two techniques were evaluated in terms of their ability to distinguish as well as preserve geometrical characteristics of image features in a heterogeneous urban landscape. Morphological profiles based on a reconstruction approach and its extension have been proven in the literature to provide better shape preservation [24,25,31,32,33,34,35,36] and classification techniques for land cover classification. The aim of comparing concatenation of morphological profiles by reconstruction transform (CMP) against its extension (MMP) in urban land cover classification was to determine the effects of image dimensionality reduction techniques, such as PCA, to construct MMP geometrical characteristics during urban land cover classification. Specifically, the study sought to evaluate characteristics, such as shape, thematic, edge, and positional similarity, of image objects from very high-resolution data sets.
In general, similar and visually acceptable results were produced for land cover classification using either CMP or MMP image analysis techniques. By visual comparison, both classifiers achieved a fairly significant distinction of heterogeneous urban land cover classes. The MMP provided a better distinction of features, especially separating water bodies from shadows as compared to CMP (Figure 3). The enhanced classification accuracy is due to the development of MMP which synthesizes spectra-spatial information extracted from multicomponent base images [25,33,36,37]. The MMP is constructed based on the use of PCA to decrease the curse of the dimensionality problem in standard mathematical profiles which then provide effective separation of the distribution of the classes in the transformed multispectral and panchromatic band. The CMP is challenged in analyzing multispectral bands or statistical information on the imagery, compared to MMP. However, comparing the classifiers in terms of geometrical characteristics preservation and thematic accuracy, CMP outperformed MMP in preserving geometrical characteristics during the classification of features in a heterogeneous urban landscape. This may be because an MMP is constructed from concatenation of EMPs based on PCA. Essentially, PCA is an edge-based image dimensional reduction algorithm which may blur object boundaries. Both CMP and MMP can be used to accurately classify a heterogeneous urban landscape. However, preservation of geometrical characteristics during classification may be challenging, especially for natural boundaries. Objects with natural boundaries may not have crisp edges and are usually affected by boundary blur which results in classification error [27,28,38]. Hence, classifying artificial boundaries, such as buildings, may reach high levels of similarity due to the use of very high-resolution imagery and shapes for natural objects that have crisp edges.
Previous studies evaluated MM techniques based on the comparison of morphological filters using reconstruction transform and standard morphological transformation. Similar results have been observed in related studies [25,31,33,34,37] and indicated that morphological profile based on a reconstruction approach had better shape preservation than classical morphological filters. However, extending MPs to MMPs using PCA for dimensionality reduction may decrease the overall capability of MMPs to provide better shape preservation, although it increases its ability to analyze statistical information, which has been a curse for MP.
Overall, the results indicate that the use of MP techniques and its extension based on reconstruction provides better capabilities in classifying a heterogonous urban landscape using very high-resolution imagery. The CMP and MMP techniques address challenges such as speckle or salt and pepper effects from classical remote sensing classification techniques. The results indicate that CMP provides better shape preservation than its extension MMP. However, MMP provides better thematic or class discrimination capability compared to CMP due to the fact of its ability to synthesize spectral–spatial information from current sensor development. The effect of geometrical shape preservation from MMP is due to the use of PCA, which is an edge-based technique that blurs image objects’ shapes.
5. Conclusions
This study evaluated the efficacy of two morphological techniques, one based on the concatenation of MPs (CMP) and the other based on its MMP extension which used PCA to reduce the dimensionality reduction problem associated with MP. The CMP produced an overall accuracy of 83.14% and 83.19% over the two study areas, while MMP produced 84.42% and 84.08% over the two study sites. The study also established that the CMP technique produced better shape accuracy results for artificial land cover features such as buildings/roads and natural features with clear boundaries (e.g., water). This was attested to by high accuracies of 0.86 for buildings, 0.85 for roads, and 0.77 for water. In contrast, MMP produced relatively poor overall classification accuracies in terms of shape. The MMP overall accuracies for shape were 0.22 for buildings, 0.47 for roads, and 0.68 for water. Similar occurrences for edge and thematic accuracy were evident, where artificial features were correctly classified by CMP compared MMP. However, when evaluating accuracy for the natural features or features without clear boundaries, such as grassland, trees, and shadows, both techniques indicated a poor shape, edge, and positional accuracy. Most of the low classification accuracy for MMP arose from the geometrical accuracy which indicates poor preservation of features by MP after its extension to MMP. The study therefore ascertained that that the CMP technique provides an effective tool for analysis of very high spatial resolution remotely sensed images that produce better shape preservation compared to MMP.
The study concludes that CMP and MMP can greatly improve the classification of heterogeneous landscape that typify urban areas by effectively representing the structural landscape information necessary for discriminating related land cover classes. In general, similar and visually acceptable results were produced for land cover classification using either CMP or MMP image analysis techniques. However, concerning the overall classification accuracy, MMP produced slightly higher classification results compared to CMP. Nevertheless, the difference was not statistically significant, with a p-value greater than 0.05. In terms of visual inspection from the thematic maps, MMP could separate features, such as water from shadows, when compared to CMP. Separating water from shadows is commonly a challenge for most remote sensing algorithms. Therefore, MMP can effectively be used for classification of a heterogeneous urban land cover. In summary, it can be concluded that both CMP and MMP techniques are effective in classifying land cover in heterogeneous urban landscape and are particularly effective in discriminating spectrally similar land cover classes.
Author Contributions
Conceptualization, L.T.T., P.M. and J.O.; methodology, L.T.T., P.M. and J.O.; software, L.T.T.; validation, L.T.T.; formal analysis, L.T.T.; investigation, L.T.T.; resources, P.M.; writing—original draft preparation, L.T.T.; writing—review and editing, L.T.T., P.M. and J.O.; supervision, J.O. and P.M.; project administration, J.O. and P.M. All authors have read and agreed to the published version of the manuscript.
Funding
This research received no external funding.
Acknowledgments
We acknowledge the support provided by the South African National Space Agency (SANSA) Earth Observation Directorate and the National Geo-Spatial Information (NGI) in South Africa for providing the satellite imagery and aerial photography used in this study.
Conflicts of Interest
The authors declare no conflict of interest.
References
- Blaschke, F.T.; Hay, G.J.; Kelly, M.; Lang, S.; Hofmann, P.; Addink, E.; Feitosa, R.Q.; Van Der Meer, F.; Van Der Werff, H.; Van Coilli, E. Geographic object-based image analysis–towards a new paradigm. ISPRS J. Photogramm. Remote Sens. 2014, 87, 180–191. [Google Scholar] [CrossRef]
- Oleson, S.K.; Niu, G.Y.; Yang, Z.L.; Lawrence, D.; Thornton, P.; Lawrence, P.; Stöckli, R.; Dickinson, R.; Bonan, G.; Levis, S.; et al. Improvements to the Community Land Model and their impact on the hydrological cycle. J. Geophys. Res. Biogeosci. 2008, 113. [Google Scholar] [CrossRef]
- Voltersen, C.M.; Berger, C.; Hese, S.; Schmullius, C. Object-based land cover mapping and comprehensive feature calculation for an automated derivation of urban structure types at block level. Remote Sens. Environ. 2014, 154, 192–201. [Google Scholar] [CrossRef]
- Bosecker, R.R. Sampling Methods in Agriculture; National Agricultural Statistics Service; US Department of Agriculture: District of Columbia, WA, USA, 1988. [Google Scholar]
- Meyer-Roux, C.; King, J. Agriculture and forestry. Int. J. Remote Sens. 1992, 13, 1329–1341. [Google Scholar] [CrossRef]
- Hu, P.T.; Yang, J.; Li, X. Gong Mapping urban land use by using landsat images and open social data. Remote Sens. 2016, 8, 151. [Google Scholar] [CrossRef]
- Carrizosa, E.; Morales, D.R. Supervised classification and mathematical optimization. Comput. Oper. Res. 2013, 40, 150–165. [Google Scholar] [CrossRef]
- Entezari-Maleki, R.; Rezaei, A.; Minaei-Bidgoli, B. Comparison of classification methods based on the type of attributes and sample size. J. Converg. Inf. Technol. 2009, 4, 94–102. [Google Scholar]
- Lillesand, T.; Kiefer, R.W.; Chipman, J. Remote Sensing and Image Interpretation; John Wiley & Sons: Hoboken, NJ, USA, 2014. [Google Scholar]
- Puletti, N.; Perria, R.; Storchi, P. Unsupervised classification of very high remotely sensed images for grapevine rows detection. Eur. J. Remote Sens. 2014, 47, 45–54. [Google Scholar] [CrossRef]
- Blanzieri, E.; Melgani, F. Nearest neighbor classification of remote sensing images with the maximal margin principle. IEEE Trans. Geosci. Remote Sens. 2008, 46, 1804–1811. [Google Scholar] [CrossRef]
- Goncalves, M.L.; Netto, M.L.A.; Costa, J.A.F.; Zullo Junior, J. An unsupervised method of classifying remotely sensed images using Kohonen self-organizing maps and agglomerative hierarchical clustering methods. Int. J. Remote Sens. 2008, 29, 3171–3207. [Google Scholar] [CrossRef]
- Shalaby, A.; Tateishi, R. Remote sensing and GIS for mapping and monitoring land cover and land-use changes in the Northwestern coastal zone of Egypt. Appl. Geogr. 2007, 27, 28–41. [Google Scholar] [CrossRef]
- Mhangara, P.; Odindi, P. Potential of texture-based classification in urban landscapes using multispectral aerial photos. S. Afr. J. Sci. 2013, 109, 1–8. [Google Scholar] [CrossRef]
- Alajlan, N.; Bazi, Y.; Melgani, F.; Yager, R.R. Fusion of supervised and unsupervised learning for improved classification of hyperspectral images. Inf. Sci. 2012, 217, 39–55. [Google Scholar] [CrossRef]
- Zhang, H.X.; Feng, X.J. Object-oriented method for urban vegetation mapping using IKONOS imagery. Int. J. Remote Sens. 2010, 31, 177–196. [Google Scholar] [CrossRef]
- Campagnolo, M.L.; Cerdeira, J.O. Contextual classification of remotely sensed images with integer linear programming. In Proceedings of the CompIMAGE-Computational Modelling of Objects Represented in Images: Fundamentals, Methods and Applications, Cracow, Poland, 2–5 July 2018; pp. 123–128. [Google Scholar]
- Gong, B.P.; Miller, J.; Freemantle, J.C. Spectral decomposition of Landsat Thematic Mapper data for urban land cover mapping. In Proceedings of the 14th Canadian Symposium on Remote Sensing, Calgary, AB, Canada, 6–10 May 1991. [Google Scholar]
- Weih, N.D.; Riggan, R.C. Object-based classification vs. pixel-based classification: Comparative importance of multi-resolution imagery. Int. Arch. Photogramm. Remote Sens. Spat. Inf. Sci. 2010, 38, C7. [Google Scholar]
- Duro, D.C.; Franklin, S.E.; Dubé, M.G. A comparison of pixel-based and object-based image analysis with selected machine learning algorithms for the classification of agricultural landscapes using SPOT-5 HRG imagery. Remote Sens. Environ. 2012, 118, 259–272. [Google Scholar] [CrossRef]
- Zingman, K.I.; Saupe, D.; Lamber, S. Morphological operators for segmentation of high contrast textured regions in remotely sensed imagery. In Proceedings of the 2012 IEEE International Geoscience and Remote Sensing Symposium, Munich, Germany, 22–27 July 2012. [Google Scholar]
- Geneletti, D.; Gorte, B.G.H. A method for object-oriented land cover classification combining Landsat TM data and aerial photographs. Int. J. Remote Sens. 2003, 24, 1273–1286. [Google Scholar] [CrossRef]
- Soille, P.; Pesaresi, M. Advances in mathematical morphology applied to geoscience and remote sensing. IEEE Trans. Geosci. Remote Sens. 2002, 40, 2042–2055. [Google Scholar] [CrossRef]
- Pesaresi, M.; Benediktsson, J.A. A new approach for the morphological segmentation of high-resolution satellite imagery. IEEE Trans. Geosci. Remote Sens. 2001, 39, 309–320. [Google Scholar] [CrossRef]
- Huang, X.; Guan, X.; Benediktsson, J.A.; Zhang, L.; Li, J.; Plaza, A.; Dalla Mura, M. Multiple morphological profiles from multicomponent-base images for hyperspectral image classification. IEEE J. Sel. Top. Appl. Earth Obs. Remote Sens. 2014, 7, 4653–4669. [Google Scholar] [CrossRef]
- Manandhar, R.; Odehi, I.O.A.; Ancevt, T. Improving the accuracy of land use and land cover classification of landsat data using post-classification enhancement. Remote Sens. 2009, 1, 330–344. [Google Scholar] [CrossRef]
- Lizarazo, I. Accuracy assessment of object-based image classification: Another STEP. Int. J. Remote Sens. 2014, 35, 6135–6156. [Google Scholar] [CrossRef]
- Lizarazo, I.; Elsner, P. Fuzzy segmentation for object-based image classification. Int. J. Remote Sens. 2009, 30, 1643–1649. [Google Scholar] [CrossRef]
- MacLean, M.G.; Congalton, R.G. Map accuracy assessment issues when using an object-oriented approach. In Proceedings of the American Society for Photogrammetry and Remote Sensing Annual Conference 2012, ASPRS 2012, Sacramento, CA, USA, 19–23 March 2012; pp. 369–373. [Google Scholar]
- Foody, G.M. Thematic Map Comparison. Photogramm. Eng. Remote Sens. 2013, 70, 627–633. [Google Scholar] [CrossRef]
- Huang, X.; Zhang, L. A multidirectional and multiscale morphological index for automatic building extraction from multispectralgeoeye-1 imagery. Photogramm. Eng. Remote Sens. 2011, 77, 721–732. [Google Scholar] [CrossRef]
- Huang, X.; Zhang, L.; Li, P. Classification and extraction of spatial features in urban areas using high-resolution multispectral imagery. IEEE Geosci. Remote Sens. Lett. 2007, 4, 260–264. [Google Scholar] [CrossRef]
- Huang, X.; Zhang, L. Morphological building/shadow index for building extraction from high-resolution imagery over urban areas. IEEE J. Sel. Top. Appl. Earth Obs. Remote Sens. 2011, 5, 161–172. [Google Scholar] [CrossRef]
- Dalla Mura, M.; Benediktsson, J.A.; Waske, B.; Bruzzone, L. Morphological attribute profiles for the analysis of very high resolution images. IEEE Trans. Geosci. Remote Sens. 2010, 48, 3747–3762. [Google Scholar] [CrossRef]
- Dura Mura, M.; Benediktsson, J.A.; Waske, B.; Bruzzone, L. Morphological attribute filters for the analysis of very high resolution remote sensing images. Int. Geosci. Remote Sens. Symp. (IGARSS) 2009, 3, 97–100. [Google Scholar]
- Palmason, J.A.; Benediktsson, J.A.; Arnason, K. Morphological Transformations and Feature Extraction for Urban Data with High Spectral and Spatial Resolution. Int. Geosci. Remote Sens. Symp. (IGARSS) 2003, 1, 470–472. [Google Scholar]
- Pesaresi, M.; Huadong, G.; Blaes, X.; Ehrlich, D.; Ferri, S.; Gueguen, L.; Halkia, M.; Kauffmann, M.; Kemper, T.; Lu, L.; et al. A global human settlement layer from optical HR/VHR RS data: Concept and first results. IEEE J. Sel. Top. Appl. Earth Obs. Remote Sens. 2013, 6, 2102–2131. [Google Scholar] [CrossRef]
- Yurtseven, H.; Akgul, M.; Coban, S.; Gulci, S. Determination and accuracy analysis of individual tree crown parameters using UAV based imagery and OBIA techniques. Meas. J. Int. Meas. Confed. 2019, 14, 651–664. [Google Scholar] [CrossRef]


© 2020 by the authors. Licensee MDPI, Basel, Switzerland. This article is an open access article distributed under the terms and conditions of the Creative Commons Attribution (CC BY) license (http://creativecommons.org/licenses/by/4.0/).