Article

Impact of the Dust Aerosol Model on the VIIRS Aerosol Optical Depth (AOD) Product across China

1
Institute of Geography, Fujian Normal University, Fuzhou 350007, China
2
College of Geographical Sciences, Fujian Normal University, Fuzhou 350007, China
3
State Key Laboratory of Remote Sensing Science, Aerospace Information Research Institute, Chinese Academy of Sciences, Beijing Normal University, Beijing 100101, China
4
State Key Laboratory of Atmospheric Boundary Layer Physics and Atmospheric Chemistry, Institute of Atmospheric Physics, Chinese Academy of Sciences, Beijing 100101, China
5
Beijing Municipal Environmental Monitoring Centre, Beijing 100048, China
*
Author to whom correspondence should be addressed.
Remote Sens. 2020, 12(6), 991; https://doi.org/10.3390/rs12060991
Submission received: 22 February 2020 / Revised: 16 March 2020 / Accepted: 17 March 2020 / Published: 19 March 2020
(This article belongs to the Special Issue Remote Sensing of Greenhouse Gases and Air Pollution)

Abstract

:
The Visible Infrared Imaging Radiometer Suite (VIIRS) has been observing aerosol optical depth (AOD), which is a critical parameter in air pollution and climate change, for more than 7 years since 2012. Due to limited and uneven distribution of the Aerosol Robotic Network (AERONET) station in China, the independent data from the Campaign on Atmospheric Aerosol Research Network of China (CARE-China) was used to evaluate the National Oceanic and Atmospheric Administration (NOAA) VIIRS AOD products in six typical sites and analyze the influence of the aerosol model selection process in five subregions, particularly for dust. Compared with ground-based observations, the performance of all retrievals (except the Shapotou (SPT) site) is similar to other previous studies on a global scale. However, the results illustrate that the AOD retrievals with the dust model showed poor consistency with a regression equation as y = 0.312x + 0.086, while the retrievals obtained from the other models perform much better with a regression equation as y = 0.783x + 0.119. The poor AOD retrieval with the dust model was also verified by a comparison with the Moderate Resolution Imaging Spectroradiometer (MODIS) aerosol product. The results show they have a lower correlation coefficient (R) and a higher mean relative error (MRE) when the aerosol model used in the retrieval is identified as dust. According to the Ultraviolet Aerosol Index (UVAI), the frequency of dust type over southern China is inconsistent with the actual atmospheric condition. In addition, a comparison of ground-based Ångström exponent (α) values yields an unexpected result that the dust model percentage exceed 40% when α < 1.0, and the mean α shows a high value of ~0.75. Meanwhile, the α peak value (~1.1) of the “dust” model determined by a satellite retravel algorithm indicate there is some problem in the dust model selection process. This mismatching of the aerosol model may partly explain the low accuracy at the SPT and the systemic biases in regional and global validations.

1. Introduction

Aerosols play a critical role in environment and climate [1,2,3], and they are associated with atmospheric pollution that has a considerable impact on human health [4,5]. Aerosol optical depth (AOD) is an integral of the aerosol extinction coefficient and is a parameter to describe the amount of aerosol in the atmosphere. To quantify the trend of aerosol loading and determine how aerosols impact climate, a continuous aerosol climate data record (CDR) is required [6,7]. Satellite remote sensing has the ability to monitor the spatial-temporal distribution of AOD on regional and global scales, thereby filling the gap of the limited ground-based in situ observations [8].
Although the Moderate Resolution Imaging Spectroradiometer (MODIS) has retrieved AOD for more than 15 years [9], this period is insufficient for climate research. As the successor of MODIS, the Visible Infrared Imaging Radiometer Suite (VIIRS) on board the Suomi National Polar-orbiting Partnership (Suomi-NPP) satellite will perform aerosol observations after the decommissioning of MODIS in the next few years [10]. Therefore, to quantify the accuracy and understand the consistency of the VIIRS AOD product is important. However, according to the recent preliminary validations [11,12], the VIIRS retrievals overestimate the AOD when the AOD is low and underestimate the AOD when the AOD is high, and the biases depend on the AOD range. Under the condition of heavy polluted aerosol loadings across China, the VIIRS AOD retrievals are unavailable because of strict cloud mask and ephemeral water test [13].
According to radiation transfer theory, the top-of-atmosphere (TOA) radiance is a combination of the atmospheric path radiance and contributions from the Earth’s surface, but the radiance information observed by a passive satellite is not sufficient enough to distinguish them. Therefore, retrieval of aerosol properties from this complicated TOA signal is an ill-posed inverse problem, and requires prior knowledge about the surface and aerosol. The identification of realistic optical properties of aerosol models is one of the most difficult and crucial tasks in any aerosol retrieval algorithm. Different algorithms have different aerosol model prior and model selection strategies. For example, the aerosol model used in the advanced along-track scanning radiometer (AATSR) dual-view algorithm (ADV) over land is a mixture of four aerosol components [14,15]. In the Multiangle Imaging Spectro Radiometer (MISR) aerosol algorithm, the aerosol models are a mixture of individual components and selected by “goodness-of-fit” criteria [16]. The VIIRS AOD retrieval is based on the MODIS atmospheric correction heritage [10,17,18]. However, the algorithms used by VIIRS and MODIS are different in some way, such as in the cloud mask, aerosol model setting, and calculation processes [10]. One of most obvious differences is in the aerosol model selection. The MODIS algorithm combines two bimodal size distribution aerosol models, with one dominated by fine aerosols and the other dominated by coarse dust [9]. The fine model is empirically determined depending on time and location. However, in the VIIRS algorithm, the aerosol model is selected from one of the five discrete fine and coarse aerosol models by minimizing the residual of the calculated surface reflectance and expected surface reflectance, but never combined them. These models are based on inversions of sky radiance measurements taken by Aerosol Robotic Network (AERONET) stations worldwide [19,20]. Because of the discrepancy in aerosol scattering and absorbing, choosing an improper aerosol model will introduce errors [21], especially mismatching the fine model with the coarse model.
China is a vast country with different geological features; therefore, the aerosol sources and components are complex and highly varied. According to in situ observations, large differences in chemical species among different regions and seasons were observed at 16 sites [22]. The PM2.5 mass and chemical composition show large contributions from carbon, sulfate, nitrate, ammonium, and fugitive dust [23,24,25], and research has shown that ~10% to ~20% of PM2.5 is derived from fugitive dust in most large Chinese cities [26,27]. The aerosol components are complex and vary with time and location; if the VIIRS algorithm uses a wrong aerosol model that cannot characterize the real aerosol physical and chemical properties, the AOD might be retrieved improperly. In the VIIRS aerosol algorithm, the dust model is most frequently selected (43% of the time) worldwide and is even selected over areas such as the Amazon [11], where there is little dust. Similar errors also appear over southern China, as shown in examples in Figure 1. Recent research also described a potential aerosol model selection issue in the VIIRS AOD algorithm [28].
In this work, our main focus was to determine how the VIIRS AOD performs across China and how the VIIRS AOD accuracy is affected by the dust aerosol model over land. Mainland China was chosen as the study area where different types of aerosols are distributed. The distribution of AERONET sites in China is not sufficiently homogeneous and the coverage is short and discontinuous. Thus, we collected aerosol data from a long-term and wide-coverage aerosol observation network (Campaign on Atmospheric Aerosol Research Network of China (CARE-China)) to validate the VIIRS AOD product. Section 2 briefly describes the study area, the data sets used in this study, and the validation approach. Section 3 presents the results and analysis. Section 4 presents a discussion and summarizes the study.

2. Materials and Methods
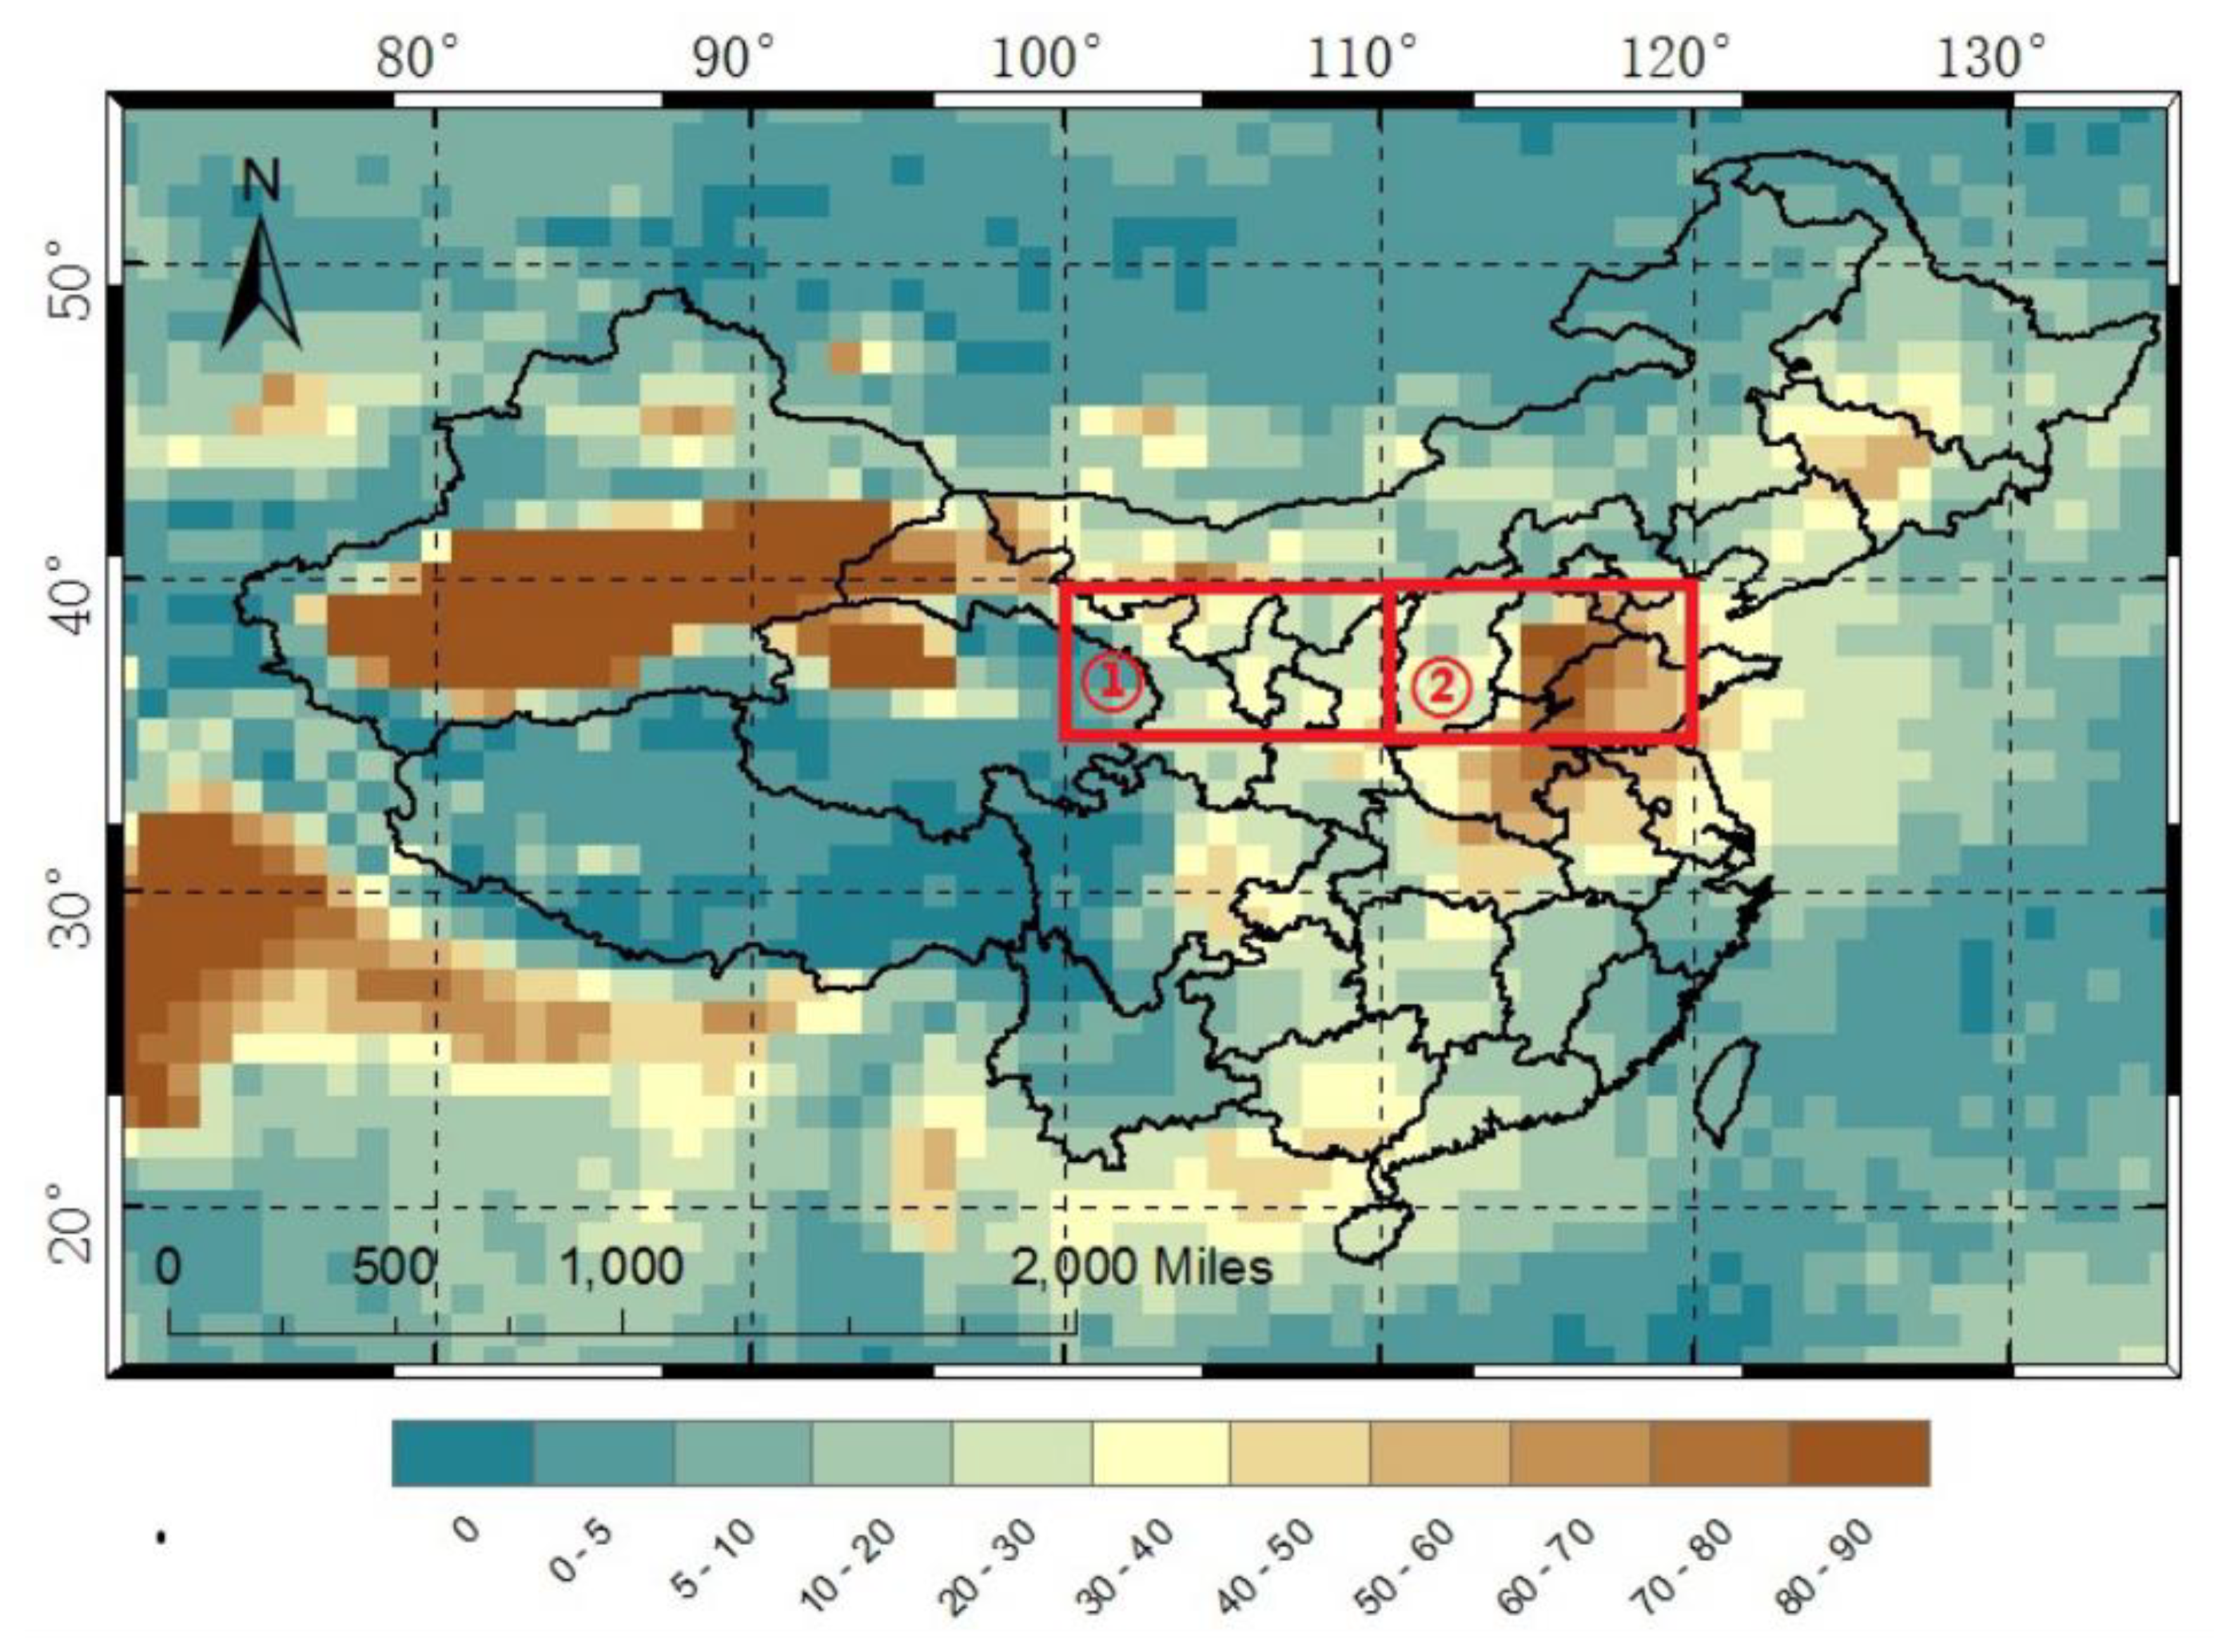
2.1. Study Area

The study area is the mainland China, where aerosol sources vary largely with geographic location. As shown in Figure 2, we separated the study area into five subregions to further analyze the VIIRS AOD. The details of these subregions are presented in Table 1.
The Center and West of China (CWC) subregion is close to the Gobi Desert in the north, and most of the areas are semiarid. Thus, the atmospheric aerosols are dominated by the coarse dust. In the North Chain Plain (NCP) subregion, air pollution is the heaviest and most complex inside China because of year-around fossil traffic, industrial emissions, and dust storms in spring. The Center of China (CC) subregion is far from the three mega-city regions in China and is far from the sea. The South of China (SC) and Southeastern Coastal of China (SECC) subregions are both far from dust sources, and the SECC is close to the sea. Urbanization and industrialization are higher in the SECC than in the SC. The major aerosol sources in the five subregions [26,27,29,30,31] are listed Table 1.

2.2. Ground-Based Observations

The Chinese Sun Hazemeter Network (CSHNET) was established in 2004 with 25 stations across China [32], and the observations are consistent with those of AERONET. The network was updated to the name of CARE-China, which is the first comprehensive attempt to assess the physical, chemical, and optical properties of atmospheric aerosols across China [24]. Narrowband portable sunphotometers (Microtops II; www.solarlight.com) are used to measure the direct sunlight at five channels with wavelengths of 440, 500, 675, 870, and 936 nm, and then the AOD is determined. The AOD at 550 nm, denoted as AODCARE hereafter, was calculated by the AOD at 500 and 675 nm using the log-log linear interpolation algorithm [33].
According to the previous validation studies [24,34], the AODCARE are generally consistent with the results of CIMEL sun photometers with 2%–6% discrepancy. A log-linear curve fitting algorithm is applied to AODs at the wavelengths of 440 and 675 nm to estimate the Ångström exponent (α). In this study, the data in 6 sites, Shapotou (SPT), Beijing Forest (BJF), Beijing City (BJC), Changsha City (CSC), Yucheng Agriculture (YCA) and Yantai Coast (YTC), from 1 January 2013 to 31 December 2013 were used to analyze. The surrounding atmospheric environments at the sites are representative of several typical examples of air pollution in China. Detailed information on the sites is listed in Table 2.

2.3. Satellite Data

Two MODIS sensors are in operation on the Terra and Aqua platforms launched in sun-synchronous polar orbits on 18 December 1999 and 4 May 2002, respectively. MODIS is a passive imaging radiometer that measures the reflected solar and emitted thermal radiation in 36 bands, providing global detection every one or two days across a 2330-km swath. Spatial resolutions are 250 m, 500 m, and 1 km at the nadir depending on band, becoming progressively larger at the edge of the swath.
The MODIS aerosol products over land were first retrieved using the Dark Target (DT) algorithm over vegetated regions, and the Deep Blue (DB) aerosol retrieval is then developed to cover bright land surfaces in Collection 5 [35]. The MODIS aerosol products are provided at a normal spatial resolution of 10 × 10 km in Level 2 data (MOD04 for Terra and MYD04 for Aqua). Recently, the retrieval capability has been upgraded to produce Collection 6 [9]. In this study, 10-km resolution MODIS/Aqua Collection 6 AOD products (denoted as AODMODIS) from MYD04 were compared with that of VIIRS.
The VIIRS instrument on board the Suomi-NPP spacecraft was launched in October of 2011 and was designed to have capabilities similar to MODIS [10]. Suomi-NPP have a similar equator crossing time as Aqua (1:30 P.M. local solar equatorial crossing time). VIIRS has 22 spectral bands covering the visible /infrared spectrum from 0.412 to 12.05 μm. These bands can be grouped into three types: five imagery bands (I-bands, 375-m resolution at nadir), 16 moderate-resolution bands (M-bands, 750-m resolution at nadir), and a day/night band (750-m resolution across the scan). In this study, the VIIRS AOD data are produced operationally by National Oceanic and Atmospheric Administration (NOAA). The VIIRS AOD retrievals at 550 nm (denoted as AODVIIRS) are performed at the M-band pixel level using the DT algorithm, and 8 by 8 pixels are aggregated into environment data record (EDR) products at a 6-km resolution. Unless specified otherwise, references to AOD indicate the AOD at 550 nm. The aerosol retrieval algorithm selects one dominant aerosol model with the largest number of pixels involved in the EDR aggregation from five candidate models: Dust, Smoke High Absorption, Smoke Low Absorption, Urban Clean, and Urban Polluted [10].
In this study, VIIRS EDR AOD data (only with high Quality Flag (QF)) at a 6-km resolution and the aerosol model information were compared with ground-based observations. The aerosol type information was obtained from EDR Quality Flags. The spatial-temporal match-up method between AODVIIRS and AODCARE was similar to that between the VIIRS and AERONET data [12,36]. The CARE-China data (including AODCARE and α) were averaged within 1 hour of the VIIRS overpass time, and the AODVIIRS data within a radius of 27.5 km from the CARE-China station were averaged. The aerosol model types were determined by the model with the largest number in a region with a 27.5-km radius, and at least 20% of the total pixels were required to ensure the model’s dominance.
The UV aerosol index (UVAI) has been used widely in detecting UV-absorbing aerosols in the atmosphere, such as smoke and dust [37,38]. Because it is sensitive to dust, we use the frequency of UVAI > 1 to analyze the dust distribution across China. The Ozone Mapping and Profiler Suite (OMPS) is another instrument on Suomi-NPP [39], and its nadir is similar to the Ozone Monitoring Instrument (OMI) on satellite Aqua. The daily Level 3 OMPS UVAI data with a 1 × 1 degree resolution was used in this study.
The MODIS data were downloaded from the Level-1 and Atmosphere Archive & Distribution System (LAADS) Distributed Active Archive Center (DAAC), which is managed by the National Aeronautics and Space Administration (NASA) (https://ladsweb.nascom.nasa.gov/search/). The VIIRS aerosol EDRs are available at the NOAA’s Comprehensive Large Array-data Stewardship System (CLASS) (http://www.nsof.class.noaa.gov). The OMPS UVAI data were downloaded from NASA Goddard Ozone and Air Quality website (https://ozoneaq.gsfc.nasa.gov/data/omps/).

3. Results

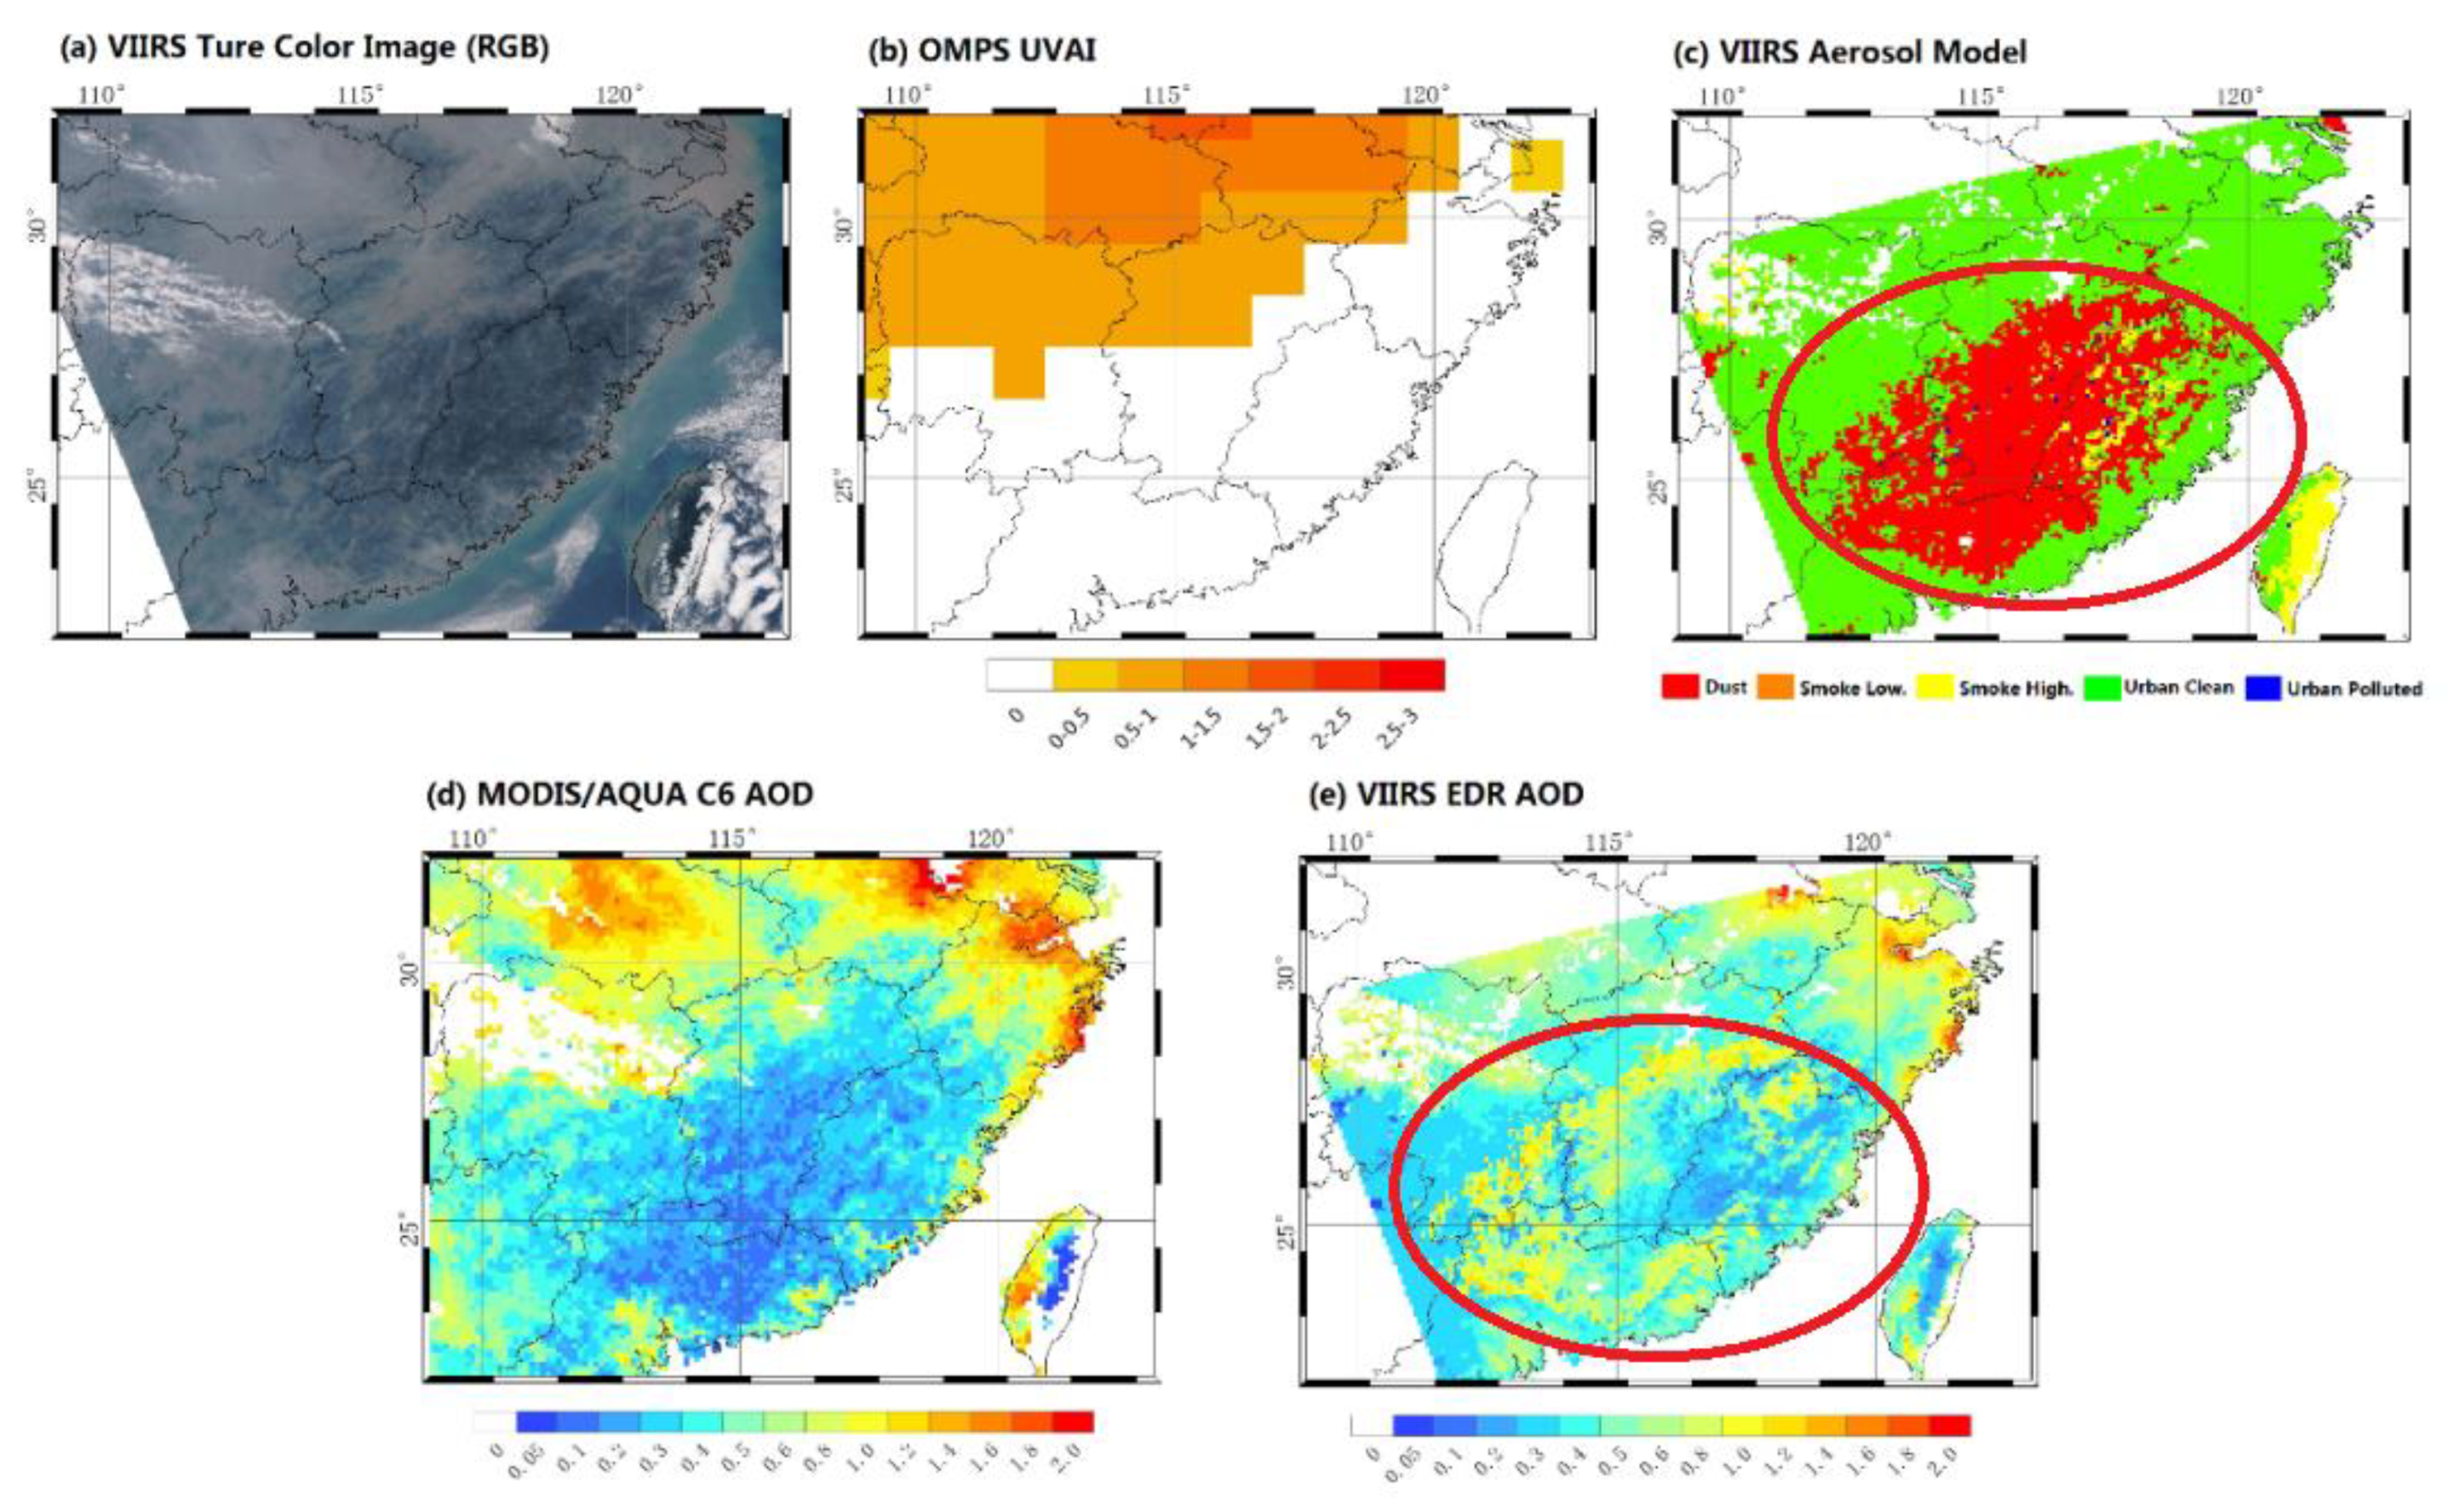
3.1. Case Study of the AOD Retrieval Performance

Validations of satellite products are usually based on ground measurements, such as using the AERONET observations to verify remote sensing AOD. Some regional retrieval errors might be covered up in the large amount of scatter points in total statistics. Figure 1 shows one typical day, 1 March 2016, which was selected to demonstrate the VIIRS AOD retrieval problems. Figure 1a is a true color image (RGB) of VIIRS, Figure 1b shows OMPS UVAI value, Figure 1c shows the code for VIIRS aerosol model types, and Figure 1d and e show the MODIS DB AOD product and VIIRS AOD product, respectively. On this day, large differences were observed in the AOD distribution between the MODIS and VIIRS products. Unreal high AOD values (inside the red ellipse in Figure 1e) are retrieved by VIIRS algorithm; moreover, similar conditions could be observed on other days.
As shown in Figure 1c, dust aerosols dominate the main southern area on 1 March 2016. In this area, the difference between AODVIIRS and AODMODIS is the largest. According to the estimates from the true color image in Figure 1a, the turbidity of the atmosphere could not be as high as the value shown by the AODVIIRS. In addition, as it is shown in Figure 1b, the corresponding UVAI values do not represent high values as dust. Moreover, considering the atmospheric environment in southern China, such a large area is almost impossible to be covered by dust. Based on the analysis of Figure 1 and the credibility of MODIS AOD data, which have been extensively validated for decades, it is reasonable to hypothesize that the AODVIIRS product may have deficiencies, and it may be caused by the use of dust aerosol model inappropriately in the retrievals.

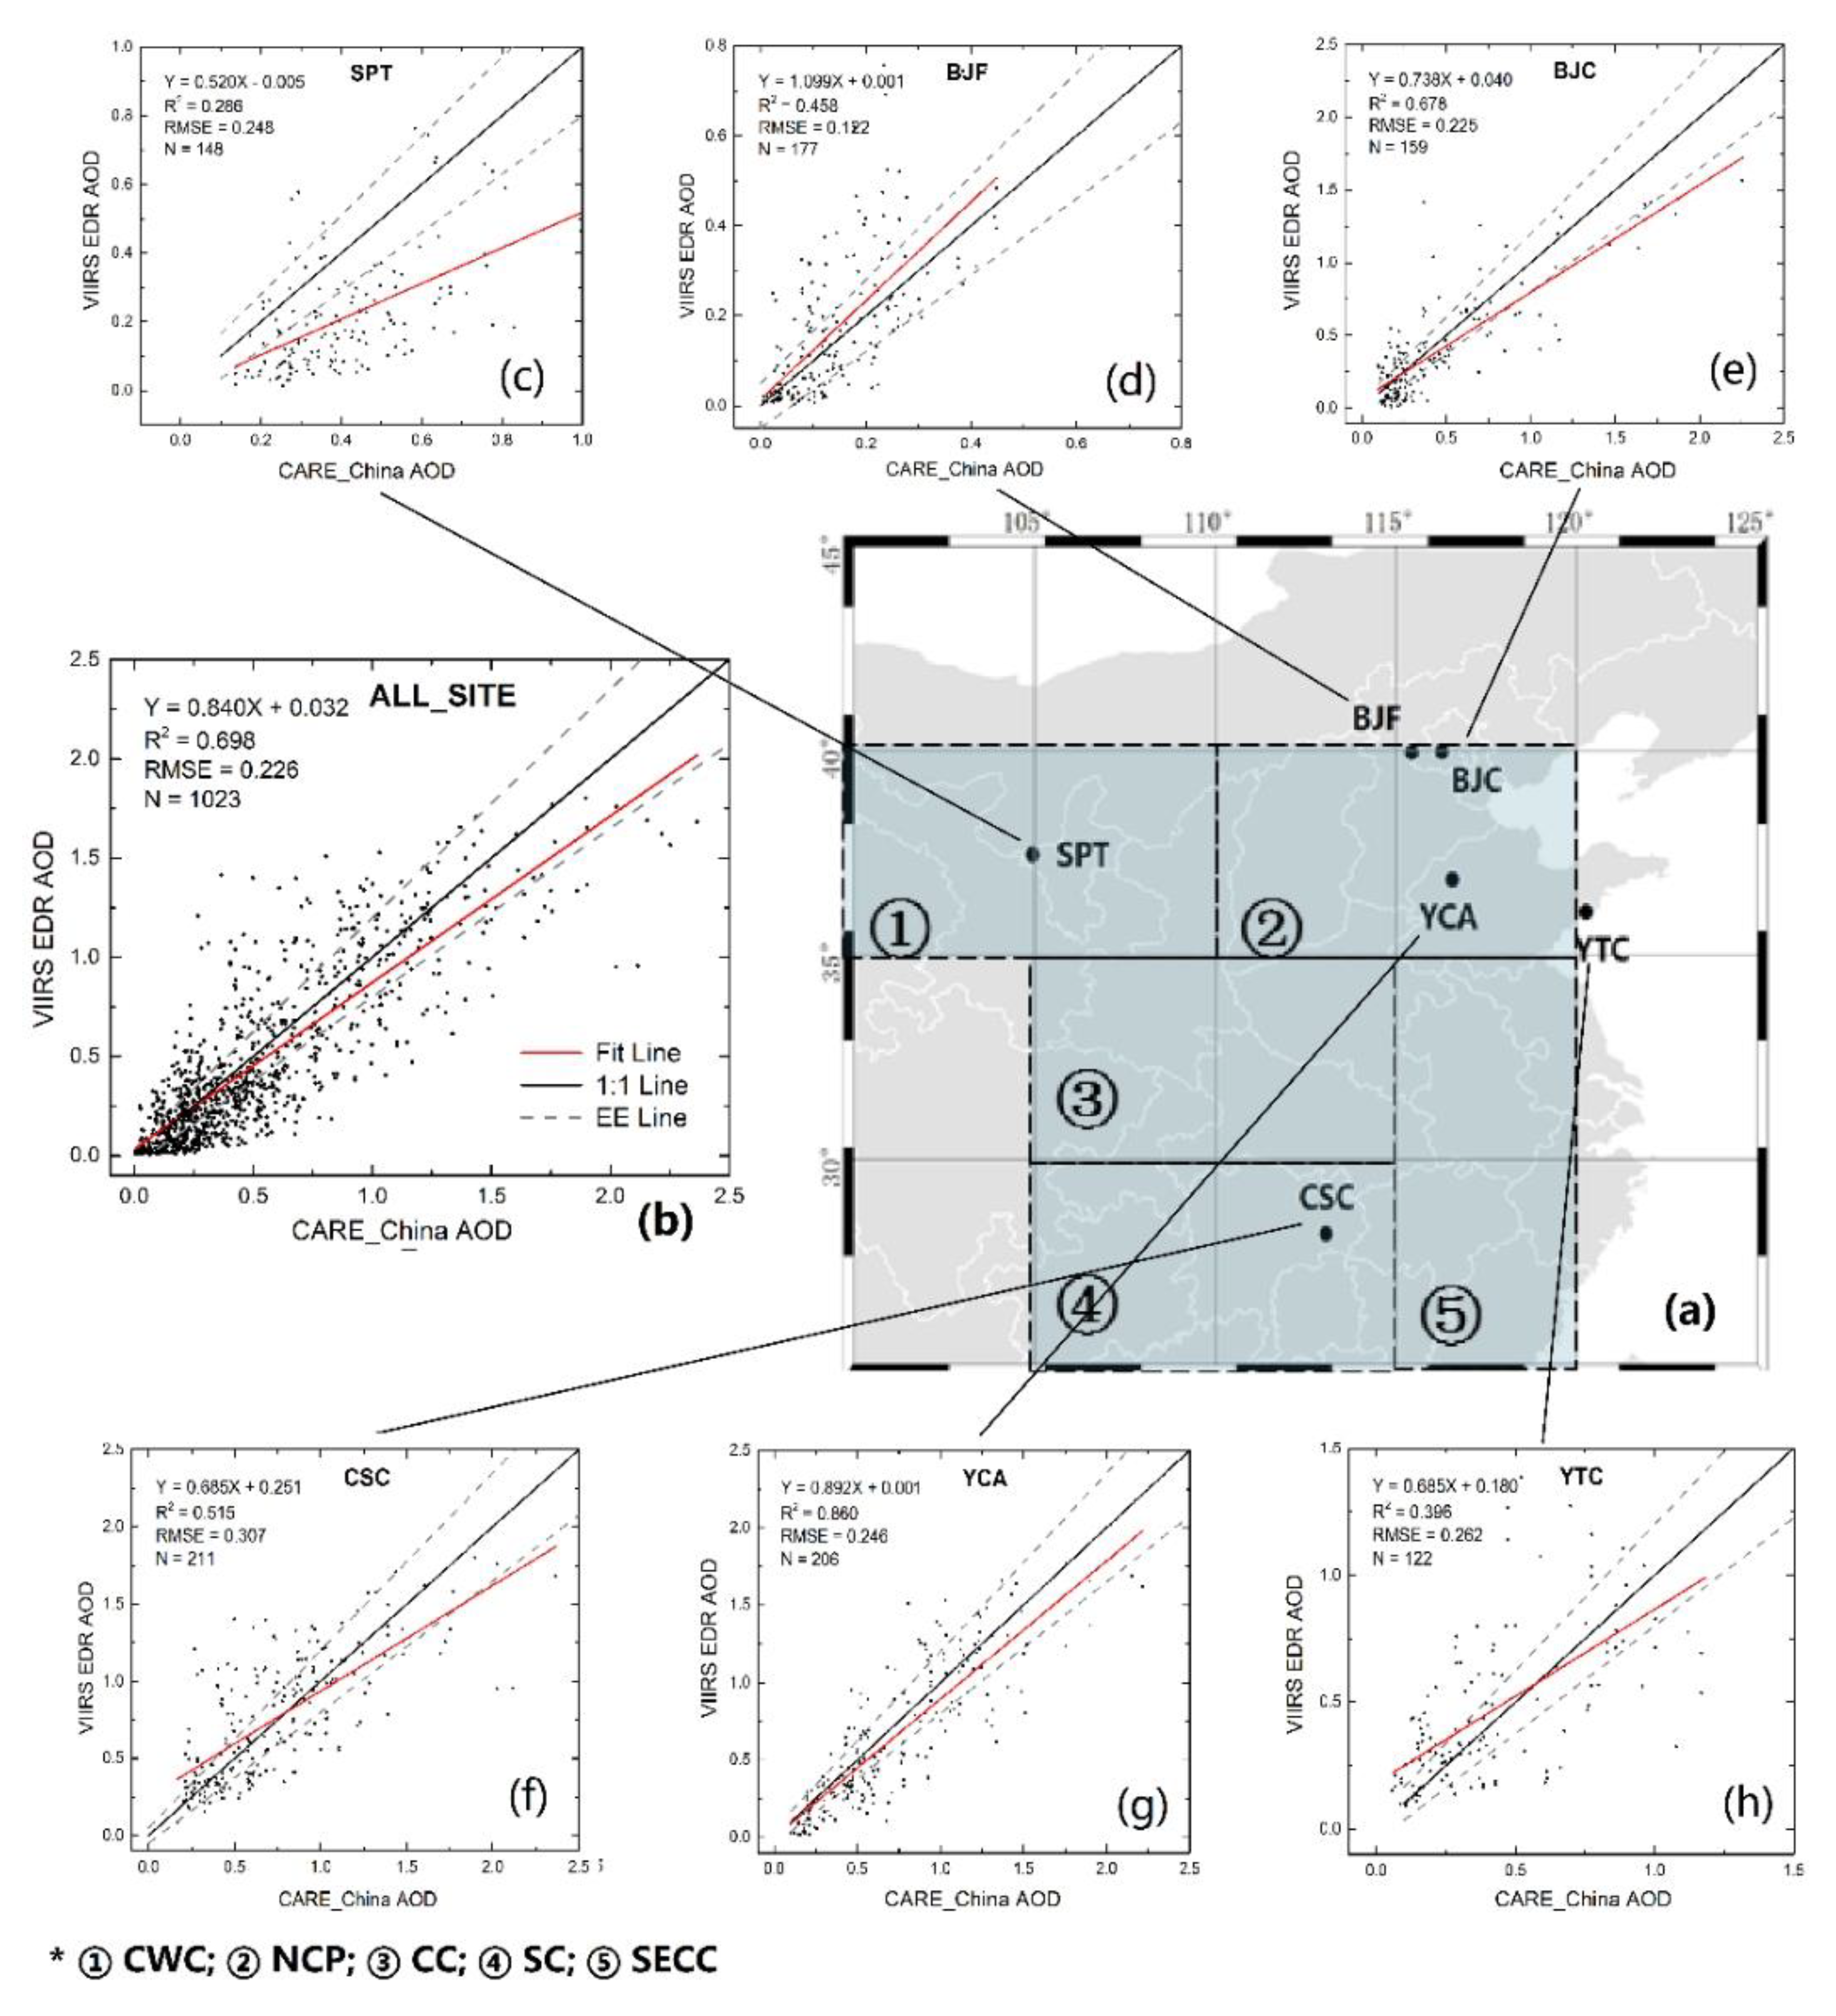
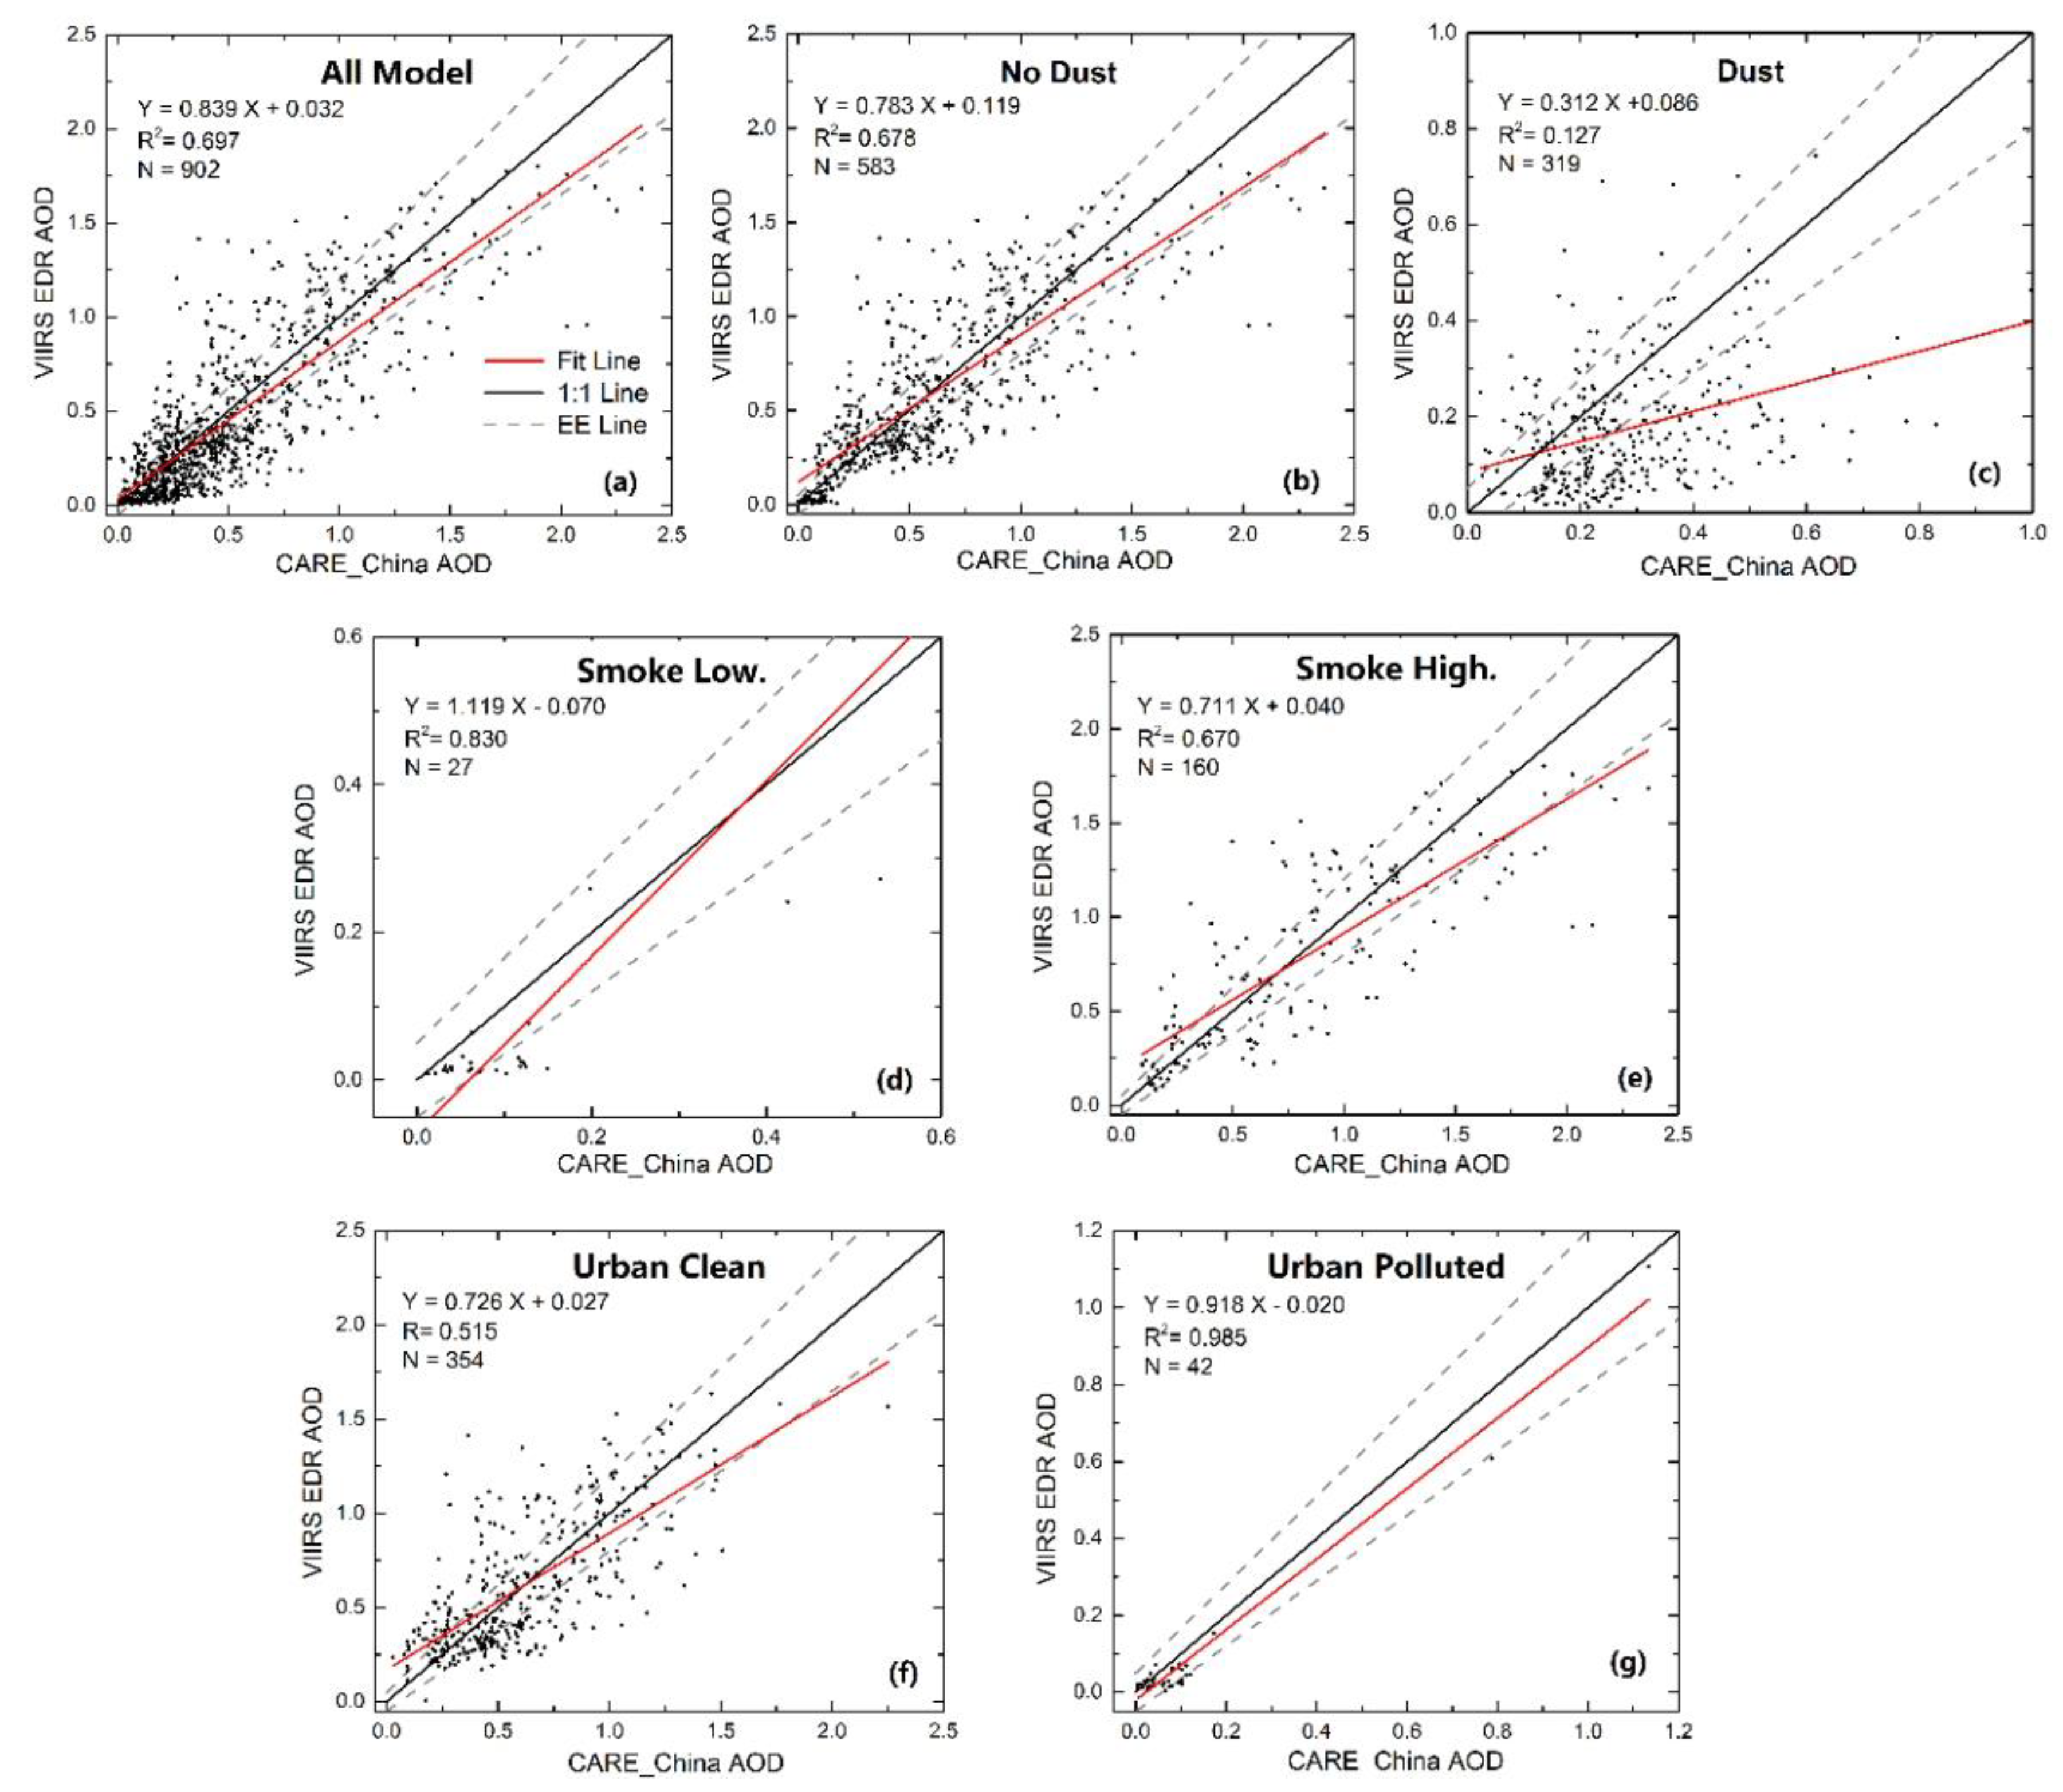
3.2. Comparison between AODVIIRS and AODCARE

The AERONET sites in China are few and in short terms; furthermore, the underlying surface conditions across China are not fully represented by these sites. The various retrieval biases over different regions could hardly be found out from the AERONET data. Because the CARE-China sites are evenly distributed across the country, we chose six typical sites to validate the AODVIIRS. Figure 2 shows the scatter plots between the VIIRS-retrieved EDR AOD and the CARE-China ground-observed AOD, as well as the CARE-China sites’ locations. Statistics results are also listed in Table 3. The collected AODVIIRS results were compared with ground-based observations to evaluate the performance of the AODVIIRS for different surface types. The black solid, gray dashed, and red lines are the 1:1 line, the Expected Error (EE), and the linear regression of the scatters, respectively. The EE is defined as ±(0.05 + 0.15 AOD) over land, where the AOD is the ground-observed AOD.
In Figure 2b, the total number of match-ups was 1023, the linear regression equation was y = 0.840x + 0.032, and the bias (ME) is −0.037. The regression analysis indicated that the AODVIIRS was consistent with the AODCARE, and a high R2 of ~0.698 was observed. Similar to the global validation with y = 0.738x + 0.044, R2 = 0.667 [11], the VIIRS underestimated the AOD slightly over land, but only 42.8% retrieval fall within the MODIS EE envelope across China. Correspondingly, there are more than 71% retrieval fall within the envelope using the worldwide AERONET validation [12]. According to earlier validations [40,41], the percentage falling within the EE envelope only range from 33% to 48.9%. This lower percentage than worldwide validation indicates the VIIRS AOD accuracy decrease across China.
At the background Beijing Forest (BJF) site, the range of AOD is the smallest (less than 0.8) of all six sites. The VIIRS overestimated the AOD with a positive bias of 0.028 and the slope of 1.099, and most of the retrievals out of the EE envelope were above the upper EE line. However, the RMSE (Root Mean Square Error) of 0.122 was smallest. At the BJC site (Figure 1e), which is a city site close to the BJF site, the VIIRS underestimated the AOD with a negative bias of −0.052. The R2 at BJC was higher than that at BJF (0.678 versus 0.458), although the RMSE of 0.225 at BJC was larger than that at BJF. The validation at site YCA showed the greatest consistency with an R2 of 0.860, and the fitting line was closest to the 1:1 line. Because additional retrievals fell outside of the EE envelope at CSC than that at BJC, the RMSE at CSC (0.307) was larger. Similar to BJC, the performance at CSC (Figure 1f) has many scatters and therefore exhibits less precision with high RMSE. At a coastal city site, YTC (Figure 1h), the VIIRS showed a poor estimate of AOD with a low R2 of 0.396 and a high RMSE of 0.262. Among all sites, SPT (Figure 1c) performed the worst, with almost retrievals falling below the 1:1 line, and also had the lowest R2 of 0.286 and highest negative ME of −0.193. The proximity of deserts makes the SPT site have higher proportion of dust aerosol, and brighter underlying surface in SPT is not suitable for AOD retrieval. Therefore, the reason of the bad validation performance in the SPT site is combined the contribution of surface reflectance with the aerosol model.
To further illustrate the influence of the dust aerosols, the data samples were sorted by the dominant aerosol model. The scatter plots of different aerosol types are presented in Figure 3. As mentioned above, the YTC is located near a coastal city where retrievals were dominated by the oceanic model. Because the VIIRS AOD algorithm uses different aerosol models over land and sea retrievals [10], this site is not included in the analysis for land aerosol model comparison. The total number of match-ups is 902, and the R2 is 0.697. The dust model accounts for 319 match-ups, and the other models account for 583. The validation of the no-dust model (Figure 3b) showed similar statistical characteristics with all the data. Individually, the worst correlation of the no-dust model is the Urban Clean aerosol model, which has an R2 of 0.515. The slope of the regression equation for the no-dust model ranges from 0.711 to 1.119, and the R2 ranges from 0.515 to 0.985. However, for the dust model, the VIIRS product tends to underestimate the AOD. The scatter plots show poor performance with an R2 of 0.127 and a regression equation of y = 0.312x + 0.086. The retrieval of the dust aerosol model exhibits an obviously worse performance than that of the other models.

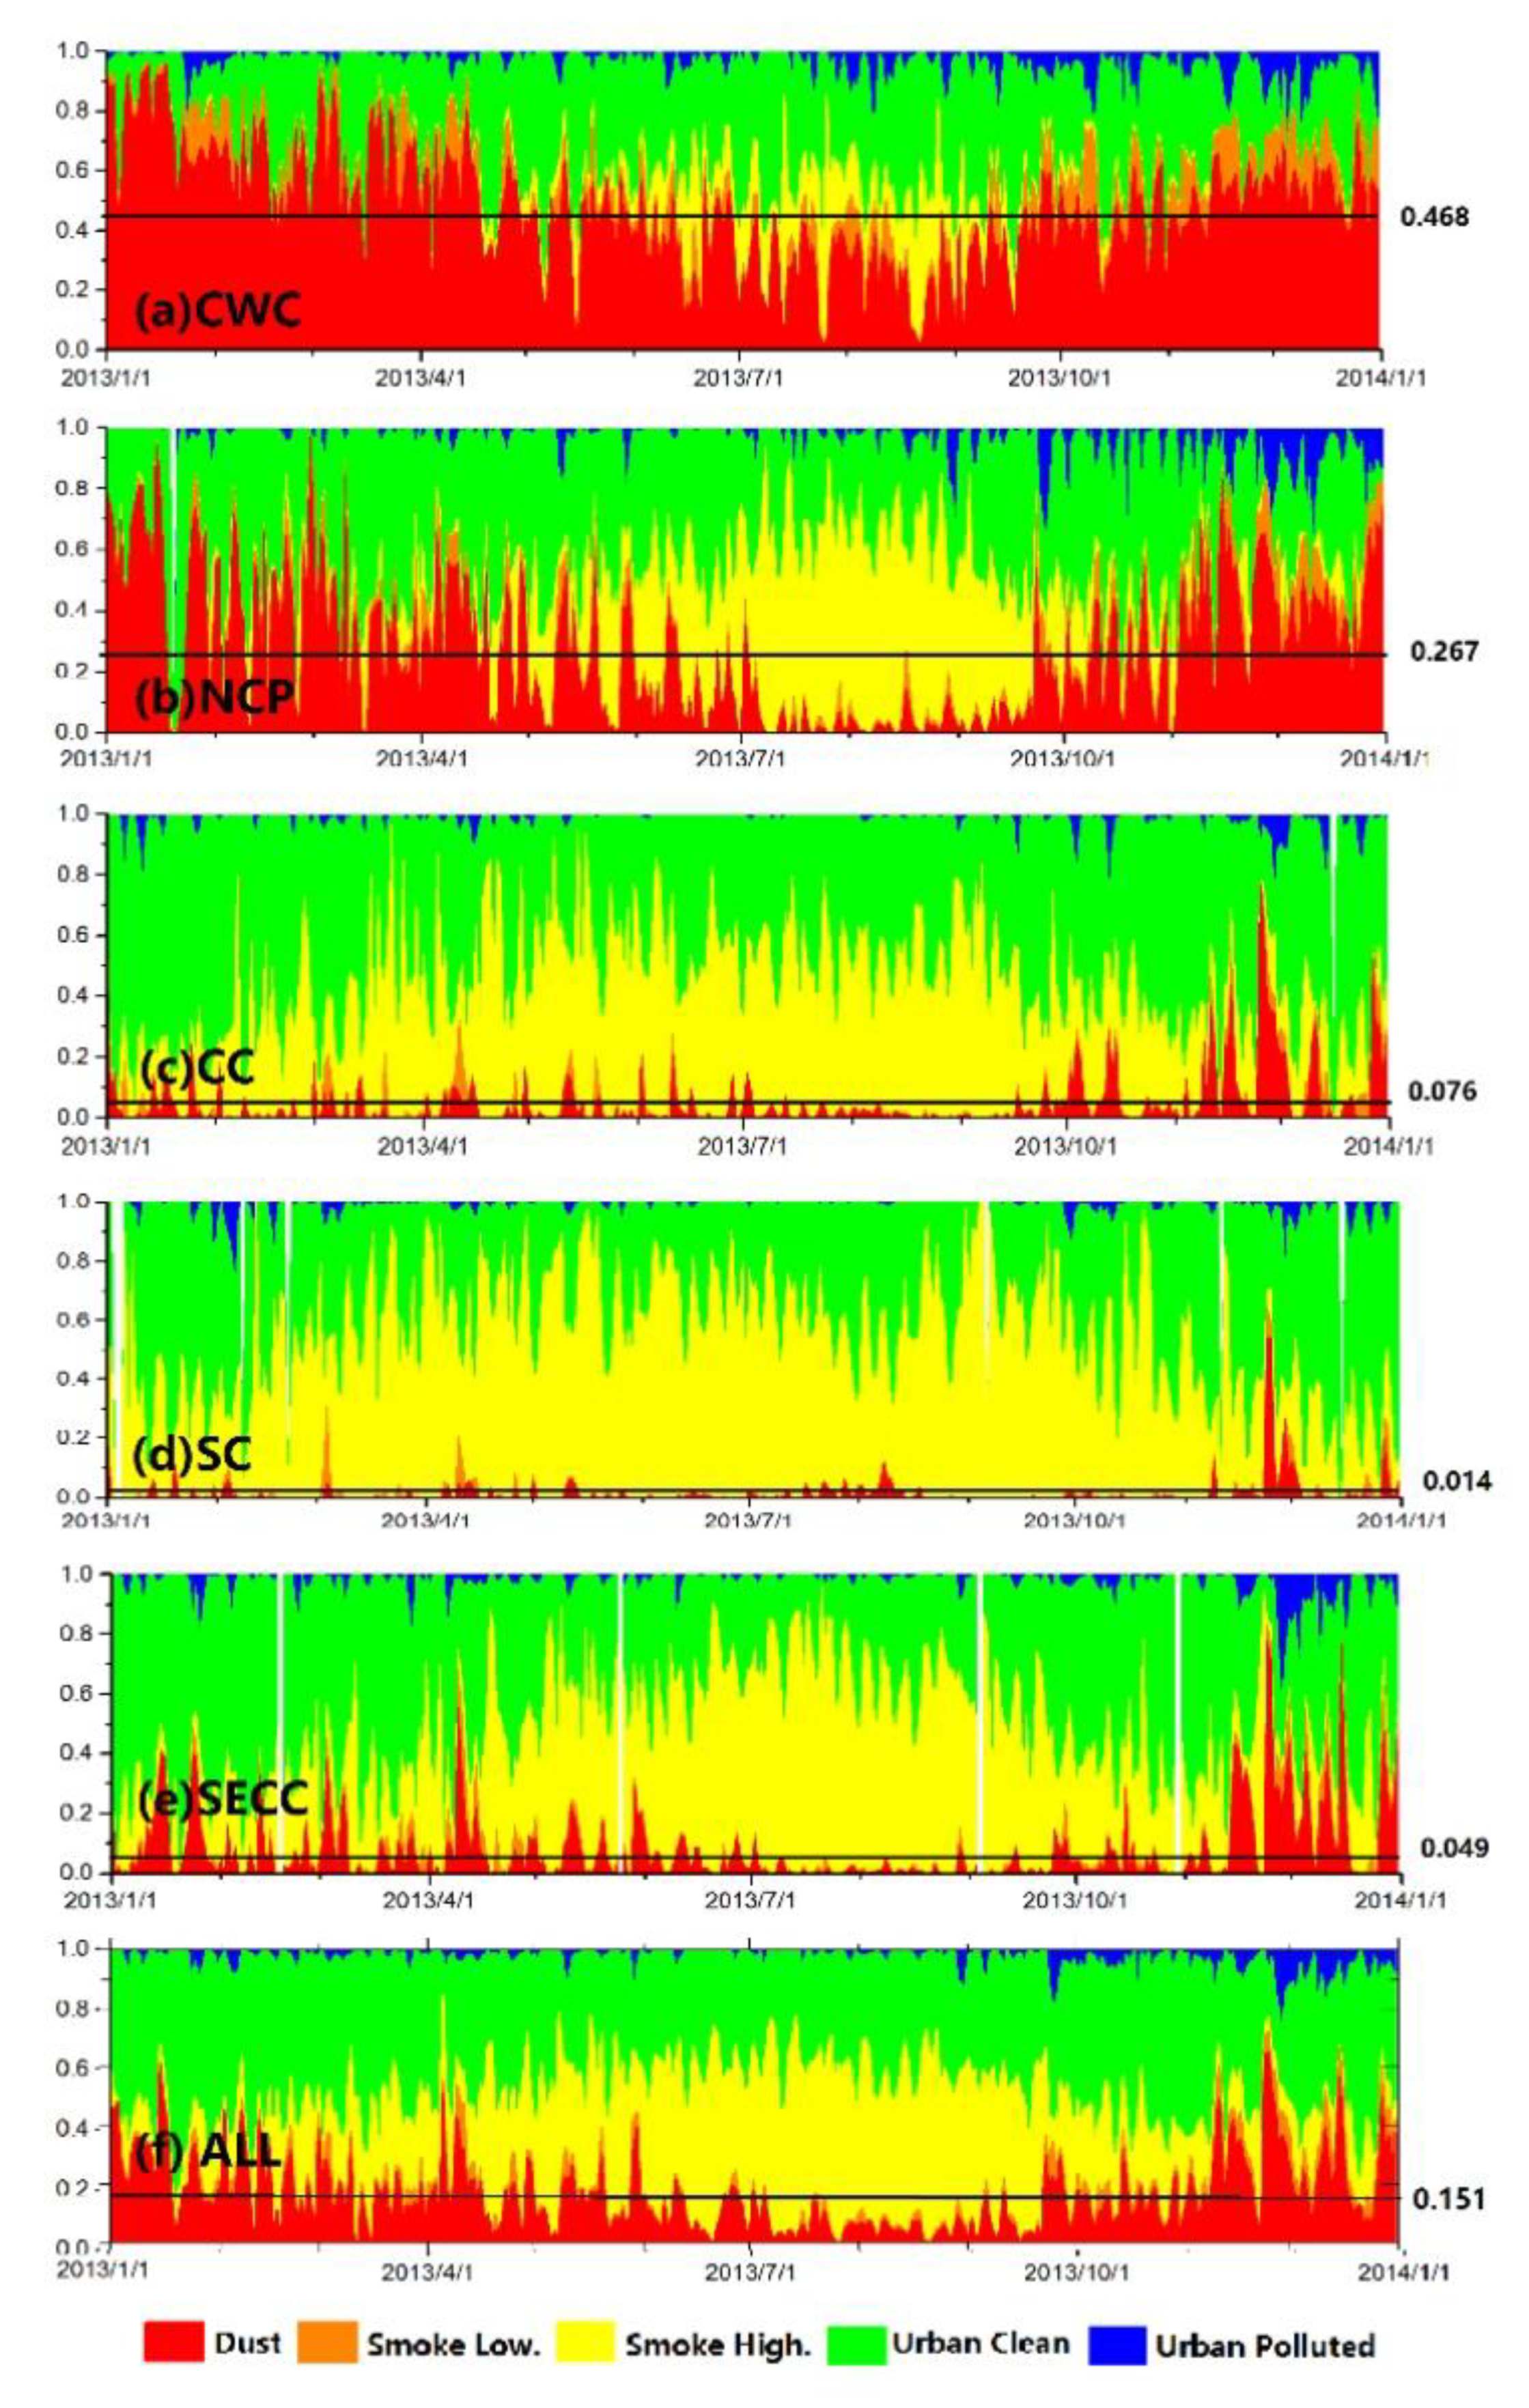
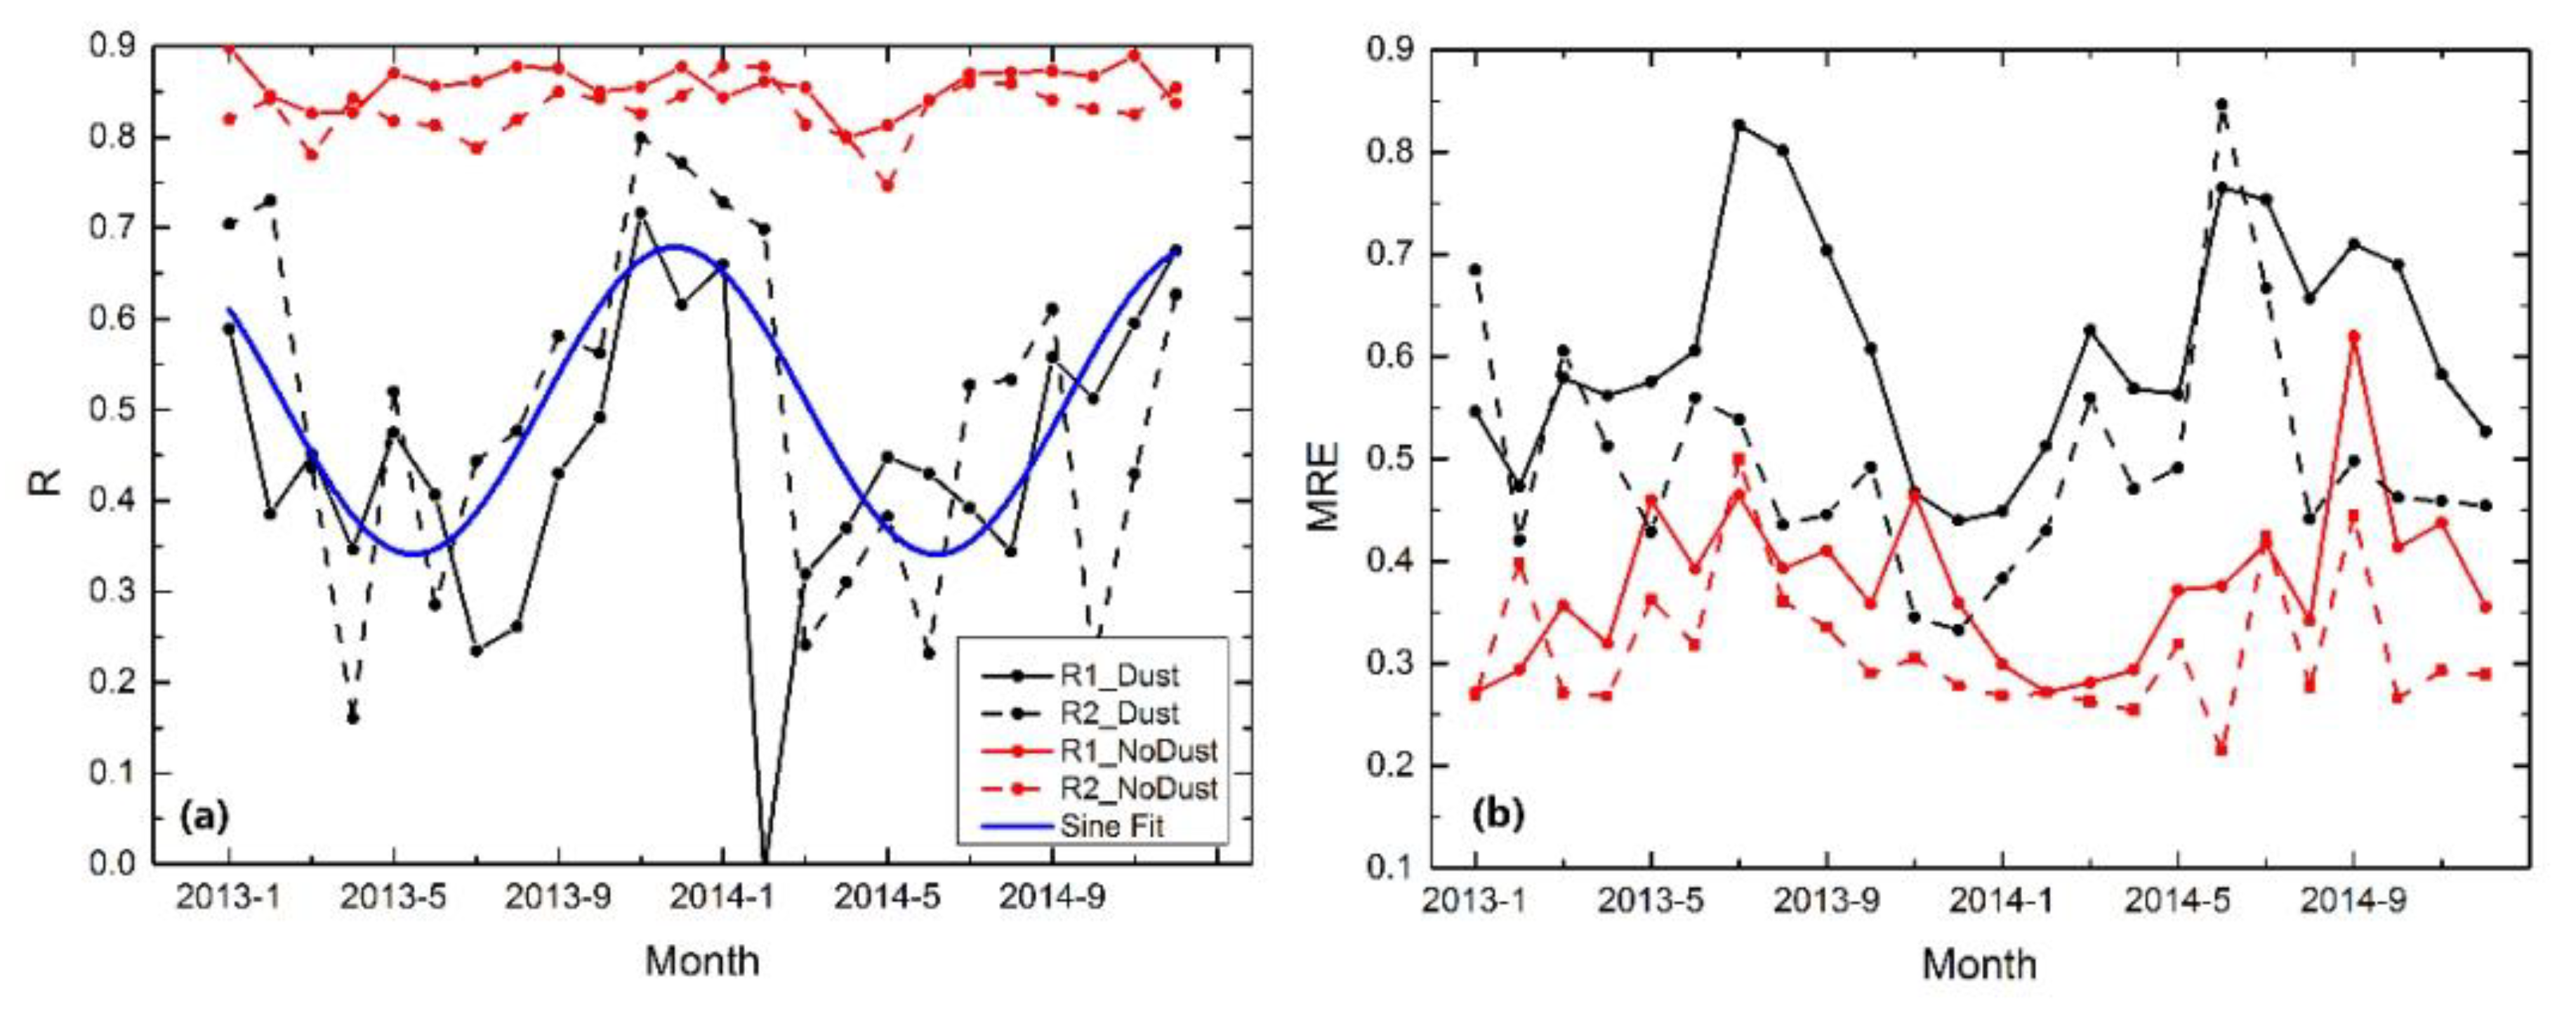
3.3. Time Series Analysis of Aerosol Models and AOD

In this study, the study area was separated into five subregions. Aerosol model information was collected from every valid AOD value, and a time series of VIIRS retrieved aerosol model proportions is shown in Figure 4. The different colors represent five aerosol models and the black dashed lines represent the mean proportion of the dust model. In all areas, the proportion of the dust model showed a pattern of high values in winter and low values in summer, and a decreasing trend from north to south.
At the CWC (Figure 4a), the proportion of the dust model was highest among all the subregions, and the average proportion of the dust model was 46.8%. On some days in January, the proportion exceeded 90% and, for a few days in summer, was below 20%. At the NCP (Figure 4b), the proportion of the dust model oscillated drastically and changed from more than 80% in winter to less than 10% in summer. Minimal values were observed from July to October, and the reduced portion of the dust model in this period was replaced with the Smoke High Absorption aerosol model. At the CC (Figure 4c), the proportion of the dust aerosol model (black line) decreased quickly to 7.6% on average, comparing to that at the CWC and the NCP (Figure 4a,b). On a few days in winter, the proportion exceeded 40%. The variation in time series of the aerosol model at the SECC was similar to that at the CC (Figure 4e). However, at the SC (Figure 4d), the dust model average proportion was only 1.4%, and in almost half of the year it was approximately 0%. The proportion exceeded 5% only on a few days, and on November 27, the proportion increased to ~50% when there was little dust. The dust proportion averaged over all subregions is 15.1% (Figure 4f).
Since UVAI is largely sensitive only to the UV-absorbing aerosols, such as dust and smoke [38], we used it as a qualitative indicator of dust. Figure 5 shows the frequency of UVAI > 1 in 2013 across China using an OMPS 1-degree resolution L3 UVAI product. As shown in Figure 5, three areas with high UVAI frequency are located in western, mid-eastern, and northeastern China, respectively. The high frequency area in western China is largest and is influenced by two dust sources, the Taklimakan Desert and the Gobi Desert. However, due to the surface feature of the Gobi Desert, the impact of dust outbreak from the Gobi Desert is not as serious as that from the Taklimakan. The other two high frequency areas are located in northeastern China and the North China Plain (NCP), where farmers used to burn crop straws in the autumn harvest and the spring planting season. Here, we pay more attention to the high frequency area in the NCP near our Subregion 2.
Comparing to Subregion 1, Subregion 2 is farther from dust sources; therefore, the dust outbreak frequency in Subregion 2 should be lower than (or at least equal to) that in Subregion 1. So, the UVAI frequency, due to the dust in this region, should be lower than Figure 5 showed. This higher frequency must be caused by heavy smoke aerosol loading from the burning of crop straw and other biomass. For this reason, the high UVAI frequency should be only partially attributed to dust, and should not be involved in consideration. Therefore, if excluding the impact of smoke, the frequency of dust in Subregion 2 is almost 20 to 40 days in 2013, which is at a slightly higher level than other areas. In Subregion 5, the frequency of dust is even less than 10 days. Getting rid of this impact, the low frequency of UVAI >1 in most places is not consistent with the high dust model proportion as Figure 4b,c,e showed. Therefore, Figure 4 and Figure 5 indicate that the aerosol model selection process in the VIIRS AOD algorithm often determined the dust model improperly and overestimated the dust proportion.
Given that the MODIS AOD has been successfully producing aerosol date for more than 15 years and has been validated globally and regionally, we used the MODIS/Aqua DT AOD (QF = 3) as a reference to validate the AODVIIRS month by month. The MODIS DT algorithm combines fine-dominated and coarse-dominated aerosol models (each composed of multiple modes) to match with the observed spectral reflectance. Therefore, MODIS AOD would not be affected seriously by the dust aerosol model. AODVIIRS at a 6-km resolution was matched to the nearest 10-km resolution AODMODIS. These matchups were classified into the following two groups: one dominated by dust model (black lines in Figure 6), and the other without dust model (NoDust red lines in Figure 6). The mean relative error (MRE) and R between the VIIRS and MODIS data were calculated every month in two regions of interest. Region 1 includes Subregion 1 and 2, whereas Region 2 contains the southeastern terrain of China (Subregion 3,4 and 5), where dust is unusual. The time series of R (Figure 6a) and MRE (Figure 6b) is shown in Figure 6. Note that the R value of the non-dust aerosol model (red line) shows a steady high value that nearly exceeds 0.8, whereas that of the dust is obviously lower and shows a periodic changing trend of high in winter and low in summer. In winter and spring, dust floats frequently in air during dust outbreak. Therefore, the VIIRS dust aerosol model selection could reflect the true state of atmosphere and thus narrow the gap between AODVIIRS and AODMODIS. However, the similar trends in both Region 1 and Region 2 hints that there are frequently mismatches in the dust aerosol model selections in all regions. The small difference between Region 1 and Region 2 suggests that the dust model selection can affect the AOD retrieval accuracy more seriously than surface cover. In addition, the MRE of the non-dust models was also lower than that of the dust models, as shown in Figure 6b. With a higher R and lower MRE, the AODVIIRS for no-dust showed the better agreement with the AODMODIS.

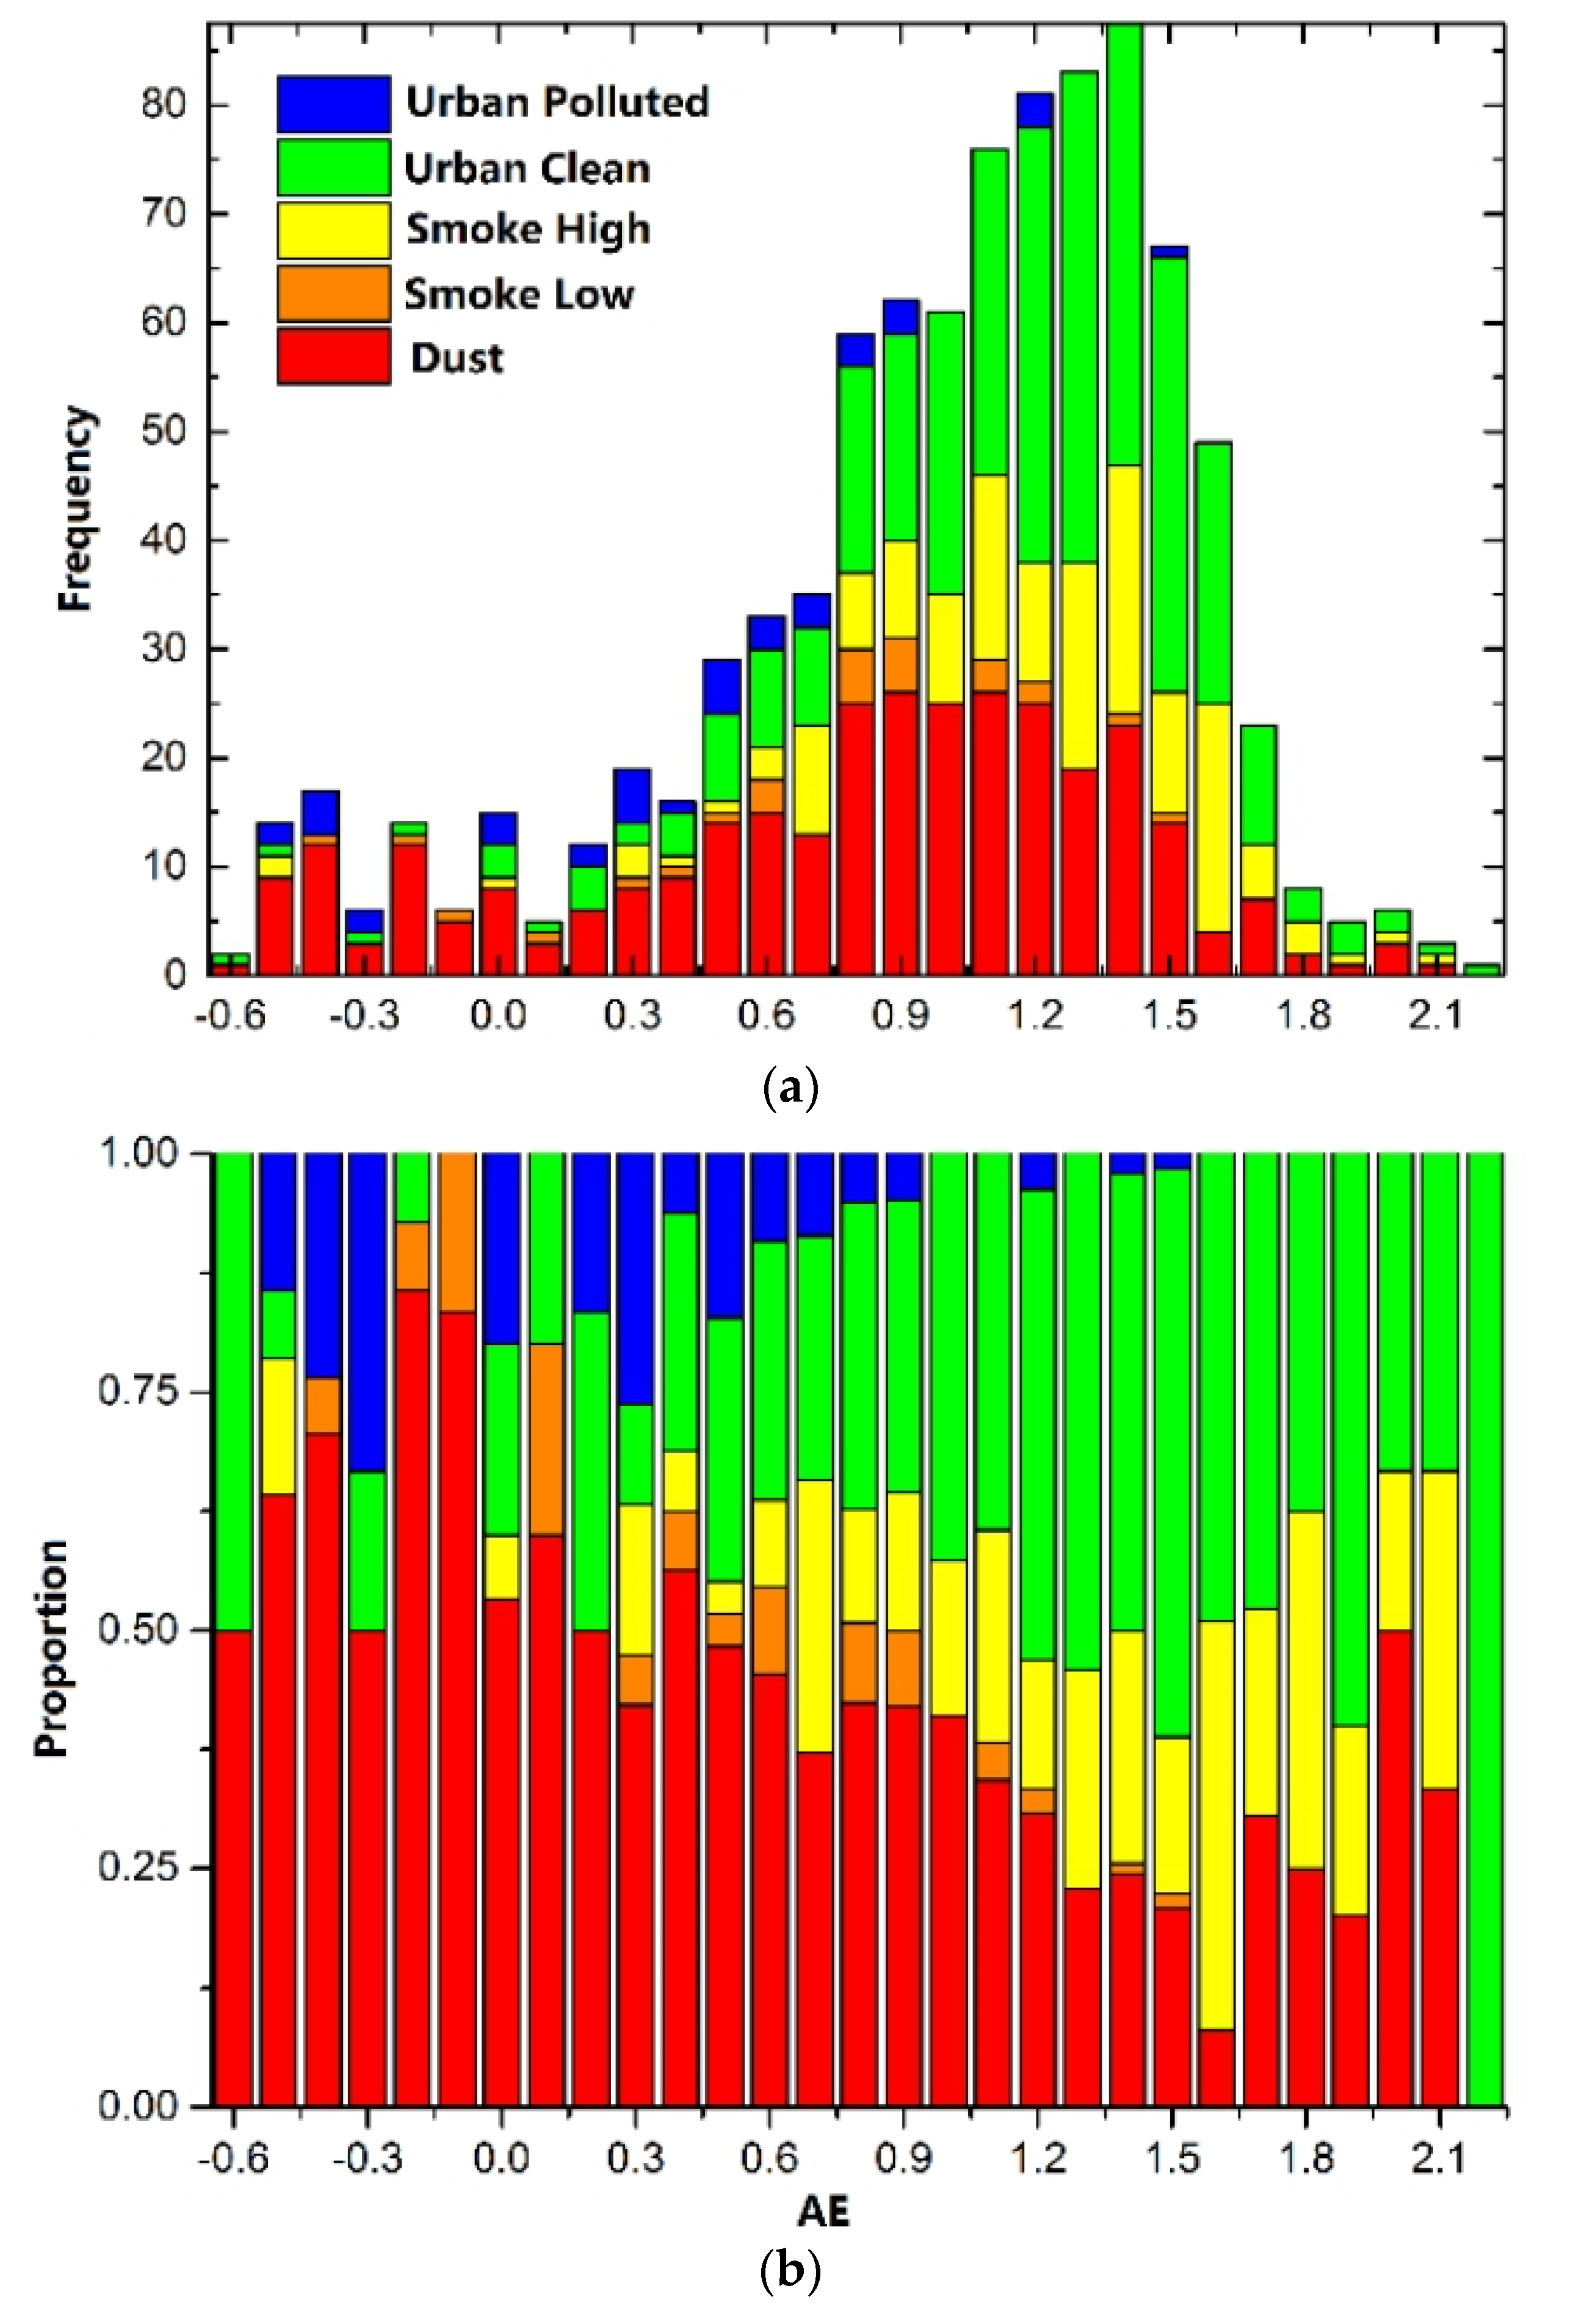
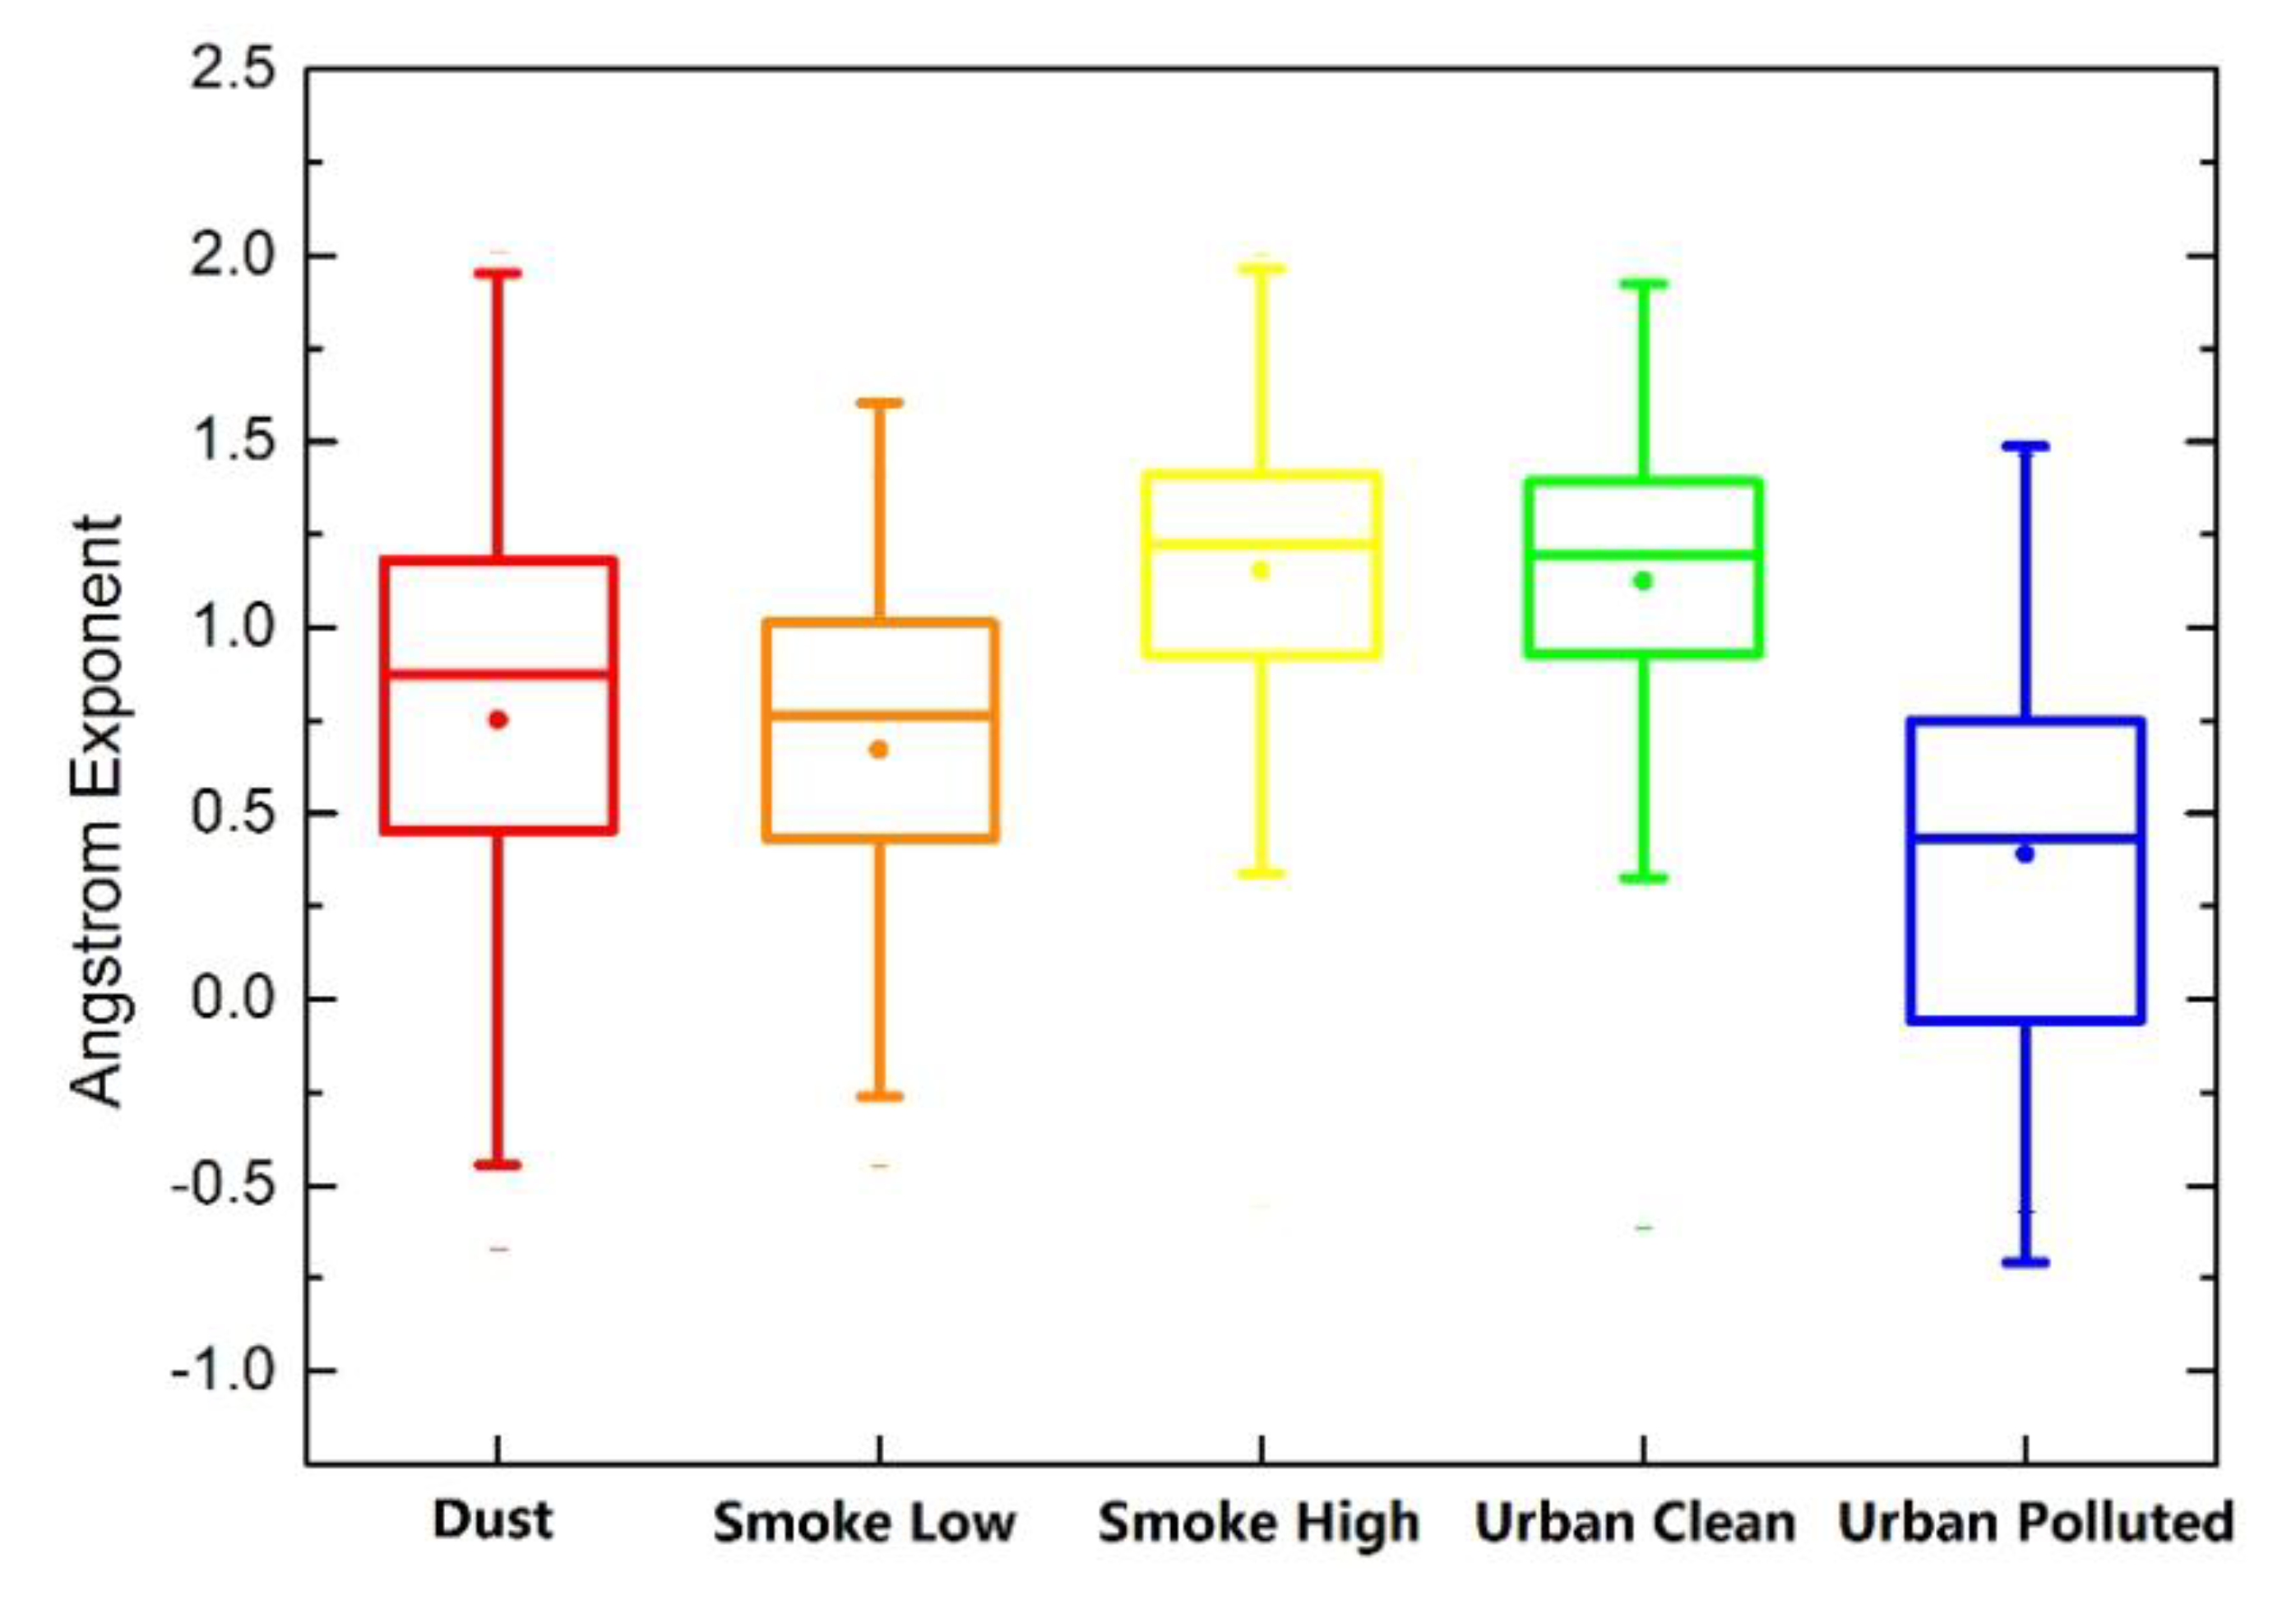
3.4. Analysis of the Ångström exponent for the Five Aerosol Models

The α is often used as a qualitative indicator of aerosol particle size [42]. Values greater than 2 indicate small particles, which are usually associated with smoke and biomass burning aerosols, and values less than 1 indicate coarse particles predominantly, such as sea salt, dust, and sand [33].
The data of α were obtained from CARE-China observations and the aerosol models using satellite retrievals from the VIIRS. The frequency and proportion statistics for the aerosol models at different α are presented in Figure 7. For all retrievals, the frequency peak is approximately at α = 1.4. However, for the dust model (red color), two peaks are observed, i.e., at α = −0.4 and α = 1.1, and the peak of α = 1.1 had higher frequency than the peak of α = −0.4. The dust model proportion accounted for at least 40% in the range α = −0.6–α = 1.0. A large part of the samples was identified as dust by the VIIRS Aerosol algorithm in a wide range of α. When α > 1.7, the frequency of the dust model decreased to the minimal value, but the proportion increased. However, since this frequency is less than 10, the results do not render further discussion in this study. The dust model’s α ranged from −1 to 1.0 according to background measurement, but the VIIRS “dust” model aerosol have high frequency data with α around 1.1. The result, which is inconsistent with the observation, indicates that the “dust” aerosol determined by the VIIRS algorithm is not the true dust and that the algorithm may exit mismatch in aerosol model selection.
Figure 8 shows a box plot of the α values for the different aerosol models, where the red color represents the dust aerosol model. The median value of α for dust was approximately 0.75, which was even higher than that of the Smoke Low Absorption and Urban Polluted fine particle dominated models. According to ground-based observations, the dust model’s α ranged from −1 to 1.0 [43,44], and a cluster analysis of the AERONET measurement conclude one dust aerosol type with α of 0.6 [45]. However, as shown in Figure 8, according to NOAA aerosol model classification, the α of dust aerosol did not show a relative lower value comparing to other models. The high proportion and the large range of high α values for the dust model are not consistent with the observations.

4. Discussion

The basic hypothesis of the DT algorithm is the linear relationship in surface reflectance over dense vegetation between visible and shortwave infrared bands [46]. Thus, retrieval accuracy decreases in semiarid, urban, and coastal areas because of the low amount of vegetation. The SPT site, which is located in a semiarid area, and the YTC site, which is located in a coastal city, have unfavorable surface characteristics for AOD retrievals. This might be the reason of the poor validation results at these two sites. Similarly, the CSC and BJC sites are located in the city; thus, the validation at the sites was not as good as that at the YCA site, which is located in an agricultural field. According to the validations contained in recent studies, the R value is 0.909 and the regression equation is y = 0.913x + 0.08 [47]. The results for the agricultural site YCA are similar, whereas at the urban site BJC, the validation showed a slight overestimation of AOD in VIISR products.
The aerosol model selection strategy influences the AOD retrieval accuracy because of the different scattering and absorbing properties for different aerosol models. Particularly, the back scattering of coarse dust particles is much lower than that of fine models in a visible channel. Therefore, mismatching aerosol models would introduce a positive or negative AOD retrieval bias, and this explains why the AODVIIRS is obviously inconsistent with the AODMODIS in the areas where the VIIRS aerosol algorithm picks in areas where the dust model is selected (Figure 1d,e). As demonstrated in Section 3.4, some pixels with high α were wrongly identified as under dust conditions. The mismatch may result in high dust model proportion in the south of China, where dust is not common. These errors will overestimate the satellite retrieval AOD, although, as shown in Figure 2c, most of the samples were below the 1:1 line. Most of these match-ups are observed at SPT, and the inaccurate surface reflectance relationship might be the principal source for the errors. Meanwhile, modeling the spheroid dust particles as spherical may lead to the positive errors because the phase functions of spherical particles are much larger than their spheroidal counterparts [48].
To evaluate the influence of aerosol model selection on the AOD retrieval, we used the 6SV radiative transfer model (RTM) [17] to simulate the top of the atmosphere (TOA) at the VIIRS M3 band as a function of the AOD (0.1–1.4) for four aerosol models. In 6SV, the user can define their own model using four basic components (dust-like, water-soluble, oceanic, and soot) according to the volume percentage. We conducted four simulation experiments (or four models): Simulation-1 as 30% dust-like and 70% water-soluble, Simulation-2 as 70% dust-like and 30% water-soluble, Simulation-3 as 80% dust-like and 20% water-soluble, and Simulation-4 as 90% dust-like and 10% water-soluble. According to the radiative transfer simulation in Figure 9, when the TOA reflectance was 0.158, the calculated AODs by 6SV were 0.4, 0.51, 0.62, and 1.1 using models 1 to 4. In this case, the largest difference was caused by mismatching the low dust model 1 with the high dust model 4, which produced an AOD overestimation of more than 0.7. As shown by the curves in Figure 9, the retrieval error increased as the AOD increased, thus indicating that the selection of an incorrect dust model can lead to overestimated AOD values.
As for the method of determining the aerosol model, the MODIS algorithm used four aerosol models over land and mixed a coarse model with a fine model according to the location and time. This algorithm selects the aerosol model by statistical and empirical results; therefore, it cannot identify aerosol model variability on individual days. The VIIRS algorithm used a dynamic aerosol model that selects an aerosol model by a minimal residual of the calculated surface reflectance and expected surface reflectance. The basic principle of this selection strategy is spectral fitting. However, whether the information from passive satellite observations is sufficient for aerosol model determination must be further discussed. An empirical model selection process, such as that of MODIS, would neglect the variability of aerosol particles [9]. In addition, the use of an aerosol component from the Chemical Transport Model (CTM) requires a large amount of auxiliary data, although this information is not sufficiently accurate [49]. Therefore, the dynamic aerosol model of the VIIRS is a relatively suitable method compared with current alternative algorithms and more prior information and constrain strategy need to be used. Several information or methods, such as the spectral angle information, the mixture of multi-model, and the prior aerosol model constraints, may help optimize the aerosol model selection and therefore improve the AOD retrieval accuracy.

5. Conclusions

In this study, the AODVIIRS was evaluated via comparisons with CARE-China network measurements and MODIS observations across China from 1 Jan 2013 to 31 Dec 2013. The validation showed that the AODVIIRS values agree well with CARE-China measurements, with a high R2 of ~0.698, a standard deviation of ~0.241, and a mean bias of ~ −0.037. However, at an individual site SPT, where the land cover is not suitable for the DT retrieval algorithm, the AODVIIRS is poorly estimated with a low R2 of ~0.286 and a high ME of ~ −0.193 against the ground-based observations. Furthermore, the data samples were grouped by dominant aerosol model to analyze the accuracy of difference aerosol types. The AODVIIRS for dust aerosols showed the lowest correlations with the ground-based observations. A cross comparison between the AODVIIRS and AODMODIS also provided evidence that the AODVIIRS identified as the dust aerosol model performed worse than other non-dust models. Furthermore, comparing with the Angstrom Exponent from the ground-based observations, the high α of the dust aerosol model further confirms that the aerosol model selection in VIRS data was biased.
These results indicate that: 1) the accuracy of NOAA VIIRS AOD in western China is worse than others due to aerosol model and surface reflectance; 2) the accuracy of the NOAA VIIRS AOD of the dust model determined by algorithm is worse than the other models; 3) the mismatch of dust aerosol models occurs in most places, and results in the AOD retrieval bias. All these points suggest that an inappropriate use of the dust model significantly impacts the quality of NOAA VIIRS AOD product over land, and users must be careful in using this product in model assimilation and air quality study. To help the users to accurately use this product, it should be helpful to add the dust aerosol model information in the Quality Flag. As for the algorithm improvement, some endeavors, such as developing the spheroid dust aerosol model and constraining the aerosol model selection, should be taken into consideration.

Author Contributions

Conceptualization, Y.W. and L.C.; validation, Y.W. and X.W.; resources, J.X. and X.W.; writing—original draft preparation, Y.W.; writing—review and editing, L.C.; supervision, L.C.; All authors have read and agreed to the published version of the manuscript.

Funding

This research was supported by the National Key Basic Research Program (grant number: 2016YFC0200404) and the Fujian Province Young and Middle-aged Teachers Educational Research Project (grant number: JAT190082).

Acknowledgments

We really appreciate the modification and useful amending advice for this manuscript from Jinxian Liu from the Fujian Normal University.

Conflicts of Interest

The authors declare no conflict of interest.

References

  1. IPCC. Fifth Assessment Report: Climate Change 2013; Cambridge University Press: New York, NY, USA, 2013. [Google Scholar]
  2. Ramanathan, V.; Crutzen, P.J.; Kiehl, J.T.; Rosenfeld, D. Atmosphere—Aerosols, climate, and the hydrological cycle. Science 2001, 294, 2119–2124. [Google Scholar] [CrossRef] [PubMed] [Green Version]
  3. Rosenfeld, D. Atmosphere. Aerosols, clouds, and climate. Science 2006, 312, 1323–1324. [Google Scholar] [CrossRef]
  4. Lim, S.S.; Vos, T.; Flaxman, A.D.; Danaei, G.; Shibuya, K.; Adair-Rohani, H.; Amann, M.; Anderson, H.R.; Andrews, K.G.; Aryee, M.; et al. A comparative risk assessment of burden of disease and injury attributable to 67 risk factors and risk factor clusters in 21 regions, 1990–2010: A systematic analysis for the Global Burden of Disease Study 2010. Lancet 2012, 380, 2224–2260. [Google Scholar] [CrossRef] [Green Version]
  5. Tie, X.X.; Wu, D.; Brasseur, G. Lung cancer mortality and exposure to atmospheric aerosol particles in Guangzhou, China. Atmos. Environ. 2009, 43, 2375–2377. [Google Scholar] [CrossRef]
  6. Levy, R.C.; Munchak, L.A.; Mattoo, S.; Patadia, F.; Remer, L.A.; Holz, R.E. Towards a long-term global aerosol optical depth record: Applying a consistent aerosol retrieval algorithm to MODIS and VIIRS-observed reflectance. Atmos. Meas. Tech. 2015, 8, 4083–4110. [Google Scholar] [CrossRef] [Green Version]
  7. Popp, T.; de Leeuw, G.; Bingen, C.; Bruhl, C.; Capelle, V.; Chedin, A.; Clarisse, L.; Dubovik, O.; Grainger, R.; Griesfeller, J.; et al. Development, Production and Evaluation of Aerosol Climate Data Records from European Satellite Observations (Aerosol_cci). Remote Sens. 2016, 8, 421. [Google Scholar] [CrossRef] [Green Version]
  8. Mishchenko, M.I.; Geogdzhayev, I.V.; Cairns, B.; Carlson, B.E.; Chowdhary, J.; Lacis, A.A.; Liu, L.; Rossow, W.B.; Travis, L.D. Past, present, and future of global aerosol climatologies derived from satellite observations: A perspective. J. Quant. Spectrosc. Radiat. Transf. 2007, 106, 325–347. [Google Scholar] [CrossRef]
  9. Levy, R.C.; Mattoo, S.; Munchak, L.A.; Remer, L.A.; Sayer, A.M.; Patadia, F.; Hsu, N.C. The Collection 6 MODIS aerosol products over land and ocean. Atmos. Meas. Tech. 2013, 6, 2989–3034. [Google Scholar] [CrossRef] [Green Version]
  10. Jackson, J.M.; Liu, H.; Laszlo, I.; Kondragunta, S.; Remer, L.A.; Huang, J.; Huang, H.-C. Suomi-NPP VIIRS aerosol algorithms and data products. J. Geophys. Res.-Atmos. 2013, 118, 12673–12689. [Google Scholar] [CrossRef]
  11. Huang, J.F.; Kondragunta, S.; Laszlo, I.; Liu, H.Q.; Remer, L.A.; Zhang, H.; Superczynski, S.; Ciren, P.; Holben, B.N.; Petrenko, M. Validation and expected error estimation of Suomi-NPP VIIRS aerosol optical thickness and Angstrom exponent with AERONET. J. Geophys. Res.-Atmos. 2016, 121, 7139–7160. [Google Scholar] [CrossRef] [Green Version]
  12. Liu, H.; Remer, L.A.; Huang, J.; Huang, H.-C.; Kondragunta, S.; Laszlo, I.; Oo, M.; Jackson, J.M. Preliminary evaluation of S-NPP VIIRS aerosol optical thickness. J. Geophys. Res.-Atmos. 2014, 119, 3942–3962. [Google Scholar] [CrossRef]
  13. Wang, Y.; Chen, L.; Li, S.; Wang, X.; Yu, C.; Si, Y.; Zhang, Z. Interference of Heavy Aerosol Loading on the VIIRS Aerosol Optical Depth (AOD) Retrieval Algorithm. Remote Sens. 2017, 9, 397. [Google Scholar] [CrossRef] [Green Version]
  14. de Leeuw, G.; Holzer-Popp, T.; Bevan, S.; Davies, W.H.; Descloitres, J.; Grainger, R.G.; Griesfeller, J.; Heckel, A.; Kinne, S.; Kluser, L.; et al. Evaluation of seven European aerosol optical depth retrieval algorithms for climate analysis. Remote Sens. Environ. 2015, 162, 295–315. [Google Scholar] [CrossRef] [Green Version]
  15. Kolmonen, P.; Sogacheva, L.; Virtanen, T.H.; de Leeuw, G.; Kulmala, M. The ADV/ASV AATSR aerosol retrieval algorithm: Current status and presentation of a full-mission AOD dataset. Int. J. Digit. Earth 2016, 9, 545–561. [Google Scholar] [CrossRef]
  16. Diner, D.J.; Martonchik, J.V.; Kahn, R.A.; Pinty, B.; Gobron, N.; Nelson, D.L.; Holben, B.N. Using angular and spectral shape similarity constraints to improve MISR aerosol and surface retrievals over land. Remote Sens. Environ. 2005, 94, 155–171. [Google Scholar] [CrossRef]
  17. Kotchenova, S.Y.; Vermote, E.F.; Matarrese, R.; Klemm, F.J., Jr. Validation of a vector version of the 6S radiative transfer code for atmospheric correction of satellite data. Part I: Path radiance. Appl. Opt. 2006, 45, 6762–6774. [Google Scholar] [CrossRef] [Green Version]
  18. Vermote, E.F.; El Saleous, N.Z.; Justice, C.O. Atmospheric correction of MODIS data in the visible to middle infrared: First results. Remote Sens. Environ. 2002, 83, 97–111. [Google Scholar] [CrossRef]
  19. Holben, B.N.; Eck, T.F.; Slutsker, I.; Tanre, D.; Buis, J.P.; Setzer, A.; Vermote, E.; Reagan, J.A.; Kaufman, Y.J.; Nakajima, T.; et al. AERONET—A federated instrument network and data archive for aerosol characterization. Remote Sens. Environ. 1998, 66, 1–16. [Google Scholar] [CrossRef]
  20. Levy, R.C.; Remer, L.A.; Dubovik, O. Global aerosol optical properties and application to Moderate Resolution Imaging Spectroradiometer aerosol retrieval over land. J. Geophys. Res.-Atmos. 2007, 112. [Google Scholar] [CrossRef] [Green Version]
  21. Remer, L.A.; Kaufman, Y.J. Dynamic aerosol model: Urban/industrial aerosol. J. Geophys. Res.-Atmos. 1998, 103, 13859–13871. [Google Scholar] [CrossRef] [Green Version]
  22. Zhang, X.Y.; Wang, Y.Q.; Niu, T.; Zhang, X.C.; Gong, S.L.; Zhang, Y.M.; Sun, J.Y. Atmospheric aerosol compositions in China: Spatial/temporal variability, chemical signature, regional haze distribution and comparisons with global aerosols. Atmos. Chem. Phys. 2012, 12, 779–799. [Google Scholar] [CrossRef] [Green Version]
  23. Sun, Y.L.; Zhuang, G.S.; Ying, W.; Han, L.H.; Guo, J.H.; Mo, D.; Zhang, W.J.; Wang, Z.F.; Hao, Z.P. The air-borne particulate pollution in Beijing—Concentration, composition, distribution and sources. Atmos. Environ. 2004, 38, 5991–6004. [Google Scholar] [CrossRef]
  24. Xin, J.Y.; Wang, Y.S.; Pan, Y.P.; Ji, D.S.; Liu, Z.R.; Wen, T.X.; Wang, Y.H.; Li, X.R.; Sun, Y.; Sun, J.; et al. THE CAMPAIGN ON ATMOSPHERIC AEROSOL RESEARCH NETWORK OF CHINA CARE-CHINA. Bull. Amer. Meteorol. Soc. 2015, 96, 1137–1155. [Google Scholar] [CrossRef]
  25. Fang, M.; Chan, C.K.; Yao, X.H. Managing air quality in a rapidly developing nation: China. Atmos. Environ. 2009, 43, 79–86. [Google Scholar] [CrossRef]
  26. Cao, J.J.; Shen, Z.X.; Chow, J.C.; Watson, J.G.; Lee, S.C.; Tie, X.X.; Ho, K.F.; Wang, G.H.; Han, Y.M. Winter and Summer PM2.5 Chemical Compositions in Fourteen Chinese Cities. J. Air Waste Manag. Assoc. 2012, 62, 1214–1226. [Google Scholar] [CrossRef]
  27. Yang, F.; Tan, J.; Zhao, Q.; Du, Z.; He, K.; Ma, Y.; Duan, F.; Chen, G. Characteristics of PM2.5 speciation in representative megacities and across China. Atmos. Chem. Phys. 2011, 11, 5207–5219. [Google Scholar] [CrossRef] [Green Version]
  28. Wang, W.; Pan, Z.X.; Mao, F.Y.; Gong, W.; Shen, L.J. Evaluation of VIIRS Land Aerosol Model Selection with AERONET Measurements. Int. J. Environ. Res. Public Health 2017, 14, 1016. [Google Scholar] [CrossRef] [Green Version]
  29. Che, H.Z.; Zhao, H.J.; Wu, Y.F.; Xia, X.G.; Zhu, J.; Dubovik, O.; Estelles, V.; Ma, Y.J.; Wang, Y.F.; Wang, H.; et al. Application of aerosol optical properties to estimate aerosol type from ground-based remote sensing observation at urban area of northeastern China. J. Atmos. Solar-Terr. Phys. 2015, 132, 37–47. [Google Scholar] [CrossRef]
  30. Xu, X.; Wang, J.; Henze, D.K.; Qu, W.; Kopacz, M. Constraints on aerosol sources using GEOS-Chem adjoint and MODIS radiances, and evaluation with multisensor (OMI, MISR) data. J. Geophys. Res.-Atmos. 2013, 118, 6396–6413. [Google Scholar] [CrossRef] [Green Version]
  31. Wang, J.; Xia, X.G.; Wang, P.C.; Christopher, S.A. Diurnal variability of dust aerosol optical thickness and Angstrom exponent over dust source regions in China. Geophys. Res. Lett. 2004, 31. [Google Scholar] [CrossRef]
  32. Xin, J.Y.; Wang, Y.S.; Li, Z.Q.; Wang, P.C.; Hao, W.M.; Nordgren, B.L.; Wang, S.G.; Liu, G.R.; Wang, L.L.; Wen, T.X.; et al. Aerosol optical depth (AOD) and Angstrom exponent of aerosols observed by the Chinese Sun Hazemeter Network from August 2004 to September 2005. J. Geophys. Res.-Atmos. 2007, 112. [Google Scholar] [CrossRef]
  33. Eck, T.F.; Holben, B.N.; Reid, J.S.; Dubovik, O.; Smirnov, A.; O’Neill, N.T.; Slutsker, I.; Kinne, S. Wavelength dependence of the optical depth of biomass burning, urban, and desert dust aerosols. J. Geophys. Res.-Atmos. 1999, 104, 31333–31349. [Google Scholar] [CrossRef]
  34. Wang, L.L.; Xin, J.Y.; Li, X.R.; Wang, Y.S. The variability of biomass burning and its influence on regional aerosol properties during the wheat harvest season in North China. Atmos. Res. 2015, 157, 153–163. [Google Scholar] [CrossRef]
  35. Hsu, N.C.; Jeong, M.J.; Bettenhausen, C.; Sayer, A.M.; Hansell, R.; Seftor, C.S.; Huang, J.; Tsay, S.C. Enhanced Deep Blue aerosol retrieval algorithm: The second generation. J. Geophys. Res.-Atmos. 2013, 118, 9296–9315. [Google Scholar] [CrossRef]
  36. Petrenko, M.; Ichoku, C.; Leptoukh, G. Multi-sensor Aerosol Products Sampling System (MAPSS). Atmos. Meas. Tech. 2012, 5, 913–926. [Google Scholar] [CrossRef] [Green Version]
  37. Torres, O.; Ahn, C.; Chen, Z. Improvements to the OMI near-UV aerosol algorithm using A-train CALIOP and AIRS observations. Atmos. Meas. Tech. 2013, 6, 3257–3270. [Google Scholar] [CrossRef] [Green Version]
  38. Torres, O.; Tanskanen, A.; Veihelmann, B.; Ahn, C.; Braak, R.; Bhartia, P.K.; Veefkind, P.; Levelt, P. Aerosols and surface UV products from Ozone Monitoring Instrument observations: An overview. J. Geophys. Res.-Atmos. 2007, 112. [Google Scholar] [CrossRef] [Green Version]
  39. Seftor, C.J.; Jaross, G.; Kowitt, M.; Haken, M.; Li, J.; Flynn, L.E. Postlaunch performance of the Suomi National Polar-orbiting Partnership Ozone Mapping and Profiler Suite (OMPS) nadir sensors. J. Geophys. Res.-Atmos. 2014, 119, 4413–4428. [Google Scholar] [CrossRef] [Green Version]
  40. Xiao, Q.; Zhang, H.; Choi, M.; Li, S.; Kondragunta, S.; Kim, J.; Holben, B.; Levy, R.C.; Liu, Y. Evaluation of VIIRS, GOCI, and MODIS Collection 6 AOD retrievals against ground sunphotometer observations over East Asia. Atmos. Chem. Phys. 2016, 16, 1255–1269. [Google Scholar] [CrossRef] [Green Version]
  41. Zhu, J.; Xia, X.G.; Wang, J.; Che, H.Z.; Chen, H.B.; Zhang, J.Q.; Xu, X.G.; Levy, R.C.; Oo, M.; Holz, R.; et al. Evaluation of Aerosol Optical Depth and Aerosol Models from VIIRS Retrieval Algorithms over North China Plain. Remote Sens. 2017, 9, 432. [Google Scholar] [CrossRef] [Green Version]
  42. Angstrom, A. The parameters of atmospheric turbidity. Tellus 1964, 16, 64–75. [Google Scholar] [CrossRef] [Green Version]
  43. Tan, F.; Lim, H.S.; Abdullah, K.; Yoon, T.L.; Holben, B. Monsoonal variations in aerosol optical properties and estimation of aerosol optical depth using ground-based meteorological and air quality data in Peninsular Malaysia. Atmos. Chem. Phys. 2015, 15, 3755–3771. [Google Scholar] [CrossRef] [Green Version]
  44. Tanre, D.; Kaufman, Y.J.; Holben, B.N.; Chatenet, B.; Karnieli, A.; Lavenu, F.; Blarel, L.; Dubovik, O.; Remer, L.A.; Smirnov, A. Climatology of dust aerosol size distribution and optical properties derived from remotely sensed data in the solar spectrum. J. Geophys. Res.-Atmos. 2001, 106, 18205–18217. [Google Scholar] [CrossRef] [Green Version]
  45. Omar, A.H.; Won, J.G.; Winker, D.M.; Yoon, S.C.; Dubovik, O.; McCormick, M.P. Development of global aerosol models using cluster analysis of Aerosol Robotic Network (AERONET) measurements. J. Geophys. Res.-Atmos. 2005, 110. [Google Scholar] [CrossRef]
  46. Kaufman, Y.J.; Wald, A.E.; Remer, L.A.; Gao, B.C.; Li, R.R.; Flynn, L. The MODIS 2.1-mu m channel—Correlation with visible reflectance for use in remote sensing of aerosol. IEEE Trans. Geosci. Remote Sens. 1997, 35, 1286–1298. [Google Scholar] [CrossRef]
  47. Meng, F.; Xin, J.Y.; Cao, C.Y.; Shao, X.; Shan, B.Y.; Xiao, Q.F. Seasonal variations in aerosol optical thickness over eastern China determined from VIIRS data and ground measurements. Int. J. Remote Sens. 2016, 37, 1868–1880. [Google Scholar] [CrossRef]
  48. Yang, P.; Feng, Q.; Hong, G.; Kattawar, G.W.; Wiscombe, W.J.; Mishchenko, M.I.; Dubovik, O.; Laszlo, I.; Sokolik, I.N. Modeling of the scattering and radiative properties of nonspherical dust-like aerosols. J. Aerosol. Sci. 2007, 38, 995–1014. [Google Scholar] [CrossRef]
  49. Wang, J.; Xu, X.G.; Spurr, R.; Wang, Y.X.; Drury, E. Improved algorithm for MODIS satellite retrievals of aerosol optical thickness over land in dusty atmosphere: Implications for air quality monitoring in China. Remote Sens. Environ. 2010, 114, 2575–2583. [Google Scholar] [CrossRef] [Green Version]
Figure 1. One example of aerosol model mismatching in Visible Infrared Imaging Radiometer Suite (VIIRS) aerosol optical depth (AOD) algorithm. (a) VIIRS true color image, (b) Ozone Mapping and Profiler Suite Ultraviolet Aerosol Index (OMPS UVAI), (c) VIIRS aerosol model selection, (d) MODIS/Aqua C6 AOD, and (e) VIIRS environment data record aerosol optical depth (EDR AOD) on 1 Mar. 2016.
Remotesensing 12 00991 g001
Figure 2. (a) CARE-China site locations and five research subregions. VIIRS AOD validation for (b) all match-ups and (c, d, e, f, g, and h) at different CHINA-CARE sites. The red solid, black solid, and dashed lines are the linear regression of the scatter dots, 1:1 line, and the expected error (EE) envelope of ±(0.05 + 0.15AOD), respectively.
Remotesensing 12 00991 g002
Figure 3. Comparisons of the AODVIIRS and AODCARE for (a) all aerosol models, (b) non-dust aerosol models, and c, d, e, f, and g, sorted by other four type models (Smoke Low Absorption, Smoke Low Absorption, Urban Clean, and Urban Polluted).
Remotesensing 12 00991 g003
Figure 4. Daily variations of five aerosol model proportions in 2013 at the five subregions: (a) CWC, (b) NCP, (c) CC, (d) SC, (e) SECC; and (f) all subregions. The black solid lines represent the mean proportion of the dust model.
Remotesensing 12 00991 g004
Figure 5. Annual frequency (2013) of OMPS UVAI greater than 1 in China. The red rectangle frames line out the areas of Subregion 1 (CWC) and Subregion 2 (NCP).
Remotesensing 12 00991 g005
Figure 6. AOD comparison between the VIIRS and Moderate Resolution Imaging Spectroradiometer (MODIS) data for the dust (black lines) and non-dust (red lines) aerosol models in two regions of interest: R1 (solid line; Subregion 1, Subregion 2, and Subregion 3) and R2 (dashed line; Subregion 4 and Subregion 5). (a) Correlation coefficient (R) and mean relative error (MRE) (b) of the AODVIIRS and AODMODIS. The blue solid line represents the approximative trendline of R for the dust model.
Remotesensing 12 00991 g006
Figure 7. (a) Frequency and (b) proportion from the five aerosol models for each Ångström exponent bin.
Remotesensing 12 00991 g007
Figure 8. Box plot of α from the 5 types of aerosol models. The solid lines in each box indicate the 25th and 75th percentiles, the whiskers represent 2 standard deviation intervals, the middle line is the median value, and the middle point is the mean value of the α.
Remotesensing 12 00991 g008
Figure 9. Simulation of top of the atmosphere (TOA) reflectance at the VIIRS M3 band according to aerosol models with different dust proportions using the 6SV radiative transfer model. Model-1, 2, 3, and 4 contain 30%, 70%, 80%, and 90% dust, respectively. The surface reflectance is assumed to be 0.07, the satellite zenith angle, solar zenith angle, and relative azimuth are assumed to be 60°, 60°, and 120°, respectively, and the target altitude is 0.
Remotesensing 12 00991 g009
Table 1. Information on the five study subregions in China.
SubregionName(Lonmin-Lonmax; Latmin-Latmax)Major Aerosol Source
1Center and West of China (CWC)(100°E–110°E; 35°N–40°N)Dust, urban, coal comb
2North Chain Plain (NCP)(110°E–120°E; 35°N–40°N)Coal comb., urban, industry, dust
3Center of China (CC)(105°E–115°E; 30°N–35°N)Coal comb., industry, urban, dust
4South of China (SC)(105°E–115°E; 25°N–30°N)Urban, industry
5Southeastern Coastal of China (SECC)(115°E–120°E; 25°N–35°N)Urban, industry, sea salt
Table 2. Information on the selected Campaign on Atmospheric Aerosol Research Network of China (CARE-China) sites.
NStationLon (°E)Lat (°N)Altitude (m)Station Type
1Shapotou (SPT)104.9537.451350Desert background
2Beijing Forest (BJF)115.4339.971130North China background
3Beijing City (BJC)116.2839.9845Megacity
4Changsha City (CSC)113.0728.2045Central city
5Yucheng Agriculture (YCA)116.5736.8522North China country
6Yantai Coast (YTC)120.2736.0547East China sea coast
Table 3. Summary of the statistics from the comparison between the AODVIIRS and AODCARE in 6 sites.
SiteNR2SlopeInterceptMESTDRMSE
BJC1590.6780.7380.040−0.0520.2200.225
BJF1770.4581.0990.0010.0280.1190.122
CSC2110.5150.6850.2520.0200.3070.307
SPT1460.2860.520−0.005−0.1930.1560.248
YCA2080.8600.8930.001−0.0760.2350.246
YTC1210.3960.6850.1800.0470.2610.262
Total10230.6980.8400.032−0.0370.2410.226
Time period: 1 January 2013 to 31 December 2013; R2: Square of Correlation coefficient; ME: Mean error (bias), average difference between AODVIIRS and AODCARE; STD: Standard deviation of the biases; RMSE: Root Mean Square Error of the biases.

