Letter

Recognition of Banana Fusarium Wilt Based on UAV Remote Sensing

1
Key Laboratory of Digital Earth Science, Institute of Remote Sensing and Digital Earth, Chinese Academy of Sciences, Beijing 100094, China
2
Aerospace Information Research Institute, Chinese Academy of Sciences, Beijing 100094, China
3
Key Laboratory of Earth Observation of Hainan Province, Sanya 572029, China
4
Chinese Academy of Agricultural Engineering Planning & Design, Beijing 100125, China
5
University of Chinese Academy of Sciences, Beijing 100049, China
6
School of Electronics and Information Engineering, Anhui University, Hefei 230601, China
*
Author to whom correspondence should be addressed.
Remote Sens. 2020, 12(6), 938; https://doi.org/10.3390/rs12060938
Submission received: 22 January 2020 / Revised: 9 March 2020 / Accepted: 12 March 2020 / Published: 13 March 2020
(This article belongs to the Special Issue UAVs for Vegetation Monitoring)

Abstract

:
Fusarium wilt (Panama disease) of banana currently threatens banana production areas worldwide. Timely monitoring of Fusarium wilt disease is important for the disease treatment and adjustment of banana planting methods. The objective of this study was to establish a method for identifying the banana regions infested or not infested with Fusarium wilt disease using unmanned aerial vehicle (UAV)-based multispectral imagery. Two experiments were conducted in this study. In experiment 1, 120 sample plots were surveyed, of which 75% were used as modeling dataset for model fitting and the remaining were used as validation dataset 1 (VD1) for validation. In experiment 2, 35 sample plots were surveyed, which were used as validation dataset 2 (VD2) for model validation. An UAV equipped with a five band multispectral camera was used to capture the multispectral imagery. Eight vegetation indices (VIs) related to pigment absorption and plant growth changes were chosen for determining the biophysical and biochemical characteristics of the plants. The binary logistic regression (BLR) method was used to assess the spatial relationships between the VIs and the plants infested or not infested with Fusarium wilt. The results showed that the banana Fusarium wilt disease can be easily identified using the VIs including the green chlorophyll index (CIgreen), red-edge chlorophyll index (CIRE), normalized difference vegetation index (NDVI), and normalized difference red-edge index (NDRE). The fitting overall accuracies of the models were greater than 80%. Among the investigated VIs, the CIRE exhibited the best performance both for the VD1 (OA = 91.7%, Kappa = 0.83) and VD2 (OA = 80.0%, Kappa = 0.59). For the same type of VI, the VIs including a red-edge band obtained a better performance than that excluding a red-edge band. A simulation of imagery with different spatial resolutions (i.e., 0.5-m, 1-m, 2-m, 5-m, and 10-m resolutions) showed that good identification accuracy of Fusarium wilt was obtained when the resolution was higher than 2 m. As the resolution decreased, the identification accuracy of Fusarium wilt showed a decreasing trend. The findings indicate that UAV-based remote sensing with a red-edge band is suitable for identifying banana Fusarium wilt disease. The results of this study provide guidance for detecting the disease and crop planting adjustment.

Graphical Abstract

1. Introduction

Banana (Musa spp.) is a widely grown cash crop in the tropics and subtropics. Fusarium wilt (Panama disease) of banana, which is caused by the fungus Fusarium oxysporum f. sp. cubense race 4 (Foc 4), is a serious soilborne fungal disease [1]. This disease currently threatens the banana planting areas worldwide, including areas in Southeast Asia, Jordan, Australia, Lebanon, Pakistan, Mozambique, and Oman [2]. Fusarium wilt disease may have affected approximately 100,000 ha of banana plantations, and it is likely to spread further either through infected plant materials, contaminated soil, or farm machinery or due to flowing water and inappropriate sanitation measures [2]. Externally, the first signs of this disease are wilted banana plants with yellowing of the older leaves around the margins. As the disease advances, the plant leaves finally droop, forming a ‘skirt’ around the pseudo-stem before falling off. The new leaves may present pale margins and irregular and wrinkled blades [3]. Currently, there are no efficient chemical treatment for Fusarium wilt control. Once a diseased plant has been found, ‘timely removal’ is the best way to avoid the formation of a disease center [4]. Therefore, timely monitoring of banana Fusarium wilt disease is important for the disease treatment and crop planting adjustment.
Real-time monitoring and identification of crop disease are the basis of timely prevention and control [5]. Traditionally, ground surveys have been the only effective approach to monitor and discriminate crop disease, but these investigations are time-consuming and often very expensive. Remote sensing has become a feasible technology for disease detection and assessment over the last several decades. Diseases that have been detected using remote sensing include rust infection [6,7,8], Fusarium head blight [9,10], and powdery mildew [9,10,11,12] in wheat, bacterial leaf blight in rice [13,14], grey leaf spot in maize [15], and late blight disease and bacterial spot in tomato [16,17]. When plants are infected with diseases, the leaf water, pigment content and internal structure undergo changes, and these biochemical and biophysical changes are also reflected in the spectral characteristics of plants [18]. Many studies have successfully applied sensitive spectral bands or vegetation indices (VIs) to the identification and monitoring of crop diseases in the leaf and canopy scales. Bravo et al. [19] calculated the normalized difference vegetation index (NDVI) using wavelengths of 740–760 nm and 620–640 nm to extract powdery mildew wheat patches. Devadas et al. [20] showed that yellow rust wheat and healthy wheat could be distinguished by the anthocyanin reflection index (ARI). Huang et al. [7] suggested that the red-edge position can be used as an indicator for disease detection. However, spectral bands and VIs exhibit different sensitivity to different diseases and it is necessary to determine which spectral bands and VIs are suitable for the identification of specific diseases.
Satellite-based imagery is an affordable source of data for large-scale agricultural monitoring. There are a few previous studies that have shown successful detection of crop disease using high-resolution satellite multispectral images. For example, Oumar and Mutanga [21] demonstrated the applicability of Worldview-2 image for disease monitoring in a study on the prediction of bronze bug damage in plantation forests. Zhang et al. [22] established a multitemporal, modified soil-adjusted vegetation index for HJ-CCD images, and detected and mapped the outbreak of armyworm. Shi et al. [5] successfully used PlanetScope imagery to identify rice blast, rice dwarf, and glume blight. However, canopy structural characteristics and the biological effects induced by diseases often vary at fine spatial scales. Thus, in practice, the use of satellite-based imagery to monitoring diseases at field or subfield scales must address the constraint that different objects with similar spectral properties are affected by a mixed pixel effect from low-to-moderate resolution satellites (e.g., Landsat OLI-8, Sentinel-2) [5]. Furthermore, the use of high-resolution imageries acquired from satellite platforms is deficient for the long revisit period due to high cost and unfavorable weather conditions. In recent years, the development of unmanned aerial vehicles (UAVs) has provided new imagery acquisition platforms that can collect very high-resolution imagery and data in a short period of time in a cost-effective manner [23]. Therefore, UAVs provide a new technical means from which the in-season growth information of crops can be extracted in a timely and nondestructive manner [24]. Significant progress has been made in crop classification, growth monitoring, and pest and disease identification using UAV-based multispectral and hyperspectral imagery [23,25,26]. A few studies also applied UAV-based imagery to map spatial patterns of photosynthetic activity in banana plantations [27]. However, studies using UAV-based remote sensing technology to monitor Fusarium wilt of banana are scarce [28].
Moreover, due to the scale effects, the scaling topic has become one of the hotspots in remote sensing research [29]. Although higher spatial resolution images show more landscape details and more accurate estimates [30], due to expensive costs and processing difficulties, it is unnecessary and unrealistic to seek very high-resolution data for the agriculture application. Therefore, it is better to select an appropriate spatial resolution image for agricultural monitoring after considering various factors. In addition, choosing an appropriate method for data analysis is very important, as it directly affects the reliability and accuracy of the results. Many approaches or models have been used to determine bands and features that are sensitive to crop disease detection and discrimination [5,18,31]. Binary logistic regression (BLR) is one of the most commonly used multivariate analysis approaches to describe the relationship between a dependent variable and multiple independent variables, where the dependent variable is a binary variable that indicates whether an event exists [32]. Logistic regression has advantages over linear regression and log-linear linear regression because logistic regression does not need to assume normality [33].
The objectives of this study were to (i) develop an identification method for Fusarium wilt of banana using UAV-based multispectral imagery, (ii) determine the optimal VI for establishing an optimal identification model, and (iii) assess the effect of different image resolution on the identification accuracy of banana Fusarium wilt disease to provide a reference for large-scale applications of satellite-based data.

2. Materials and Methods
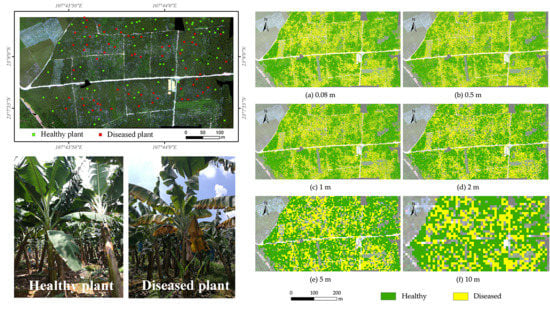
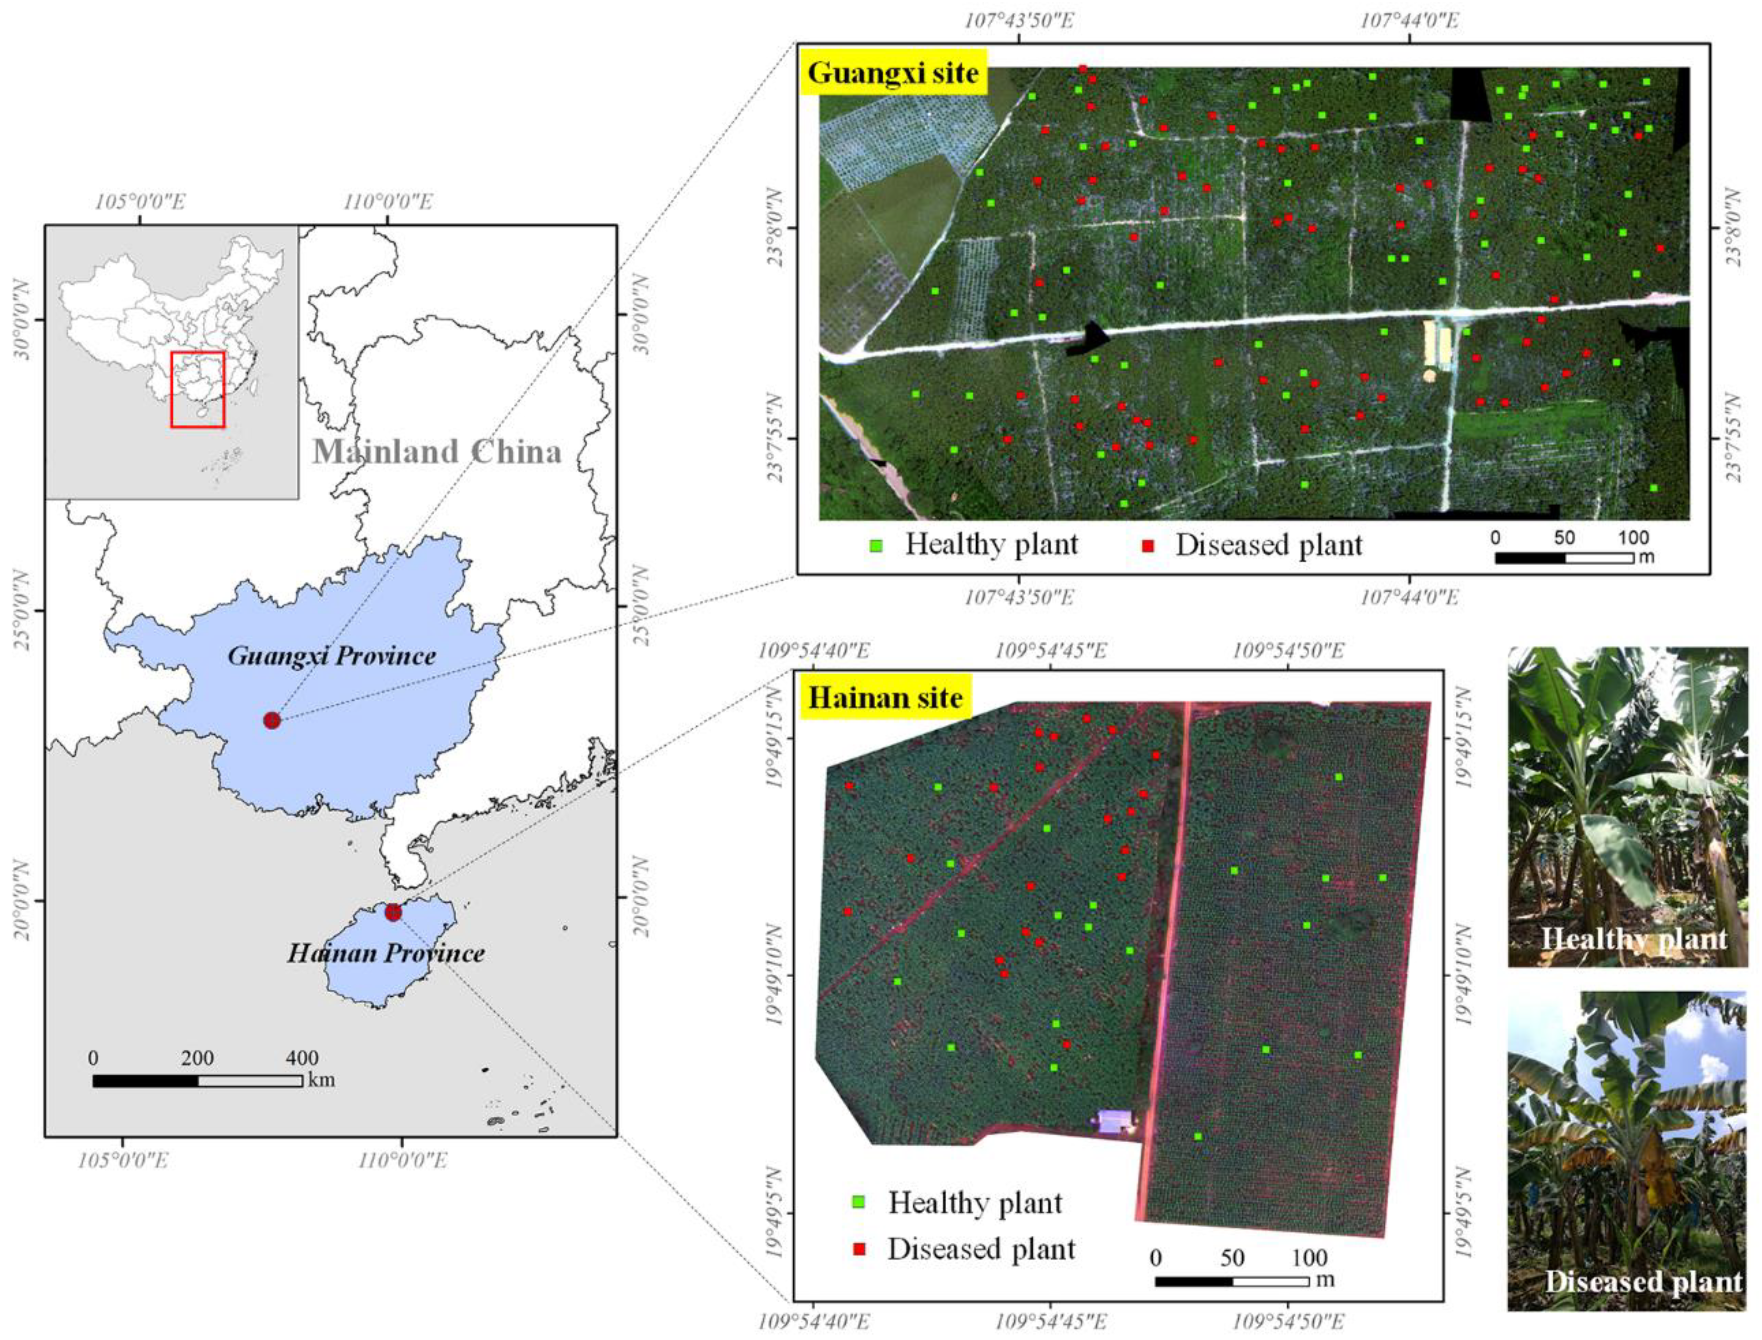
2.1. Study Area

The experiments were conducted at two experimental locations: The Guangxi site and Hainan site (Figure 1).
The Guangxi site is located in Long’an County, Guangxi Province, China (23°7’53.2"–23°8’4.0" N, 107°43’44.9–07°44’7.2" E) (Figure 1). The region has a subtropical monsoon climate characterized by year-round sufficient sunshine and rainfall. The mean annual temperature is 20.8–22.4 ℃. The average rainfall is 1200 mm a year. The soil type is a Ferralsol according to the IUSS Working Group WRB soil classification system [34]. The field crops were the banana variety “Williams B6.” The plant height was about 2.4–3 m, the leaf number was 34–36, and the growth period was 10–12 months. The farm was developed in September 2015 and was harvested for the first time in November 2016. By August 2018 (the time of field investigation in this study), the third generation of bananas was present in the fields. The planting distance was 2.0 m by 2.6 m with a planting density of 1950 plants per hectare. In this study area, more than 40% of banana plants were infected with Fusarium wilt disease of different severity.
The Hainan site is located in Chengmai County, Hainan Province, China (19°49’4.4"–19°49’15.8" N, 109°54’40.0"–109°54’53.0" E). The region has a tropical monsoon climate characterized by year-round sufficient sunshine and rainfall. The mean annual temperature is 23.1–24.5 ℃. The average rainfall is 1750 mm a year. The soil type is a Humic Acrisol according to the IUSS Working Group WRB soil classification system [34]. This experimental site was divided into two fields (left field and right field) along the boundary of the middle road. The left field was planted the banana variety “Baxijiao.” The plant height was about 2.6–3.2 m and the growth period was 9–12 months. This field was developed in June 2017 and was harvested for the first time in July 2018. By December 2018, the second generation of bananas was present in the field. The planting distance was 2.0 m by 2.3 m with a planting density of 2100 plants per hectare. In this field, about 10% of banana plants were infected with Fusarium wilt disease of different severity. The right field was developed in August 2018 and the banana variety was “Nantianhuang.” The plant height was about 2.5–3.0 m and the growth period was 10–13 months. The planting distance was the same as the left field. At the time of field investigation in December 2018, there were no plants infected with Fusarium wilt found in this field.
In this study, the Guangxi site was used for Fusarium wilt identifying model calibration and validation and the Hainan site was used for model validation.

2.2. Field Investigation

The Guangxi experiment was conducted on 7 August 2018. A total of 120 sample plots were surveyed to assess the occurrence of banana Fusarium wilt disease as ground truth data (Figure 1). The size of each sample point covered one banana plant. These samples were classified into two categories: Healthy samples (total of 57) and diseased samples (total of 63), representing the occurrence or nonoccurrence of Fusarium wilt as reflected by the external characteristics. The classification standard adopted in this paper was based on the percent of the yellowing leaf area to the total leaf area of the plant. If the percent of the yellowing leaf area to the total leaf area of the plant was less than 1%, the plant was considered to be healthy. Otherwise, it was considered to be diseased. Finally, 75% of the samples were randomly chosen and used as modeling dataset for model fitting, and the remaining 25% were used as validation dataset 1 (VD1) for validation.
The Hainan site experiment was conducted on 11 December 2018. The investigation scheme was consistent with that of Guangxi site experiment. A total of 35 sample plots were investigated, of which 16 were healthy and 19 were diseased. All the sample plots were used as validation dataset 2 (VD2) for model validation.

2.3. UAV Multi-Spectral Imagery Acquisition

The surveys were done using a DJI Phantom 4 quadcopter (DJI Innovations, Shenzhen, China). This UAV was equipped with a five-band multispectral camera MicaSense RedEdge MTM (MicaSense, Inc., Seattle, WA, USA), which has five narrow bands: Blue (465–485 nm), green (550–570 nm), red (653–673 nm), red edge (712–722 nm), and near-infrared (800–880 nm). The flight at Guangxi site was conducted between 12:30 p.m.–13:30 p.m. on 7 August 2018 and covered an area of 21 ha. The flight at Hainan site was conducted between 11:00 a.m.–12:00 p.m. on 11 December 2018 and covered an area of 11 ha. Both the flight plans were developed to ensure greater than 80% cross-track and along-track overlap rates. The multispectral imagery was acquired from a flying height of 120 m above the ground with a ground sample distance of 0.08 m. Pre- and post-flight images of MicaSense calibrated reflectance panels with known reflectance were also captured using the RedEdge sensor to aid in radiometric conversion.

2.4. Data Analysis

In this study, different VIs were used to identify the infestation status of Fusarium wilt in banana. BLR was used to assess the spatial relationship between the VIs and the plants infested or not infested with Fusarium wilt. In order to assess the classification accuracy of images with different spatial resolutions, we chose to resample the original UAV imagery of 0.08 m to generate images with 0.5-m, 1-m, 2-m, 5-m, and 10-m resolutions using the nearest neighbor resampling algorithm. These resolutions were selected because they were similar to those of several mainstream and easily accessible satellite imagery products (i.e., WorldView series with a resolution of 0.5 m, GF-2 with a resolution of 1 m, GF-1 and GF-6 with a resolution of 2 m, RapidEye with a resolution of 5 m, and Sentinel-2 with a resolution of 10 m) for agricultural applications.

2.4.1. Vegetation Indices

Considering the potential pathological characteristics of the Fusarium wilt disease infestations, eight VIs related to pigment absorption and plant growth were selected to characterize the biochemical and biophysical variations caused by individual infestations. The VIs included the NDVI, normalized difference red edge index (NDRE), green chlorophyll index (CIgreen), red-edge chlorophyll index (CIRE), structural independent pigment index (SIPI), red-edge structural independent pigment index (SIPIRE), carotenoid index (CARI), and anthocyanin reflectance index (ARI). The definitions of these VIs are listed in Table 1.

2.4.2. Binary Logistic Regression

BLR is one of the most frequently used multivariate analysis methods, where the dependent variable is a binary variable representing the presence or absence of an event. The dependent variable in the BLR method is a function of the probability and is expressed as [32]:
p = 1 / ( 1 + e y )
where p is the probability of disease occurrence, which ranges from 0 to 1, y is the linear combination, and e is the numerical constant. The y can be expressed by formula as:
y = β 0 + β 1 x 1 + β 2 x 2 + + β n x n
where β0 is the intercept and βi and xi (i = 0, 1, 2,..., n) are the slope coefficients independent variables, respectively. In this study, the BLR method was used to establish the spatial relationships between the plants infested or not infested with Fusarium wilt and the VIs extracted from different resolution images. The modelling dataset were used to fit the logistic regression models through SPSS 20.0 software (SPSS Inc., Chicago, Illinois, USA).

2.4.3. Accuracy Assessment

After the model fitting, two validation datasets (VD1 and VD2) were used to quantitatively evaluate the disease identification accuracy, respectively, with indicators such as the overall accuracy (OA) and the Kappa coefficient [43,44]. The OA is the sum of the correctly classified plots divided by the total number of plots. The Kappa value ranges between −1 and 1 with a larger value indicating better model performance. Model performance can be judged as excellent if kappa ≥ 0.75, good if 0.75 > kappa ≥ 0.4, or poor if kappa < 0.4 [45].

3. Results

3.1. Statistical Characteristics of Samples

We analyzed the differences in the VI values between the healthy and diseased samples obtained from the Guangxi site and Hainan site, and conducted independent t-test analyses for each sample. Table 2 shows the statistical characteristics of the VI values of the healthy and diseased samples. The results showed that there were significant differences in the values of CARI, CIgreen, CIRE, NDVI, NDRE, and ARI between the healthy and diseased samples (p < 0.01), but no significant differences in the SIPI and SIPIRE values (p > 0.05). Therefore, CIgreen, CIRE, NDVI, NDRE, CARI, and ARI were selected for the subsequent analysis.

3.2. Model Fitting with Different Vegetation Indices

In this study, the modeling dataset was used to fit the logistic regression models describing the relationship between the VIs and the plants infested or not infested with Fusarium wilt. Both the validation dataset 1 (VD1) from the Guangxi site and validation dataset 2 (VD2) from the Hainan site were used to verify the classification accuracy of the fitted models. The results showed that the use of the CIgreen, CIRE, NDVI, and NDRE resulted in relatively good fitting models with an OA greater than 80% (Table 3). Of all VIs, the CIRE obtained the highest validation OA and highest validation Kappa coefficient both for VD1 (OA = 91.7%, Kappa = 0.83) and VD2 (OA = 80.0%, Kappa = 0.59), indicating that CIRE had the best performance for Fusarium wilt identification. For the same type of VI, higher validation OA and Kappa coefficient were obtained for VIs that included the red-edge band (e.g., CIRE vs. CIgreen, and NDRE vs. NDVI). However, the validation OA and Kappa coefficients based on the CARI and ARI were relatively low.

3.3. Model Fitting for Different Resolution Imagery

The effect of resolution on the identification accuracy of banana Fusarium wilt disease was assessed to provide reference information for large-scale applications of satellite-based data. The UAV imagery was resampled to represent five resolutions (0.5 m, 1 m, 2 m, 5 m, and 10 m) to monitor the occurrence of Fusarium wilt. In order to consider satellite imagery with red-edge bands, both the optimal VI with a red-edge band (CIRE) and the optimal VI without a red-edge band (CIgreen) were calculated for the images with different spatial resolutions. Table 4 lists the results of logistic regression fitting between locations of infested or noninfested plants and the optimal VIs (CIRE and CIgreen) at different resolutions. The results showed that the logistic regression models for the CIRE for the 0.5-m, 1-m, and 2-m resolution imagery had an acceptable fitting accuracy with the fitting OA greater than 80% (OA = 90.5%, 83.2% and 81.1% for 0.5-m, 1-m, and 2-m resolution, respectively). Verification results also showed that the CIRE for the 0.5-m, 1-m, and 2-m resolution obtained the acceptable validation OA (over 70%) and Kappa coefficient (over 0.40). For the VD1, the validation OA for the 0.5-m, 1-m, and 2-m resolution were 91.7%, 79.2%, and 75.0%, respectively, and the Kappa coefficients were 0.83, 0.60, and 0.53, respectively. For the VD2, the validation OA for the 0.5-m, 1-m, and 2-m resolution were 85.7%, 74.3%, and 71.4%, respectively, and the Kappa coefficients were 0.71, 0.48, and 0.41, respectively. However, the OA and Kappa coefficient for the 5-m and 10-m resolutions were relatively low. As the resolution decreased, the OA and Kappa coefficient showed a decreasing trend. Moreover, at the same spatial resolution, the CIgreen resulted in lower accuracy of the identification models of Fusarium wilt than the CIRE. For the CIgreen, the result was only acceptable at 0.5-m resolution.

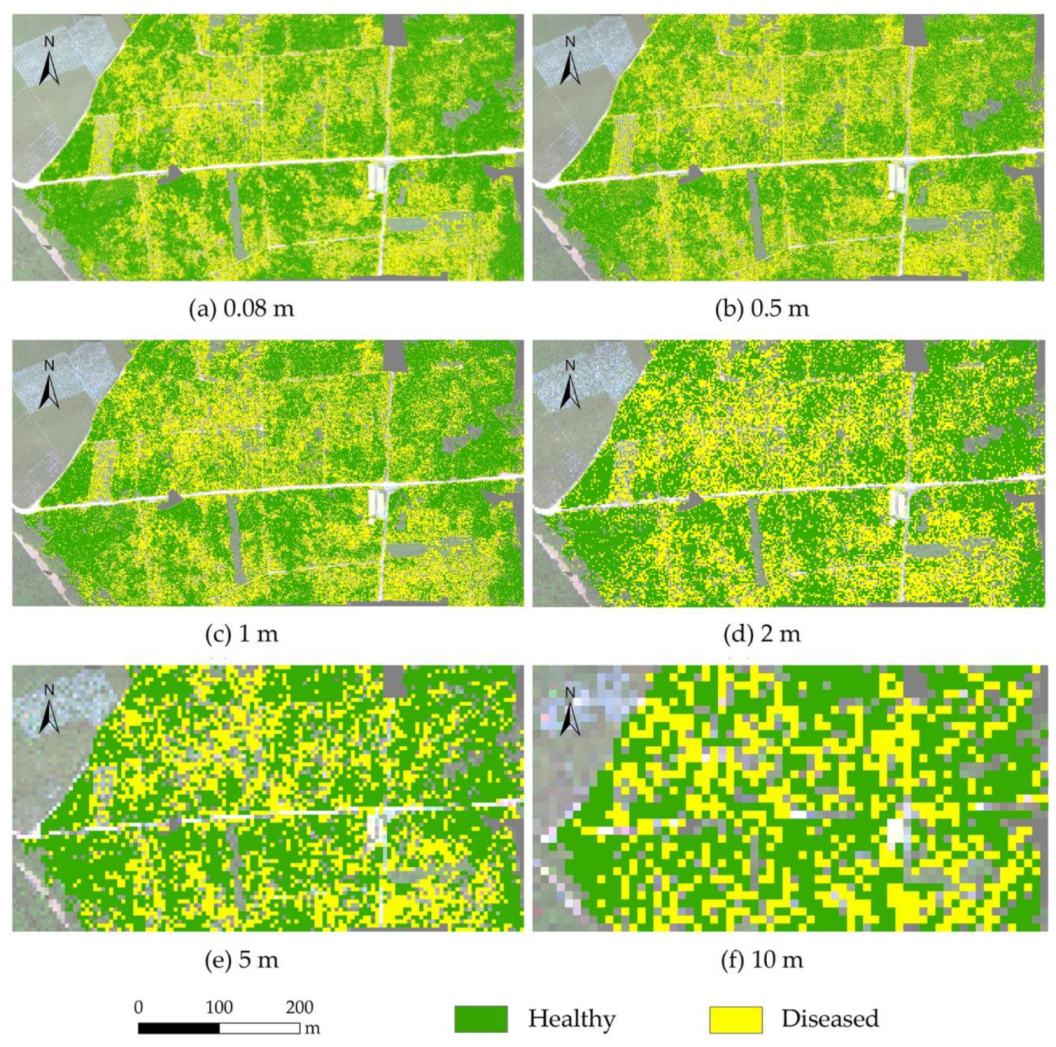
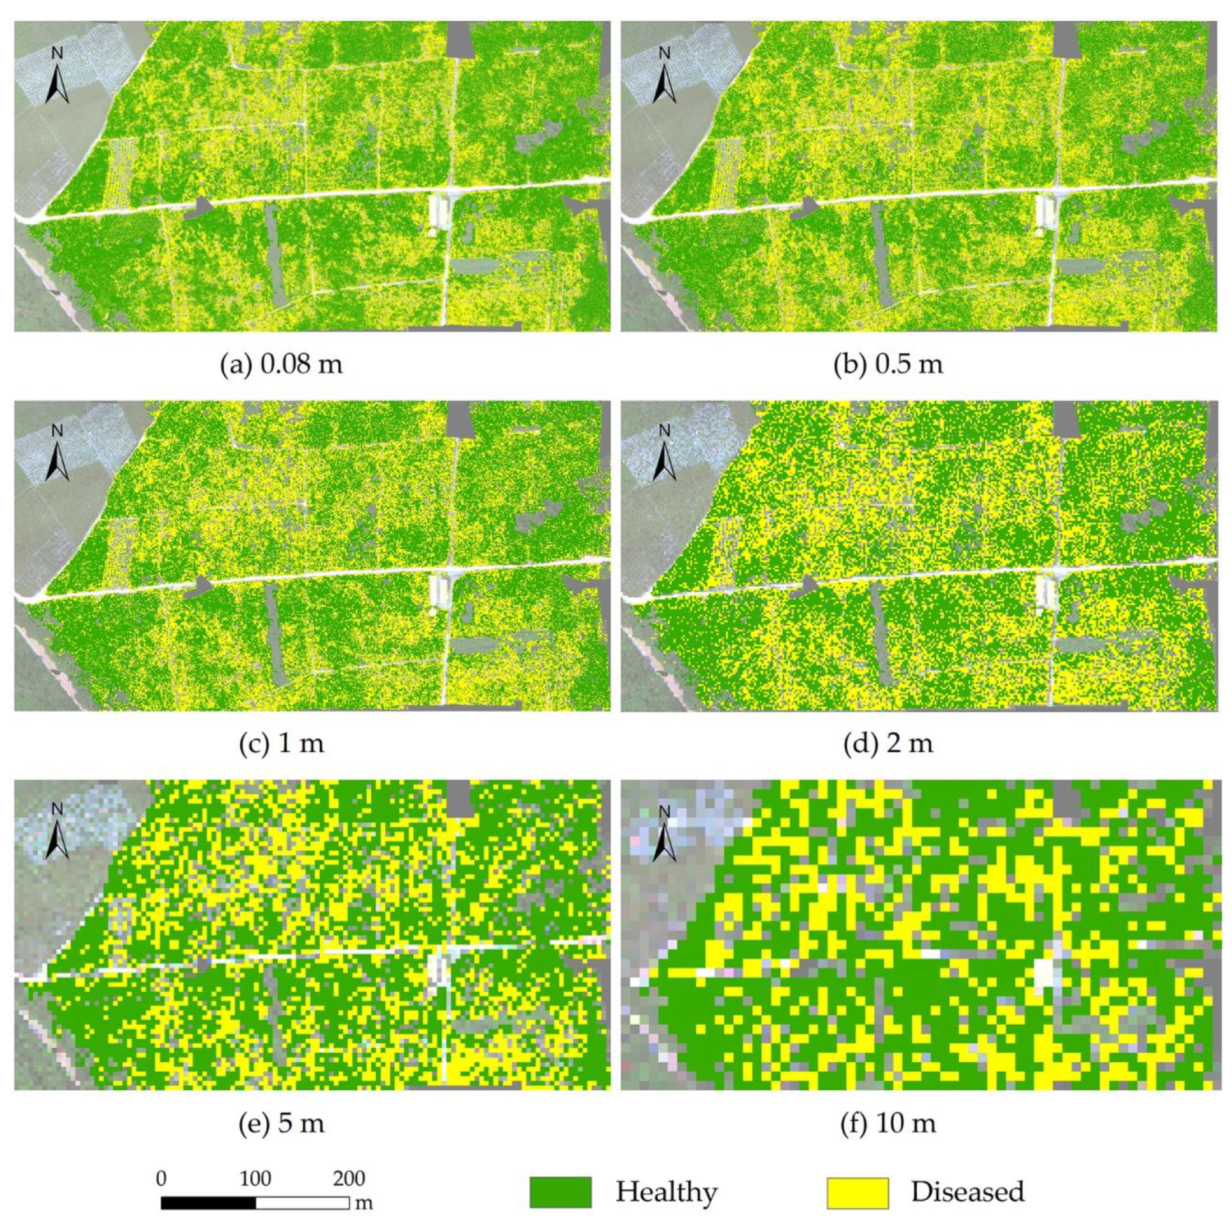
3.4. Mapping Disease Distribution using Imagery with Different Resolutions

In order to further understand the visual effect of resolution, the distributions of banana Fusarium wilt infested or non-infested regions at Guangxi site were mapped at different resolutions (including 0.5-m, 1-m, 2-m, 5-m, and 10-m resolutions). CIRE and CIgreen were used as input variables to create disease distribution maps based on their identification models of banana Fusarium (Figure 2 and Figure 3). The maps with 0.08-m, 0.5-m, 1-m and 2-m resolutions appeared quite similar with regard to the occurrence of Fusarium wilt disease (Figure 2a–d and Figure 3a–d), whereas the maps with 5-m and 10-m resolutions showed little detail (Figure 2e,f and Figure 3e,f). We also calculated the area and percentage of the Fusarium wilt infected regions based on different resolution maps (see Table 5). For the CIRE-based maps, the areas of Fusarium wilt disease regions were in the range of 5.69–6.59 ha, accounting for 38.2%–44.3% of the total planting area of bananas at different resolutions. Within the 2-m resolution, the percentage of the Fusarium wilt infected regions were in the range of 40.8%–43.6%. For the CIgreen-based maps, the areas of Fusarium wilt disease regions were in the range of 5.09–6.63 ha, accounting for 34.2%–44.6% of the total planting area of bananas. At 0.08-m and 0.5-m resolutions, the percentage of the Fusarium wilt infected regions were 40.1% and 44.6%, respectively.

4. Discussion

The results of this study indicate that the CIRE was the optimal red-edge VI and the CIgreen was the optimal non-red-edge VI for developing identification models for banana Fusarium wilt. This is attributed to the fact that as the infection of Fusarium wilt progresses, the chlorophyll content decreases significantly [46], and the CIRE and CIgreen values are sensitive to small variations in the chlorophyll content [37,38]. Furthermore, for the same type of VI, higher OA and Kappa coefficients were obtained for VIs that included the red-edge band than for those without a red-edge band (i.e., CIRE vs. CIgreen and NDRE vs. NDVI). Many studies have demonstrated that the red-edge region is highly sensitive to changes in chlorophyll, and bands in this region are well-suited for estimating the chlorophyll content [47,48], which decreased significantly as the infection of Fusarium wilt progressed. Huang et al. [7] also proved that the red-edge band can be used for disease detection. However, the UAV-based multispectral images used in this study only had five spectral bands, which may not fully reflect the differences in spectral characteristic between healthy and diseased plants. It is necessary to conduct further studies on the sensitivity of certain bands to Fusarium wilt using hyperspectral data.
The results also demonstrated the potential of BLR combined with VIs for the accurate identification of banana Fusarium wilt. This approach provides an ideal framework for using spectral features to determine pathological mechanisms. In this study, the dependent variable was the infection or non-infection of banana Fusarium wilt. BLR is a suitable approach when the predicted variable has a binary nature [32]. Moreover, when the predictor variables are continuous, categorical, or a combination of the two, its performance is better than discriminant analysis [49]. Because BLR is very efficient and highly interpretable and does not require large computational resources, it is a widely used technique to describe the relationship between a dependent variable and multiple independent variables [32]. However, logistic regression is not one of the most powerful algorithms, and some more complex algorithms may easily perform better. Moreover, nonlinear problems cannot be solved with logistic regression due to the linear decision surface. With the development of artificial intelligence, pattern recognition and machine learning methods will become more prevalent for monitoring and forecasting of crop diseases using remote sensing [50].
In this study, VD1 from the Guangxi site and VD2 from the Hainan site were used to verify the Fusarium wilt detection models. The verification results at two locations showed that CIRE and CIgreen had good performances for Fusarium wilt identification with the OA all greater than 70% and Kappa values all greater than 0.4, indicating a good transferability of the Fusarium wilt detection methodology in other areas. However, in Table 3 and Table 4, it can be seen that the Kappa values of VD2 were lower than those of VD1. For example, in Table 3, the Kappa value of CIRE was 0.83 in VD1 and 0.59 in VD2, and the Kappa value of CIgreen was 0.74 in VD1 and 0.47 in VD2. This shows that the application of the Fusarium wilt detection methodology in other areas would cause some loss of precision. This situation may be caused by the following factors. First of all, the different varieties of the two experimental sites may be one of the most important reasons affecting the verification results. The variety for VD1 was “Williams B6” and for VD2 was “Baxijiao.” There were differences in biophysical and biochemical characteristics between those two varieties. Differences in these variety characteristics can lead to differences in spectral information. Second, due to the differences in planting systems between these two experimental sites, their growth stages differ greatly. When acquiring images in this study, the two experiments were at different growth stages. Besides, it is also better to consider factors, such as planting density, soil types, and crop growth environmental conditions, that could affect the applicability of the Fusarium wilt detection methodology. Therefore, when applying the method in different regions, it is suggested to optimize the parameters of BLR if there is a large difference between the application and the modeling area of banana planting and growth.
This study demonstrates that UAV-based multispectral imagery is well-suited for the identification of banana Fusarium wilt disease. We also simulated the resolutions of satellite-based imagery (i.e., WorldView series with a resolution of 0.5 m, GF-2 with a resolution of 1 m, GF-1 and GF-6 with a resolution of 2 m, RapidEye with a resolution of 5 m, and Sentinel-2 with a resolution of 10 m) to assess the effects of imagery with different spatial resolution on the identification of disease. The results showed that imagery with a spatial resolution higher than 2 m had good identification accuracy of Fusarium wilt, which might be related to the plant spacing of bananas. As the resolution decreased, the mixed pixel effect worsened, and the monitoring accuracy decreased. However, the resolution was not the only difference among the UAV and satellites. The satellites captured information in wavelengths that was not the same as the ones used in the UAV sensors. Hence, the simulated results of the different resolutions need to be further verified while applied with the actual satellite data. In this study, single date multispectral imagery was used, which represents limitations with regard to determining the spectral response mechanism of the changes in the biophysical and chemical parameters caused by Fusarium wilt. In the future, multitemporal and hyperspectral imagery should be investigated. Moreover, the differences in the spectral response characteristic between Fusarium wilt and other yellowing phenomena caused by other stresses (i.e., nutrition deficiency and drought stress) should also be examined.

5. Conclusions

This study used VIs derived from UAV-based multispectral imagery and BLR to develop an identification method for detecting banana Fusarium wilt. The results showed that Fusarium wilt of banana can be identified with this method. The fitting OA of the CIgreen, CIRE, NDVI, and NDRE were all higher than 80%. Among the investigated VIs, the CIRE exhibited the best performance both for the verification dataset 1 (OA = 91.7%, Kappa = 0.83) and verification dataset 2 (OA = 80.0%, Kappa = 0.59). For the same type of VI, the VIs including a red-edge band obtained a better performance than those excluding a red-edge band. The simulation of imagery with different spatial resolutions (i.e., 0.5-m, 1-m, 2-m, 5-m, and 10-m resolutions) showed that good identification accuracy of Fusarium wilt was obtained when the resolution was higher than 2 m. As the resolution decreased, the identification accuracy of Fusarium wilt showed a decreasing trend. The results of this study indicate that UAV-based remote sensing imagery with a red-edge band is well-suited for the identification of banana Fusarium wilt disease, providing guidance for disease treatment and crop planting adjustment.

Author Contributions

H.Y. performed the data analysis and wrote the manuscript. W.H. guided the study and discussed the methods and results. S.H., B.C. and Y.D. provided suggestions for the study, reviewed and edited the manuscript. H.Y., A.G., Y.R. and Y.J. conducted the field experiments. All authors have read and agreed to the published version of the manuscript.

Funding

This research was funded by the Hainan Provincial Key R&D Program of China (ZDYF2018073), Hainan Provincial Major Science and Technology Program of China (ZDKJ2019006), National Natural Science Foundation of China (41571354), Agricultural Science and Technology Innovation Program of Sanya, China (2019NK17), National Special Support Program for High-level Personnel Recruitment (Ten-thousand Talents Program) (Wenjiang Huang).

Acknowledgments

We gratefully acknowledge the National Meteorological Information Center of China, Guangxi Jiejiarun Technology Co., Ltd. and Guangxi Jinsui Agriculture Group Co., Ltd. for the experiments.

Conflicts of Interest

The authors declare no conflict of interest.

References

  1. Shen, Z.; Xue, C.; Penton, C.R.; Thomashow, L.S.; Zhang, N.; Wang, B.; Ruan, Y.; Li, R.; Shen, Q. Suppression of banana Panama disease induced by soil microbiome reconstruction through an integrated agricultural strategy. Soil. Biol. Biochem. 2019, 128, 164–174. [Google Scholar] [CrossRef]
  2. Ordonez, N.; Seidl, M.F.; Waalwijk, C.; Drenth, A.; Kilian, A.; Thomma, B.P.H.J.; Ploetz, R.C.; Kema, G.H.J. Worse comes to worst: Bananas and Panama disease-when plant and pathogen clones meet. PLoS Pathog. 2015, 11, e1005197. [Google Scholar] [CrossRef] [PubMed] [Green Version]
  3. Van den Berg, N.; Berger, D.K.; Hein, I.; Birch, P.R.; Wingfield, M.J.; Viljoen, A. Tolerance in banana to Fusarium wilt is associated with early up-regulation of cell wall-strengthening genes in the roots. Mol. Plant Pathol. 2007, 8, 333–341. [Google Scholar] [CrossRef] [PubMed]
  4. Lin, B.; Shen, H. Fusarium oxysporum f. sp. cubense. In Biological Invasions and Its Management in China: Volume 2; Wan, F., Jiang, M., Zhan, A., Eds.; Springer: Singapore, 2017. [Google Scholar]
  5. Shi, Y.; Huang, W.; Ye, H.; Ruan, C.; Xing, N.; Geng, Y.; Dong, Y.; Peng, D. Partial least square discriminant analysis based on normalized two-stage vegetation indices for mapping damage from rice diseases using PlanetScope datasets. Sensors 2018, 18, 1901. [Google Scholar] [CrossRef] [Green Version]
  6. Huang, W.; Lamb, D.W.; Niu, Z.; Zhang, Y.; Liu, L.; Wang, J. Identification of yellow rust in wheat using in-situ spectral reflectance measurements and airborne hyperspectral imaging. Precis. Agric. 2007, 8, 187–197. [Google Scholar] [CrossRef]
  7. Huang, W.; Guan, Q.; Luo, J.; Zhang, J.; Zhao, J.; Liang, D.; Huang, L.; Zhang, D. New optimized spectral indices for identifying and monitoring winter wheat diseases. IEEE J. Sel. Top. Appl. Earth Observ. Remote Sens. 2014, 7, 2516–2524. [Google Scholar] [CrossRef]
  8. Shi, Y.; Huang, W.; Gonzalez-Moreno, P.; Luke, B.; Dong, Y.; Zheng, Q.; Ma, H.; Liu, L. Wavelet-based rust spectral feature set (WRSFs): A novel spectral feature set based on continuous wavelet transformation for tracking progressive host-pathogen interaction of yellow rust on wheat. Remote Sens. 2018, 10, 525. [Google Scholar] [CrossRef] [Green Version]
  9. Jin, X.; Jie, L.; Wang, S.; Qi, H.J.; Li, S.W. Classifying wheat hyperspectral pixels of healthy heads and Fusarium head blight disease using a deep neural network in the wild field. Remote Sens. 2018, 10, 395. [Google Scholar] [CrossRef] [Green Version]
  10. Mahlein, A.K.; Alisaac, E.; Al Masri, A.; Behmann, J.; Dehne, H.W.; Oerke, E.C. Comparison and Combination of Thermal, Fluorescence, and Hyperspectral Imaging for Monitoring Fusarium Head Blight of Wheat on Spikelet Scale. Sensors 2019, 19, 2281. [Google Scholar] [CrossRef] [Green Version]
  11. Yuan, L.; Pu, R.; Zhang, J.; Wang, J.; Yang, H. Using high spatial resolution satellite imagery for mapping powdery mildew at a regional scale. Precis. Agric. 2016, 17, 332–348. [Google Scholar] [CrossRef]
  12. Zhao, J.; Xu, C.; Xu, J.; Huang, L.; Zhang, D.; Liang, D. Forecasting the wheat powdery mildew (Blumeria graminis f. Sp tritici) using a remote sensing-based decision-tree classification at a provincial scale. Australas Plant Path. 2018, 47, 53–61. [Google Scholar] [CrossRef]
  13. Huang, J.; Liao, H.; Zhu, Y.; Sun, J.; Sun, Q.; Liu, X. Hyperspectral detection of rice damaged by rice leaf folder (Cnaphalocrocis medinalis). Comput. Electron. Agric. 2012, 82, 100–107. [Google Scholar] [CrossRef]
  14. Yang, C.M. Assessment of the severity of bacterial leaf blight in rice using canopy hyperspectral reflectance. Precis. Agric. 2010, 11, 61–81. [Google Scholar] [CrossRef]
  15. Dhau, I.; Adam, E.; Mutanga, O.; Ayisi, K.; Abdel-Rahman, E.M.; Odindi, J.; Masocha, M. Testing the capability of spectral resolution of the new multispectral sensors on detecting the severity of grey leaf spot disease in maize crop. Geocarto Int. 2018, 33, 1223–1236. [Google Scholar] [CrossRef]
  16. Zhang, M.; Qin, Z.; Liu, X.; Ustin, S.L. Detection of stress in tomatoes induced by late blight disease in California, USA, using hyperspectral remote sensin. Int. J. Appl. Earth. Obs. Geoinf. 2003, 4, 295–310. [Google Scholar] [CrossRef]
  17. Jones, C.D.; Jones, J.B.; Lee, W.S. Diagnosis of bacterial spot of tomato using spectral signatures. Comput. Electron. Agric. 2010, 74, 329–335. [Google Scholar] [CrossRef]
  18. Zheng, Q.; Huang, W.; Cui, X.; Shi, Y.; Liu, L. New spectral index for detecting wheat yellow rust using Sentinel-2 multispectral imagery. Sensors 2018, 18, 868. [Google Scholar] [CrossRef] [Green Version]
  19. Bravo, C.; Moshou, D.; West, J.; McCartney, A.; Ramon, H. Early disease detection in wheat fields using spectral reflectance. Biosyst. Eng. 2003, 84, 137–145. [Google Scholar] [CrossRef]
  20. Devadas, R.; Lamb, D.W.; Simpfendorfer, S.; Backhouse, D. Evaluating ten spectral vegetation indices for identifying rust infection in individual wheat leaves. Precis. Agric. 2009, 10, 459–470. [Google Scholar] [CrossRef]
  21. Oumar, Z.; Mutanga, O. Using WorldView-2 bands and indices to predict bronze bug (Thaumastocoris peregrinus) damage in plantation forests. Int. J. Remote. Sens. 2013, 34, 2236–2249. [Google Scholar] [CrossRef]
  22. Zhang, J.; Huang, Y.; Yuan, L.; Yang, G.; Chen, L.; Zhao, C. Using satellite multi-spectral imagery for damage mapping of armyworm (Spodoptera frugiperda) in maize at a regional scale. Pest Manag. Sci. 2016, 72, 335–348. [Google Scholar] [CrossRef] [PubMed]
  23. Dash, J.P.; Watt, M.S.; Pearse, G.D.; Heaphy, M.; Dungey, H.S. Assessing very high resolution UAV imagery for monitoring forest health during a simulated disease outbreak. ISPRS J. Photogramm. Remote Sens. 2017, 131, 1–14. [Google Scholar] [CrossRef]
  24. Deng, L.; Mao, Z.; Li, X.; Hu, Z.; Yan, Y. UAV-based multispectral remote sensing for precision agriculture: A comparison between different cameras. ISPRS J. Photogramm. Remote Sens. 2018, 146, 124–136. [Google Scholar] [CrossRef]
  25. Liu, B.; Shi, Y.; Duan, Y.; Wu, W. UAV-based crops classification with joint features from orthoimage and DSM data. Int. Arch. Photogram. Remote Sens. Spat. Inform. Sci. 2018, XLII-3, 1023–1028. [Google Scholar] [CrossRef] [Green Version]
  26. Liu, K.; Zhou, Q.B.; Wu, W.B.; Xia, T.; Tang, H.J. Estimating the crop leaf area index using hyperspectral remote sensing. J. Integr. Agr. 2016, 15, 475–491. [Google Scholar] [CrossRef] [Green Version]
  27. Machovina, B.L.; Feeley, K.J.; Machovina, B.J. UAV remote sensing of spatial variation in banana production. Crop Pasture Sci. 2016, 67, 1281–1287. [Google Scholar] [CrossRef]
  28. Ye, H.; Cui, B.; Huang, S.; Dong, Y.; Huang, W.; Ren, Y.; Guo, A.; Jin, Y. Identification of banana Fusarium wilt disease based on UAV multi-spectral imagery. In Proceedings of the International Conference on Intelligent Agriculture, Beijing, China, 18–21 October 2019. [Google Scholar]
  29. Li, N.; Xie, G.; Zhou, D.; Zhang, C.; Jiao, C. Remote sensing classification of marsh wetland with different resolution images. J. Resour. Ecol. 2016, 7, 107–114. [Google Scholar]
  30. Fisher, J.R.; Acosta, E.A.; Dennedy-Frank, P.J.; Kroeger, T.; Boucher, T.M. Impact of satellite imagery spatial resolution on land use classification accuracy and modeled water quality. Remote Sens. Ecol. Conserv. 2018, 4, 137–149. [Google Scholar] [CrossRef]
  31. Mahlein, A.K.; Oerke, E.C.; Steiner, U.; Dehne, H.W. Recent advances in sensing plant diseases for precision crop protection. Eur. J. Plant Pathol. 2012, 133, 197–209. [Google Scholar] [CrossRef]
  32. Lee, S.; Pradhan, B. Landslide hazard mapping at Selangor, Malaysia using frequency ratio and logistic regression models. Landslides 2007, 4, 33–41. [Google Scholar] [CrossRef]
  33. Ozdemir, A. Using a binary logistic regression method and GIS for evaluating and mapping the groundwater spring potential in the Sultan Mountains (Aksehir, Turkey). J. Hydrol. 2011, 405, 123–136. [Google Scholar] [CrossRef]
  34. IUSS Working Group WRB. World Reference Base for Soil Resources 2006; FAO: Rome, Italy, 2006. [Google Scholar]
  35. Rouse, J.W.; Haas, R.H.; Schell, J.A.; Deering, D.W. Monitoring vegetation systems in the great plains with ERTS. In Proceedings of the Third ERTS-1 Symposium NASA SP-351, Greenbelt, MD, USA, 10–14 December 1973. [Google Scholar]
  36. Gitelson, A.; Merzlyak, M.N. Spectral reflectance changes associated with autumn senescence of aesculus–hippocastanum L and acer-platanoides L leaves—spectral features and relation to chlorophyll estimation. J. Plant Physiol. 1994, 143, 286–292. [Google Scholar] [CrossRef]
  37. Gitelson, A.A.; Gritz, Y.; Merzlyak, M.N. Relationships between leaf chlorophyll content and spectral reflectance and algorithms for non-destructive chlorophyll assessment in higher plant leaves. J. Plant Physiol. 2003, 160, 271–282. [Google Scholar] [CrossRef] [PubMed]
  38. Gitelson, A.A.; Vina, A.; Ciganda, V.; Rundquist, D.C.; Arkebauer, T.J. Remote estimation of canopy chlorophyll content in crops. Geophys. Res. Lett. 2005, 32, L08403. [Google Scholar] [CrossRef] [Green Version]
  39. Peñuelas, J.; Inoue, Y. Reflectance indices indicative of changes in water and pigment contents of peanut and wheat leaves. Photosynthetica 1999, 36, 355–360. [Google Scholar] [CrossRef]
  40. Ramoelo, A.; Skidmore, A.K.; Cho, M.A.; Schlerf, M.; Mathieu, R.; Heitkonig, I.M.A. Regional estimation of savanna grass nitrogen using the red-edge band of the spaceborne RapidEye sensor. Int. J. Appl. Earth. Obs. Geoinf. 2012, 19, 151–162. [Google Scholar] [CrossRef]
  41. Zhou, X.; Huang, W.; Zhang, J.; Kong, W.; Casa, R.; Huang, Y. A novel combined spectral index for estimating the ratio of carotenoid to chlorophyll content to monitor crop physiological and phenological status. Int. J. Appl. Earth. Obs. Geoinf. 2019, 76, 128–142. [Google Scholar] [CrossRef]
  42. Gitelson, A.A.; Merzlyak, M.N.; Chivkunova, O.B. Optical properties and nondestructive estimation of anthocyanin content in plant leaves. Photochem. Photobiol. 2001, 74, 38–45. [Google Scholar] [CrossRef]
  43. Congalton, R.G. A review of assessing the accuracy of classifications of remotely sensed data. Remote Sens. Environ. 1991, 37, 35–46. [Google Scholar] [CrossRef]
  44. Foody, G.M. Classification accuracy comparison: Hypothesis tests and the use of confidence intervals in evaluations of difference, equivalence and non-inferiority. Remote Sens. Environ. 2009, 113, 1658–1663. [Google Scholar] [CrossRef] [Green Version]
  45. Tuanmu, M.N.; Viña, A.; Bearer, S.; Xu, W.; Ouyang, Z.; Zhang, H.; Liu, J. Mapping understory vegetation using phenological characteristics derived from remotely sensed data. Remote Sens. Environ. 2010, 114, 1833–1844. [Google Scholar] [CrossRef]
  46. Dong, X.; Wang, M.; Ling, N.; Shen, Q.; Guo, S. Potential role of photosynthesis-related factors in banana metabolism and defense against Fusarium oxysporum f. sp cubense. Environ. Exp. Bot. 2016, 129, 4–12. [Google Scholar] [CrossRef]
  47. Clevers, J.G.P.W.; de Jong, S.M.; Epema, G.F.; van der Meer, F.; Bakker, W.H.; Skidmore, A.K.; Addink, E.A. MERIS and the red-edge position. Int. J. Appl. Earth. Obs. Geoinf. 2001, 3, 313–320. [Google Scholar] [CrossRef]
  48. Dash, J.; Curran, P.J. The MERIS terrestrial chlorophyll index. Int. J. Remote Sens. 2004, 25, 5403–5413. [Google Scholar] [CrossRef]
  49. Mathew, J.; Jha, V.K.; Rawat, G.S. Application of binary logistic regression analysis and its validation for landslide susceptibility mapping in part of Garhwal Himalaya, India. Int. J. Remote Sens. 2007, 28, 2257–2275. [Google Scholar] [CrossRef]
  50. Lu, J.; Sun, L.; Huang, W. Research progress in monitoring and forecasting of crop pests and diseases by remote sensing. Remote Sens. Technol. Appl. 2019, 34, 21–32. [Google Scholar]
Figure 1. Location of the experimental sites with the distribution of survey sites in the banana plantations.
Remotesensing 12 00938 g001
Figure 2. Maps of the distribution of banana Fusarium wilt at Guangxi site based on the CIRE for different resolutions. (a) 0.08-m resolution; (b) 0.5-m resolution; (c) 1-m resolution; (d) 2-m resolution; (e) 5-m resolution; (f) 10-m resolution.
Remotesensing 12 00938 g002
Figure 3. Maps of the distribution of banana Fusarium wilt at Guangxi site based on the CIgreen for different resolutions. (a) 0.08-m resolution; (b) 0.5-m resolution; (c) 1-m resolution; (d) 2-m resolution; (e) 5-m resolution; (f) 10-m resolution.
Remotesensing 12 00938 g003
Table 1. List of eight vegetation indices (Vis) used in this study.
Vegetation
Index
DescriptionFormulationSensitive
Parameter
Reference
NDVINormalized difference vegetation index(RNIRRred)/(RNIR+Rred)Leaf area index, green biomass[35]
NDRENormalized difference red edge index(RNIR–RRE)/(RNIR+RRE)Leaf area index, green biomass[36]
CIgreenGreen chlorophyll indexRNIR/Rgreen–1Chlorophyll content[37]
CIRERed-edge chlorophyll indexRNIR/RRE–1Chlorophyll content[38]
SIPIStructural independent pigment index(RNIRRblue)/(RNIRRred)Pigment content[39]
SIPIRERed-edge structural independent pigment index(RRERblue)/(RRERred)Pigment content[40]
CARICarotenoid indexRRE/Rgreen–1Carotenoid content[41]
ARIAnthocyanin reflectance index1/Rgreen–1/RREAnthocyanin content[42]
Table 2. Statistical characteristics of VIs values of the healthy and diseased samples.
ExperimentVISample CategoryNo. of SamplesMean of VI ValueStd. Deviationp Value (t-test)
Guangxi siteNDVIHealthy570.540.110.00
Diseased630.340.14
NDREHealthy570.200.080.00
Diseased630.020.09
CIgreenHealthy571.080.320.00
Diseased630.430.33
CIREHealthy570.560.220.00
Diseased630.090.22
SIPIHealthy570.880.360.24
Diseased631.685.26
SIPIREHealthy570.580.710.25
Diseased632.079.77
CARIHealthy570.340.040.00
Diseased630.300.06
ARIHealthy570.850.150.00
Diseased630.620.16
Hainan siteNDVIHealthy160.44 0.050.00
Diseased190.36 0.06
NDREHealthy160.35 0.100.00
Diseased190.12 0.09
CIgreenHealthy160.92 0.260.00
Diseased190.49 0.26
CIREHealthy160.35 0.100.00
Diseased190.12 0.09
SIPIHealthy161.070.070.06
Diseased191.180.12
SIPIREHealthy161.110.110.04
Diseased191.230.16
CARIHealthy160.43 0.160.01
Diseased190.33 0.19
ARIHealthy160.87 0.300.03
Diseased190.61 0.35
Table 3. The logistic regression models for different vegetation indices.
VILogistic Regression EquationOA* of the Fitting (%)Validation Dataset 1Validation Dataset 2
OA (%)KappaOA (%)Kappa
NDVIy = –11.851×NDVI+5.37386.383.30.6662.90.22
NDREy = –15.775×NDRE+1.80290.587.50.7565.70.39
CIgreeny = –4.144×CIgreen+3.11889.587.50.7474.30.47
CIREy = –6.110×CIRE+1.93591.691.70.8380.00.59
CARIy = –9.966×CARI+3.17262.166.70.3560.00.21
ARIy = –7.247×ARI+5.32675.883.30.6668.60.37
* Overall accuracy.
Table 4. The logistic regression models for the CIRE and CIgreen VIs for images with different resolutions.
ResolutionLogistic Regression EquationOA* of the Fitting (%)Validation Dataset 1Validation Dataset 2
OA (%)KappaOA (%)Kappa
CIRE
0.5 my = –5.826×CIRE+1.98790.591.70.8385.70.71
1 my = –4.896×CIRE+1.64583.279.20.6074.30.48
2 my = –4.178×CIRE+1.47581.175.00.5371.40.41
5 my = –2.854×CIRE+1.02776.870.80.4265.70.30
10 my = –1.817×CIRE+0.76169.562.50.2562.90.24
CIgreen
0.5 my = –3.946×CIgreen+3.16687.487.50.7574.30.48
1 my = –3.266×CIgreen+2.63383.275.00.5165.70.32
2 my = –2.936×CIgreen+2.42178.975.00.5162.90.26
5 my = –1.862×CIgreen+1.55270.566.70.3548.60.01
10 my = –1.158×CIgreen+1.04461.158.30.1845.7−0.01
* Overall accuracy.
Table 5. Area and percentage of the Fusarium wilt infected regions based on different resolution maps.
ResolutionHealthy Area (ha)Diseased Area (ha)Percentage of Diseased Area (%)
CIRE
0.08 m8.786.0440.8
0.5 m8.286.5944.3
1 m8.606.2842.2
2 m8.386.4743.6
5 m9.115.7038.5
10 m9.195.6938.2
CIgreen
0.08 m8.875.9540.1
0.5 m8.246.6344.6
1 m8.446.4443.3
2 m8.226.6344.6
5 m9.125.6938.4
10 m9.795.0934.2

