Article

Axis Learning for Orientated Objects Detection in Aerial Images

1
State Key Laboratory of Information Engineering in Surveying Mapping and Remote Sensing, Wuhan University, Wuhan 430079, China
2
State Grid Zhejiang Electric Power Corporation, Hangzhou 310007, China
*
Author to whom correspondence should be addressed.
Remote Sens. 2020, 12(6), 908; https://doi.org/10.3390/rs12060908
Submission received: 9 February 2020 / Revised: 9 March 2020 / Accepted: 9 March 2020 / Published: 12 March 2020

Abstract

:
Orientated object detection in aerial images is still a challenging task due to the bird’s eye view and the various scales and arbitrary angles of objects in aerial images. Most current methods for orientated object detection are anchor-based, which require considerable pre-defined anchors and are time consuming. In this article, we propose a new one-stage anchor-free method to detect orientated objects in per-pixel prediction fashion with less computational complexity. Arbitrary orientated objects are detected by predicting the axis of the object, which is the line connecting the head and tail of the object, and the width of the object is vertical to the axis. By predicting objects at the pixel level of feature maps directly, the method avoids setting a number of hyperparameters related to anchor and is computationally efficient. Besides, a new aspect-ratio-aware orientation centerness method is proposed to better weigh positive pixel points, in order to guide the network to learn discriminative features from a complex background, which brings improvements for large aspect ratio object detection. The method is tested on two common aerial image datasets, achieving better performance compared with most one-stage orientated methods and many two-stage anchor-based methods with a simpler procedure and lower computational complexity.

Graphical Abstract

1. Introduction

Great performance has been achieved in object detection (Faster-RCNN [1], SSD [2], YOLO [3], RetinaNet [4], etc.) in natural images, and object detection in aerial images has attracted more attention recently given the advances in remote sensing. Object detection in aerial images aims to locate objects of interest (e.g., vehicles and ships) on the ground, and recognize their types. In the object detection of natural scenes, objects are generally observed from the horizontal view angle and labeled as horizontal bounding boxes. Aerial images are typically taken from a bird’s eye view, such as DOTA [5] as shown in Figure 1 and HRSC2016 [6], which means that the objects are often small in size and arbitrary oriented.
Specifically, the challenges in object detection in aerial images are analyzed with respect to the following:
Scale variations. Due to the spatial resolutions of sensors, the size of objects in aerial images is often small. Furthermore, there are shape variations within the objects of the same category, which causes scale variations problems in detection.
Dense targets. It is typical that some targets in aerial images are densely arranged, such as ships in a harbor or vehicles in a parking lot. Dense scenes require methods to extract distinguishing features to identify each target.
Arbitrary orientations. Objects in natural scenes are generally oriented upward, while objects in aerial images are often oriented arbitrarily.
In addition, some real-time detection scenarios illustrate difficulties in aerial images. For example, detection of embedded devices on UAVs (Unmanned Aerial Vehicles) or satellites brings about challenges in that computational complexity must be taken into consideration, so that calculations are less time-consuming.
In general, methods for object detection can be divided into two categories, namely two-stage methods and one-stage methods, which are usually judged by whether they regress objects directly or refine the detection results step by step.
Benefiting from the work of R-CNN [7], some studies propose outstanding two-stage oriented object detectors (RRPN [8], TextBoxes++ [9], RoITrans [10], SCRDet [11] FOTS [12], etc.), which have achieved great performances with aerial images such as the DOTA dataset or on natural scene-text detection such as MSRA-TD500.
However, their higher computational complexity may not allow for the required efficiency of real applications. Hence, some one-stage detectors [2,4,13,14] have been put forward to exploit the strength of fully convolutional layers (FCN) and feature pyramid networks (FPN) [15]. TextBoxes++ [9] effectively utilizes multi-layer features to detect orientated scene text. However, there still exists the feature misalignment question between the receptive field and objects.
To approach the questions of anchor-based methods outlined above, some one-stage anchor-free methods (CornerNet [16], ExtremeNet [17], CenterNet [18], FCOS [19], FoveaBox [20], etc.) have been shown to detect horizontal objects by key points detection or per-pixel prediction and have achieved extremely promising performance. Some studies have managed to detect orientated objects in such an anchor-free fashion. By the power of the deep neural network, these anchor-free methods have shown potential in the trade-off between computational complexity and performance.
In this paper, we propose a new one-stage anchor-free orientated objects detector for aerial images. The method works in a per-pixel prediction fashion to predict the axis of objects, which is the line that connects the head and tail of the objects, while their width is vertical to the axis. In addition, a new aspect-ratio-aware orientation centerness (OriCenterness) method is proposed to better weigh the importance of positive pixel points so as to guide the network to distinguish foreground objects from a complex background. The proposed method was evaluated on the public aerial images datasets DOTA [5] and HRSC2016 [6], achieving better performance compared to most other one-stage methods and many two-stage anchor-based detectors. It shows potential to be applied in real-time detection situations with less computational complexity compared with anchor-based methods. Our contributions are as follows:
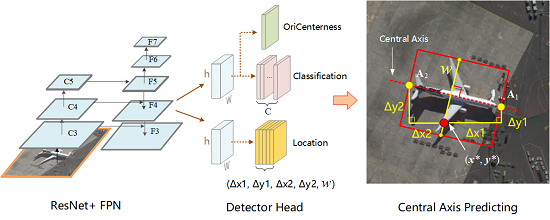
  • We propose a new one-stage anchor-free detector for orientated objects, which locates objects by predicting their axis and width. This detector not only simplifies the format of detection but also avoids elaborating hyperparameters, and reduces the computational complexity compared with anchor-based methods.
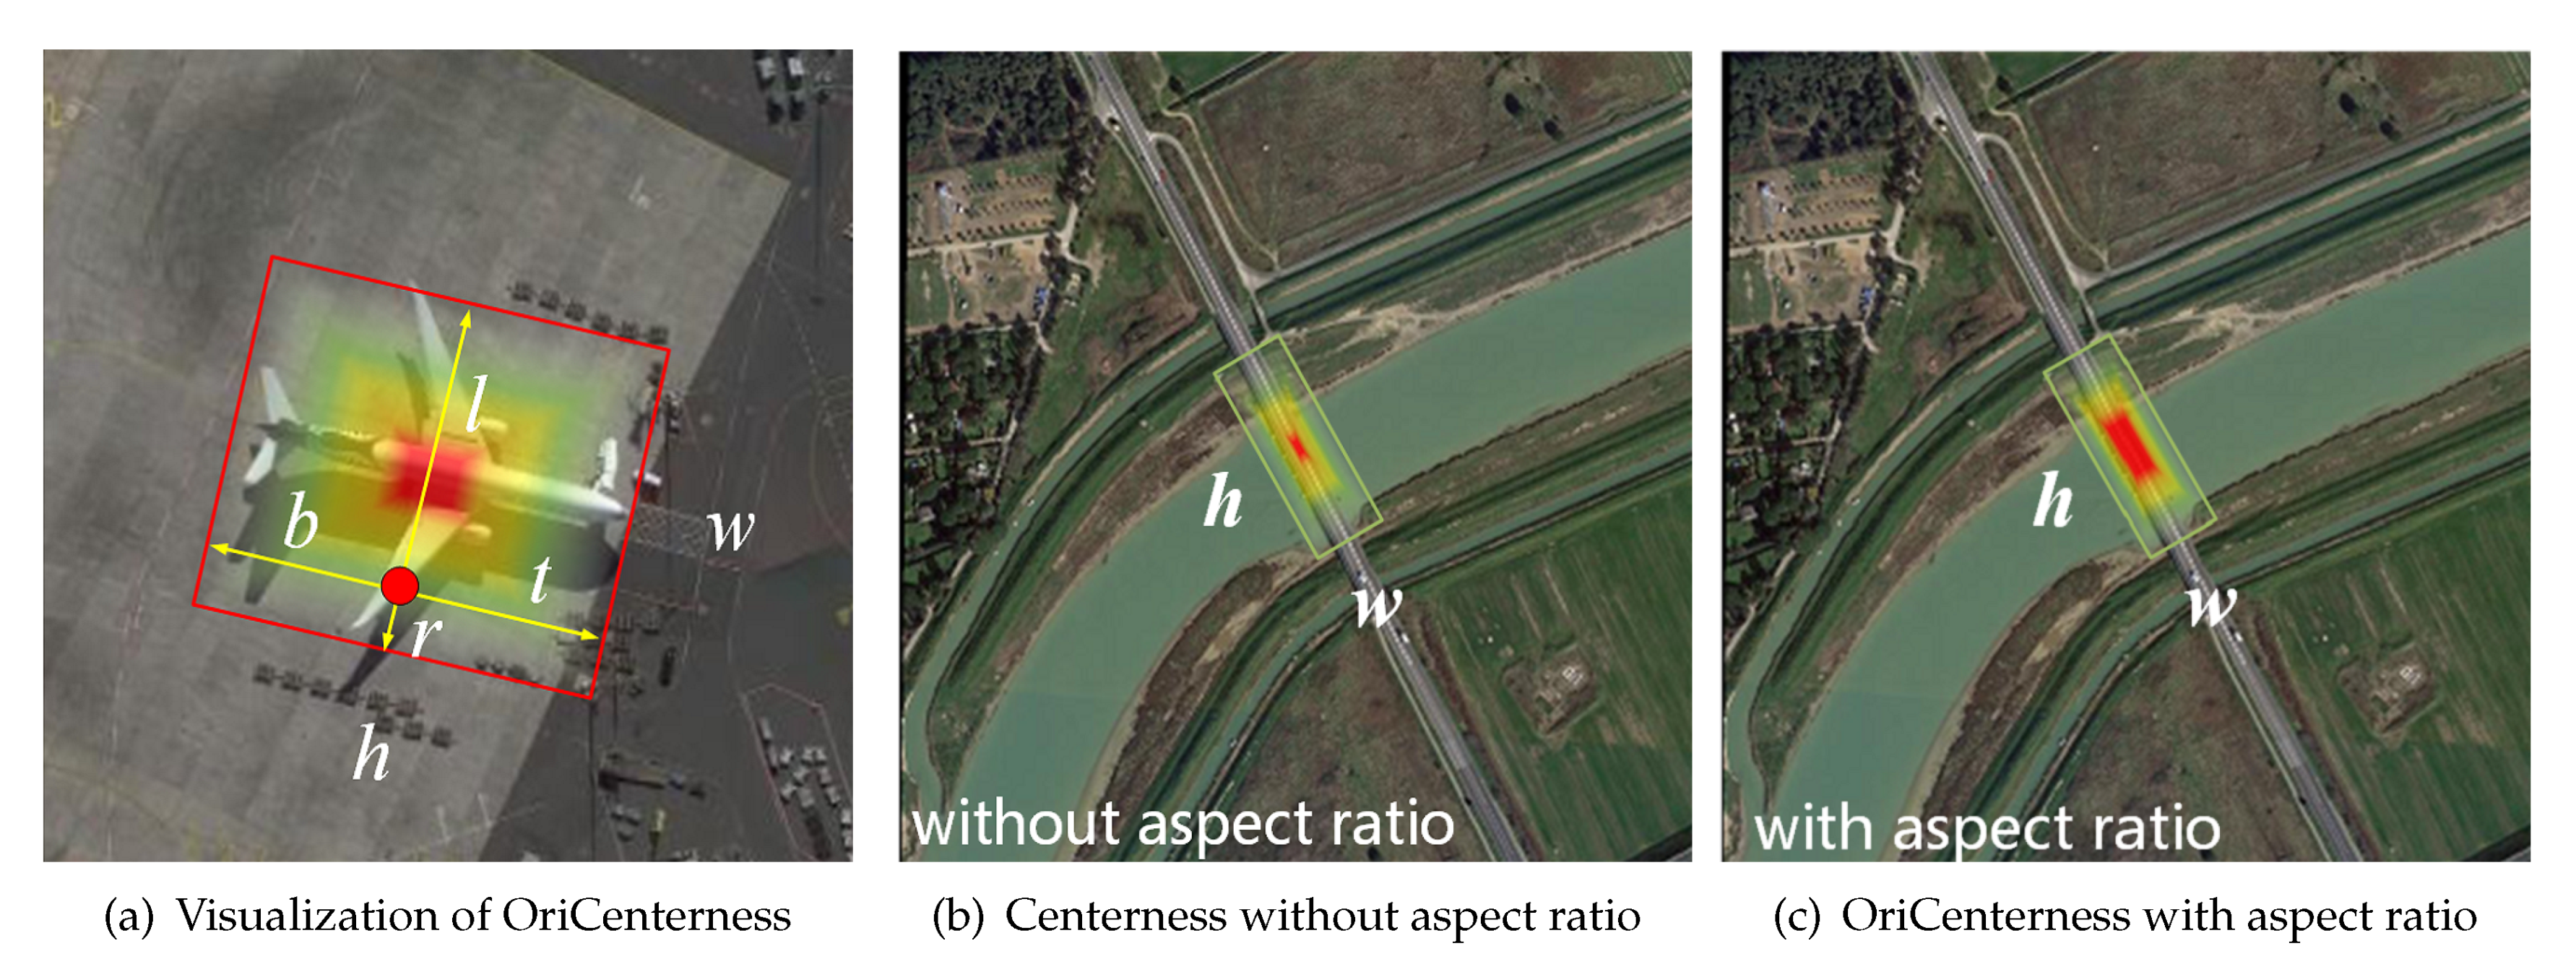
  • We design a new aspect-ratio-aware orientation centerness method to better weigh the importance of positive pixel points in different scale and aspect ratio labeled boxes, thus the method is able to learn discriminative features to distinguish foreground objects from a complex background.

2. Materials and Methods

2.1. Data

  • DOTA [5] is a large dataset for both horizontal and orientated object detection in aerial images. The dataset contains 2806 aerial images with different sensors, resolutions, and perspectives. Image size ranges from around 800 × 800 to 4000 × 4000 pixels. The dataset consists of 15 categories of objects and 188,282 instances total, including Plane, Ship, Bridge, Harbor, Baseball Diamond (BD), Ground Track Field (GTF), Small Vehicle (SV), Large Vehicle (LV), Tennis Court (TC), Basketball Court (BC), Storage Tank (ST), Soccer Ball Field (SBF), Roundabout (RA), Swimming Pool (SP), and Helicopter (HC). Each instance’s location is annotated by a quadrilateral bounding box, which can be denoted as four vertices ( x 1 , y 1 , x 2 , y 2 , x 3 , y 3 , x 4 , y 4 ) , and the vertices are arranged in a clockwise order. The dataset consists of training, validation and testing sets. We used both the training and validation sets for training, with 1869 images totally. We divided the images into subimages with 800 × 800 sliding windows and 200 pixel overlaps, and no data augmentation is undertaken. Finally, we tested on the testing set by submitting detection results to the DOTA evaluation server.
  • HRSC2016 [6]. The dataset was collected from Google Earth, and contains 1061 images with 26 categories of ships with large varieties of scale, position, rotation, shape, and appearance. The image size ranges from 300 × 300 to 1500 × 900, and most of them are greater than 1000 × 600. Following Liu et al. [21], we excluded submarines, hovercrafts, and those annotated with a “difficult” label. Then, the training, validation, and testing datasets contain 431, 175, and 444 images, respectively, and the images are resized to 800 × 800 with no data augmentation. The detection tasks in HRSC2016 include three levels, namely the L1, L2 and L3 tasks, and, for fair comparison, following Liu et al. [6] and Ding et al. [10], we evaluated the proposed method on the L1 task.
    Description of DOTA and HRSC2016 datasets is shown as Table 1.

2.2. Related Work

2.2.1. Anchor-Based Detector

Faster R-CNN [1] first introduces the concept of the anchor, which is a series of predefined boxes to enumerate the possible locations and shapes of objects. For horizontal anchor-based object detection, every pixel point in one feature map will have several anchors with different sizes, shapes, and ratios. An anchor box locating in a pixel point can be defined as ( a x , a y , a w , a h ) in the input image scale, where ( a x , a y ) denotes the coordinate of the anchor’s center and ( a w , a h ) denotes the anchor’s width and height. A target box is defined as ( t x , t y , t w , t h ) in the input image scale, where ( t x , t y ) is the target box’s center and ( t w , t h ) is the target’s width and height. If there is an intersection between the target and the anchor box, and the intersection-over-union (IOU) is greater than a predefined threshold, such as 0.5, the anchor will be positive and responsible for fitting the target. Then, the target values that the network needs to learn are converted from absolute values ( t x , t y , t w , t h ) to relative values ( Δ x , Δ y , Δ w , Δ h ) , which are generalization offsets between the target and the anchor [1,4,13]. Hence, the network can be optimized stably by this relative prediction. In general, anchor-based detectors can be divided into two categories, namely two-stage and one-stage methods, usually judged by whether they regress objects directly or refine the detection result step by step.
Two-stage detectors [1,7,22,23,24] usually use RPN to generated regional proposals coarsely based on anchors in the first stage, and then extract features within the region proposal by the ROI pooling layer. Finally, they locate and classify objects precisely by applying fully convolutional layers to the features extracted. To utilize the strength of RPN architecture for orientated object detection, RRPN [8] proposes the Rotated Region Proposal (R-RoI) adding angle information to a conventional RPN, and it also proposes a rotated ROI Pooling layer to extract orientated features. They enumerate considerable anchors with different shapes, scales, and orientations to fit a variety of orientated objects, which represents significant computation complexity during the training stage. RoITrans [10] builds a learnable module that can transform horizontal ROIs to rotated ROIs, which avoids designing a lot of rotated anchors for oriented object detection and speeds up the training stage. Considering the importance of multi-layer features and the spatial context around objects for detection in aerial images, SCRDet [11] and CAD-Net [25] integrate multi-layer features and utilize global and local contexts of objects to guide the network to focus on more informative regions and features.
One-stage detectors are different from two-stage detectors. The methods in [2,4,13,26] regresss objects from anchors to results directly. In a way, one-stage detectors can be considered as an RPN architecture without ROI pooling layers. With the same principle as RPN, they predict an object’s center, width, and height by regressing the residual between anchors and objects. Some one-stage detectors [9,27] have been put forward to predict orientated boxes. TextBoxes++ [9] proposes a new method to effectively utilize multi-layers features based on SSD, which detects orientated scene text by predicting the offset between an anchor box’s vertices to an object’s quadrilateral. Noticing that there is feature misalignment between anchors and objects, R3Det [27] designs a feature refinement module based on RetinaNet [4] to improve the detection performance by extracting more accurate features. Although these anchor-based detectors have achieved great performance in orientated detection, they need elaborate hyperparameters related to considerable predefined anchors, and take a lot of computing time during the training stage. Therefore, we propose a one-stage anchor-free detector for orientated objects, which locates objects by predicting the axis and width of them in per-pixel prediction fashion with less computational complexity.

2.2.2. Anchor-Free Detector

Recently, some anchor-free detectors [16,17,18,19,20,28] have managed to make the most of the fully convolutional network (FCN) to detect objects. Anchor-free methods detect objects without the process of anchor matching and computation of RPN architecture. They detect objects directly in a per-pixel fashion, which predicts whether a pixel point is positive and the offset values to the object’s box, or predict which pixel point is a key point such as the corner point, center point, and extreme point. In general, anchor-free methods can be divided into two categories: key points detectors and per-pixel fashion detectors.
Key points detectors for horizontal objects, such as cornerNet [16], ExtremeNet [17], and CenterNet [18], share a common solution: locating horizontal objects by detecting associated key points, such as the corner points, extreme points, or center points of objects. CornerNet [16] detects an object bounding box by predicting whether the top-left corner and the bottom-right corner are a pair of key points, and introduces corner pooling, a new type of pooling layer that helps the network better localize corners. It calculates embeddings for each corner, and groups two corresponding corners into a box if the embedding of them is similar. ExtremeNet [17] detects four extreme points (top-most, left-most, bottom-most, and right-most) and one center point of objects using a key point estimation network. It groups the five key points into a valid bounding box if the predicting score of the box’s center is greater than a threshold. CenterNet [18] models an object as the center point of its bounding box. The method uses key point detection to detect center points and regresses other object properties, such as size, 3D location, orientation, and even pose. Inspired by CenterNet [18], O2-DNet [29] proposes a novel form to detect orientated objects called the oriented objects detection network. The method detects oriented objects by predicting a pair of middle lines inside each target, and uses key point detection to locate the intersection point of each pair of median lines.
Per-pixel fashion detectors for horizontal objects, such as FCOS [19] and FoveaBox [20] detect the box, classes, and corresponding confidence for each pixel point. If the confidence for a pixel point is greater than a threshold, then the prediction is positive. FCOS [19] detects an object’s box by predicting distances of pixel points to four sides of the horizontal box, and the method also introduces a novel weighting method, centerness, to weigh the importance of the positive pixel points, in order to guide the network to learn discriminative features to distinguish foreground objects from a complex background. FoveaBox [20] locates the bounding box by predicting the top-left coordinate and the bottom-right coordinate of the box directly, and learns the object existence possibility. To choose a positive pixel point, the method shrinks the original bounding box to a shrunk box, and, if a pixel point is inside such a shrunk box, it is considered to be positive. These anchor-free methods have shown extreme potential in the trade-off between computational complexity and performance. Some studies have implemented orientated object detection in such an anchor-free fashion. EAST [30] proposes an anchor-free orientated scene text detector at an early stage, which generates positive samples by a shrunk area related to the original labeled box. The method locates the orientated box by predicting four distances of each pixel point to the orientated box boundaries and the angle information. IENet [31] proposes a concise detection head for aerial image orientated objects. This method obtains an orientated box by learning two shift values from a horizontal box prediction.

2.3. Method

Our proposed detector is a one-stage anchor-free detector in the per-pixel prediction fashion. As shown in Figure 2, ResNet [32] with the Feature Pyramid Network (FPN) [15] is adopted as the backbone network. There are three subnetworks for OriCenterness, classification, and location prediction in the detection head of each feature map. Then, arbitrary orientated objects are detected by predicting the axis and width of objects.

2.3.1. Network Architecture

We adopt ResNet [32] with Feature Pyramid Network (FPN) [15] as the backbone network to learn deep features and scale variations for orientated objects in aerial images, In Figure 2, { C l } are feature maps generated from ResNet, where l = 3 , 4 , 5 denotes the feature level, and C l has a stride of 2 l and is 1 / 2 l resolution of the input image size W × H . Then, FPN constructs a top-down architecture with lateral connections, which builds an in-network feature pyramid from a single scale input image [20]. Therefore, the features at all scales have rich semantic information, and each of them can be used for detecting objects. Five levels of feature maps { F l } are used to detect objects, where l = 3 , 4.7 denotes the number of feature levels, as shown in Figure 2. The feature map F l has a stride of 2 l and is 1 / 2 l resolution of the input image size W × H . Then, three subnetworks are applied for each feature map generated from FPN. The location subnetwork is responsible for the rotated bounding box localization. The number of output channels is five, namely ( Δ x 1 , Δ y 1 , Δ x 2 , Δ y 2 , w ) , and contain the information of the axis and width. The classification subnetwork is used for performing classification of the corresponding position in the location subnet, and the output channel is C, which is equal to the number of classes. The third subnetwork predicts the confidence of the location and classification generated from the above subnets. The number of output channels is 1. Each subnetwork shares parameter weights among all feature levels, and the network can better learn scale variations [19].

2.3.2. Axis Predicting

For an aerial image, the ground-truths of targets are defined as { B k } , where B k = ( x 0 , y 0 , x 1 , y 1 , x 2 , y 2 , x 3 , y 3 , c ) , and ( x 0 , y 0 ) , , ( x 3 , y 3 ) denote the four vertices of the kth target, as shown in Figure 1. They are arranged in a clockwise order, and ( x 0 , y 0 ) is the start point which denotes the top left corner of the oriented box. c is the classification of the target and C is the number of classes.
Therefore, the axis for kth target can be determined by the two yellow points, as shown in Figure 2, defined as A 1 = ( A x 1 , A y 1 ) , A 2 = ( A x 2 , A y 2 ) , such as the front-end of the car, and it can be formulated as Equation (1).
A x 1 = x 1 + x 2 2 A y 1 = y 1 + y 2 2 A x 2 = x 3 + x 4 2 A y 2 = y 3 + y 4 2
Here, the pair A 1 , A 2 can determine the length and tilt direction of the axis, namely the object’s length and orientation. Then, w is defined as the object’s width, which is equal to the length of the object’s side whose direction is vertical to the axis. Hence, an arbitrarily orientated object can be determined by the axis and width ( ( A x 1 , A y 1 ) , ( A x 2 , A y 2 ) , w )
This anchor-free method predicts objects in the pixel-level of feature maps directly. Therefore, a pixel point at location ( x , y ) on feature map F l can be defined as P x y l = ( x , y ) , where x = 0 , 1 , , W / 2 l 1 and y = 0 , 1 , , H / 2 l 1 stand for the column and row location on the feature map, respectively. Using P x y l * = ( x * , y * ) as the pixel point on the input image scale mapped from P x y l , the map function is:
x * = 2 l ( x + 0.5 ) y * = 2 l ( y + 0.5 )
For the pixel point ( x , y ) on F l , if its mapped point ( x * , y * ) is inside the kth object, its coordinate distances ( Δ x 1 , Δ y 1 , Δ x 2 , Δ y 2 ) to end points A 1 , A 2 , as shown in Figure 2, can be calculated as follows:
Δ x 1 = A x 1 x * Δ y 1 = A y 1 y * Δ x 2 = A x 2 x * Δ y 2 = A y 2 y *

2.3.3. Pixel Point Assignment

Analogous to the anchor-based method that needs to decide whether an anchor box is positive or negative for training, which is usually judged by an IOU threshold, a principle is also needed to decide whether the pixel point P x y l is positive, negative, or should be ignored during the training stage. We approach this problem by setting regression limits for pixel points on each feature level.
We first calculate the straight-line distances d 1 , d 2 of P x y l to the kth target’s axis end points A 1 , A 2 , if the P x y l is in the target. Distances calculation is according to Equation (4).
d 1 = Δ x 1 2 + Δ y 1 2 d 2 = Δ x 2 2 + Δ y 2 2
Then, a valid range [ v 1 , v 2 ] is set for each feature level, and the value of v 1 and v 2 is constructed as [20]. Hence, if P x y l is inside B k and m a x ( d 1 , d 2 ) of P x y l is inside range [ v 1 , v 2 ] , this pixel point is positive; otherwise, it is negative during the training stage. The principle can be formulated as follows:
P x y l i s p o s i t i v e + v 1 m a x ( d 1 , d 2 ) v 2 , a n d P x y l i s i n s i d e t a r g e t . n e g a t i v e o t h e r s .
In addition, the ambiguous question of overlap conditions must be taken into consideration for such per-pixel prediction, as a pixel point may be inside two orientated objects at the same time, as shown in the bottom left of Figure 1. Those ships are inside the harbor, thus pixel points inside some ships fall into the harbor too. Our approach is that a pixel point in several objects will only be responsible for the object with the smallest area.
For a positive pixel point, its classification target is b c and its localization targets are ( Δ 1 , Δ 2 , Δ 3 , Δ 4 , Δ w ) , which are normalized values and can be calculated with Equation (6).
Δ 1 = Δ x 1 z 3 Δ 2 = Δ y 1 z 3 Δ 3 = Δ x 2 z 3 Δ 4 = Δ y 2 z 3 Δ w = w z 3
Here, z = 2 l + 1 denotes the normalization factor and can project the target value from the source space to the target space centered around 1, and the targets are regularized with the cube root function, which makes it easier and more stable to optimize the training loss.

2.3.4. Aspect-Ratio-Aware Orientation Centerness

Compared with anchor-based detectors, which acquire appropriate anchors by filtering with IOU, the proposed method may propose many positive but low-quality pixel points. In general, a pixel point located on the edge of the object box is considered less significant than a point in the box’s center during the training stage [19,20]. FCOS [19] deals with this question by introducing the centerness weighting method for natural scene image detection. However, there are many large aspect ratio objects in aerial images, and the centerness in such objects drops sharply from the object’s center to edge. Hence, we propose aspect-ratio-aware orientated centerness (OriCenterness) as Equation (7) to weigh the importance of positive pixels in orientated objects as shown in Figure 3. OriCenterness is the product of a pixel point’s offset degree from the object’s center with the aspect ratio factor. The former can weigh the pixel point from the biggest value 1 to the smallest value 0 according to its distance to the four sides of the orientated box. The aspect ratio factor R k can mitigate the above question. OriCenterness can be calculated by Equation (7).
O r i C e n t e r n e s s = R k × min ( t , b ) × min ( l , r ) max ( t , b ) × max ( l , r )
where R k = m a x ( w , h ) m i n ( w , h ) 3 is the kth object aspect ratio’s cube root, and it’s value is greater than or equal to 1, and the cube root function is adopted to mitigate the zoom effect. Then, we limit the OriCenterness value between 0 and 1. In the training stage, classification loss and regression loss will multiply the true OriCenterness, and the centerness subnet will regress the true value and filter out objects with high confidence during inference stage.
In the inference stage, detection heads on each feature level generate the location, classification, and OriCenterness prediction for each pixel point. We find positive predictions considering both classification and OriCenterness by a multiplication of them and then filtering by a threshold of 0.05 to get positive proposals, which indicates a background prediction or a positive prediction. Then, an NMS with rotated IOU [8] calculation is applied to these orientated proposals to filter out the best result. Finally, we can get the true box transformed from the prediction according to Equation (6).

2.3.5. Loss

Our loss function consists of three parts: regression loss, classification loss, and centerness loss. Regression loss and centerness loss are calculated for positive pixel points. Classification loss is calculated over all locations on feature maps. Training loss can be formulated as follows:
L = 1 N p o s 𝟙 { p o s i t i v e } O r i C e n t e r n e s s · L r e g + λ N p o s O r i C e n t e r n e s s · L c l s + μ N p o s 𝟙 { p o s i t i v e } · L c e n t e r
N p o s indicates the number of positive target in the ground truth. λ , μ are the balance factors for L c l s and L c e n t e r . 𝟙 { p o s i t i v e } is the indicator function: if the pixel point is positive, then 𝟙 { p o s i t i v e } = 1 and its regression and centerness losses will be calculated as in Section 2.3.3.
Here, L r e g denotes the coordinate regression loss, and Smooth-L1 loss [33] is adopted as the loss function as Equation (9), where Δ i , i = 1 , 2 , 3 , 4 , w are regression targets and Δ i p r e d , i = 1 , 2 , 3 , 4 , w are predicted values. β is the hyperparameter of the Smooth-L1 loss function.
L r e g = 0.5 ( Δ i Δ i p r e d ) 2 Δ i Δ i p r e d β , i = 1 , 2 , 3 , 4 , w Δ i Δ i p r e d 0.5 β o t h e r s .
L c l s denotes classification loss, and focal loss [4] for multi-class is adopted as the loss function as Equation (10), where c l s is the number of classes, p c is the predicted class value after the sigmoid function and if the ground truth’s label is equal to c then 𝟙 { l a b e l = c } = 1 . α and γ are hyperparameters of focal loss.
L c l s = c = 0 c l s 1 𝟙 { l a b e l = c } ( α ( 1 p c ) γ l o g ( p c ) ) + ( 1 𝟙 { l a b e l = c } ) ( α p c γ l o g ( 1 p c ) )
L c e n t e r denotes centerness loss, and Binary Cross Entropy (BCE) is adopted as the loss function. y is the target centerness and p is the predicted centerness.
L c e n t e r = y l o g ( p ) ( 1 y ) l o g ( 1 p )

2.3.6. Implementation Details

The code of the proposed method was implemented with PyTorch [34] and based on FCOS [19] and RRPN [8] project. We adopted ResNet-101 [32] as the backbone network with initialization of the pretrained model, and trained the network on two Nvidia TITAN Xp GPUs with 12G memory, a batchsize of six, and three images per GPU. Stochastic gradient descent (SGD) was used to train the network for 80 k iterations on DOTA and 30 k on HRSC2016. Weight decay and momentum were 0.001 and 0.9, respectively. The learning rate was initialized at 0.001, and reduced by a factor of 10 at the 60 K and 70 k learning rate decay steps for DOTA and 10 k and 20 k for HRSC2016. α , γ , β , λ , and μ in Section 2.3.5 were set as 0.5, 2.0, 1./9, 2, and, respectively. γ were β were set as the default values, and α , λ , and μ were set at empirical values to balance different kinds of loss. In the inference stage, the confidence threshold was 0.05, and a prediction was positive if the multiplication of classification and orientated centerness was greater than the threshold. Then, a rotated non-maximum suppression (NMS) with a threshold of 0.05 was applied to the results for post processing. Mean Average-Precision (mAP) was adopted to evaluate the performance of the orientated object detectors.

3. Results

In this section, we first compare the proposed method with several published one-stage and two-stage orientated detectors separately, as shown in Table 2 and Table 3. The results in Table 2 show that our method performs better than those one-stage anchor-based orientated detectors based on SSD [2], YOLO [35], or RetinaNet-R [4]. When compared with the one-stage anchor-free detector IENet, our method outperforms the method by 8.84% according to mAP. The best performance was achieved on Ground Tracked (GTF), Small Vehicle (SV), Ship, Storage Tank (ST), Roundabout (RA), and Swimming Pool (SP) by our method. Visualization of detection results on DOTA are given in Figure 4.
We also compared the proposed method with several two-stage orientated detectors, as shown in Table 3. The results in Table 3 show that our method performs better than many two-stage anchor-based methods such as FR-O [5], R-DFPN [36], R 2 CNN [37], and RRPN [8] according to mAP. Although the method cannot achieve as good performance as some two-stage anchor-based detectors such as ICN [38] and RoI Transformer [10], it still performs better in 6 of 15 categories (Baseball Diamond (BD), Small Vehicle (SV), Large Vehicle (LV), Ship, Storage Tank (ST), and Swimming Pool (SP)) than ICN and 4 of 15 categories (Basketball Court (BC), Storage Tank (ST), Roundabout (RA), and Swimming Pool (SP)) than RoI Transformer.
We also evaluated the proposed method on the HRSC2016 dataset, and compared it with several two-stage anchor-based and one-stage anchor-free orientation detectors, as shown in Table 4. The method without OriCenterness could achieve 73.91% according to mAP and 78.15% after adding OriCenterness, and comparisons show that our method performs better than some two-stage anchor-based methods such as BL2 [21] and R 2 CNN [37]. When compared with a one-stage anchor-free detector such as IENet, our method outperforms the method by 3.14% according to mAP. In addition, there is a 4.24% increase in performance after using OriCenterness, as shown in Table 4. Visualization of the detection results on HRSC2016 are given in Figure 5.

4. Discussion

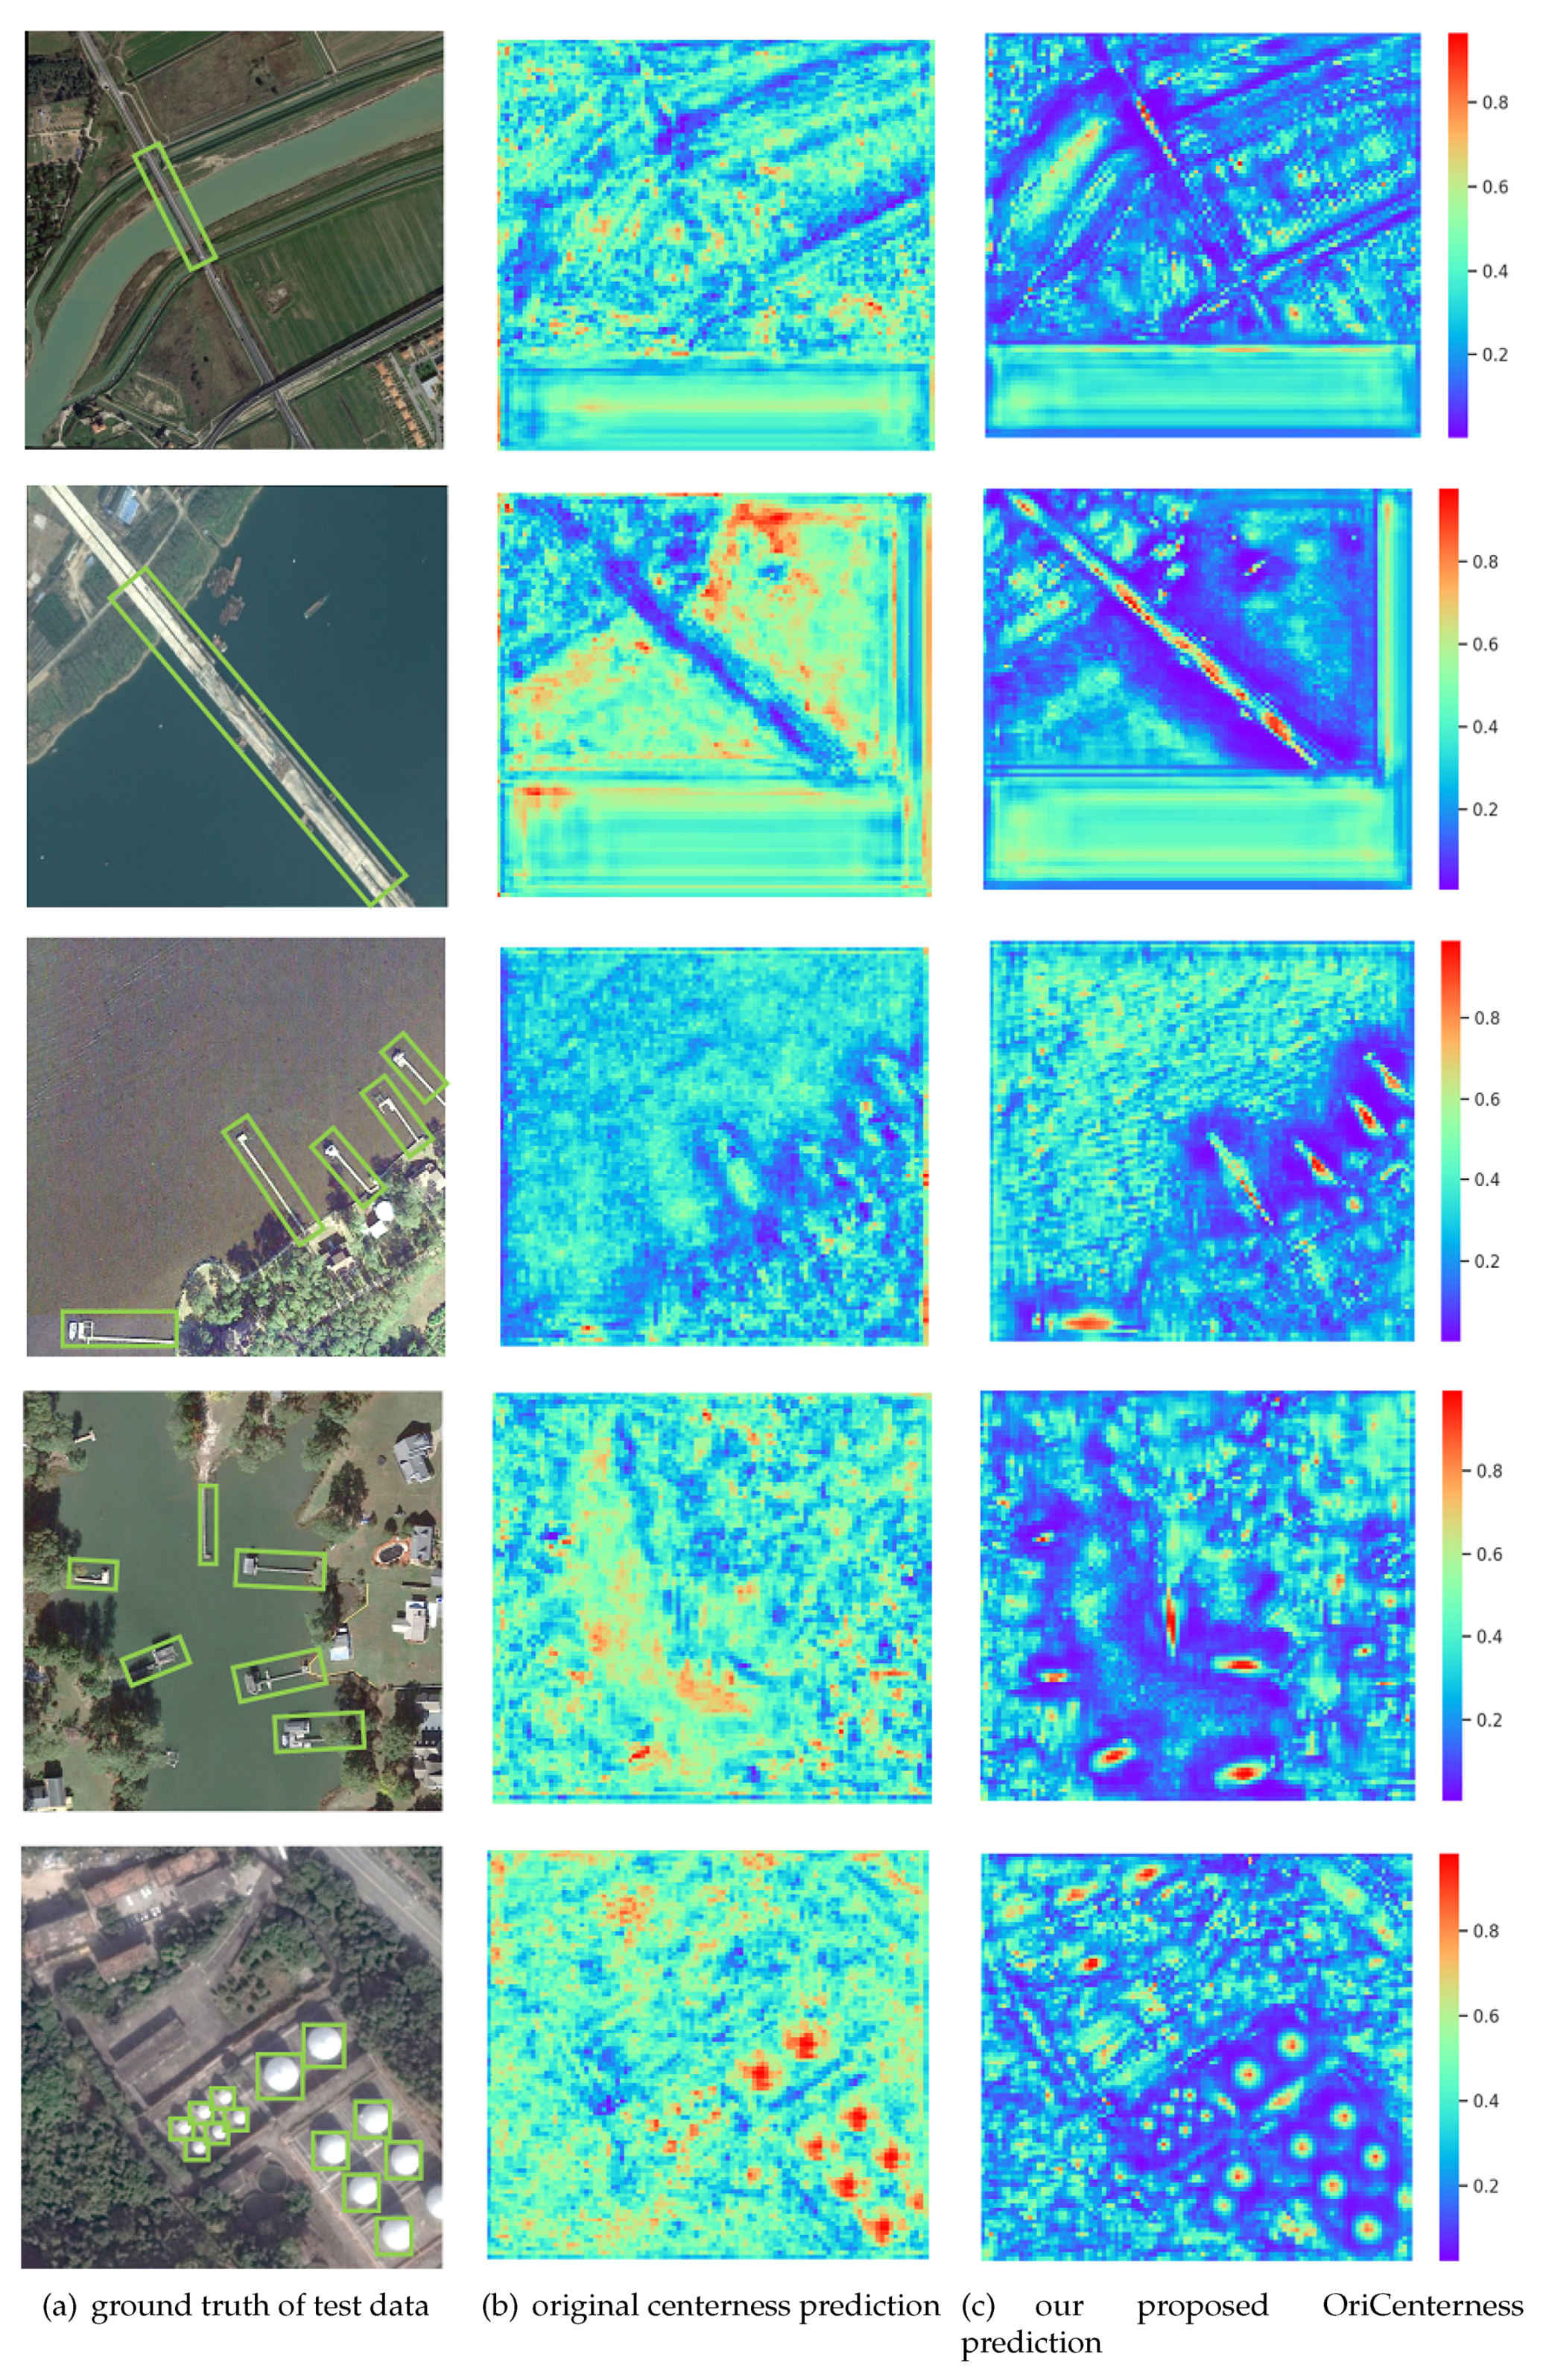
4.1. Effectiveness of OriCenterness

As discussed in Section 2.3.4, OriCenterness is able to alleviate the problem where original centerness drops sharply from the target’s center to the edge for large aspect ratio objects, and OriCenterness can better weigh the importance of positive pixel points to guide the network to learn discriminative features. We conducted an ablation study on DOTA to prove the effectiveness of OriCenterness. As shown in Table 5, the checkmark in the OriCenterness column denotes we adopted OriCenterness, and the short dash denotes that we adopted the transformation of original centerness as [19], which is adapted to orientated objects. The results show that there is a 3.76% increase in mAP after using OriCenterness for the ResNet50 backbone. When the backbone is ResNet101, there is a 0.48% increase in mAP after using OriCenterness. For the objects such as bridge, harbor, and some ships, whose aspect ratios are usually large, there is a substantial increase in performance.
Furthermore, we visualize the prediction of OriCenterness and original centerness on test set of DOTA in Figure 6. The first column is images of bridge, harbor, and storage tank from the testing data with their ground truth. The second column is visualization of original centerness adapted for orientated objects. The third column is our proposed OriCenterness visualization. Prediction results are both taken from F3 in ResNet-101 FPN architecture with a resolution of 100 × 100, and the value is from 0 to 1. The higher is the value, the closer it is to red. The result in figure shows that our network with OriCenterness is able to learn more explicit significance for pixel points to distinguish the foreground and background compared with original centerness adapted for orientated objects. Not only objects with large aspect ratio such as bridge and harbor can obtain a more significant prediction, but also the centerness prediction for some square objects such as the storage tank is more significant.

4.2. Speed–Accuracy Trade-Off

Speed–accuracy trade-off results for our method on DOTA are shown in Table 6. The results show that the proposed method could achieve a 2% improvement after substituting Resnet50 with the Resnet101 backbone network, while there is almost no additional computation consumption during the inference stage. Results of other methods tested on different devices are also listed in Table 6. For the two-stage anchor-based detector R3Det, its inference speed is 4 fps on 2080Ti gpu, while the proposed method is 14 fps on Titan Xp whose performance is inferior to 2080Ti. For one-stage anchor-free detector IENet, although there are advantages for the method according to inference speed, our method outperforms the method by 8.8% according to mAP.

4.3. Advantages and Limitations

For anchor-based orientated detectors such as RetinaNet-R, hyperparameters relevant to anchors include the anchor base size, ratio, scales per feature level, angle, and foreground and background IOU thresholds. To fit as many different orientated objects as possible, the number of predefined anchors ranges from 45 (3 scales × 3 ratios × 5 angle) to 105 (3 scales × 5 ratios × 7 angle) on each pixel point of one feature level, and there are about 600,000 to 1,400,000 anchors total for an 800 × 800 input image resolution. Then, the IOU between each anchor with each target will be calculated during the training stage. Some exploratory experiments on the RetinaNet-R method for the DOTA dataset indicated that these hyperparameters of anchors are sensitive to the detection performance. For example, minor changes in the anchor base size and number of scales could bring about a 7% improvement according to mAP.
In contrast, the proposed anchor-free detector does not need to set such elaborate anchors. The results in Table 2, Table 3 and Table 4 show that this anchor-free method could achieve a competitive performance according to mAP compared with anchor-based methods, on the DOTA and HRSC2016 datasets. When the proposed method is compared with other methods, it was found that a better performance can be achieved on Storage Tank (ST), Roundabout (RA), and Swimming Pool (SP). The similarity of these categories is their shapes are circle or square, and this is likely to cause the boundary discontinuity of the rotation angle, such that the angle may change from 0 ° to 90 ° abruptly for anchor-based methods. This may cause unstable optimization during the training stage [11]. We solved this question by predicting the axis, which is determined by label information specifically, and we avoided predicting the target angle explicitly.
There are also some limitations of this method. Firstly, the axis learning relies on high quality label data, which requires labeled vertices of oriented boxes are arranged in a clockwise order, with the first labeled point being the top left corner of the box. However, there is no guarantee that all images will be well labeled, and in fact, there are some noise labels within the DOTA dataset, whose top left corners are not the first point. We have added some data calibration in the data preprocess stage, and found that it could bring about 3% improvement according to mAP. On the one hand, additional information such as the center coordinate or angle of the label could be considered to be introduced to calibrate the noise data. On the other hand, we are going to apply the method to natural scene object detection. Further, there are deficiencies of the proposed method according to mAP compared with other state-of-the-art orientated detectors. We will aim to be less dependent on high quality label data and continue to improve the method in future.

5. Conclusions

In this paper, we propose an effective one-stage anchor-free detector for aerial images. We conducted several experiments on the DOTA and HRSC datasets to prove the effectiveness of one-stage anchor-free detection. The results show that our method achieves a better performance according to mAP compared with most of other one-stage orientated detectors, as well as many two-stage anchor-based orientated detectors, with fewer hyperparameters. The speed-accuracy trade-off results show that the proposed method is more computationally efficient compared with some anchor-based methods, which shows the potential of the method to be applied in real-time detection, such as real-time inference on the embedded devices of UAVs or satellites. Further, we propose a new OriCenterness to better weigh positive pixel points to guide the network to learn discriminative features from a complex background, which brings improvements for objects with a large aspect ratio according to mAP. While the method simplifies orientated object detection there are some limitations, such as requirements for high quality label data and deficiencies compared with other state-of-the-art orientated detectors according to mAP. In future work, we will seek to continue to improve the method, and explore the potential of the method in real-time detection applications.

Author Contributions

Conceptualization, Z.X., L.Q., and W.S.; methodology, L.Q.; software, K.W. and X.T.; validation, Z.X. and L.Q.; formal analysis, L.Q.; investigation, Z.X. and L.Q.; resources, Z.X.; data curation, K.W., X.T.; writing—original draft preparation, L.Q.; writing—review and editing, Z.X. and X.T.; visualization, L.Q.; supervision, Z.X. and W.S.; project administration, Z.X.; and funding acquisition, Z.X. and W.S. All authors have read and agreed to the published version of the manuscript.

Funding

This work was supported in part by “Science and Technology Project of State Grid Corporation of China”, No. SGTYHT/18-JS-206.

Acknowledgments

This work was supported by State Grid Corporation of China. The numerical calculations presented in this paper were done on the supercomputing system in the Supercomputing Center of Wuhan University.

Conflicts of Interest

The authors declare no conflict of interest.

References

  1. Ren, S.; He, K.; Girshick, R.; Sun, J. Faster R-CNN: Towards Real-Time Object Detection with Region Proposal Networks. Adv. Neural Inf. Process. Syst. 2015, 39, 91–99. [Google Scholar] [CrossRef] [PubMed] [Green Version]
  2. Liu, W.; Anguelov, D.; Erhan, D.; Szegedy, C.; Reed, S.; Fu, C.Y.; Berg, A.C. Ssd: Single Shot Multibox Detector; Springer: Cham, Switzerland, 2016; pp. 21–37. [Google Scholar]
  3. Redmon, J.; Divvala, S.; Girshick, R.; Farhadi, A. You only Look Once: Unified, Real-Time Object Detection. In Proceedings of the IEEE Conference on Computer Vision and Pattern Recognition, Las Vegas, NV, USA, 26 June–1 July 2016; pp. 779–788. [Google Scholar]
  4. Lin, T.Y.; Goyal, P.; Girshick, R.; He, K.; Dollár, P. Focal loss for dense object detection. In Proceedings of the IEEE International Conference on Computer Vision (ICCV), Venice, Italy, 22–29 October 2017; pp. 2980–2988. [Google Scholar]
  5. Xia, G.S.; Bai, X.; Ding, J.; Zhu, Z.; Belongie, S.; Luo, J.; Datcu, M.; Pelillo, M.; Zhang, L. DOTA: A large-scale dataset for object detection in aerial images. In Proceedings of the IEEE Conference on Computer Vision and Pattern Recognition, Salt Lake City, UT, USA, 18–22 June 2018; pp. 3974–3983. [Google Scholar]
  6. Liu, Z.; Wang, H.; Weng, L.; Yang, Y. Ship Rotated Bounding Box Space for Ship Extraction From High-Resolution Optical Satellite Images With Complex Backgrounds. IEEE Geosci. Remote Sens. Lett. 2016, 13, 1074–1078. [Google Scholar] [CrossRef]
  7. Girshick, R.; Donahue, J.; Darrell, T.; Malik, J. Rich feature hierarchies for accurate object detection and semantic segmentation. arXiv 2013, arXiv:1311.2524. [Google Scholar]
  8. Ma, J.; Shao, W.; Ye, H.; Wang, L.; Wang, H.; Zheng, Y.; Xue, X. Arbitrary-oriented scene text detection via rotation proposals. IEEE Trans. Multimed. 2018, 20, 3111–3122. [Google Scholar] [CrossRef] [Green Version]
  9. Liao, M.; Shi, B.; Bai, X. Textboxes++: A single-shot oriented scene text detector. IEEE Trans. Image Process. 2018, 27, 3676–3690. [Google Scholar] [CrossRef] [PubMed] [Green Version]
  10. Ding, J.; Xue, N.; Long, Y.; Xia, G.S.; Lu, Q. Learning roi transformer for detecting oriented objects in aerial images. arXiv 2018, arXiv:1812.00155. [Google Scholar]
  11. Yang, X.; Yang, J.; Yan, J.; Zhang, Y.; Zhang, T.; Guo, Z.; Sun, X.; Fu, K. Scrdet: Towards more robust detection for small, cluttered and rotated objects. In Proceedings of the IEEE International Conference on Computer Vision, Seoul, Korea, 27 October–3 November 2019; pp. 8232–8241. [Google Scholar]
  12. Liu, X.; Liang, D.; Yan, S.; Chen, D.; Qiao, Y.; Yan, J. FOTS: Fast Oriented Text Spotting with a Unified Network. In Proceedings of the 2018 IEEE/CVF Conference on Computer Vision and Pattern Recognition, Salt Lake City, UT, USA, 18–22 June 2018. [Google Scholar] [CrossRef] [Green Version]
  13. Redmon, J.; Farhadi, A. YOLOv3: An Incremental Improvement. arXiv 2018, arXiv:1804.02767. [Google Scholar]
  14. Zhao, Q.; Sheng, T.; Wang, Y.; Tang, Z.; Chen, Y.; Cai, L.; Ling, H. M2det: A single-shot object detector based on multi-level feature pyramid network. In Proceedings of the AAAI Conference on Artificial Intelligence, Honolulu, HI, USA, 27 January–1 February 2019; Volume 33, pp. 9259–9266. [Google Scholar]
  15. Lin, T.Y.; Dollár, P.; Girshick, R.; He, K.; Hariharan, B.; Belongie, S. Feature pyramid networks for object detection. In Proceedings of the IEEE conference on computer vision and pattern recognition, Honolulu, HI, USA, 21–26 July 2017; pp. 2117–2125. [Google Scholar]
  16. Law, H.; Deng, J. Cornernet: Detecting objects as paired keypoints. In Proceedings of the European Conference on Computer Vision (ECCV), Munich, Germany, 8–14 September 2018; pp. 734–750. [Google Scholar]
  17. Zhou, X.; Zhuo, J.; Krähenbühl, P. Bottom-up Object Detection by Grouping Extreme and Center Points. In Proceedings of the IEEE Conference on Computer Vision and Pattern Recognition, Long Beach, CA, USA, 16–20 June 2019. [Google Scholar]
  18. Duan, K.; Bai, S.; Xie, L.; Qi, H.; Huang, Q.; Tian, Q. Centernet: Keypoint triplets for object detection. In Proceedings of the IEEE International Conference on Computer Vision, Seoul, Korea, 27 October–2 November 2019; pp. 6569–6578. [Google Scholar]
  19. Tian, Z.; Shen, C.; Chen, H.; He, T. FCOS: Fully Convolutional One-Stage Object Detection. arXiv 2019, arXiv:1904.01355. [Google Scholar]
  20. Kong, T.; Sun, F.; Liu, H.; Jiang, Y.; Shi, J. FoveaBox: Beyond Anchor-based Object Detector. arXiv 2019, arXiv:1904.03797. [Google Scholar]
  21. Liu, Z.; Hu, J.; Weng, L.; Yang, Y. Rotated region based CNN for ship detection. In Proceedings of the 2017 IEEE International Conference on Image Processing, Beijing, China, 17–20 September 2017; pp. 900–904. [Google Scholar] [CrossRef]
  22. Cai, Z.; Vasconcelos, N. Cascade r-cnn: Delving into high quality object detection. In Proceedings of the IEEE conference on computer vision and pattern recognition, Salt Lake City, UT, USA, 18–22 June 2018; pp. 6154–6162. [Google Scholar]
  23. Long, Y.; Gong, Y.; Xiao, Z.; Liu, Q. Accurate Object Localization in Remote Sensing Images Based on Convolutional Neural Networks. IEEE Trans. Geosci. Remote Sens. 2017, 55, 2486–2498. [Google Scholar] [CrossRef]
  24. Gong, Y.; Xiao, Z.; Tan, X.; Sui, H.; Xu, C.; Duan, H.; Li, D. Context-Aware Convolutional Neural Network for Object Detection in VHR Remote Sensing Imagery. IEEE Trans. Geosci. Remote Sens. 2020, 58, 34–44. [Google Scholar] [CrossRef]
  25. Zhang, G.; Lu, S.; Zhang, W. CAD-Net: A Context-Aware Detection Network for Objects in Remote Sensing Imagery. IEEE Trans. Geosci. Remote Sens. 2019, 57, 10015–10024. [Google Scholar] [CrossRef] [Green Version]
  26. Zhang, S.; Wen, L.; Bian, X.; Lei, Z.; Li, S.Z. Single-Shot Refinement Neural Network for Object Detection. In Proceedings of the 2018 IEEE/CVF Conference on Computer Vision and Pattern Recognition, Salt Lake City, UT, USA, 18–23 June 2018. [Google Scholar] [CrossRef] [Green Version]
  27. Yang, X.; Liu, Q.; Yan, J.; Li, A. R3Det: Refined Single-Stage Detector with Feature Refinement for Rotating Object. arXiv 2019, arXiv:1908.05612. [Google Scholar]
  28. Zhu, C.; He, Y.; Savvides, M. Feature Selective Anchor-Free Module for Single-Shot Object Detection. In Proceedings of the 2017 IEEE International Conference on Image Processing (ICIP), Beijing, China, 17–20 September 2019. [Google Scholar]
  29. Wei, H.; Zhou, L.; Zhang, Y.; Li, H.; Guo, R.; Wang, H. Oriented Objects as pairs of Middle Lines. arXiv 2019, arXiv:1912.10694. [Google Scholar]
  30. Zhou, X.; Yao, C.; Wen, H.; Wang, Y.; Zhou, S.; He, W.; Liang, J. EAST: An Efficient and Accurate Scene Text Detector. In Proceedings of the 2017 IEEE Conference on Computer Vision and Pattern Recognition (CVPR), Honolulu, HI, USA, 21–26 July 2017. [Google Scholar] [CrossRef] [Green Version]
  31. Lin, Y.; Feng, P.; Guan, J. IENet: Interacting Embranchment One Stage Anchor Free Detector for Orientation Aerial Object Detection. arXiv 2019, arXiv:1912.00969. [Google Scholar]
  32. He, K.; Zhang, X.; Ren, S.; Sun, J. Deep Residual Learning for Image Recognition. In Proceedings of the 2016 IEEE Conference on Computer Vision and Pattern Recognition (CVPR), Las Vegas, NV, USA, 27–30 June 2016. [Google Scholar] [CrossRef] [Green Version]
  33. Girshick, R. Fast R-CNN. In Proceedings of the 2015 IEEE International Conference on Computer Vision (ICCV), Santiago, Chile, 7–13 December 2015. [Google Scholar] [CrossRef]
  34. Paszke, A.; Gross, S.; Massa, F.; Lerer, A.; Bradbury, J.; Chanan, G.; Killeen, T.; Lin, Z.; Gimelshein, N.; Antiga, L.; et al. PyTorch: An Imperative Style, High-Performance Deep Learning Library. In Advances in Neural Information Processing Systems; The MIT Press: Cambridge, MA, USA, 2019; pp. 8024–8035. [Google Scholar]
  35. Redmon, J.; Farhadi, A. YOLO9000: Better, Faster, Stronger. In Proceedings of the 2017 IEEE Conference on Computer Vision and Pattern Recognition (CVPR), Honolulu, HI, USA, 21–28 July 2017. [Google Scholar] [CrossRef] [Green Version]
  36. Yang, X.; Sun, H.; Fu, K.; Yang, J.; Sun, X.; Yan, M.; Guo, Z. Automatic Ship Detection in Remote Sensing Images from Google Earth of Complex Scenes Based on Multiscale Rotation Dense Feature Pyramid Networks. Remote Sens. 2018, 10, 132. [Google Scholar] [CrossRef] [Green Version]
  37. Jiang, Y.; Zhu, X.; Wang, X.; Yang, S.; Li, W.; Wang, H.; Fu, P.; Luo, Z. R2cnn: Rotational region cnn for orientation robust scene text detection. arXiv 2017, arXiv:1706.09579. [Google Scholar]
  38. Azimi, S.M.; Vig, E.; Bahmanyar, R.; Körner, M.; Reinartz, P. Towards Multi-class Object Detection in Unconstrained Remote Sensing Imagery. Lect. Notes Comput. Sci. 2019, 150–165. [Google Scholar] [CrossRef] [Green Version]
Figure 1. Small-vehicles, large-vehicles, planes, harbors, ships, and part of their labels visualizations on the DOTA dataset. Yellow boxes represent orientated labels. Blue points are the start points of labeled boxes and denote the coordinates of the object’s top left corner. Yellow dot lines are the axes of the object’s labeled box. Red points are intersections of axes and boxes. On the bottom left, harbors and ships are visualized separately for brevity.
Remotesensing 12 00908 g001
Figure 2. The overall pipeline of our network. (1) ResNet with the FPN architecture is adopted as backbone. For each detection head, there are three subnetworks for OriCenterness, classification, and location prediction. (2) For axis predicting, red dot line denotes the axis of the object, and two yellow points A 1 , A 2 are intersections of the axes and boxes. Red point ( x * , y * ) is a positive pixel point mapped from the feature level. Our method locates orientated objects by predicting ( Δ x 1 , Δ y 1 , Δ x 2 , Δ y 2 , w ) for each responsible pixel point. The first four variables are relative distance from the pixel point to two yellow points. w is the length of the orientated box’s side which is vertical to the axis.
Remotesensing 12 00908 g002
Figure 3. (a) We propose a new OriCenterness to better weigh the importance of positive pixels. Locations near the center of the target will be assigned with a higher weight colored by red, which is close to 1. The weight of pixel points far away from the object’s center will be set close to 0. (b) The aspect ratio of bridge is usually large, and the centerness without aspect ratio aware factor in such objects drop sharply from center to edge, which may cause insufficient learning for network due to low weight. (c) OriCenterness with aspect ratio aware factor r a t i o k assign a larger weight for large aspect ratio objects, which could alleviate the above problems.
Remotesensing 12 00908 g003
Figure 4. Detection results of our method on DOTA. Red points stand the mapping points from feature maps, which predict the axis and width. Pink lines stand the axes detection.
Remotesensing 12 00908 g004
Figure 5. Detection results of our method on HRSC2016. Red points stand the mapping points from feature maps, which predict the axis and width. Pink lines stand the axes detection.
Remotesensing 12 00908 g005
Figure 6. (a) Images of the bridge, harbor, and storage tank from test data with their ground truth; (b) visualizations of original centerness adapted for orientated objects; and (c) visualizations of the proposed aspect-ratio-aware orientation centerness method. The prediction results are both taken from F3 in FPN architecture with a resolution of 100 × 100, and value is from 0 to 1. The higher is the value, the closer it is to red.
Remotesensing 12 00908 g006
Table 1. Description of DOTA and HRSC2016 datasets.
DatasetImagesCategoriesSizeCrop SizeResize SizeTraining ImagesInstances
DOTA [5]280616800 × 800 to 4000 × 4000800 × 800-18,920261,170
HRSC2016 [6]106126300 × 300 to 1500 × 900-800 × 8006171652
Table 2. Comparison of our method with one-stage detectors performance (mAP) on DOTA.
One-Stage MethodsBackboneAnchor-FreePlaneBDBridgeGTFSVLVShipTCBCSTSBFRAHarborSPHCmAP
SSD [2]SSD×39.839.090.6413.180.260.391.1116.2427.579.2327.169.093.031.051.0110.59
YOLOv2 [35]DarkNet-19×39.5720.2936.5823.428.852.094.8244.3438.3534.6516.0237.6247.2325.57.4521.39
RetinaNet-R [4]ResNet-50-FPN×88.9267.6733.5556.8366.1173.2875.2490.8773.9575.0743.7756.7251.0555.8621.4662.02
IENet [31]ResNet-101-FPN57.1480.2064.5439.8232.0749.7165.0152.5881.4544.6678.5146.5456.7364.4064.2457.14
OursResNet-101-FPN79.5377.1538.5961.1567.5370.4976.3089.6679.0783.5347.2761.0156.2866.0636.0565.98
Table 3. Comparison of our method with two-stage anchor-based detectors performance (mAP) on DOTA.
Two-stage methodsbackbonePlaneBDBridgeGTFSVLVShipTCBCSTSBFRAHarborSPHCmAP
FR-O [5]ResNet-10179.0969.1217.1763.4934.2037.1636.2089.1969.6058.9649.452.5246.6944.8046.3052.93
R-DFPN [36]ResNet-101-DFPN80.9265.8233.7758.9455.7750.9454.7890.3366.3468.6648.7351.7655.1051.3235.8857.94
R 2 CNN [37]VGG1680.9465.6735.3467.4459.9250.9155.8190.6766.9272.3955.0652.2355.1453.3548.2260.67
RRPN [8]VGG1688.5271.2031.6659.3051.8556.1957.2590.8172.8467.3856.6952.8453.0851.9453.5861.01
ICN [38]Cascade ResNet-10181.4074.3047.7070.3064.9067.8070.0090.8079.1078.2053.6062.9067.0064.2050.2068.20
RoI-Transformer [10]ResNet101-FPN88.6478.5243.4475.9268.8173.6883.5990.7477.2781.4658.3953.5462.8358.9347.6769.56
OursResNet-101-FPN79.5377.1538.5961.1567.5370.4976.3089.6679.0783.5347.2761.0156.2866.0636.0565.98
Table 4. mAP comparisons with several two-stage and one-stage methods on HRSC2016.
MethodsBackboneAnchor-freemAPResolution
Two-stage methods
BL2 [21]ResNet101×69.60half of original size
R 2 CNN [37]VGG16×73.07800 × 800
RoI Tran [10]ResNet101×86.20512 × 800
One-stage methods
IENet [31]ResNet10175.011024 × 1024
Ours wo OriCenternessResNet10173.91800 × 800
Ours with OriCenternessResNet10178.15800 × 800
Table 5. Ablative study (AP for each category and overall mAP) of OriCenterness in our proposed method on the DOTA dataset.
BackboneOriCenternessmAPPlaneBdBridgeGTFSVLVShipTCBCSTSBFRAHarborSPHC
ResNet50-60.2878.6373.8735.1455.1361.9163.4967.3390.6270.2981.8934.9260.8047.4562.2220.56
64.0479.6873.8637.3757.9562.9365.1067.1690.6876.4182.9045.7058.6153.8760.2248.14
ResNet101-65.5079.7875.4736.0959.6868.5169.8074.2390.4178.2783.3844.5159.4155.8066.0341.15
65.9879.5377.1538.5961.1567.5370.4976.3089.6679.0783.5347.2761.0156.2866.0636.05
Table 6. Speed-accuracy trade-off results and comparison with other methods on DOTA.
MethodsBackboneAnchor-FreemAPTr-Time (s)Inf-Time (s)ResolutionDevice
Two-stage methods
FR-O [5]VGG-16×54.130.2210.1021024 × 1024Titan x
RoI Tran [10]ResNet101×67.740.2360.0841024 × 1024Titan x
R3Det [27]ResNet101×71.69-0.250800 × 8002080 Ti
One-stage methods
IENet [31]ResNet10157.140.1110.0591024 × 10241080 Ti
OursResNet5064.040.0510.067800 × 800Titan Xp
OursResNet10165.980.0910.071800 × 800Titan Xp

