Article

A Quasigeoid-Derived Transformation Model Accounting for Land Subsidence in the Mekong Delta towards Height System Unification in Vietnam

1
Géosciences Environnement Toulouse (GET), Observatoire Midi-Pyrénées, 14 Avenue Edouard Belin, 31400 Toulouse, France
2
Department of Geodesy, Hanoi University of Mining and Geology, Hanoi 100000, Vietnam
3
Centre National d’Etudes Spatiales (CNES), 18 Avenue Edouard Belin, 31400 Toulouse, France
4
Laboratory of Gravity Field Research and Applications—GravLab, Department of Geodesy and Surveying, Aristotle University of Thessaloniki, 54124 Thessaloniki, Greece
*
Author to whom correspondence should be addressed.
Remote Sens. 2020, 12(5), 817; https://doi.org/10.3390/rs12050817
Submission received: 28 January 2020 / Revised: 25 February 2020 / Accepted: 27 February 2020 / Published: 3 March 2020
(This article belongs to the Special Issue Geodesy for Gravity and Height Systems)

Abstract

:
A vertical offset model for Vietnam and its surrounding areas was determined based on the differences between height anomalies derived from 779 Global Navigation Satellite System (GNSS)/levelling points and those derived from a dedicated high-resolution gravimetric-only quasigeoid model called GEOID_LSC. First, the deterministic transformation model to effectively fit the differences between the quasigeoid and GNSS/levelling heights was based on a third-order polynomial model. Second, the residual height anomalies have been interpolated to a grid employing Least-Squares Collocation. Finally, the distortions were restored to the residual grid. This model can be used for combination with a gravimetric quasigeoid model in GNSS levelling. The quality of GNSS/levelling data in Vietnam was analyzed and evaluated in this study. The annual subsidence rate from ALOS-1 was also used to analyze the effects of subsidence on the quality of GNSS/levelling data in the Mekong Delta. From this we made corrections to improve the accuracy of GNSS/levelling data in this region. The offset model was evaluated using cross-validation technique by comparing with GNSS/levelling data. Results indicate that the offset model has a standard deviation of 5.9 cm in the absolute sense. Based on this offset model, GNSS levelling can be carried out in most of Vietnam’s territory complying third-order levelling requirements, while the accuracy requirements for fourth-order levelling networks is met for the entire country. This model in combination with the developed gravimetric quasigeoid model should also contribute to the modernization of Vietnam’s height system. We also used high-quality GNSS/levelling data and the determined quasigeoid model to determine the geopotential value W0 for the Vietnam Local Vertical Datum. The gravity potential of the Vietnam Local Vertical Datum is estimated equal to W 0 LVD = 62,636,846.81 ± 0.70 m2s−2 with the global equipotential surface realized by the conventional value W0 = 62,636,853.4 m2s−2.

Graphical Abstract

1. Introduction

Global Navigation Satellite System (GNSS) technology is used for positioning and navigation activities because of its speed, convenience and accuracy. A drawback of GNSS is that it provides to the user a high-precision ellipsoidal height, which is not physically meaningful. To convert an ellipsoidal height to a physical height, i.e., orthometric (H) and/or normal height (H*), one has to subtract the height anomaly (ζ), being the vertical distance between the quasigeoid and the reference ellipsoid, as follows:
H* = hζ
This is the basic formula in GNSS levelling. For local or regional applications, a geoid/quasigeoid with an accuracy of few cm is required to determine the height anomalies. For GNSS levelling applications since the late 1990s in Vietnam, Global Gravity field Models (GGM) have been used: EGM96 [1] at first, and currently EGM2008 [2]. However, EGM2008 has a standard deviation (STD) of 29.1 cm when compared with GNSS/levelling points in Vietnam [3], and its accuracy is insufficient to meet fourth-order levelling network specifications (a misclosure of 25 k mm over a distance of k km). A high-resolution gravimetric-only quasigeoid model (GEOID_LSC) was recently determined for Vietnam [3]. This model has a mean bias of 50 cm, STD of 9.7 cm and differences ranging from 13.6 to 81.6 cm when compared with a set of 812 GNSS/levelling points. It should be noted that in this study the zero-degree term was not included in the evaluation. The principal reason for the large mean bias is that there is an inconsistency in the reference systems in these vertical datum realizations. The quasigeoid refers to a global reference system, i.e., an international reference gravity potential W0 = 636,853.4 m2s2, whereas the heights determined from levelling refer to the national Mean Sea Level (MSL), called the Vietnam Local Vertical Datum (VLVD). The MSL over 1950–2005 for a single tide gauge in the north of Vietnam, called Hon Dau (20°40’, 106°49’), was assigned to zero height on the VLVD. With its large mean bias, the gravimetric quasigeoid model does not allow the accurate transformation of GNSS ellipsoidal heights to physical heights in the VLVD. Most often, the gravimetric quasigeoid or geoid model is forced to fit onto the local vertical datum. Such a hybrid quasigeoid/geoid model is used to convert GNSS ellipsoidal heights to physical heights. Most countries make continuous efforts to determine and improve their hybrid geoid or quasigeoid model successfully. For comparison, Table 1 shows the accuracy of several local hybrid geoid or quasigeoid models, and notably of neighboring countries in Asia. The resulting standard deviations obtained for the most recent hybrid models range from a few cm up to 15 cm, depending on the quality of the available gravity and GNSS/levelling data for the hybrid geoid/quasigeoid determination.
It is well known that the Local Vertical Datum (LVD) determination by levelling contains the distortions caused by vertical crustal movement and systematic cumulative errors associated with leveling surveys over long distances [14,15]. So, the problem with this fitting method is that the surface realized after the transformation, despite providing more or less rigorous results for the application of levelling with GNSS, is not an equipotential surface anymore, hence its physical meaning and applications in the rest of the geosciences are limited. This hybrid geoid/quasigeoid model aims only at providing a model of the separation between the reference ellipsoid and the LVD rather than determining the classical geoid/quasigeoid as an equipotential surface of the Earth’s gravity field. An alternative method for the definition of a vertical datum by GNSS levelling is to use the local gravimetric-only quasigeoid model for determining a vertical offset model (distance between the gravimetric-only quasigeoid and an LVD). This procedure is more realistic because it does not constrain the local gravimetric quasigeoid to be coincident to the LVD. This offset model can be used to convert ellipsoidal heights into the local physical heights where the current LVD needs to be maintained. On the contrary, we may also use this offset model to redefine and recalculate a modern VLVD by adding it to the available levelling data. Such an offset model has been successfully applied in modernizing the height reference system, for instance in New Zealand [16] and Canada (https://www.nrcan.gc.ca/earth-sciences/geomatics/geodetic-reference-systems/9054).
Significant trends in national levelling networks have been documented in several countries as in Thailand (a significant tilt of −0.126 mm/km in north–south direction and 0.008mm/km in east–west direction [10]), in Canada (a tilt of −0.26 cm/degree in the north–south direction and 0.52 cm/degree in the west–east direction [17]) as well as in the USA (a large northwest–southeast tilt in NAVD88 data with respect to the geoid derived from the Gravity field and steady-state Ocean Circulation Explorer (GOCE) [18]) or Western Australia (a tilt of 0.27 mm/km in the north–south direction and 0.07 mm/km in the east–west direction [19]). Vietnam stretches from north to south (about 2000 km) while the original point of the height system is located in the north. Therefore, it is likely that a north–south tilt would be also present in the vertical network of Vietnam, thus inherited in the levelling data that will be analyzed in this study. Moreover, thanks to recent studies, the Mekong Delta is known to be affected by significant land subsidence [20,21]. With an average subsidence rate of 1.6 cm/year and extreme locals up to over 2.5 cm/year [20,21], the influence of land subsidence is significant on the quality and maintenance of levelling data in the Mekong Delta when compared to the rest of Vietnam. As such, distortions might be expected in the GNSS/levelling data in Vietnam, and because the computation of an offset model using Least-Squares Collocation (LSC) assumes stochastic observations, any deterministic biases and trends must be removed.
It should also be noted that each country defines its own MSL, and the height systems are defined based on this MSL. As a result, currently there are more than 100 LVDs in the world nowadays. Moreover, many vertical datums may even exist within a single country, especially for archipelagic countries such as the Philippines [22], Indonesia [23] and New Zealand [24], where the MSL may be subject to variations. The variability of the MSL is one of the reasons why the quasigeoid surface can be rigorously used for unifying the different LVDs. The deviation of the MSL from the equipotential surface of the geoid/quasigeoid, known as the (stationary) mean dynamic topography, is quite significant and in some parts may reach the order of ±2 m [25]. These facts will affect the definition and the unification of LVDs separated by oceans if the MSL is to be used as the height reference. Moreover, due to Sea Level Rise (SLR), recorded in some areas from tide-gauge and satellite altimetry observations, MSL may vary over time. In our study area, it has been proven from the analysis of 12 tide gauge station records over the period 1960–2013 that the Sea of Vietnam is affected by such SLR [26]. Sea level is rising with rate of 3.0 mm/year on average along Vietnam’s coast, while for the period 1993–2013 it was 4.5 mm/year (excepting Hon Dau station at 2.6 mm/year). Thus, from 1993 to present, the MSL at Hon Dau station has risen about 7 cm (2.6 mm/year for over 27 years). Despite this rate of sea level rise, levelling networks have not been re-adjusted in order to accommodate this change. This is also a disadvantage when using MSL as reference for the height system.
An LVD is considered as an equipotential surface defined by a geopotential value ( W 0 L V D ); hence, in the traditional sense of height systems, W 0 L V D is the potential of the MSL. As mentioned above, more than 100 LVDs exist in the world today, so unification of these vertical datums is required to implement engineering projects between countries and improve flooding observations and modeling at regional scales. The connection of height systems located on one continent can be done by geodetic sprit levelling in combination with gravity measurements, but height systems separated by sea cannot be unified in this manner. Even at the national scale, the Vietnam LVD is only valid for the continental territory but not for the islands and territorial waters of Vietnam. Thanks to the high-resolution GEOID_LSC model [3], we were able to determine the height for the whole islands towards unifying the height references for Vietnam. Moreover, this model is also used in combination with high-quality GNSS/levelling data (referring to the VLVD) for estimating the gravity potential value of the VLVD to connect the height system of Vietnam with the neighboring countries. According to the International Association of Geodesy (IAG) resolution No.1, 2015, the international conventional reference gravity potential, denoted by W0, is considered equal to 62,636,853.4 m2s−2 [27]. From this value, Height System Unification (HSU) can be realized to connect height systems together by determining potential differences referring to the conventional value. Knowing the gravity potential of LVD, the gravity potential difference of every LVD and the LVD offset values between all the LVDs can be determined. Therefore, determining the gravity potential value of LVD plays an important role in the HSU.
The objective of this study is to determine an offset model for converting ellipsoidal heights into the local normal heights in Vietnam. This offset model is applied to the local gravimetric-only quasigeoid model for GNSS levelling technology giving an accuracy that complies with third-order levelling specifications. The accuracy of the offset model depends on the quality of the height anomalies derived from the GNSS/levelling data used in the calculation. Therefore, analyzing and improving the accuracy of the GNSS/levelling data will also be an important part of this research. The effects of local subsidence in South Vietnam is also discussed from the analysis of ground deformation measurements derived from permanent GNSS stations and InSAR (Interferometric Synthetic Aperture Radar) time series. Based on the results of land subsidence derived from InSAR, the corrections were applied on the GNSS/levelling data in the Mekong Delta. Finally, high-quality GNSS/levelling data were used to assess the accuracy of the developed offset models based on the cross-validation technique [28] and determine the gravity potential value (W0) for the VLVD.

2. Materials and Methods

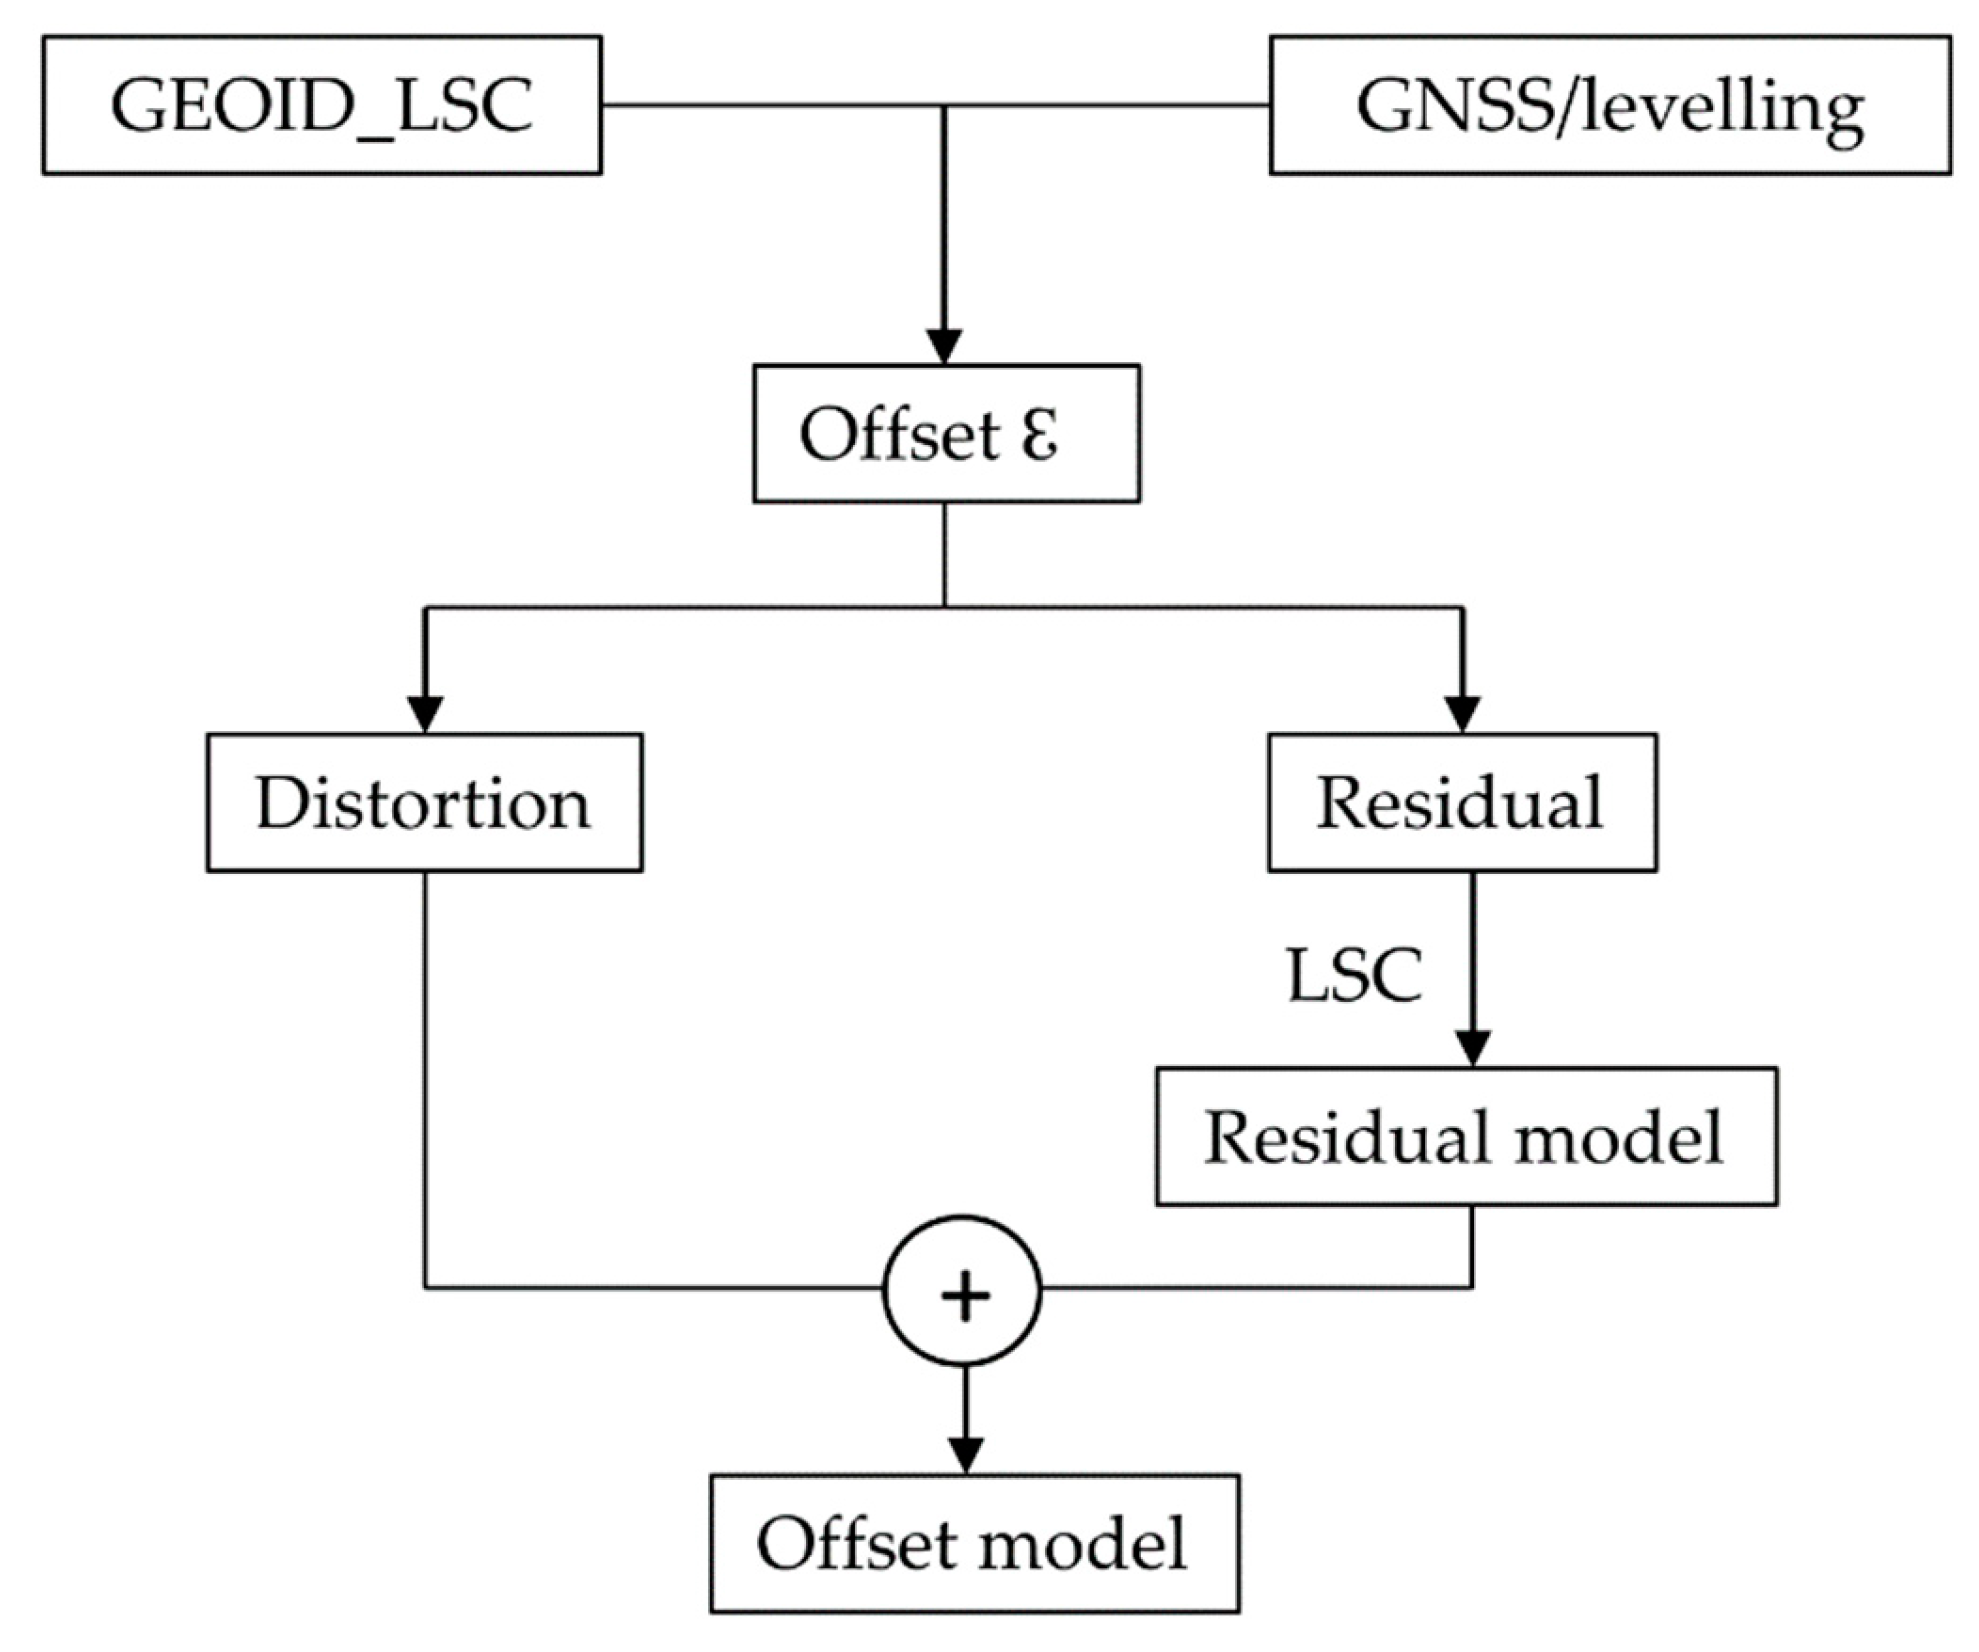
2.1. Offset Model Determination Methodology

The offset ε of the existing VLVD with respect to the local gravimetric-only quasigeoid is given as the differences between height anomalies derived from GNSS/levelling data (ζGNSS/levelling) and from the model GEOID_LSC (ζ):
ε = ζ G N S S / l e v e l l i n g ζ ζ 0
where ζ0 represents the contribution of the zero-degree harmonic term to the GGM with respect to a specific reference ellipsoid [29].
ζ 0 = G M G M 0 R γ W 0 U 0 γ
The parameters GM0 and U0 are the geocentric gravitational constant of the reference ellipsoid and the normal gravity potential, respectively. The WGS-84 ellipsoid is used as the reference ellipsoid for computation of GEOID_LSC, GM0 = 398,600.4418 × 109 m3s−2 and U0 = 62,636,851.7146 m2s−2 (report of the National Imagery and Mapping Agency (NIMA) [30]), while the Earth’s geocentric gravitational constant GM and the gravity potential Wo are set to GM = 398,600.4418109 × 109 m3s−2 and W0 = 62,636,853.4 m2s−2. The mean Earth radius R is taken equal to 6371 km, and the normal gravity γ at the surface of the ellipsoid is computed by using Equation (4-60) of Hofmann-Wellenhof and Moritz (2006) [29].
The offsets (ε) can be decomposed into two components, the distortion and the residual. The former may contain long and/or medium wavelength errors of local gravimetric quasigeoid model, and/or some bias and trends of GNSS/levelling height anomalies due to vertical crustal movements and systematic cumulative errors associated with levelling surveys over long distances. A schematic flow of the strategy is shown in Figure 1.
In order to remove distortions in these offsets, a four parameter Helmert-type similarity transformation model is often employed for fitting gravimetric quasigeoid model to GNSS/levelling data [30,31]. However, in the GNSS/levelling data of Vietnam, inherent tilts may exist, so some models with parameters representing for spatial tilts, such as linear in φ and λ, second-order polynomial and third-order polynomial, will also be tested:
  • linear in φ and λ model:
    ε = a 0 + a 1 φ + a 2 λ + ε
  • second-order polynomial model:
    ε = a 0 + a 1 φ + a 2 λ + a 3 φ 2 + a 4 φ λ + a 5 λ 2 + ε
  • third-order polynomial model:
    ε = a 0 + a 1 φ + a 2 λ + a 3 φ 2 + a 4 φ λ + a 5 λ 2 + a 6 φ 3 + a 7 φ 2 λ + a 8 φ λ 2 + a 9 λ 3 + ε
  • four parameter Helmert model:
    ε = a 1 c o s φ c o s λ + a 2 c o s φ s i n λ + a 3 s i n φ + a 4 + ε
After removing distortions from the offsets of GNSS/levelling points we will get residual offsets (∆ε = εε′), which will be then interpolated to a 5’ grid with LSC using the GRAVSOFT GEOGRID program [32]. The covariance function was evaluated using a second-order Gauss Markov model as
K N ( ρ ) = K o ( 1 + A ρ ) e A ρ
where K o is the variance of the observations ∆ε; A is a parameter related to the correlation length; ρ is the distance measured in km. An offset model is created by adding the residual offset to the distortion component. Thus, a gravimetric quasigeoid model and an offset model on 5’ grids can be determined. The normal height at a point is then obtained as
H = h ζ ε
where the gravimetric quasigeoid height anomaly (ζ) and offset (ε) are interpolated from the grids.
Most often, the same GNSS/levelling data are used both to create and test the hybrid model. This strategy is flawed because it is insensitive to errors in the GNSS/levelling data. Specifically, any error in the GNSS/levelling data will cause the same error in the combined model. However, this error will not be apparent when compared to the same GNSS/levelling data (the error of the hybrid quasigeoid in this case is only a few centimeters, this will be clarified in Section 5). Therefore, a cross-validation technique is used in this study, in which one GNSS/levelling point at a time is omitted from each offset model prediction, and that point is then used to assess the hybrid model. This is repeated for all points in the dataset. Importantly, this gives a more objective assessment of the gravimetric quasigeoid and offset model.

2.2. Data for the Determination of the Offset Model

2.2.1. Gravimetric Quasigeoid Model (GEOID_LSC)

A gravimetric-only quasigeoid model (GEOID_LSC) was determined for Vietnam and its surrounding areas based on new gravity data [3]. A set of 29,121 land gravity measurements has been used in combination with fill-in data where no gravity data existed. A mixed model (‘GOCE DIR5 plus EGM2008’, [3]) up to degree/order 2159, plus Residual Terrain Model (RTM) effects and gravity field derived from altimetry satellites were used to provide the fill-in information over land and marine areas, respectively. The mixed model up to degree/order 719 was used for the removal of the long and medium wavelengths and the calculation of the quasigeoid restore effects. The 90 m resolution SRTM3arc_v4.1 [33] was used as the detailed Digital Terrain Model (DTM) over land areas in computing the RTM effects, whereas the 15” resolution Digital Bathymetry Model (DBM) SRTM15arc_plus [34] was used over sea. The residual height anomalies have been determined employing Least-Squares Collocation (LSC). The 5’ resolution GEOID_LSC model was determined with a STD of 9.7 cm and a mean bias of 50 cm when compared with a set of 812 GNSS/levelling points. However, the zero-degree term is not included in this evaluation.

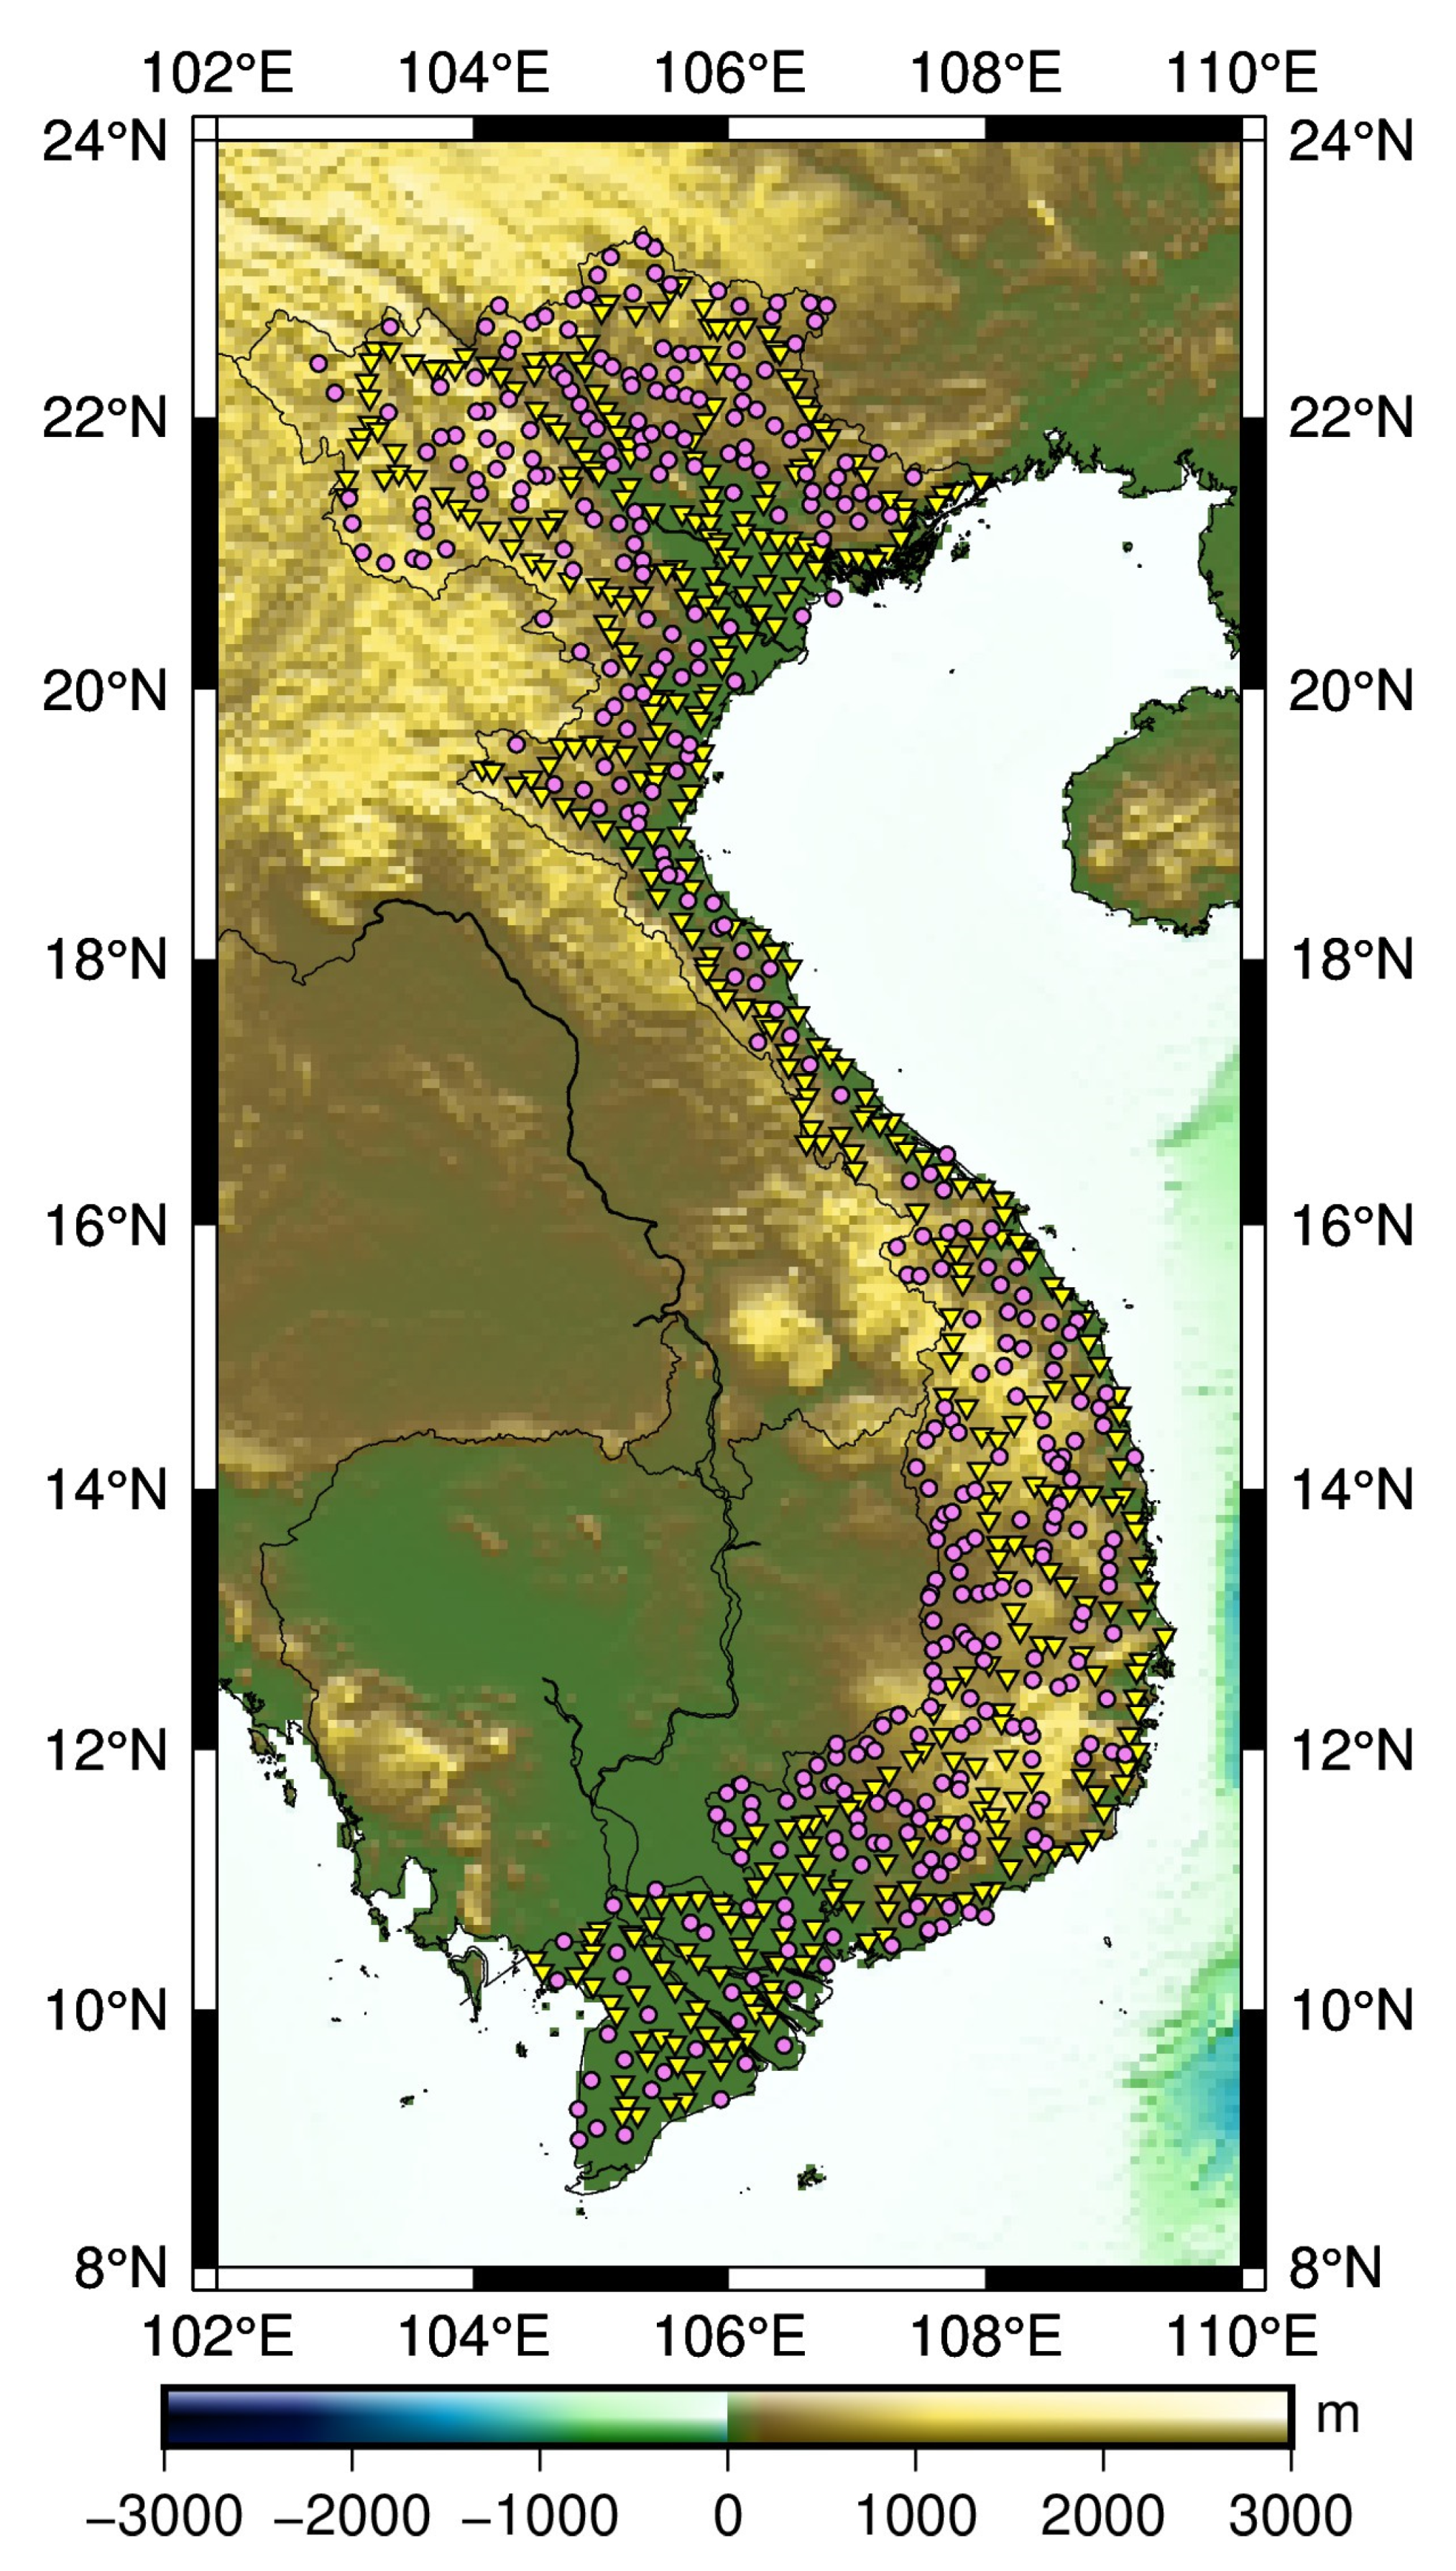
2.2.2. GNSS/Levelling Data

In the past, the Vietnam height system was divided into two different parts, and the 17th parallel was the provisional demarcation line; North Vietnam used the MSL at Hon Dau tide gauge station, and in South Vietnam the Ha Tien tide gauge was used [35]. After the war, the height system was calculated uniformly for the entire country. From 2001−2003, the Vietnam national levelling network was re-measured, and then it was readjusted in 2007 using the MSL over 1950−2005 at the Hon Dau tide gauge station [35]. From 2009−2010, the Vietnam Department of Surveying and Mapping (VDSM) carried out GNSS observations on the levelling points. The GNSS baselines were observed using dual-frequency instruments in static mode with a minimum measurement time of 6 hours per session. The GNSS data were processed with the Bernese software to obtain ellipsoidal heights referred to the WGS84 ellipsoid. A total number of 812 GNSS/levelling observations was used in this study (see station location in Figure 2). We can see that the GNSS/levelling points are relatively well distributed over the entire country. GNSS/Levelling data include horizontal coordinates (latitude, longitude) and the computed height anomalies. Among the 812 GNSS/levelling points, 428 points are first- and second-order, and 384 points are third-order of the national levelling networks. First-, second- and third-order levelling in Vietnam allows misclosure of 5 k , 12 k and 25 k mm over a distance of k km, respectively. Normal height is currently used in the national height system of Vietnam.
The so-called geometric height anomalies, i.e., derived through Equation (1), of the 812 GNSS/levelling points were compared with those derived from the GEOID_LSC in the absolute sense. The results are listed in Table 2 and shown in Figure 3a. Outliers were determined assuming a normal distribution of the residuals, and the three sigma () rejection led to elimination of 9 points. Linear regressions on the differences of GNSS/levelling data and GEOID_LSC in northern (>21° in latitude) and near coast (calculation for GNSS/levelling points within 50 km from the coastline defined by Generic Mapping Tools (GMT) [36]) are shown in Figure 3b. We can see that there are tilts in the east–west direction in the north of Vietnam and in the north–south direction. The tilt in the north is 0.30 mm/km, whereas the tilt in the north–south direction is 0.11 mm/km. These tilts are significant over long distances and may be due to two reasons: first, trends in the local gravimetric quasigeoid model caused by long and medium wavelength errors, steep gravity gradient and/or terrestrial gravity errors, and second, trends of levelling data caused by vertical crustal movements and/or systematic cumulative errors associated with levelling surveys over long distances. This will be investigated and clarified later in this section.
Thanks to GOCE [37], global geoids with an accuracy of 1–2 cm and gravity field models with an accuracy of 1 mGal at a spatial resolution of approximately 100 km are available. The GEOID_LSC model is expected to be less prone to long and medium wavelength errors thanks to using a mixed model of EGM-DIR-R5 [38] and EGM2008 called DIR/EGM [3], and its enhanced resolution allows better detection of distortions in the terrestrial gravity and levelling data. To further clarify the issue of possible trends in local gravimetric quasigeoid models caused by errors in the terrestrial gravity data, the GNSS/levelling geometric height anomalies were compared with those derived from the DIR/EGM model up to d/o 719 (this d/o gave the best result in the removal of the long and medium wavelengths and the calculation of the quasigeoid restore effects in computation GEOID_LSC [3]), plus RTM effects up from d/o 720 to 216,000 (equivalent to the 3” resolution SRTM3arc_v4.1) to reduce effect of large omission errors in DIR/EGM model. Using the same d/o of DIR/EGM (719) as the Remove–Restore procedure in computation gravimetric quasigeoid is to completely avoid effect of the long and medium wavelength errors if they exist in DIR/GGM model. The results are listed in Table 2 and shown in Figure 3c. We can see that its average bias was similar (0.682 m) with GEOID_LSC, whereas the standard deviation was 0.168 m due to the omission error in DIR/EGM model. It was significantly improved when we used terrestrial gravity data to determine the GEOID_LSC model (the STD of GEOID_LSC is 0.092 m). This proves that trends in the local gravimetric quasigeoid model caused by bias in the terrestrial gravity data are insignificant in the GEOID_LSC model on the scale of the country. Therefore, the tilts are due to steep gravity gradient and trends in levelling data.
The comparison in a relative sense was carried out with 803 GNSS/levelling points over 21,423 baselines. The results are shown in Figure 4 and listed in Table 2. In Figure 4 we see that the magnitude of relative differences of the height anomalies of GNSS/levelling points and the GEOID_LSC increases with the baseline length. To clarify this, the height anomalies of 803 GNSS/levelling points were compared with those derived from the GEOID_LSC in the relative sense per baseline length (10 km). The results are listed in Table 3. We can see that the mean bias and STD increased linearly with baseline length. This is due to error in the spirit levelling depending on the baseline length. Relative accuracy of spirit levelling decreased 2.9 cm in STD and 3.8 cm in mean when baseline length increased from 10 to 100 km. This was significant over long distances. This is due to systematic cumulative errors in levelling. It causes the tilts in the levelling data that we discussed above. We also carried out the comparison in relative sense in the northern part (>21° in latitude) and the points near the coast (within 50 km from the coastline). The results are listed in Table 3. In the northern part, the mean bias ranged between 4.4 and 9.3 cm, while the STD was from 3.0 and 7.2 cm when the baseline length varied from 10 to 100 km, respectively. In the region near the coast, mean bias was 4.2 and 7.5 cm, and STD was 3.7 and 6.9 cm when baseline length was 10 and 100 km, respectively. The relative accuracy of spirit levelling in the northern part decreased faster than that in the region near the coast. The tilt in the region near the coast was only 0.11 mm/km, whereas in the northern part it was 0.30 mm/km. This means that besides the errors in levelling there was also a contribution of the quasigeoid to the error in the northern part. This tilt of the quasigeoid in the northern part can be attributed to the steep gravity gradient over the northern mountainous regions (the altitude is greater than 1000 m in the northwest) [3].
In Figure 3a, we can see that there were two distinct biases, one in the northeast part of the northern region (>105° in longitude and >20° latitude) and another for the southern region (<11° latitude). Hence, the GNSS/levelling geometric height anomalies were compared with those derived from the GEOID_LSC for these two regions. The results are listed in Table 2. The difference in average bias between these two regions was 7.1 cm (average bias of 0.705 m in the northeast part and 0.634 m in the southern region). These differences, provided by GNSS and levelling, which were not measured at the same time (GNSS measurements were taken about 7 years after leveling), may be due to the effect of land subsidence, which has been documented for the southern region of Vietnam (Mekong Delta). Most of the Mekong Delta lies within 2 m of current sea level and is well-known as a region strongly affected by climate change phenomena such as land subsidence and SLR. In a recent study, Featherstone et al. (2019) [39] assessed that the land subsidence effect on the accuracy of height anomalies derived from the GNSS/levelling data, which were not measured at the same time, is an important candidate (together with the poor quality of the altimeter data and steep gravity gradients) to explain for 1 mm/km tilt in the quasigeoid in Perth, Australia, whereas the land subsidence effect on the computed quasigeoid is very small. As we suspect that the differences could be due to ongoing displacements affecting the Mekong Delta, we paid special attention to detecting such possible displacements through inspection of GNSS and InSAR data. This hypothesis is discussed in the next section.

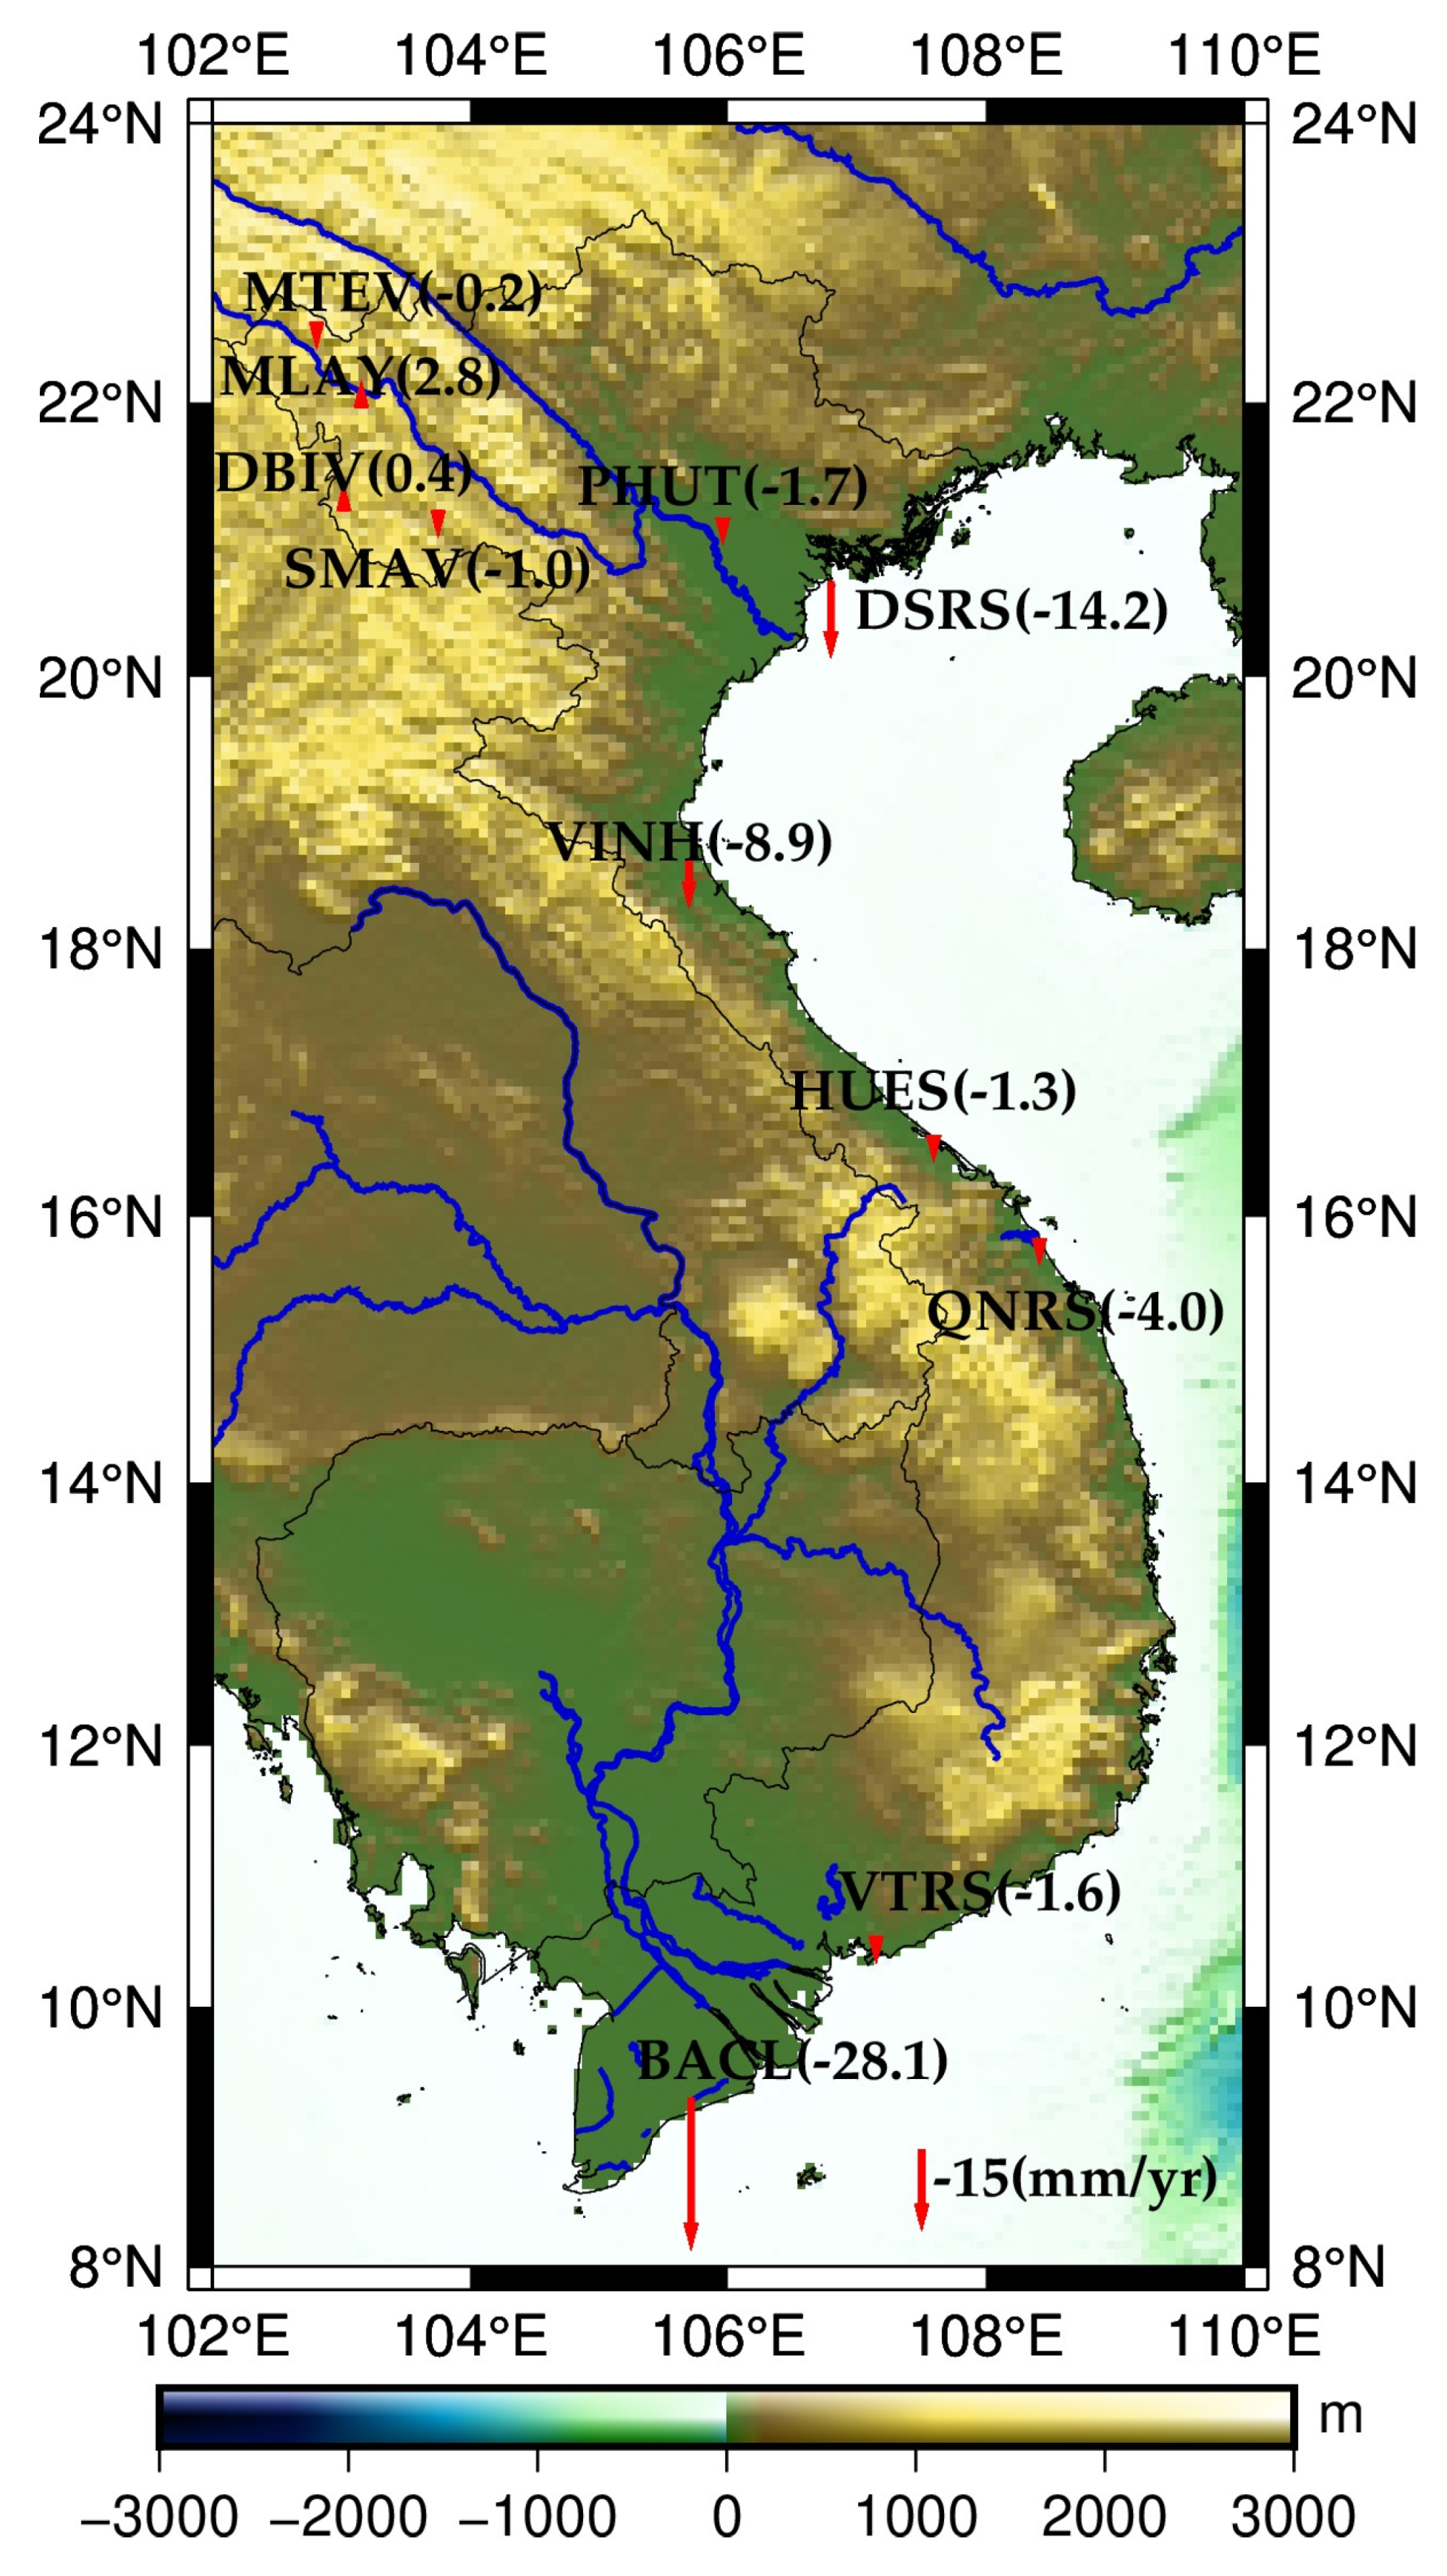
3. Land Subsidence in Vietnam

To assess the impact of land subsidence processes in our estimation of GNSS/levelling discrepancies, we used complementary information provided by the permanent GNSS stations in Vietnam and by InSAR data to estimate the vertical land motion currently observed in the northern and southern parts of the country.

3.1. GNSS and InSAR Data

The Continuously Operating Reference Station (CORS) network is under construction in Vietnam. Therefore, quite few GNSS stations measured continuously over long periods of time. Nevertheless, data from 11 GNSS stations (with continuous observation time of about 10 years) were used in this study. For 8 of them (named MTEV, MLAY, DBIV, SMAV, PHUT, VINH, HUES and BACL), a time series of heights processed with GNSS at MIT/Global Kalman Filter (GAMIT/GLOBK) software were provided by the Institute of Geophysics (IGP), Vietnam Academy of Science and Technology (VAST). In addition, Receiver Independent Exchange Format (RINEX) data from 3 stations (named DSRS, QNRS and VTRS) provided by VDSM and processed with GINS [40], and the in-house software package developed by CNES (Centre National d’Étude Spatiales), using the Precise Point Positioning (PPP) methodology have been included to obtain time series of heights. The calculation results of all the stations are given in the reference frame ITRF2014.
We also benefited from estimations of the annual average subsidence rates over the 2006–2010 period derived from a total of 121 ALOS-1 PALSAR images covering most of the Mekong Delta provided by Dr Laura E Erban [20]. These estimations are in good agreement with ground-based measurements of land subsidence at hydraulic wells. We also benefited from Sentinel-1 imagery time series over the 2015–2018 period for three areas Ca Mau (CM), Long Xuyen (LX) and Rach Gia (RG) situated in the Mekong Delta, which are available in the frame of the project “EMSN057: Ground subsidence in Mekong Delta, Vietnam” [41]. Average motion was estimated for every year from 2015 to 2018. From this, we averaged annual subsidence for the period 2015–2018. The full description of the SAR processing for ALOS and Sentinel-1 data can be found in Erban et al. (2014) [20] and project EMSN057 [41], respectively.

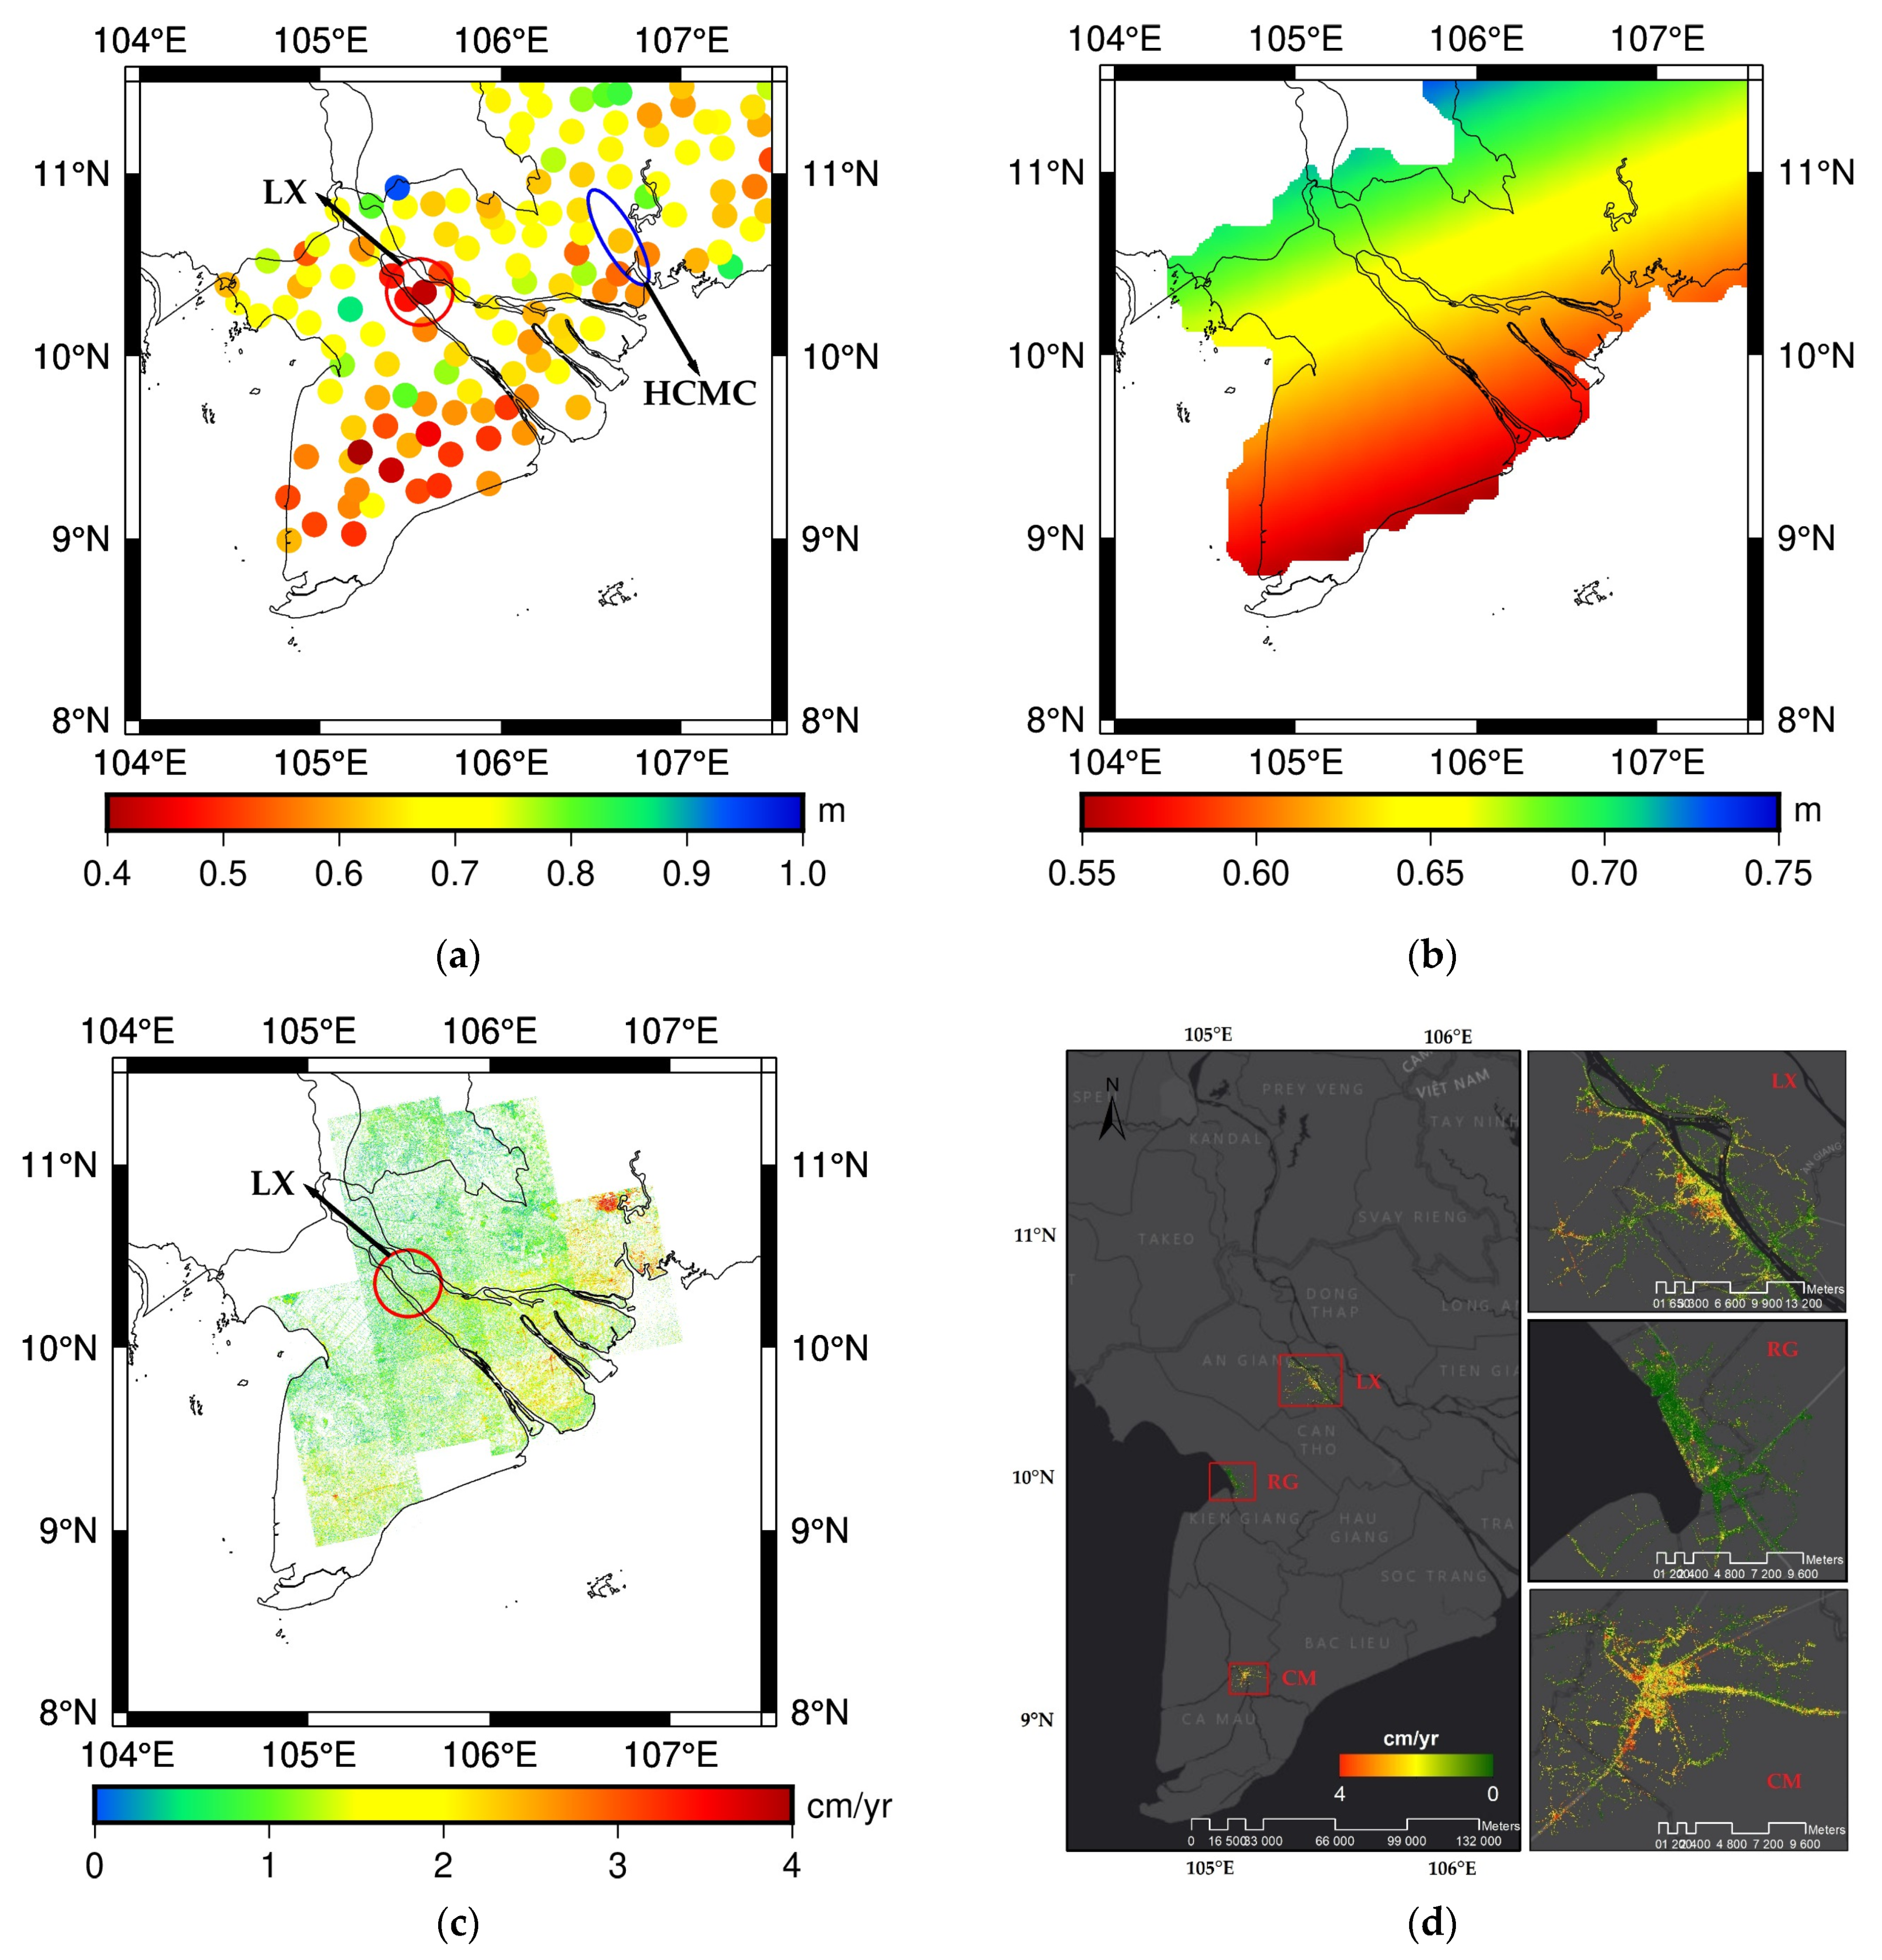
3.2. Land Subsidence and Correcting GNSS/Levelling Data in the Mekong Delta

The vertical land motion rates derived from permanent GNSS stations are shown in Figure 5, and the results of time series of heights are shown in the Supplementary Materials. The observation time was not continuous for two stations, DSRS and VINH, for which there were 2 or 3 long data interruptions. Consequently, the results were not reliable for these two stations. A notable subsidence rate of −28.1 mm/year was observed for the BACL station, located in the Mekong Delta, whereas that of the remaining stations was only at the few mm/year level.
As the Mekong Delta has been known to be deforming for decades, such a value is not surprising. Nevertheless, the length of the observation time span was too short (about 4 years from 2015 to 2019), and one should not disregard that the observed subsidence of the BACL station could be a local effect due to anthropogenic activity. It was then decided to carry out a careful analysis of ground displacement fields imaged by InSAR in the Mekong Delta.
The differences of GNSS/levelling and GEOID_LSC over the southern region are shown in Figure 6a. Applying a linear regression on the differences shows the southeast–northwest trend clearly, which is shown in Figure 6b. Ground displacement fields from InSAR confirms without ambiguity that subsidence affected the whole part of the Mekong Delta. The map of the annual average subsidence rates over the 2006–2010 period derived from ALOS-1 PALSAR provide useful indication about the structure and the magnitude of the subsidence affecting the Mekong Delta (Figure 6c). It shows that average subsidence rate was 1.6 cm/year for this delta with local extremes in the southeastern part over 2.5 cm/year. This result is in good agreement with land subsidence rate derived from BACL station (−28.1 mm/year). A southeast–northwest trend was evident in Figure 6b,c in the Mekong Delta with larger-rate subsidence in the southeast of this delta. In particular, Ho Chi Minh City (HCMC, blue ellipse in Figure 6a) had the highest rates (about 4 cm/year) observed. However, a detailed analysis of HCMC by Minh et al. 2015 [42] using ALOS-1 for the 2006–2010 period shows that average subsidence rate of HCMC was only 0.8 cm/year with larger-rate subsidence in the southwest of the city. This subsidence rate is in good agreement with the differences between the GNSS/levelling and the quasigeoid over HCMC. A slightly larger rate of subsidence can be seen in Figure 6a for HCMC than the surrounding areas. In addition, Sentinel-1 imagery time series confirmed these estimations in some areas (Figure 6d). Good agreement between the results derived from ALOS-1, Sentinel-1 and quasigeoid in the areas CM and RG is shown in Figure 6. However, there was a slight inconsistency between the results derived from ALOS-1 and Sentinel-1 along the Mekong River, especially in the area LX (red circle in Figure 6a,c). The origin of this discrepancy is not known and could be due to a change in displacement rates between the 2006–2010 and the 2015–2018 periods, but there is better consistency between the result derived from Sentinel-1 and the quasigeoid over this area, while GNSS and leveling were measured at the time closer to ALOS-1 than Sentinel-1. However, the salient fact is that the InSAR-based subsidence pattern appears to largely coincide with the trend pattern observed in the differences between the GNSS/levelling and the quasigeoid. All these observations strongly suggest that distortion in GNSS/levelling data of the southern region is mainly due to land subsidence, especially in the Mekong Delta. Obviously, the subsidence significantly affects the GNSS/levelling data as well as the offset model if it is determined without first correcting the GNSS/levelling points. To address this problem, we chose the following approach and methodology.
The 683 GNSS/levelling points with latitudes greater than 11° are considered to be unaffected by subsidence. The height anomalies of these GNSS/levelling points were compared with those derived from the GEOID_LSC in the absolute sense. The results are listed in Table 4. Aiming for GNSS/levelling data of the same precision in the southern part (<11° in latitude), we corrected the data using the annual subsidence rate grid calculated with ALOS-1. To avoid affecting the edge, the remaining grid nodes (not calculated by ALOS-1) were set to zero. Height anomalies of 47 points were corrected considering a 7 year lag between levelling and GNSS measurement periods. On the height anomalies of GNSS/levelling points (ζGNSS/levelling), we performed the correction according to the following formula:
ζ G N S S / l e v e l l i n g _ c o r = ζ G N S S / l e v e l l i n g + t . V
where V is the annual average subsidence rate of the GNSS/levelling point interpolated from the rate grid calculated from ALOS-1 SAR data, and t is a 7 year lag between levelling and GNSS measurement periods.
The corrected result is listed in Table 4. After the correction, the mean bias of the difference between GNSS/levelling data and GEOID_LSC in the southern part increased by 3 cm (mean bias before and after correcting were 0.634 and 0.664 m, respectively). This mean is much closer to that in the remaining part of the country (0.690 m in 683 points with latitudes greater than 11°). The STD also decreased by 0.7 cm (STD before and after correcting were 0.092 and 0.085 m, respectively). Thus, thanks to this rather approximate correction, the accuracy of GNSS/levelling data in the southern part was more similar to data for the rest of the country. On all 803 points, the STD slightly improved by 0.3 cm (STD before and after correcting were 0.092 and 0.089 m, respectively). Under the assumption of a normal distribution, 1 point was rejected. A total of 802 points with mean and STD of 0.687 and 0.088 m, respectively, were retained for computation of the offset model.
Thanks to the offset modelling into two components (distortion and residual) we can calculate the distortions for different regions instead of calculating the homogeneous distortion parameter for the entire country. As a result, the residuals will be smaller. In Figure 3a we can see that there were two distinct distortions between the two parts, one in the northern part (>17° in latitude) and another for the southern one. In the following section we will calculate distortion and residual to determine two offset models as follows:
  • using all 802 GNSS/levelling points and calculating the homogeneous distortion parameter (case 1);
  • using all 802 GNSS/levelling points and calculating two distortion parameters for two regions: southern (<17° in latitude) and northern part (>17° in latitude) (case 2).

4. Results and Discussion

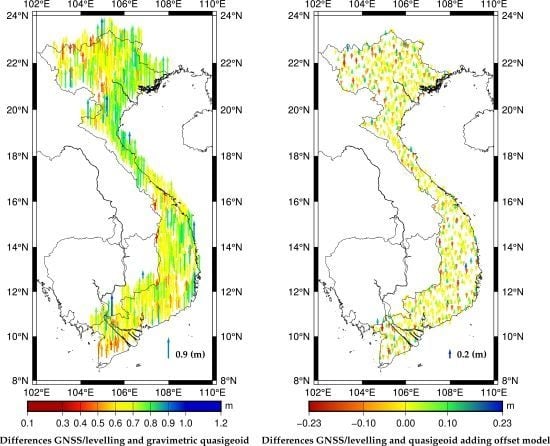
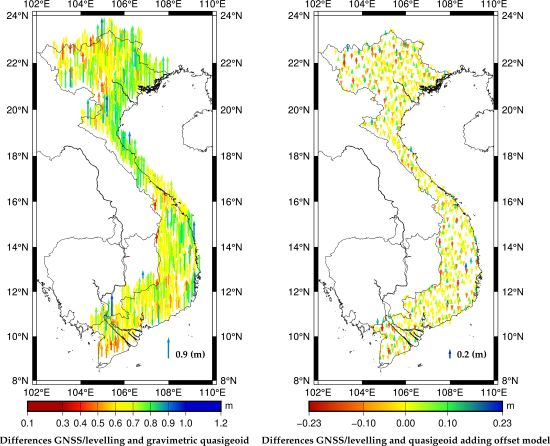
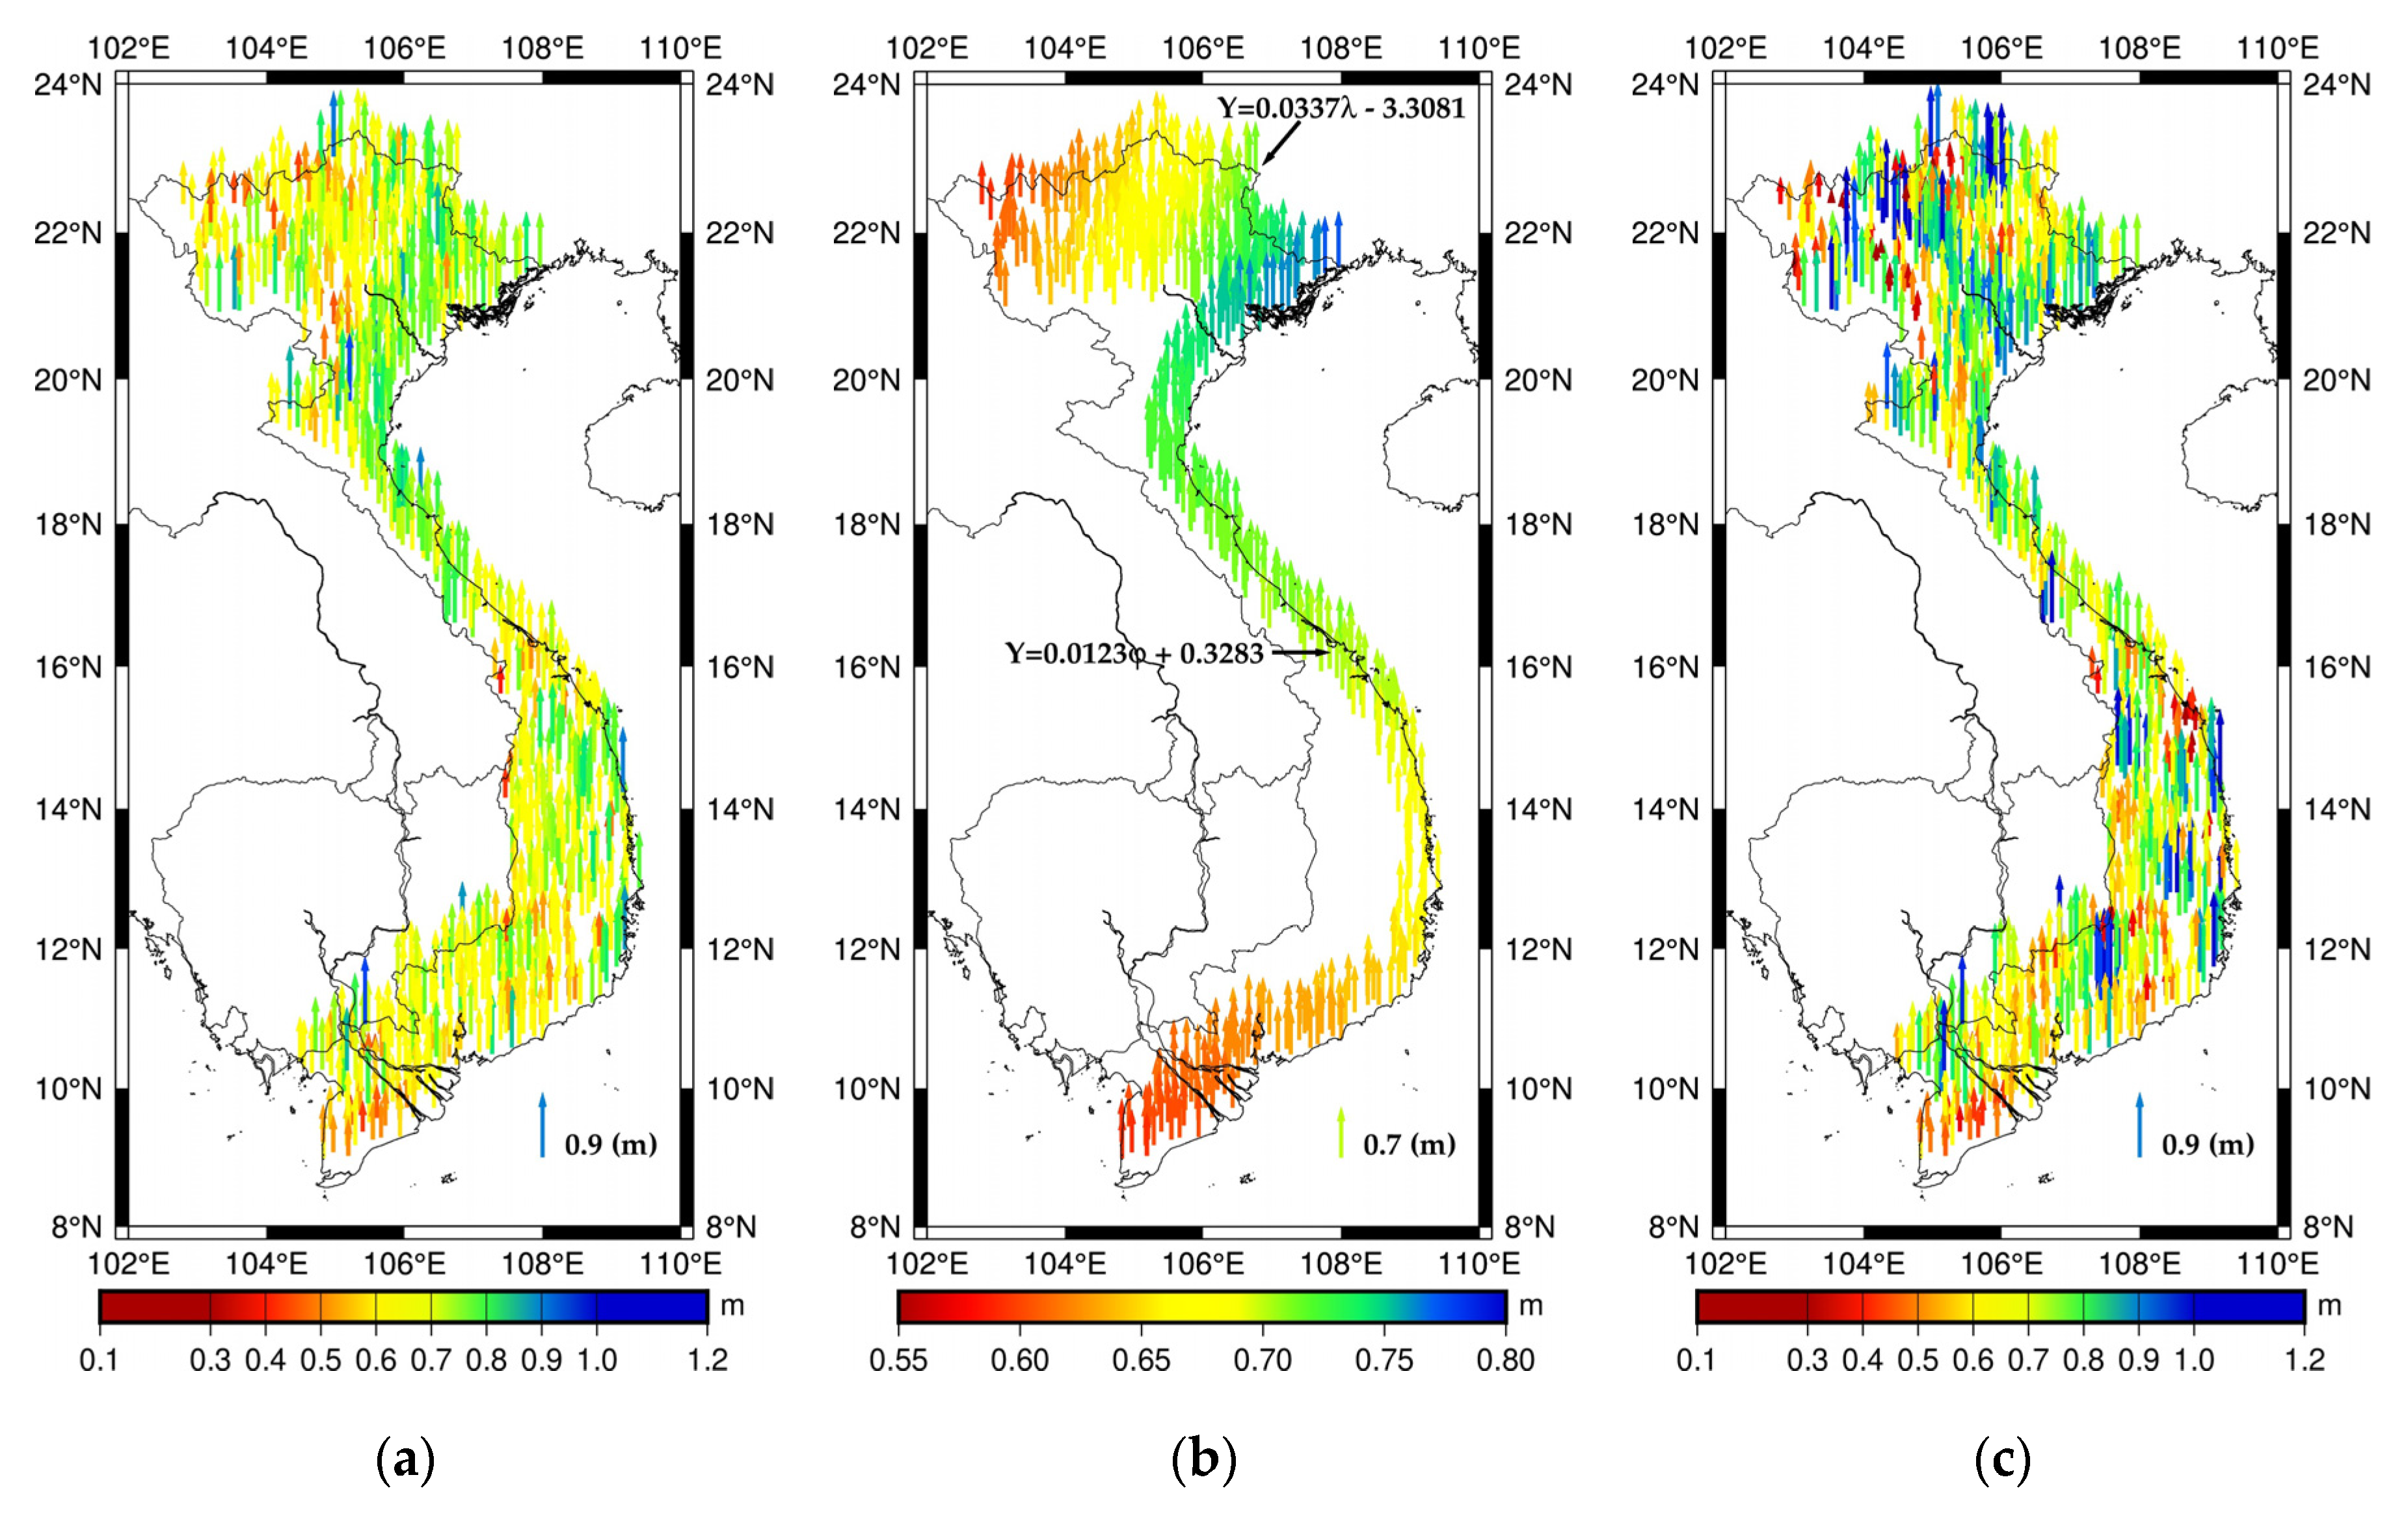
4.1. Offset Model Estimation and Validation

To select the best model for removing distortions in the differences between GNSS/levelling data and the GEOID_LSC model, we used all 802 GNSS/levelling points (case 1) to calculate the distortion employing the four models that we have shown in Section 2. The results of residuals are listed in Table 5. The third-order polynomial model had the highest precision with an STD of 0.082 m. We also used the fourth- and fifth-order polynomial models to remove the distortions, but the STD was not significantly improved, i.e., 8.1 cm for these two models. Moreover, a height-dependent parameter [43] was also added into the third-order model to remove the distortions, but STD had no improvement, i.e., 8.2 cm with the third-order model added height-dependent parameter, because Kotsakis et al. (2012) [43] and Hayden et al. (2013) [17] warned that using this parameter will only be successful in the region that has a significant height variability. We will use the third-order model to calculate the distortions for case 2, i.e., two distortion parameters for two different regions. The STDs of case 1 with one distortion parameter for the entire country and case 2 calculating two different distortion parameters for two regions were 8.2 and 7.8 cm, respectively. Thanks to calculating the distortions for different regions, we obtained more accurate results (0.4 cm). We detected 6 GNSS/levelling points with large residuals that were rejected from the computation according to the assumption of a normal distribution. We will use 796 points with STD of 7.5 cm to calculate the offset model. The distortions and residuals in this case are shown in Figure 7a,b.
From the residuals calculated above, we used the LSC method in GRAVSOFT GEOGRID program to interpolate to a 5’ grid. Computation of the empirical and fitted covariance functions of the residual height anomalies is required in LSC. The empirical covariance of the data has been computed and then fitted to the second-order Gauss Markov model. A correlation length of 16 km was found. We used GRAVSOFT GEOGRID to simulate employing 796 residual height anomalies with the correlation lengths of 10, 16, 30 and 40 km. The best result was obtained when the correlation length was 30 km. Therefore, a correlation length of 30 km was used to calculate a 5’ grid of the residual height anomalies. An offset model was then created by adding residual offset to the distortion component. The cross-validation technique was used to assess the gravimetric quasigeoid and offset model employing GNSS/levelling points with 796 LSC runs in this case.
Table 6 shows the absolute differences between the 796 GNSS/levelling points and gravimetric quasigeoid model adding offset model. The descriptive statistics for the cross-validation technique are presented (first row), with the STD being 0.065 m. The outliers were determined according to the assumption of a normal distribution. There were 17 points that were rejected. So, a total of 779 points was used to calculate and validate the models. The case when all the GNSS/levelling data (779 points) were used to create and test the offset model was also presented (third row). Using all the GNSS/levelling data to create and test the offset model had an STD of 0.034 m, whereas using the cross-validation technique had an STD of 0.059 m. This demonstrates the importance of applying a cross-validation technique, which gives a more realistic error estimate than the pure fit statistics. The results are shown in Figure 7c. Table 6 also shows the descriptive statistics for the relative case, using 779 GNSS/levelling points. The results indicated that we can use the gravimetric quasigeoid model plus the offset model to convert ellipsoidal heights to local normal heights with an accuracy that complies with fourth-order levelling specifications for the whole of Vietnam (99.93%), while 98.14% of the baselines complied with third-order levelling specifications. This suggests that these models allow GNSS levelling to comply with third-order levelling specifications over most of Vietnam, except for some mountainous areas where quality and distribution of gravity data were not good. Especially over the areas of the two major cities of Vietnam, Hanoi (20.5° to 21.5° in latitude, 105° to 106° in longitude) and HCMC (10° to 11° in latitude, 106° to 107° in longitude), the third-order levelling network specifications were met with only 8/468 and 13/384 baselines, respectively, out of specifications.

4.2. Estimation of the Geopotential Value W0 for the VLVD

Given the availability of high-quality GNSS/levelling data and the GEOID_LSC model, we were able to determine a more accurate geopotential value W0 for the VLDV using the differences in height anomalies derived from them. The geopotential number (C) is the potential difference between an equipotential surface (Wi) and a reference equipotential surface. National datum from traditional levelling realizes by selecting as their zero point O a coastal tide gauge and setting it a geopotential value W 0 L V D , while a geoid/quasigeoid model realizes the origin of a global datum (W0). The geopotential number for point i can be written as [44,45]
C i = W 0 W i
C i L V D = W 0 L V D W i
The geopotential number difference can be determined by Equations (11) and (12):
Δ C i = W 0 W 0 L V D
Over the GNSS/levelling points we may calculate the differences of geopotential number. Consequently, we may determine the geopotential value for the LVD by simply averaging:
W ¯ 0 L V D = i = 1 m W 0 L V D m = W 0 i = 1 m Δ C i m = W 0 δ W L V D
where Δ C i is given by the differences between height anomalies from GNSS/levelling measurements and those derived from GEOID_COL, and the mean normal gravity value ( γ ¯ ) is computed by Equation (4-60) in Hofmann-Wellenhof and Moritz (2006) [29]:
Δ C i = ε i γ ¯ i
The free-air terrestrial gravity anomalies are derived from measured gravity (g) and normal gravity (γ) and the free-air reduction calculated from the normal height (for the purpose of gravity reduction from the surface to the quasigeoid) according to Hofmann-Wellenhof and Moritz (2006) [29]:
Δ g = g g H H γ
As the normal height is biased due to datum offset ( δ H ) between LVD and quasigeoid (about 69 cm in Vietnam), gravity anomalies will be biased by
g H δ H = 0.3086 × 0.69 0.2   m G a l
This systematic distortion is constant and affects the calculation of height anomalies due to gravity anomalies that are biased. Therefore, this unknown offset affects the computed quasigeoid. In HSU, it is called indirect bias because it affects the computation of the datum offset value. According to Gerlach and Rummel (2013) [46], indirect bias can be neglected in computing offset value ε if a GGM derived from GOCE with n > 200 is used to compute the height anomaly component (ζ) in Equation (2) when performing calculations in Europe. In a study performed by Gatti et al. (2013) [47], a similar result was also found in their numerical investigation over 11 large datum zones globally. Amjadiparvar et al. (2016) [48] also performed research on indirect effects in North America; the indirect term was found less than 1 cm if a GGM up to at least degree n=180 was used. Here, GEOID_LSC model was computed using GGM_DIR5 up to degree 260. Hence, this effect component can be removed in the computation offset value. This problem will be calculated and clarified for this region in our next study.
Given the preceding analysis, tilts existed in the levelling data; hence, they should be removed from the observations in the computation of ε. However, we only removed the tilts, and thus the difference between LVD and reference equipotential surface was retained. Equation (2) is rewritten as follows:
ε ¯ + a i T x + v i = ζ i G N S S / l e v e l l i n g ζ i ζ 0
where ε ¯ is mean of the differences between height anomalies from GNSS/levelling measurements and those derived from GEOID_COL ( ε i ). It is a tilted offset of VLVD (this offset value that differs from the true LVD offset value) because the tilts exist in the levelling data. The term a i T x absorbs the tilts, and v i represents the random error of the height anomalies.
Therefore, we also used the third-order polynomial model shown in Section 2 for removing tilt effects. However, it should be noted that this model should not contain any constant components, which in turn implies that the constant term a0 must be omitted in this computation. The height anomalies from good 779 GNSS/levelling points after correcting the subsidence for the Mekong Delta was used for estimating W 0 LVD . Calculation of two tilt parameters for two regions, southern (<17° in latitude) and northern part (>17° in latitude), was also used in this case. The results are shown in Table 7 where the improvement in the STD between the null and third-order model with two parameters was significant. Therefore, the results calculated from the third-order model with two parameters were used to estimate W 0 L V D employing Equation (14). A gravity potential W 0 L V D = 62,636,846.81 ± 0.70 m2s−2 for the LVD of Vietnam has been determined as an offset to the equipotential surface realized by the conventional value W0 = 62,636,853.4 m2s−2.

5. Conclusions

A vertical offset model has been generated for Vietnam using a gravimetric-only quasigeoid model (GEOID_COL) and 779 GNSS/levelling points. The cross-validation technique was used to validate the offset model, and an STD of 5.9 cm was obtained. Using the GEOID_LSC model and adding the offset model allows GNSS levelling to comply with fourth-order levelling specifications for Vietnam and third-order levelling specifications for most of the country, excepting some mountainous areas where quality and distribution of gravity data are not good. Especially in the area of surrounding Hanoi and Ho Chi Minh City, these models allow GNSS levelling to comply with third-order levelling specifications. This model can be applied in modernizing the height reference system in Vietnam by adding this offset model to available levelling data. This study used the annual subsidence rate grid estimated from ALOS-1 observations to correct and improve the accuracy for 47 GNSS/levelling points in the Mekong Delta, thereby making the average bias of this region the same size with the remaining part. Therefore, the accuracy of the offset model is significantly improved.
We also used the differences between height anomalies from high-quality GNSS/levelling data, removed tilt effects and corrected land subsidence, and those derived from GEOID_COL gravimetric-only quasigeoid model to compute the geopotential value W0 for the existing LVD in Vietnam. The gravity potential of the VLVD is estimated equal to W 0 L V D = 62,636,846.81 ± 0.70 m2s−2 with the global equipotential surface realized by the conventional value W0 = 62,636,853.4 m2s−2. With this gravity potential value, we can thus connect the height system of Vietnam with the neighboring countries.

Supplementary Materials

The following are available online at https://www.mdpi.com/2072-4292/12/5/817/s1, Figure S1: Time-series of heights plots of 8 stations provided by the Institute of Geophysics (IGP) – Vietnam Academy of Science and Technology (VAST) (a) MTEV station; (b) MLAY station; (c) DBIV station; (d) SMAV station; (e) PHUT station; (f) VINH station; (g) HUES station and (h) BACL station. Figure S2: Time-series of heights plots of 3 stations provided by the Vietnam Department of Surveying and Mapping (VDSM) (a) DSRS station; (b) QNRS station and (c) VTRS station.

Author Contributions

All of the authors of the present work contributed to the discussion of the results. Conceptualization, methodology, D.T.V., S.B. (Sean Bruinsma) and S.B. (Sylvain Bonvalot); software, D.T.V.; validation D.T.V., S.B. (Sean Bruinsma), S.B. (Sylvain Bonvalot), D.R. and G.S.V.; formal analysis, D.T.V., S.B. (Sean Bruinsma) and S.B. (Sylvain Bonvalot); investigation, D.T.V.; data curation, D.T.V.; writing—original draft preparation, D.T.V.; writing—review and editing, D.T.V., S.B. (Sean Bruinsma), S.B. (Sylvain Bonvalot), D.R. and G.S.V.; supervision, S.B. (Sean Bruinsma) and S.B. (Sylvain Bonvalot). All authors have read and agreed to the published version of the manuscript.

Funding

Dinh Toan VU received funding from the Vietnamese Government’s 911 project and University Paul Sabatier (UPS)-GET. This study was also supported by CNES.

Acknowledgments

We are very grateful to the VDSM, IGP-VAST and BGI (http://bgi.obs-mip.fr/) that supplied data for this study. We thank CNES for financial support through the TOSCA committee. The authors would like to thank the authors of GRAVSOFT (DTU) and GINS (CNES) for providing their software package. We thank Laura E Erban for providing the processing results of ALOS-1. We thank Huy Minh Le (IGP-VAST) for providing the processing results of 8 GNSS stations. The processing results of Sentinel-1 are available from project EMSN057 via https://emergency.copernicus.eu/mapping/list-of-components/EMSN057. In this paper, we used the GMT for producing some figures. We would like to thank the two anonymous reviewers for their constructive comments and helpful suggestions.

Conflicts of Interest

The authors declare no conflicts of interest.

References

  1. Lemoine, F.G.; Kenyon, S.C.; Factor, J.K.; Trimmer, R.G.; Pavlis, N.K.; Chinn, D.S.; Cox, C.M.; Klosko, S.M.; Luthcke, S.B.; Torrence, M.H.; et al. The Development of the Joint NASA GSFC and the National Imagery and Mapping Agency (NIMA) Geopotential Model EGM96. 1998; p. 584. Available online: https://ntrs.nasa.gov/search.jsp?R=19980218814 (accessed on 28 January 2020).
  2. Pavlis, N.K.; Holmes, S.A.; Kenyon, S.C.; Factor, J.K. The development and evaluation of the Earth Gravitational Model 2008 (EGM2008). J. Geophys. Res. Solid Earth 2012, 117. [Google Scholar] [CrossRef] [Green Version]
  3. Vu, D.T.; Bruinsma, S.; Bonvalot, S. A high-resolution gravimetric quasigeoid model for Vietnam. Earth Planets Space 2019, 71, 65. [Google Scholar] [CrossRef]
  4. Featherstone, W.E.; Sproule, D.; Goos, J.; Kirby, J.; Kuhn, M.; Claessens, S.J. Towards the new AusGeoid model. In Proceedings of SSC2005 Spatial Intelligence, Innovation and Praxis: The National Biennial Conference of the Spatial Sciences Institute, September 2005; Spatial Sciences Institute: Melbourne, Australia, 2005; ISBN 0-9581366-2-9. [Google Scholar]
  5. Brown, N.J.; Featherstone, W.E.; Hu, G.; Johnston, G.M. AUSGeoid09: A more direct and more accurate model for converting ellipsoidal heights to AHD heights. J. Spat. Sci. 2011, 56, 27–37. [Google Scholar] [CrossRef]
  6. Brown, N.J.; McCubbine, J.C.; Featherstone, W.E.; Gowans, N.; Woods, A.; Baran, I. AUSGeoid2020 combined gravimetric–geometric model: Location-specific uncertainties and baseline-length-dependent error decorrelation. J. Geod. 2018, 92, 1457–1465. [Google Scholar] [CrossRef] [Green Version]
  7. Kuroishi, Y.; Ando, H.; Fukuda, Y. A new hybrid geoid model for Japan, GSIGEO2000. J. Geod. 2002, 76, 428–436. [Google Scholar] [CrossRef]
  8. Miyahara, B.; Kodama, T.; Kuroishi, Y. Development of New Hybrid Geoid Model for Japan, “GSIGEO2011”. 2014, Volume 10. Available online: https://www.semanticscholar.org/paper/Development-of-new-hybrid-geoid-model-for-Japan-%2C-%E2%80%9C-Miyahara-Kodama/9218fa00c80813084355b096ea1efe84c2d21f1c (accessed on 28 January 2020).
  9. Lee, S.B.; Auh, S.C.; Seo, D.Y. Evaluation of global and regional geoid models in South Korea by using terrestrial and GNSS data. KSCE J. Civ. Eng. 2017, 21, 1905–1911. [Google Scholar] [CrossRef]
  10. Dumrongchai, P.; Wichienchareon, C.; Promtong, C. Local geoid modeling for Thailand. Int. J. Geoinform. 2012, 8, 15–26. [Google Scholar]
  11. Gatchalian, R.; Forsberg, R.; Olesen, A. PGM2016: A New Geoid Model for the Philippines; Report of National Mapping and Resource Information Authority (NAMRIA). Department of Environmental and Natural Resources, Republic of The Philippines: Quezon City, Philippines, 2016; p. 27. Available online: http://www.isgeoid.polimi.it/Geoid/Asia/Philippines/new_geoid_for_the_philippines.pdf (accessed on 28 January 2020).
  12. Ismail, M.K.; Din, A.H.M.; Uti, M.N.; Omar, A.H. Establishment of New Fitted Geoid Model in Universiti Teknologi Malaysia. Available online: https://www.researchgate.net/publication/328683742 (accessed on 22 November 2018).
  13. Chen, Y.-Q.; Luo, Z. A hybrid method to determine a local geoid model—Case study. Earth Planets Space 2004, 56, 419–427. [Google Scholar] [CrossRef] [Green Version]
  14. Entin, I.I. Main systematic errors in precise levelling. Bull. Geod. 1959, 52, 37–45. [Google Scholar] [CrossRef]
  15. Geodetic Leveling and Its Applications—Vanicek—1980—Reviews of Geophysics—Wiley Online Library. Available online: https://agupubs.onlinelibrary.wiley.com/doi/abs/10.1029/RG018i002p00505 (accessed on 22 November 2019).
  16. Amos, M. New Zealand vertical datum 2009. New Zealand Surv. 2010, 300, 5–16. [Google Scholar]
  17. Hayden, T.; Amjadiparvar, B.; Rangelova, E.; Sideris, M.G. Estimating Canadian vertical datum offsets using GNSS/levelling benchmark information and GOCE global geopotential models. J. Geod. Sci. 2013, 2, 257–269. [Google Scholar] [CrossRef] [Green Version]
  18. Amjadiparvar, B.; Rangelova, E.V.; Sideris, M.G.; Véronneau, M. North American height datums and their offsets: The effect of GOCE omission errors and systematic levelling effects. J. Appl. Geod. 2013, 7, 39–50. [Google Scholar] [CrossRef]
  19. Featherstone, W.E.; Filmer, M.S. A New GPS-based evaluation of distortions in the Australian Height Datum in Western Australia. J. R. Soc. West. Aust. 2008, 91, 199–206. [Google Scholar]
  20. Erban, L.E.; Gorelick, S.M.; Zebker, H.A. Groundwater extraction, land subsidence, and sea-level rise in the Mekong Delta, Vietnam. Environ. Res. Lett. 2014, 9, 084010. [Google Scholar] [CrossRef]
  21. Minderhoud, P.S.J.; Erkens, G.; Pham, V.H.; Bui, V.T.; Erban, L.; Kooi, H.; Stouthamer, E. Impacts of 25 years of groundwater extraction on subsidence in the Mekong delta, Vietnam. Environ. Res. Lett. 2017, 12, 064006. [Google Scholar] [CrossRef]
  22. Reyes, R.B.; Nagai, M.; Kamiya, Y.; Tipdecho, T.; Ninsawat, S. Effect of sea level rise in the validation of geopotential/geoid models in Metro Manila, Philippines. Surv. Rev. 2015, 47, 211–219. [Google Scholar] [CrossRef]
  23. Kasenda, A.; Kearsley, A.H.W. Towards the Establishment of an Indonesian Unified Vertical Datum. In Vertical Reference Systems; Drewes, H., Dodson, A.H., Fortes, L.P.S., Sánchez, L., Sandoval, P., Eds.; Springer: Berlin/Heidelberg, Germany, 2002; pp. 334–338. [Google Scholar]
  24. Amos, M.J.; Featherstone, W.E. Unification of New Zealand’s local vertical datums: Iterative gravimetric quasigeoid computations. J. Geod. 2009, 83, 57–68. [Google Scholar] [CrossRef] [Green Version]
  25. Rapp, R.H.; Balasubramania, N. A Conceptual Formulation of a World Height System; Department of Geodetic Science and Surveying, The Ohio State University: Columbus, OH, USA, 1992. [Google Scholar]
  26. Tran, T.; Nguyen, X.H.; Le, Q.H.; Doan, T.T.H. Updated trend of change of sea level of the east sea, Vietnam. Sci. Tech. Hydro-Meteorol. J. 2015, 657, 25–30. [Google Scholar]
  27. Sánchez, L.; Čunderlík, R.; Dayoub, N.; Mikula, K.; Minarechová, Z.; Šíma, Z.; Vatrt, V.; Vojtíšková, M. A conventional value for the geoid reference potential $$W {0}$$W0. J. Geod. 2016, 90, 815–835. [Google Scholar] [CrossRef]
  28. Fotopoulos, G. An Analysis on the Optimal Combination of Geoid, Orthometric and Ellipsoidal Height Data. Ph.D. Thesis, University of Calgary, Calgary, AB, Canada, December 2003. [Google Scholar]
  29. Hofmann-Wellenhof, B.; Moritz, H. Physical Geodesy, 2nd ed.; Springer: Berlin/Heidelberg, Germany, 2006; ISBN 978-3-211-33544-4. [Google Scholar]
  30. NIMA. Deparment of Defense World Geodectic System 1984. 2000, p. 169. Available online: https://earth-info.nga.mil/GandG/publications/tr8350.2/wgs84fin.pdf (accessed on 28 January 2020).
  31. Iliffe, J.C.; Ziebart, M.; Cross, P.A.; Forsberg, R.; Strykowski, G.; Tscherning, C.C. Osgm02: A New Model for Converting Gps-Derived Heights to Local Height Datums in Great Britain and Ireland. Surv. Rev. 2003, 37, 276–293. [Google Scholar] [CrossRef]
  32. Forsberg, R.; Tscherning, C.C. An Overview Manual for the GRAVSOFT Geodetic Gravity Field Modelling Programs; DTU Space: Copenhagen, Denmark, 2008. [Google Scholar]
  33. Farr, T.G.; Rosen, P.A.; Caro, E.; Crippen, R.; Duren, R.; Hensley, S.; Kobrick, M.; Paller, M.; Rodriguez, E.; Roth, L.; et al. The Shuttle Radar Topography Mission. Rev. Geophys. 2007, 45. Available online: https://agupubs.onlinelibrary.wiley.com/doi/full/10.1029/2005RG000183 (accessed on 28 January 2020). [CrossRef] [Green Version]
  34. Becker, J.J.; Sandwell, D.T.; Smith, W.H.F.; Braud, J.; Binder, B.; Depner, J.; Fabre, D.; Factor, J.; Ingalls, S.; Kim, S.-H.; et al. Global Bathymetry and Elevation Data at 30 Arc Seconds Resolution: SRTM30_PLUS. Mar. Geod. 2009, 32, 355–371. [Google Scholar] [CrossRef]
  35. Pham, H.L. Final Report: Research on Establishing the Height System Unification for Vietnam on the Basis without Using the Mean Sea Level; The Vietnam Institute of Geodesy and Cartography (VIGAC): Hanoi, Vietnam, 2009. (In Vietnamese) [Google Scholar]
  36. Wessel, P.; Smith, W.H.F. New, improved version of generic mapping tools released. EOS Trans. Am. Geophys. Union 1998, 79, 579. [Google Scholar] [CrossRef]
  37. Drinkwater, M.R.; Floberghagen, R.; Haagmans, R.; Muzi, D.; Popescu, A. GOCE: ESA’s First Earth Explorer Core Mission. In Earth Gravity Field from Space—From Sensors to Earth Sciences; Space Sciences Series of ISSI; Springer: Berlin/Heidelberg, Germany, 2003; pp. 419–432. ISBN 978-90-481-6334-2. [Google Scholar]
  38. Bruinsma, S.L.; Förste, C.; Abrikosov, O.; Lemoine, J.-M.; Marty, J.-C.; Mulet, S.; Rio, M.-H.; Bonvalot, S. ESA’s satellite-only gravity field model via the direct approach based on all GOCE data. Geophys. Res. Lett. 2014, 41, 7508–7514. [Google Scholar] [CrossRef] [Green Version]
  39. Featherstone, W.E.; Lyon, T.J.; McCubbine, J.C. Potentially Misleading GPS Leveling–Based Assessment of Gravimetric Geoid or Quasigeoid Models due to Vertical Land Motion and Different GPS Processing Software. J. Surv. Eng. 2019, 145, 04019015. [Google Scholar] [CrossRef]
  40. Marty, J.C. Algorithmic Documentation of the GINS Software. Available online: https://www5.obs-mip.fr/wp-content-omp/uploads/sites/28/2017/11/GINS_Algo_2013.pdf (accessed on 28 January 2020).
  41. Copernicus Emergency Management Service. Available online: https://emergency.copernicus.eu/mapping/list-of-components/EMSN057 (accessed on 19 November 2019).
  42. Minh, D.H.T.; Van Trung, L.; Toan, T.L. Mapping Ground Subsidence Phenomena in Ho Chi Minh City through the Radar Interferometry Technique Using ALOS PALSAR Data. Remote Sens. 2015, 7, 8543–8562. [Google Scholar] [CrossRef] [Green Version]
  43. Kotsakis, C.; Katsambalos, K.; Ampatzidis, D. Estimation of the zero-height geopotential level WoLVDin a local vertical datum from inversion of co-located GPS, leveling and geoid heights: A case study in the Hellenic islands. J. Geod. 2012, 86, 423–439. [Google Scholar] [CrossRef]
  44. Tocho, C.; Vergos, G.S. Estimation of the Geopotential Value W0 for the Local Vertical Datum of Argentina Using EGM2008 and GPS/Levelling Data W0LVD. In IAG 150 Years; Rizos, C., Willis, P., Eds.; Springer International Publishing: Cham, Switzerland, 2016; pp. 271–279. [Google Scholar]
  45. Vergos, G.S.; Erol, B.; Natsiopoulos, D.A.; Grigoriadis, V.N.; Işık, M.S.; Tziavos, I.N. Preliminary results of GOCE-based height system unification between Greece and Turkey over marine and land areas. Acta Geod. Geophys. 2018, 53, 61–79. [Google Scholar] [CrossRef]
  46. Gerlach, C.; Rummel, R. Global height system unification with GOCE: A simulation study on the indirect bias term in the GBVP approach. J. Geod. 2013, 87, 57–67. [Google Scholar] [CrossRef]
  47. Gatti, A.; Reguzzoni, M.; Venuti, G. The height datum problem and the role of satellite gravity models. J. Geod. 2013, 87, 15–22. [Google Scholar] [CrossRef]
  48. Amjadiparvar, B.; Rangelova, E.; Sideris, M.G. The GBVP approach for vertical datum unification: Recent results in North America. J. Geod. 2016, 90, 45–63. [Google Scholar] [CrossRef]
Figure 1. Schematic flow of offset model determination.
Remotesensing 12 00817 g001
Figure 2. Global Navigation Satellite System (GNSS)/levelling data: yellow dots are first- and second-order levelling benchmarks, whereas purple dots denote third-order ones.
Remotesensing 12 00817 g002
Figure 3. (a) Differences between GNSS/levelling data and GEOID_LSC; (b) Linear regression on the differences of GNSS/levelling data and GEOID_LSC in northern (>21° in latitude) and near coast (points within 50 km from the coastline) and (c) Differences between GNSS/levelling data and DIR/EGM (d/o 719) plus RTM effects.
Remotesensing 12 00817 g003
Figure 4. Magnitude of relative differences between GEOID_LSC with 803 GNSS/levelling points over 21,423 baselines (blue), fourth-order tolerance (orange) and third-order tolerance (purple).
Remotesensing 12 00817 g004
Figure 5. Vertical land motion rates from permanent GNSS stations.
Remotesensing 12 00817 g005
Figure 6. (a) Differences of GNSS/levelling data and GEOID_LSC in the southern region; (b) Linear regression on the differences of GEOID_LSC and GNSS/levelling data in the southern region; (c) InSAR results derived for the period 2006–2010 from ALOS-1 provided by Dr Laura E Erban [20] and (d) InSAR results derived for the period 2015–2018 from Sentinel-1, project EMSN057 [41].
Remotesensing 12 00817 g006
Figure 7. (a) Distortions, (b) residuals and (c) differences between the 779 GNSS/levelling points and gravimetric quasigeoid model adding offset model.
Remotesensing 12 00817 g007
Table 1. Statistics of selected local hybrid geoid or quasigeoid models.
NoCountry, RegionNameYearSTD (cm)Geoid TypeReference
1AustraliaAUSGeoid98200511.8Hybrid quasigeoid[4]
AUSGeoid0920093.0Hybrid quasigeoid[5]
AUSGeoid202020182.7Hybrid quasigeoid[6]
2JapanGSIGEO200020024.0Hybrid geoid[7]
GSIGEO201120141.8Hybrid geoid[8]
3South KoreaKNGeoid1320135.4Hybrid geoid[9]
KNGeoid1420145.2Hybrid geoid[9]
4ThailandTHAI12H201215.8Hybrid geoid[10]
5PhilippinesPGM201620162.2Hybrid geoid[11]
6Peninsular (Malaysia)VMGEOID0420185.0Hybrid geoid[12]
Sabah and Sarawak (Malaysia)EMGEOID05201810.0Hybrid geoid[12]
7Hong KongHKGEOID-200020041.7Hybrid geoid[13]
8ShenzhenSZGEOID-200120041.4Hybrid geoid[13]
Table 2. Descriptive statistics of the absolute (residuals) and relative differences between the 812 GNSS/levelling stations and GEOID_LSC. Unit: (m).
Absolute Differences
MeanSTDMaxMinOutlier Points
ζGNSS/levelling – ζLSC (812 points)0.6800.0970.9870.3109
ζGNSS/levelling – ζLSC (excluding outliers) (803 points)0.6820.0920.9370.3960
ζGNSS/levelling – ζDIR/EGM+RTM (803 points)0.6820.1681.1380.119
ζGNSS/levelling – ζLSC (North-east part) (190 points)0.7050.0770.8790.459
ζGNSS/levelling – ζLSC (Southern, <11°) (120 points)0.6340.0920.9370.402
Relative Differences
MeanSTDMaxMinOutlier third-orderOutlier fourth-order
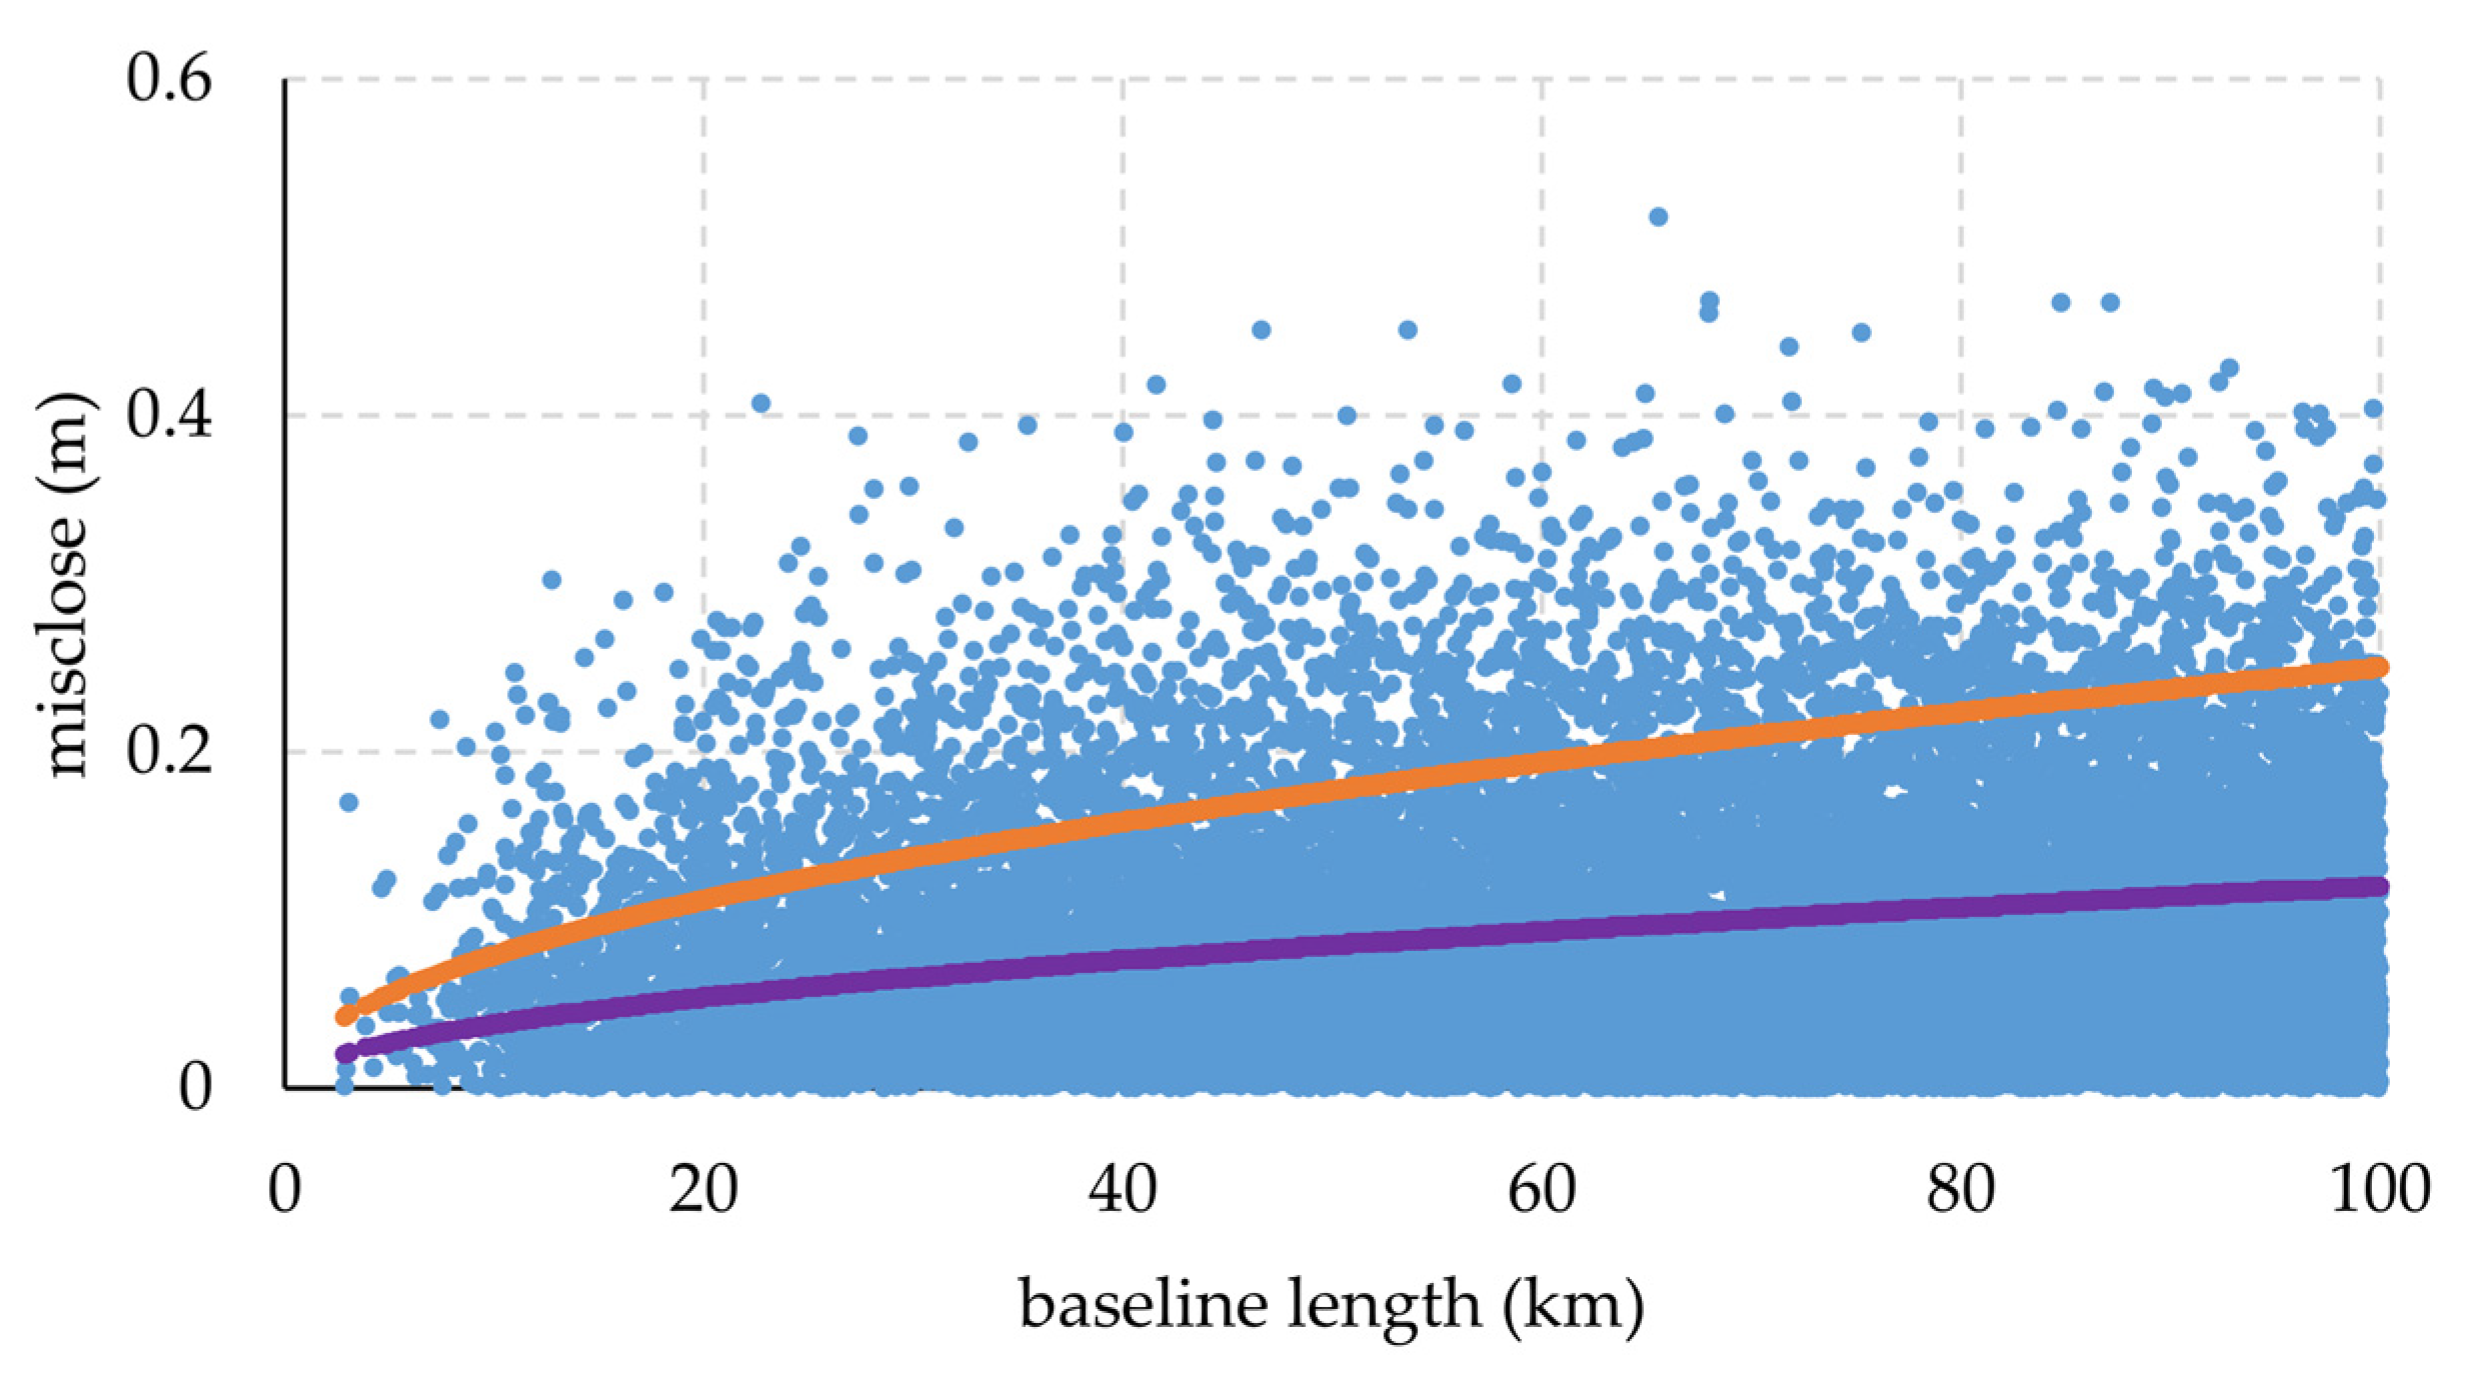
∆ζGNSS/levelling – ∆ζLSC (803 points) (21,423 baselines)0.0870.0710.51808153 (38.06%)2052 (9.58%)
Table 3. Relative differences between 803 GNSS/levelling points and GEOID_LSC, per baseline length (every 10 km) (NoB: Number of Baselines). Unit: (m).
10 km20 km30 km40 km50 km60 km70 km80 km90 km100 kmAll
NoB967601356177622152505284530683334346821,423
mean0.0550.0650.0770.0820.0840.0890.0890.0910.0900.0930.087
STD0.0450.0550.0630.0660.0700.0720.0730.0720.0730.0740.071
Max0.2190.3020.4070.3940.4510.4510.5180.4490.4670.4280.518
min0.0010000000000
Northern Part
NoB3423137653064775185486810049986294
mean0.0440.0750.0800.0840.0830.0890.0920.0940.0930.0930.089
STD0.0300.0610.0660.0660.0690.0710.0710.0690.0720.0720.070
Max0.1200.2950.3220.3160.3900.4000.4680.3960.3920.4040.468
min0.0010000000000
Points Near the Coast (within 50 km from the coastline)
NoB182023123573803693473613363213003
mean0.0420.0550.0670.0730.0720.0790.0780.0740.0740.750.073
STD0.0370.0490.0550.0660.0670.0670.0650.0600.0690.0690.064
Max0.1380.2900.3880.3330.4180.3630.3840.4080.4670.3520.467
min0.00700000.00100000
Table 4. Descriptive statistics of the differences between the GNSS/levelling data corrected in Mekong Delta and GEOID_LSC. Unit: (m).
MeanSTDMaxMinOutlier Points
ζGNSS/levelling – ζLSC (Southern, <11°) (120 points)0.6340.0920.9370.402
ζGNSS/levelling – ζLSC (>11°) (683 points)0.6900.0890.9330.396
ζGNSS/levelling_cor – ζLSC (Southern, <11°) (120 points)0.6640.0850.9370.459
ζGNSS/levelling_cor – ζLSC (803 points)0.6860.0890.9370.3961
ζGNSS/levelling_cor – ζLSC (excluding outliers) (802 points)0.6870.0880.9370.423
Table 5. Residual of the differences between GNSS/levelling data and GEOID_LSC model. Unit: (m).
MeanSTDMaxMinOutlier Points
Linear (802 points)00.0870.285−0.296
Second-order (802 points)00.0850.265−0.326
Third-order (802 points)00.0820.262−0296
Helmert model (802 points)00.0860.285−0.316
case 2 (Third-order) (802 points)00.0780.252−0.2886
case 2 (Third-order) outlier (796 points)00.0750.225−0.223
Table 6. Descriptive statistics of the differences between the GNSS/levelling data and gravimetric quasigeoid adding offset model with baseline length < 100 km. Unit: (m).
Absolute Differences
MeanSTDMaxMinOutlier Points
ζGNSS/levelling – ζLSC-ε (796 points)
(cross-validation)
00.0650.250−0.29117
ζGNSS/levelling – ζLSC-ε (779 points)
(excluding outliers)
(cross-validation)
00.0590.170−0.170
ζGNSS/levelling – ζLSC-ε (779 points)00.0340.099−0.109
ζGNSS/levelling – ζLSC-ε (Hanoi) (32 points)−0.0040.0470.109−0.092
ζGNSS/levelling – ζLSC-ε (HCMC) (29 points)−0.0010.0550.104−0.139
Relative Differences
MeanSTDMaxMinOutlier 3rd OrderOutlier 4th Order
∆ζGNSS/levelling – ∆ζLSC-∆ε (779 points) (20,243 baselines)0.0260.0200.1090377 (1.86%)14 (0.07%)
∆ζGNSS/levelling – ∆ζLSC-∆ε (Hanoi) (469 baselines)0.0240.0180.0740.00380
∆ζGNSS/levelling – ∆ζLSC-∆ε (HCMC) (384 baselines)0.0250.0190.0850.085130
Table 7. Descriptive statistics of the differences between the GNSS/levelling data removed tilt effects and GEOID_LSC. Reference geopotential values W 0 L V D for the VLVD with the global reference level realized by the conventional value W0 = 62,636,853.4 m2s−2. Unit: (m).
MeanSTDMaxMin
Null model0.6880.0830.9120.435
Third-order0.6930.0750.8970.458
Third-order (two parameters)0.6890.0710.9020.478
δ W L V D 6.60 ± 0.70 (m2s−2) W 0 L V D 62,636,846.81 ± 0.70 (m2s−2)

