Article

Geospatial Modeling of the Tombolo Phenomenon in Sopot using Integrated Geodetic and Hydrographic Measurement Methods

1
Department of Transport and Logistics, Gdynia Maritime University, Morska 81-87, 81-225 Gdynia, Poland
2
Department of Geodesy and Oceanography, Gdynia Maritime University, Morska 81-87, 81-225 Gdynia, Poland
3
Department of Marine Electrical Power Engineering, Gdynia Maritime University, Morska 81-87, 81-225 Gdynia, Poland
4
Department of Navigation and Hydrography, Polish Naval Academy, Śmidowicza 69, 81-127 Gdynia, Poland
*
Author to whom correspondence should be addressed.
Remote Sens. 2020, 12(4), 737; https://doi.org/10.3390/rs12040737
Submission received: 31 January 2020 / Revised: 18 February 2020 / Accepted: 21 February 2020 / Published: 23 February 2020
(This article belongs to the Special Issue 2nd Edition Radar and Sonar Imaging and Processing)

Abstract

:
A tombolo is a narrow belt connecting a mainland with an island lying near to the shore, formed as a result of sand and gravel being deposited by sea currents, most often created as a result of natural phenomena. However, it can also be caused by human activity, as is the case with the Sopot pier—a town located on the southern coast of the Baltic Sea in northern Poland (φ = 54°26’N, λ = 018°33’E). As a result, the seafloor rises constantly and the shoreline moves towards the sea. Moreover, there is the additional disturbing phenomenon consisting of the rising seafloor sand covering over the waterbody’s vegetation and threatening the city's spa character. Removal of the sand to another place has already been undertaken several times. There is a lack of precise geospatial data about the tombolo’s seafloor course, its size and spatial shape caused by only lowering the seafloor in random places, and the ongoing environmental degradation process. This article presents the results of extensive and integrated geodetic and hydrographic measurements, the purpose of which was to make a 3D model of the phenomena developing in Sopot. The measurements will help determine the size and speed of the geospatial changes. Most of the modern geodetic and hydrographic methods were used in the study of these phenomena. For the construction of the land part of geospatial model, the following were used: photos from the photogrammetric flight pass (unmanned aerial vehicle—UAV), laser scanning of the beach and piers, and satellite orthophotomaps for analysis of the coastline changes. In the sea part, bathymetric measurements were carried out with an unmanned surface vehicle (USV).

Graphical Abstract

1. Introduction

In the last century, as a result of climate change observed on a global and local scale [1], there has been an increase in sea level. This leads to an increased impact of waves on the sea shore, causing the shore to move inland [2,3]. Therefore, coastal states are increasingly forced to take a number of actions to maintain the current coastline course [4] and protect coastal infrastructure [5]. In parallel, it should be ensured that the steps taken minimize interference with and the impact on the natural environment [6].
Morphological changes in the coastal zone and the coastline course are most often due to natural factors. However, they can also be the result of human activity related to direct interference in the environment, as is the case here, where the marina construction caused a slowdown in the sediment transport along the coast, initiating the process of creating a tombolo. Sopot is one of the major Polish holiday and spa resorts situated on the Baltic Sea coast. The city has the longest wooden pier in Europe, which is regularly damaged by storms. In October 2009, a violent storm completely destroyed the wooden structure of the pier groyne. The only economically viable method for protecting the pier was to build two breakwaters from the southern and eastern sides. The waterbody bordered between these breakwaters and the pier groyne and head has become a natural marina [7]. In 2010, expert discussions and their opinions resulted in a decision to build a yacht marina in Sopot (3 basins, a maximum of 103 vessels: 40 large ones up to 14 m in length, and 63 smaller ones up to 10 m in length) for PLN 72 million. This seemingly undoubted decision is currently becoming a serious problem for the city, as the construction of the marina led to the local stoppage of the sand transport along the coast, which resulted in its accumulation between the marina and the shore and the shift of the coastline towards the sea (by approx. 50 m), and initiated the process of the inevitable formation of a peninsula in Sopot. Such an oceanographic phenomenon, known as a tombolo [8], is most frequently influenced by the course of beaches and coasts under natural conditions but can also result from human activities, as is the case in Sopot [9]. In the Bay of Gdańsk, the strongest surface wind waving is generated from direction N towards E. The waves that reach the beach in Sopot from the E direction hit diagonally against the shore and cause the movement of bottom sediments along the coast. After the marina was built, its breakwater significantly decreased the wave energy, moreover, waves are deflected at its ends (Figure 1b), which results in the formation of two vortexes (directed opposite to each other). Consequently, the seafloor between the marina (obstacle) and the shore is elevated upwards, which results in the development of a morphological formation known as a tombolo. It should be stressed that this phenomenon in Sopot is unique in Poland.
A detached breakwater (beach, coastal, offshore) as a marina in Sopot provides shelter from the waves, whereby the littoral transport behind the breakwater is decreased and the transport pattern adjacent to the breakwater is modified. These characteristics of a breakwater are utilised in different ways for various types of breakwaters by varying relevant parameters. The main parameter determining the future morphological form, which will be shaped as a result of the obstacle in Sopot, is the breakwater length relative to breakwater distance to shoreline (LB*) calculated according to the formula [10]:
L B * = L B d
where:
LB–breakwater length,
d–breakwater distance to shoreline.
Depending on the value of LB*, two basic accumulation forms can be created on the beach:
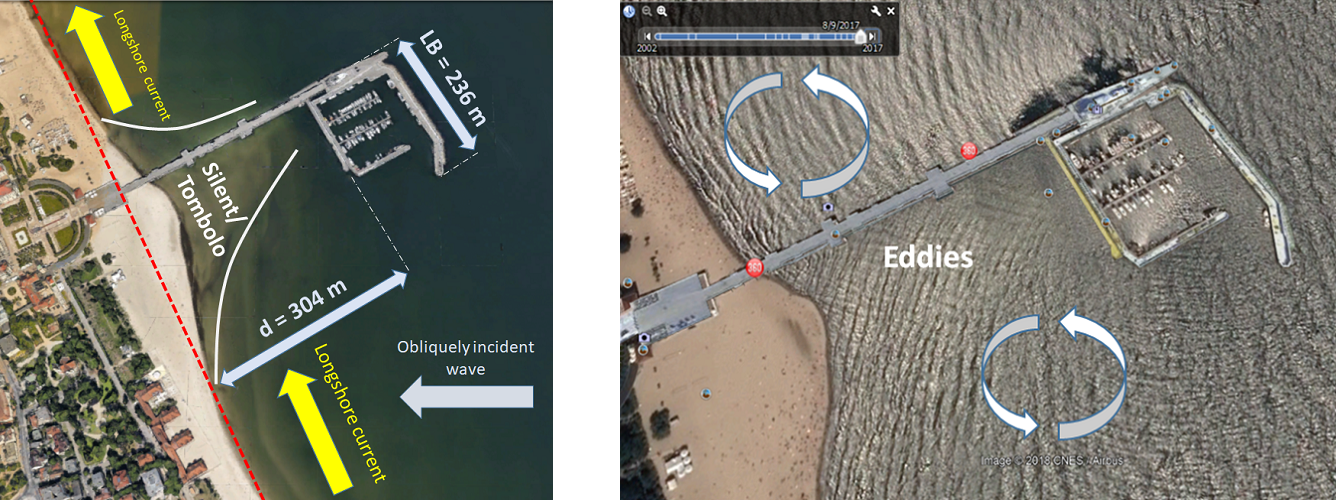
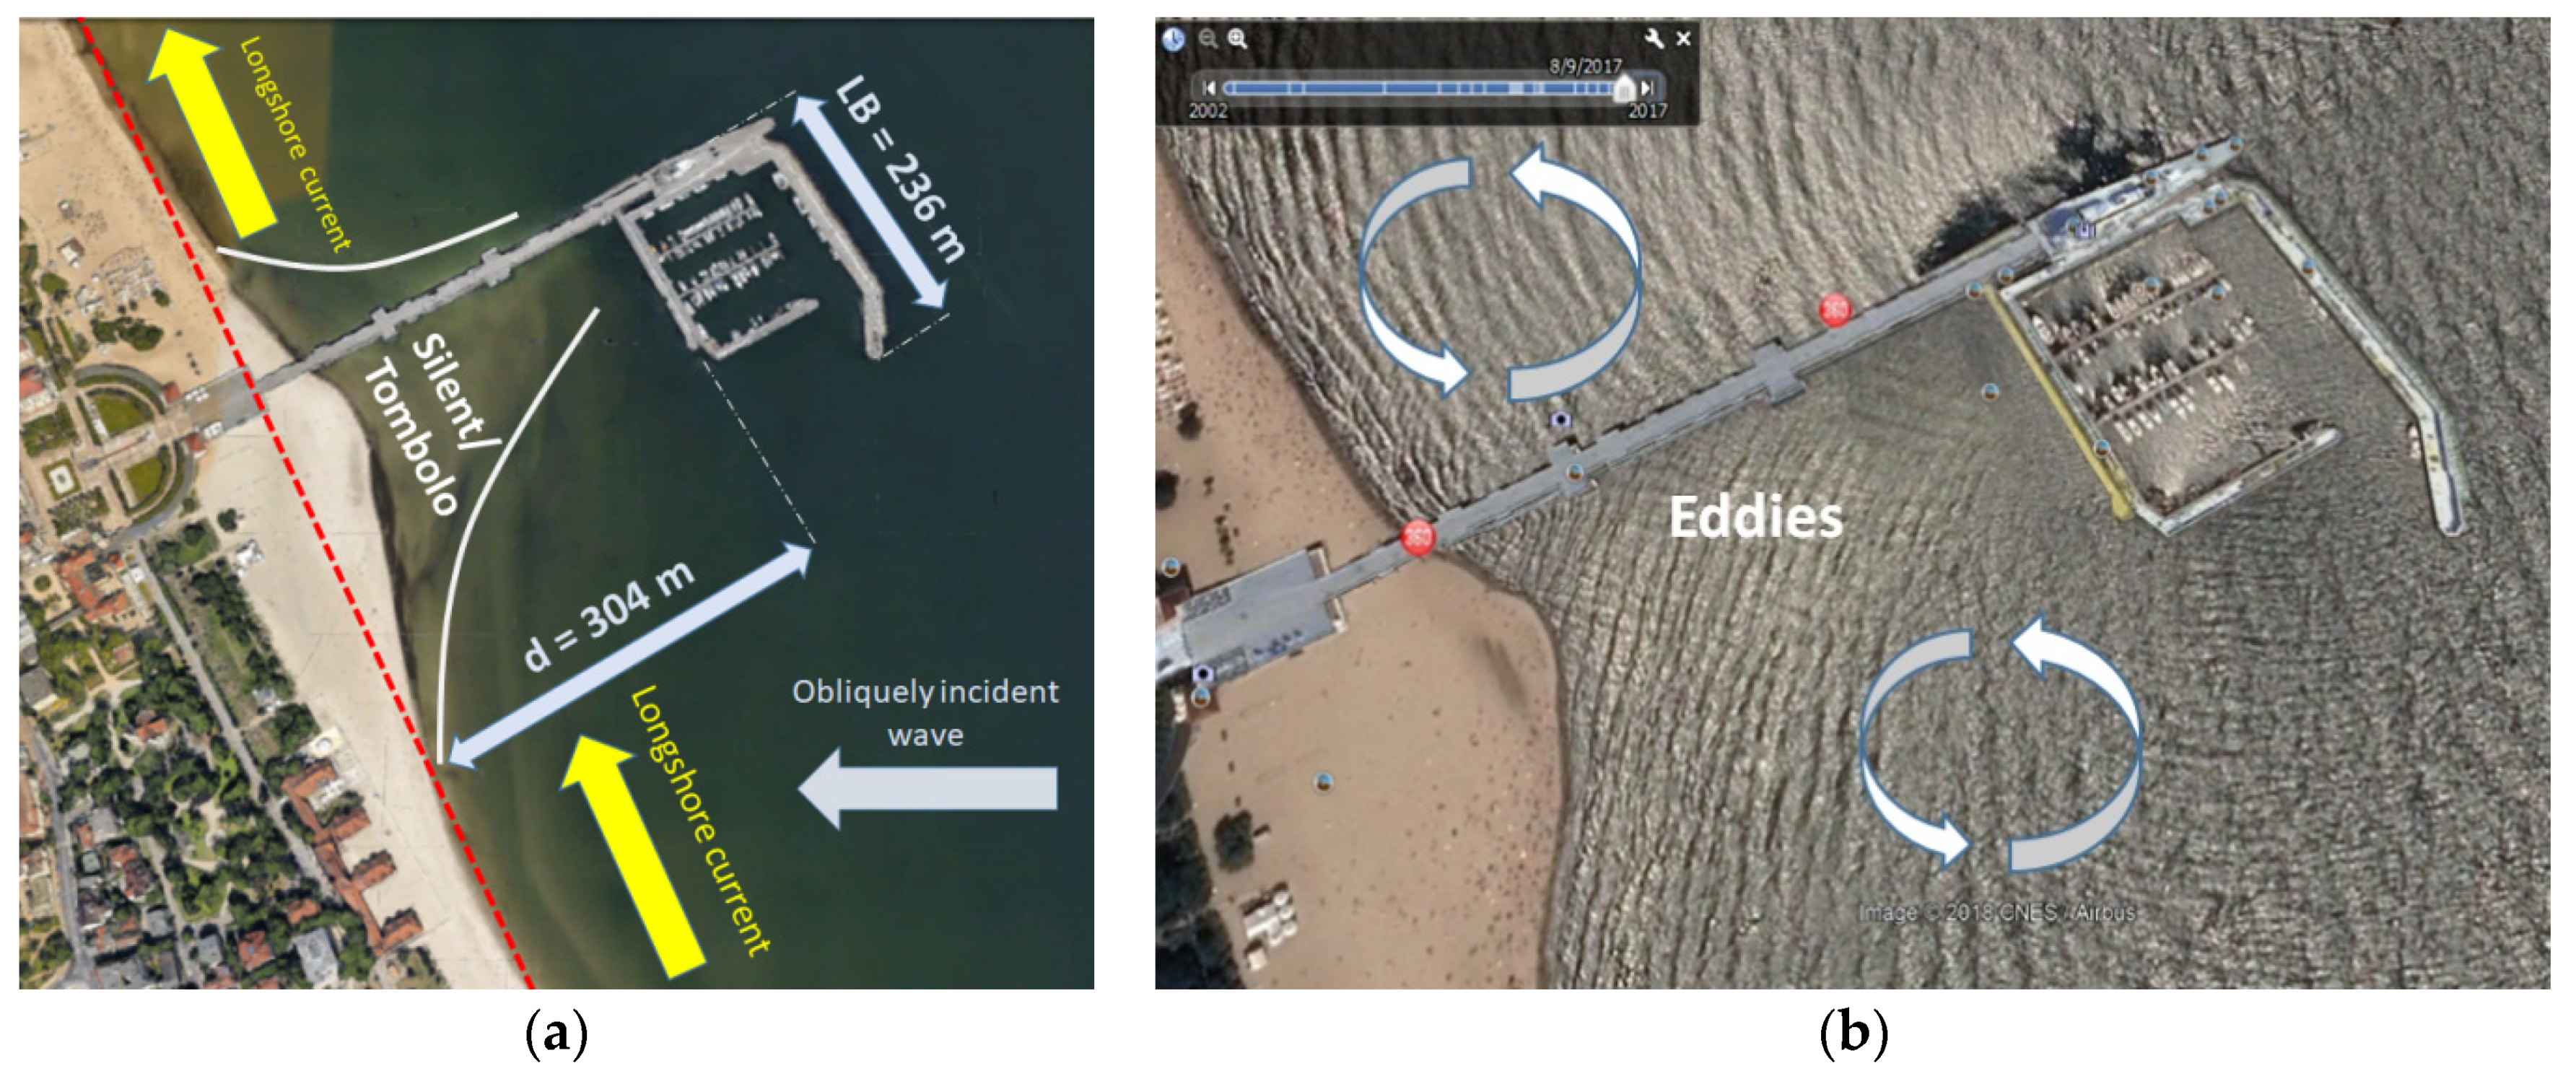
  • Salient: When LB* is less than approx. 0.6 to 0.7, a bell-shaped salient in the shoreline will form in the lee of the breakwater. However, parameters other than the breakwater length and distance also influence the accumulation pattern.
  • Tombolo: When LB* is greater than approx. 0.9 to 1.0, the sand accumulation behind the breakwater will connect the beach to the breakwater in a tombolo formation. But again, parameters other than the breakwater length and distance influence the accumulation pattern.
In the case of the marina in Sopot, LB* is 0.78, hence it is likely that a tombolo will eventually develop, which means that in the near future, a strip of land will be created connecting the pier with the shore and protruding above the water.
The purpose of this publication is to present the results of extensive and integrated geodetic and hydrographic measurements that enabled creation of a 3D model of the phenomenon developing in Sopot. This will enable the size and speed of geospatial changes to be determined.

2. Materials and Methods
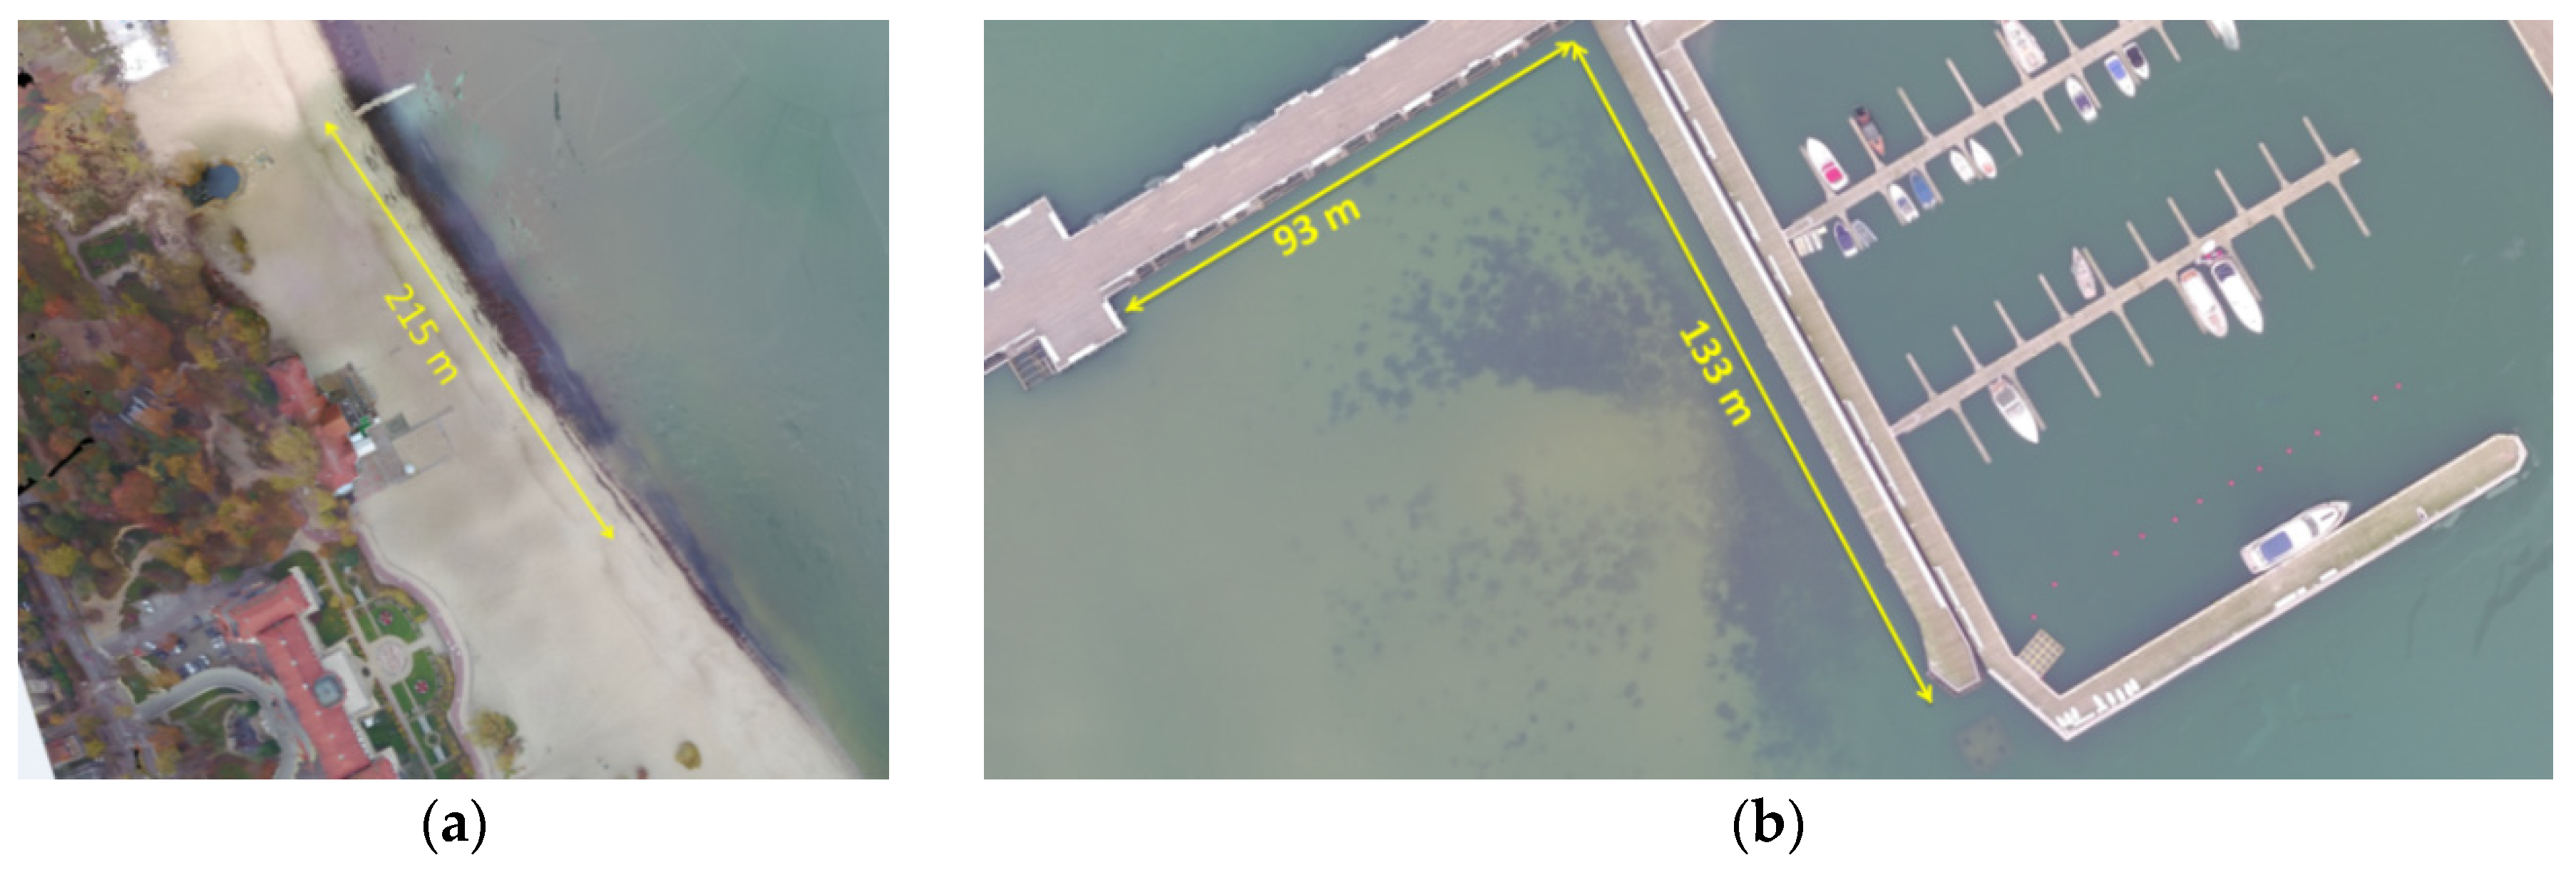
2.1. Study Area

In the literature on the subject, the process of modelling three-dimensional sediment transport has been described extensively and in detail in many publications [11,12]. It includes both the impact on the sea shore, as well as the influence on infrastructure and marine structures [13,14]. The diverse research approach to the authors’ problem results from different methods of modelling being taken into account: evolution [15], fixed profile [16], coupling area-line [17], area cross-shore–alongshore transport coupling [11,18], diffusion [14], wet-dry [19], hybrid [20], and cut-cell models [19]. It should be noted with reference to [21] that general wave-average area models may also have merits in simulating shoreline evolution for arbitrary geometry. However, the difficulty in the treatment of the shoreward boundary has hindered the use of this type of approach for simulation of shoreline evolution. The major defect is that it is impossible to simulate morphologic change above the wave-average water level, although it is more or less hidden for a macro-tidal environment. A preliminary analysis of the tombolo phenomenon in Sopot was made in study [9]. On this basis, the city of Sopot developed an approximate model for the phenomenon development (Figure 2) [22].
The developed model, or rather an explanatory figure, is of such a general nature that it prevents referring to coordinates and depth, which makes it impossible to precisely plan dredging works that the city of Sopot has been implementing for 3 years. Hence, direct measurements of the geospatial nature of the phenomenon are necessary from the point of view of assessing its size and planning dredging works for the seafloor (Figure 3) [22,23]. It should be noted that the city’s activity in the field of digging sand from the seafloor should be conducted in such a way as to seek restoration sediment transport along the coast and restart natural processes. Therefore, the geospatial distribution of the beach and the seafloor near the pier plays a key role here.
Over the last several years (after the yacht marina was built), the adverse effect of the Sopot tombolo phenomenon on the aquatic environment and humans has been noted (Figure 3) [22,23]. One of the local internet portals https://sopot.gmina.pl/ explains the cause of the phenomenon: “The emerging tombolo promotes the increasing occurrence of water stagnation and more rapid water heating, which creates more favourable conditions for the blooming of cyanobacteria and other microorganisms” [22]. Ms Magdalena Jachim, the spokeswoman for the Sopot City Hall, speaks in a similar tone: “This is not a thorough deepening, but a straightening of the coastline that will prevent the accumulation of waste and algae brought by the sea to the beach in this place” [24].
The quoted statements and source materials clearly show that Sopot is likely to lose its status as an international health resort. This is primarily due to the blooming of cyanobacteria and other bacteria, which repeatedly prevents bathing and swimming in this region throughout the year. In the summer time, a swimming prohibition has been repeatedly issued by the Pomeranian Voivodeship Sanitary and Epidemiological Station. In order to determine the geospatial scale of the phenomenon, a photogrammetric flight pass was performed using an unmanned aerial vehicle (UAV) in the vicinity of the Sopot pier.
The measurements were carried out at the end of October and the beginning of November 2018 (a period unfavourable to water blooming). Based on the study results, it can be concluded that the range of cyanobacteria, algae, and other microorganisms occurring in this area is significant. On both orthophotos they are marked with a dark green/black colour. Opposite the Grand Hotel in Sopot, the above-mentioned, 30 m wide blooming area is located along a 200 m stretch of the beach. On the other hand, Figure 4b presents cyanobacteria and algae blooming along the entire length of the yacht marina in Sopot, which stretches for several dozen meters towards the mainland [25].
Another factor having an adverse effect on the environment is the accumulation of sand in the vicinity of the marina. Despite the positive fact that the Sopot beach is expanding (under reconstruction), in other places the sand reaching the pier is taken away. The University of Gdańsk Professor Leszek Łęczyński, marine geology specialist, stated in an interview for the Gazeta Wyborcza paper that: “For years, we have been observing abrasion of the Orłowo Cliff, in my opinion, the material originating from there is being accumulated exactly near the Sopot pier” [26]. For example, in February 2018 as much as 1200 m2 of ground originating from this cliff slid down onto a beach in Gdynia Orłowo. The landslide itself was approx. 40 m long [27]. It should also be noted that the Orłowo Cliff is part of the Kępa Redłowska nature reserve. Therefore, this area represents a landscape typical of Gdynia, with natural characteristics primarily associated with the following values: natural (the cliff has a unique multi-layered structure comprising glaciofluvial sands, gravels and silts, glacial till, sand-gravel sediments, etc. [28]), historical (this is the first nature reserve in Pomeranian Voivodeship and one of the oldest in the country), and landscape (from the cliff one can see a panorama of the Hel Peninsula, the harbour in Gdynia, the Sopot pier, etc. [29]).
The growing coastal belt also poses a navigational hazard to shipping traffic in this region. The vessels moored to the jetty located in the eastern part of the pier and in the southern part of the yacht marina are at risk of damaging their hull structure. This is due to the fact that for the vast majority of the berthing area, the water depth is actually lower than 1.5 m, and the draft of both sailing and motorised vessels often exceeds 1–1.5 m, thus preventing them from sailing on these waters. It should be added that sailors may not be aware of this fact, because the official electronic navigational chart (ENC) from 2011 (Figure 5) shows that the isobaths increase linearly (and at equal distances) in relation to the beach coastline, and the water depth for the berthing area ranges from 2 to 5 m. Figure 5 shows a navigational chart (from OpenCPN 5.0 software), which uses official ENC cells used by marine vessels (ships, yachts, etc.). Therefore, it should be stressed that currently no official charts used in navigation include depth changes due to the tombolo phenomenon found near the Sopot pier. Hence, as part of the preliminary study, it was decided to carry out measurements to determine the current topography of the seafloor in this area.

2.2. Measurement Concept

In terms of measurement, the area where the tombolo phenomenon occurs is specific, placing high demands on surveyors and hydrographers regarding the measurement precision, as well as a need to use various advanced measurement techniques, such as:
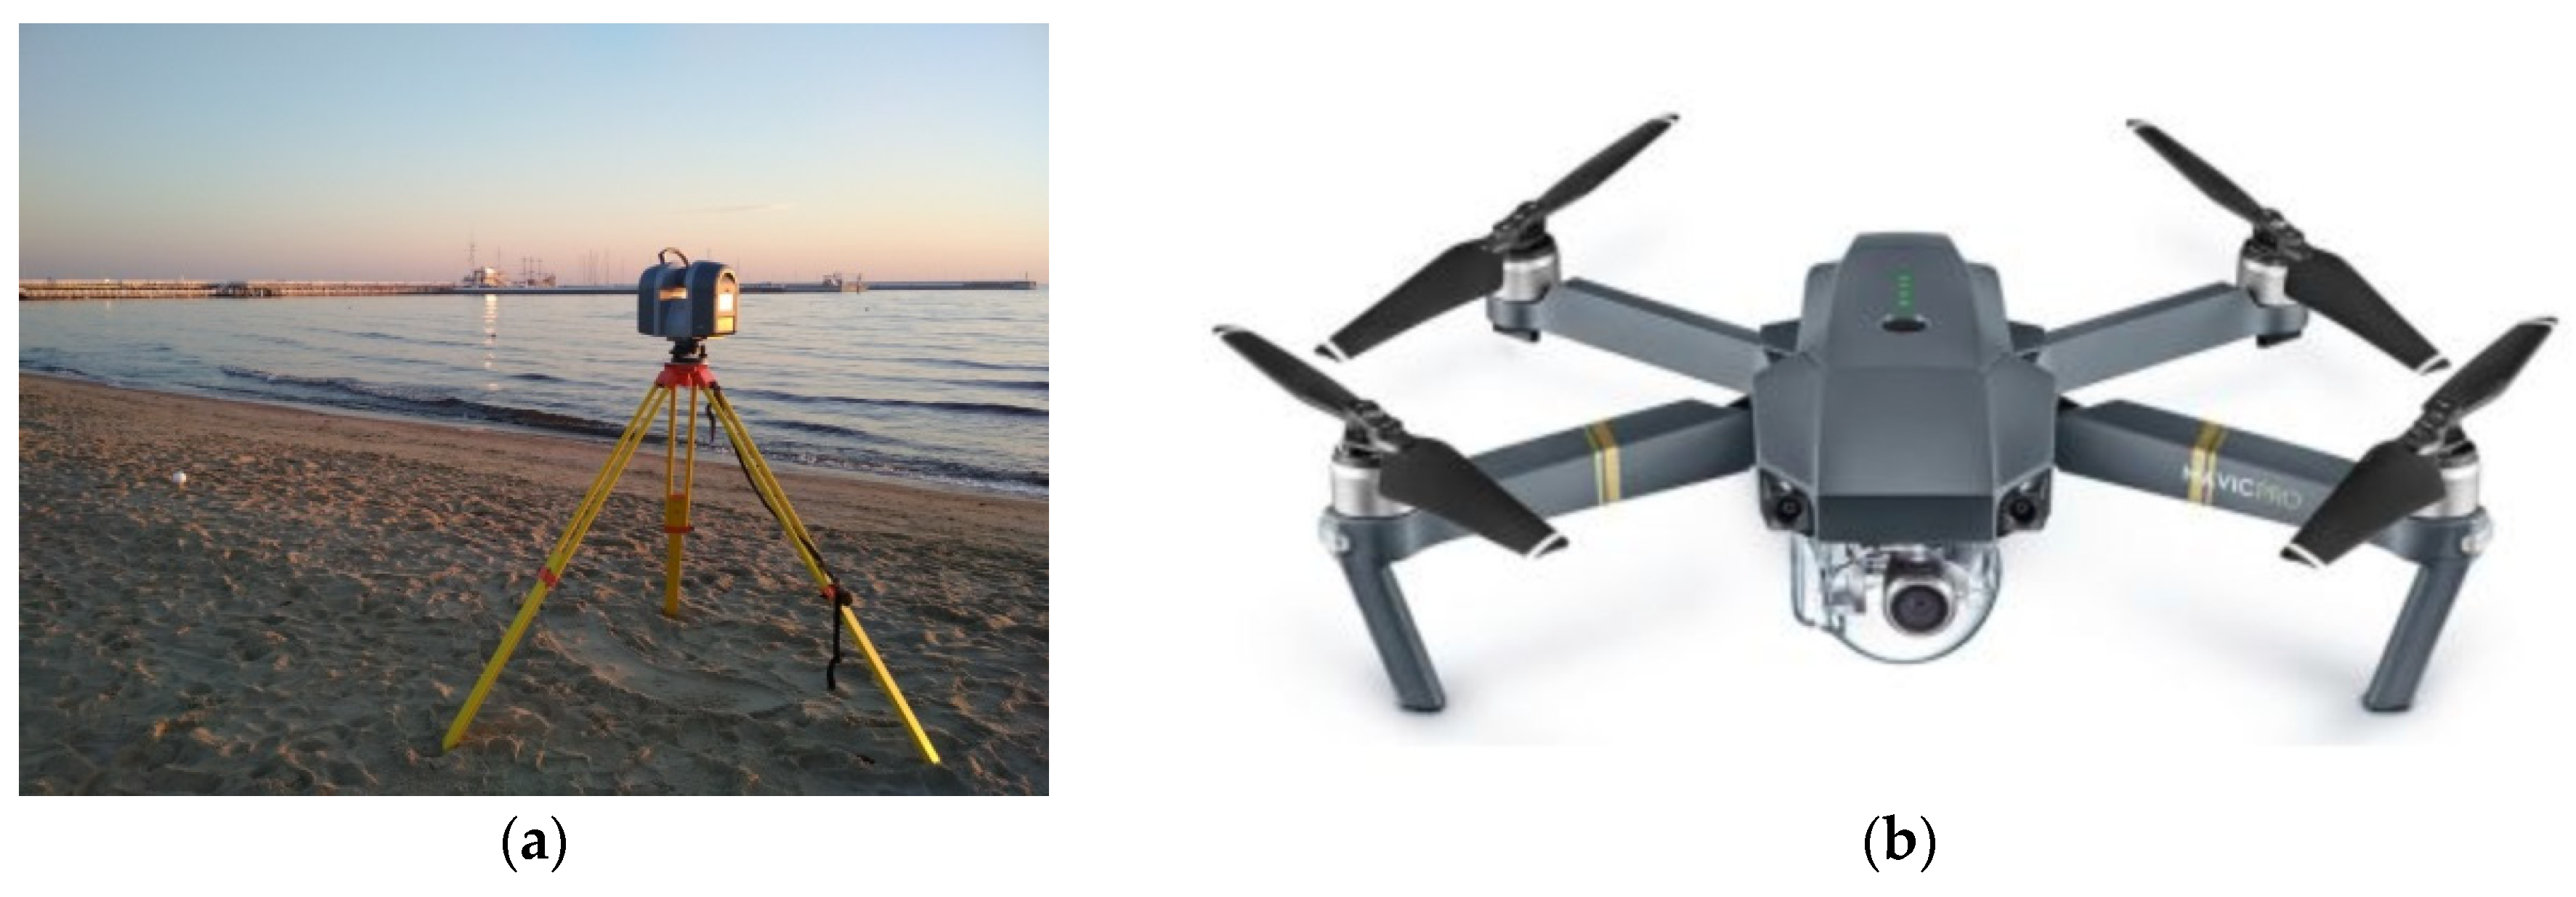
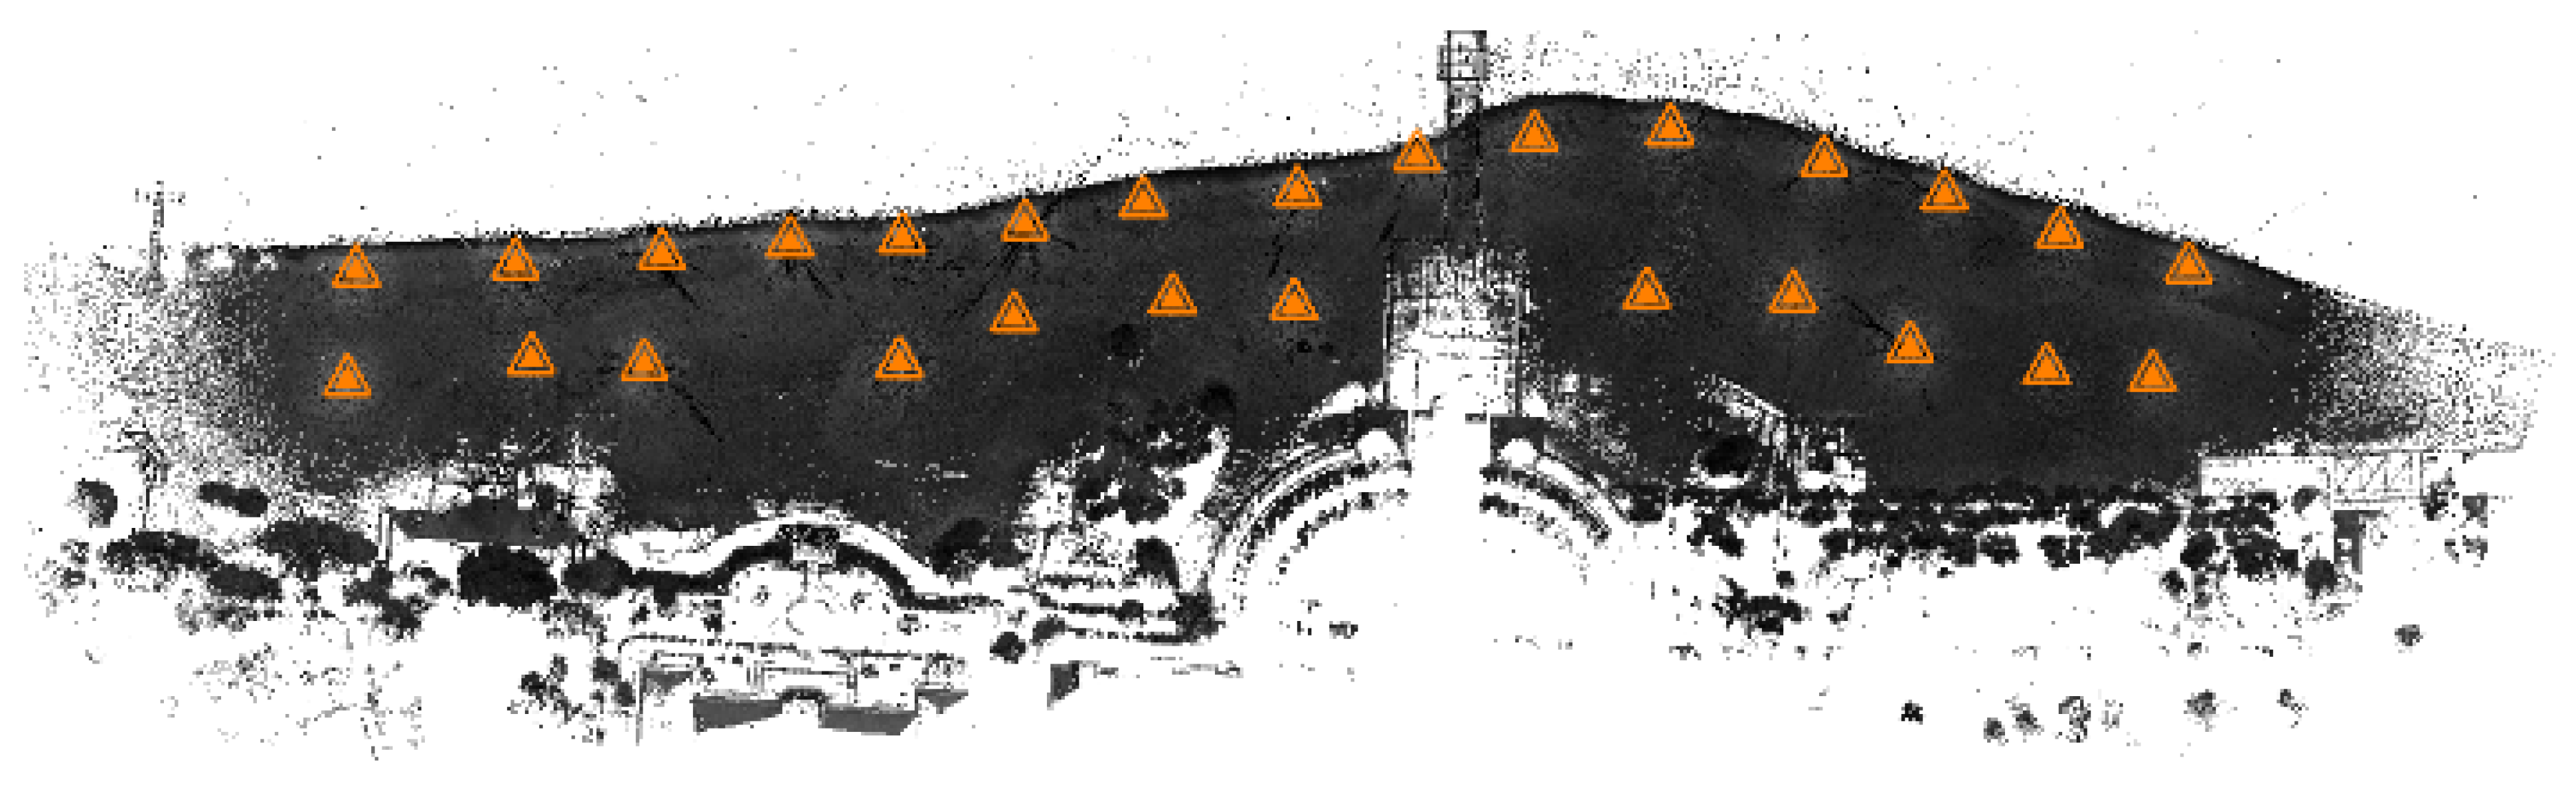
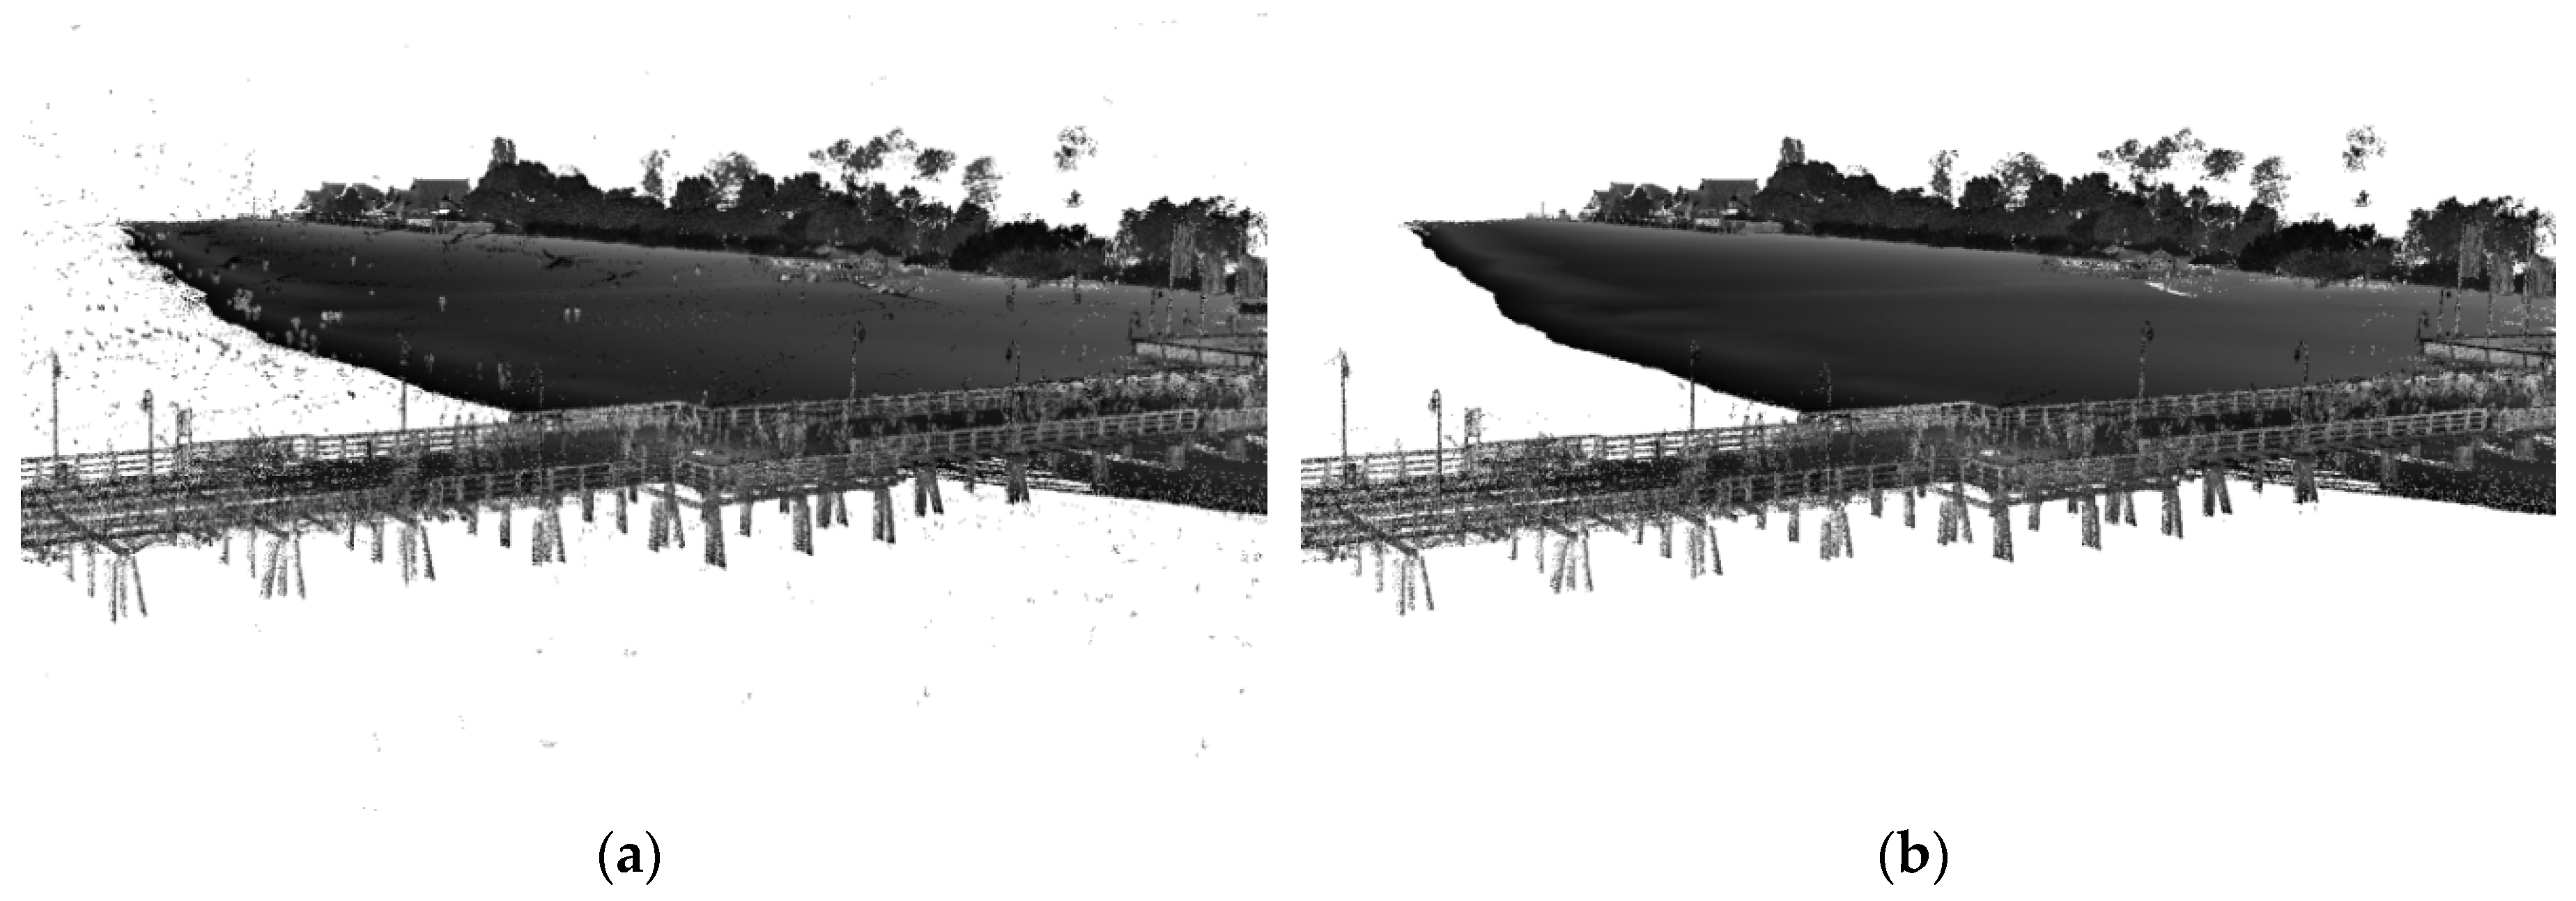
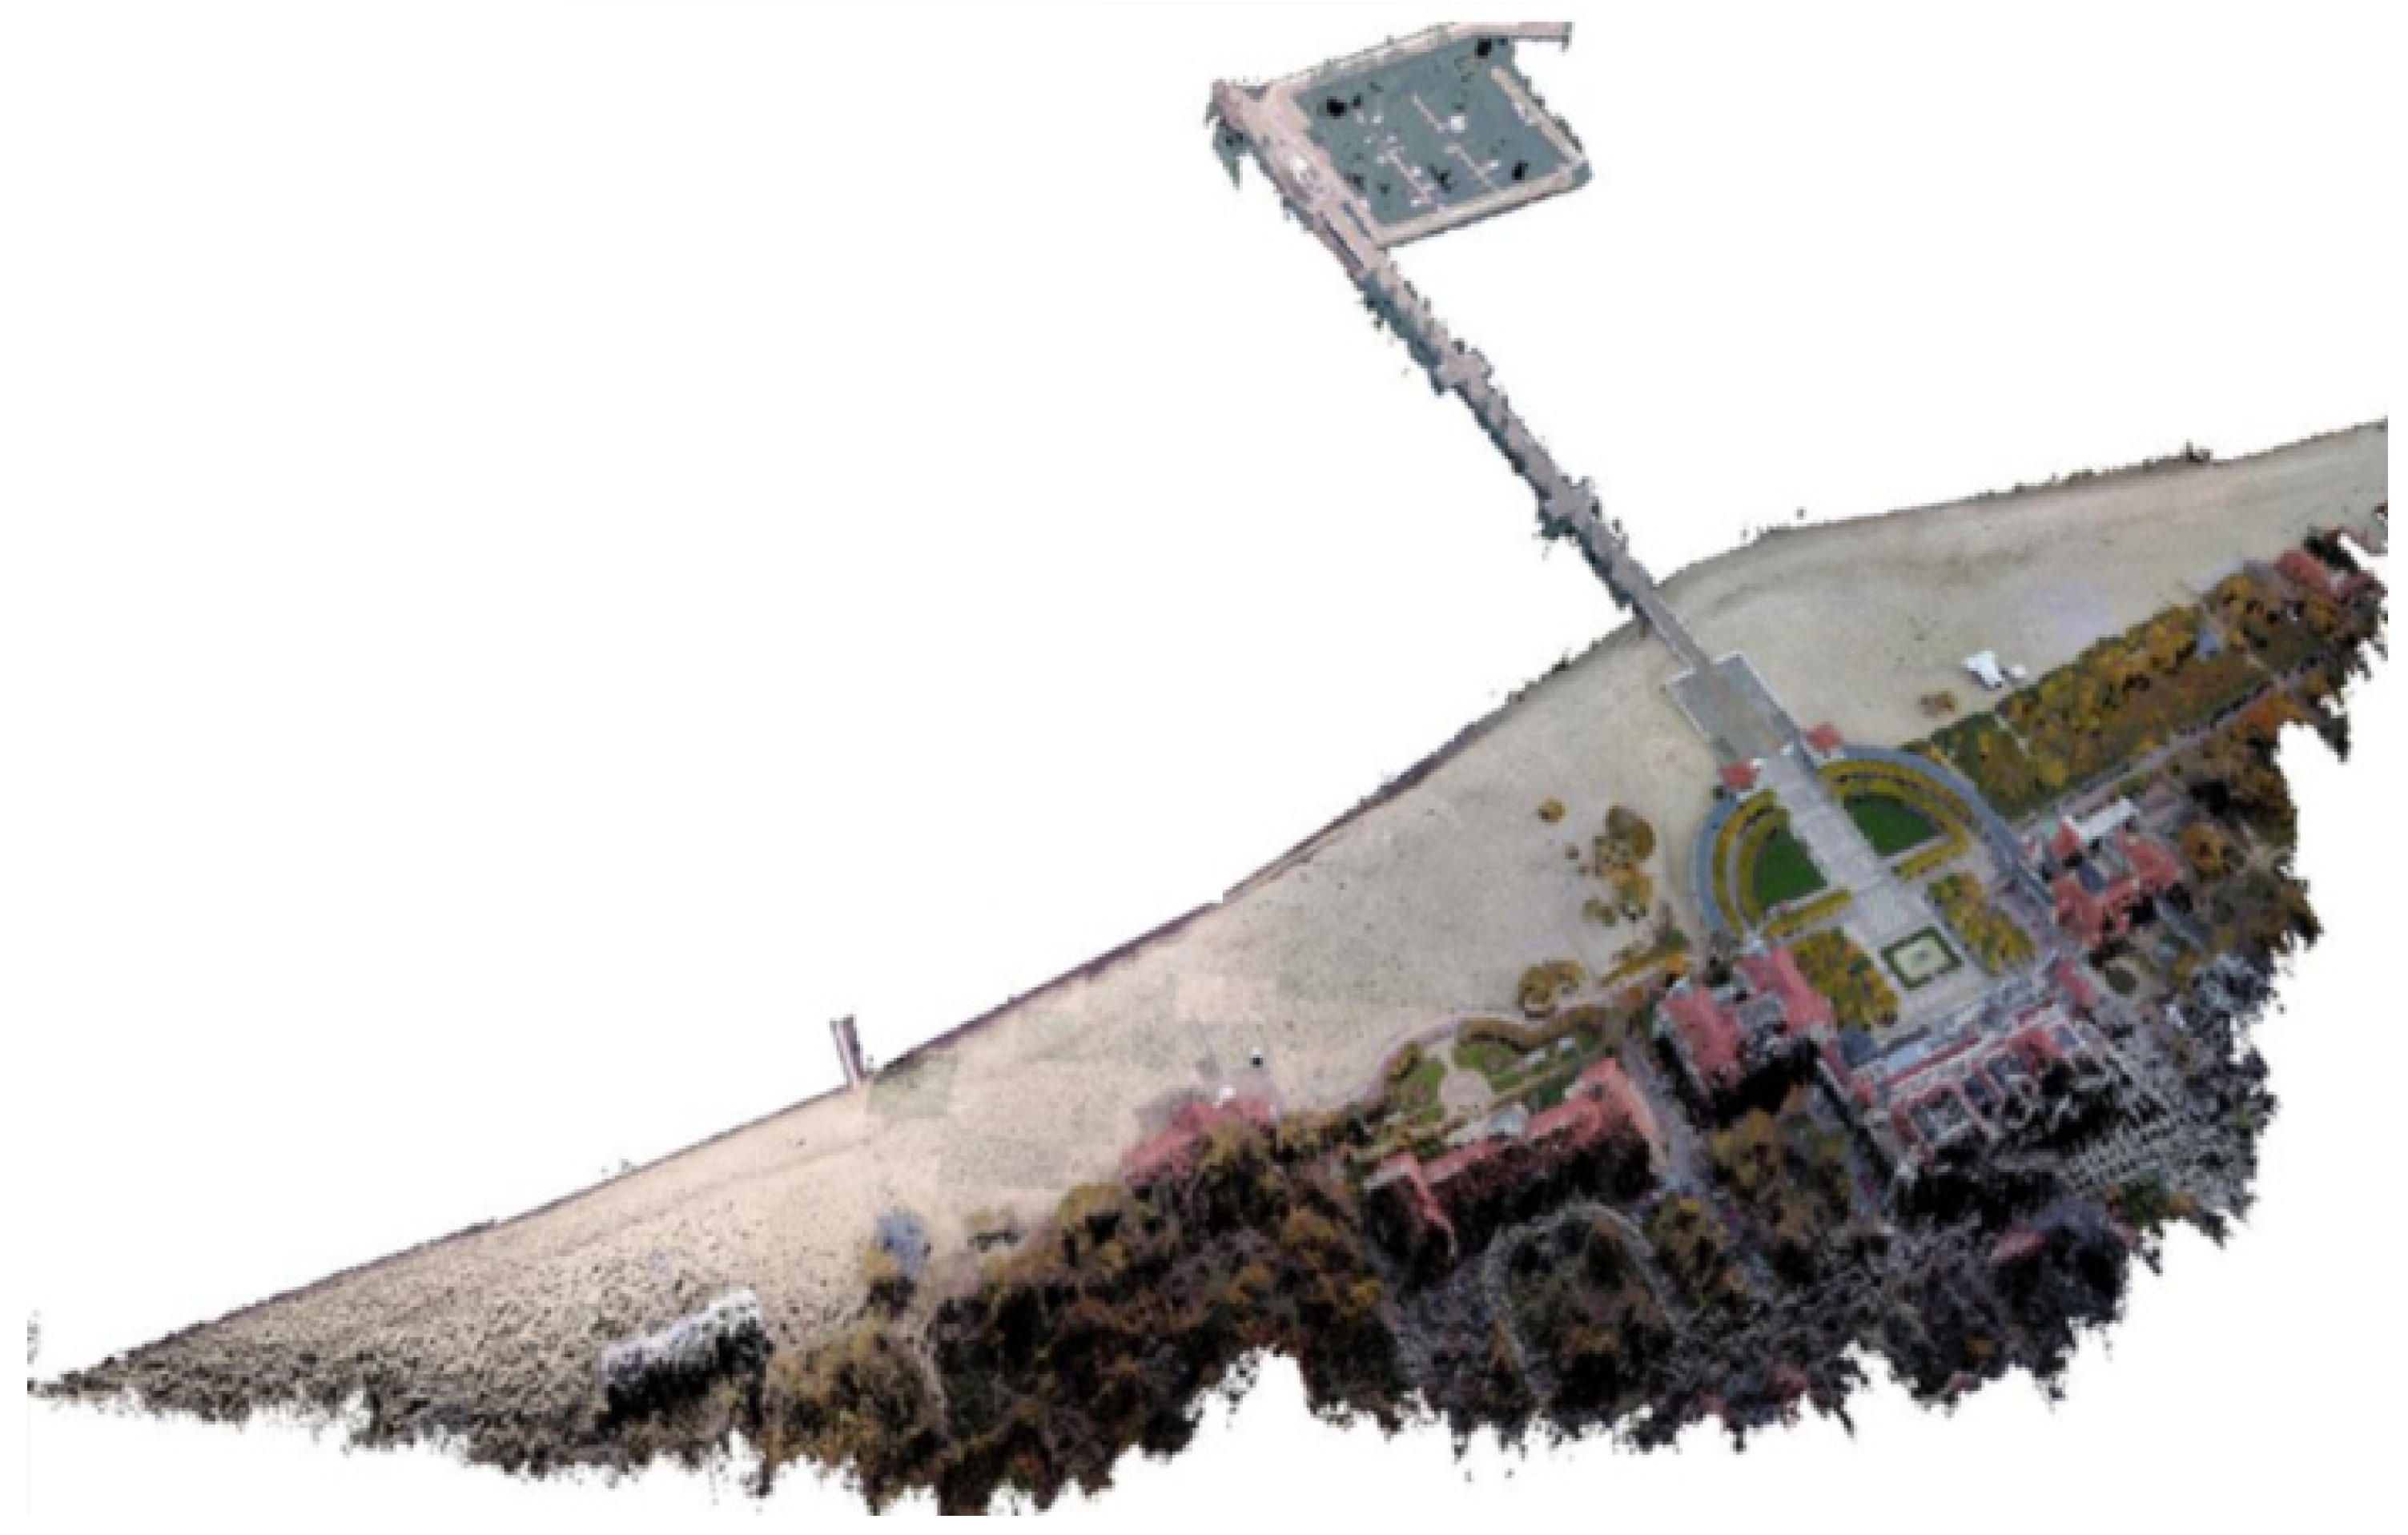
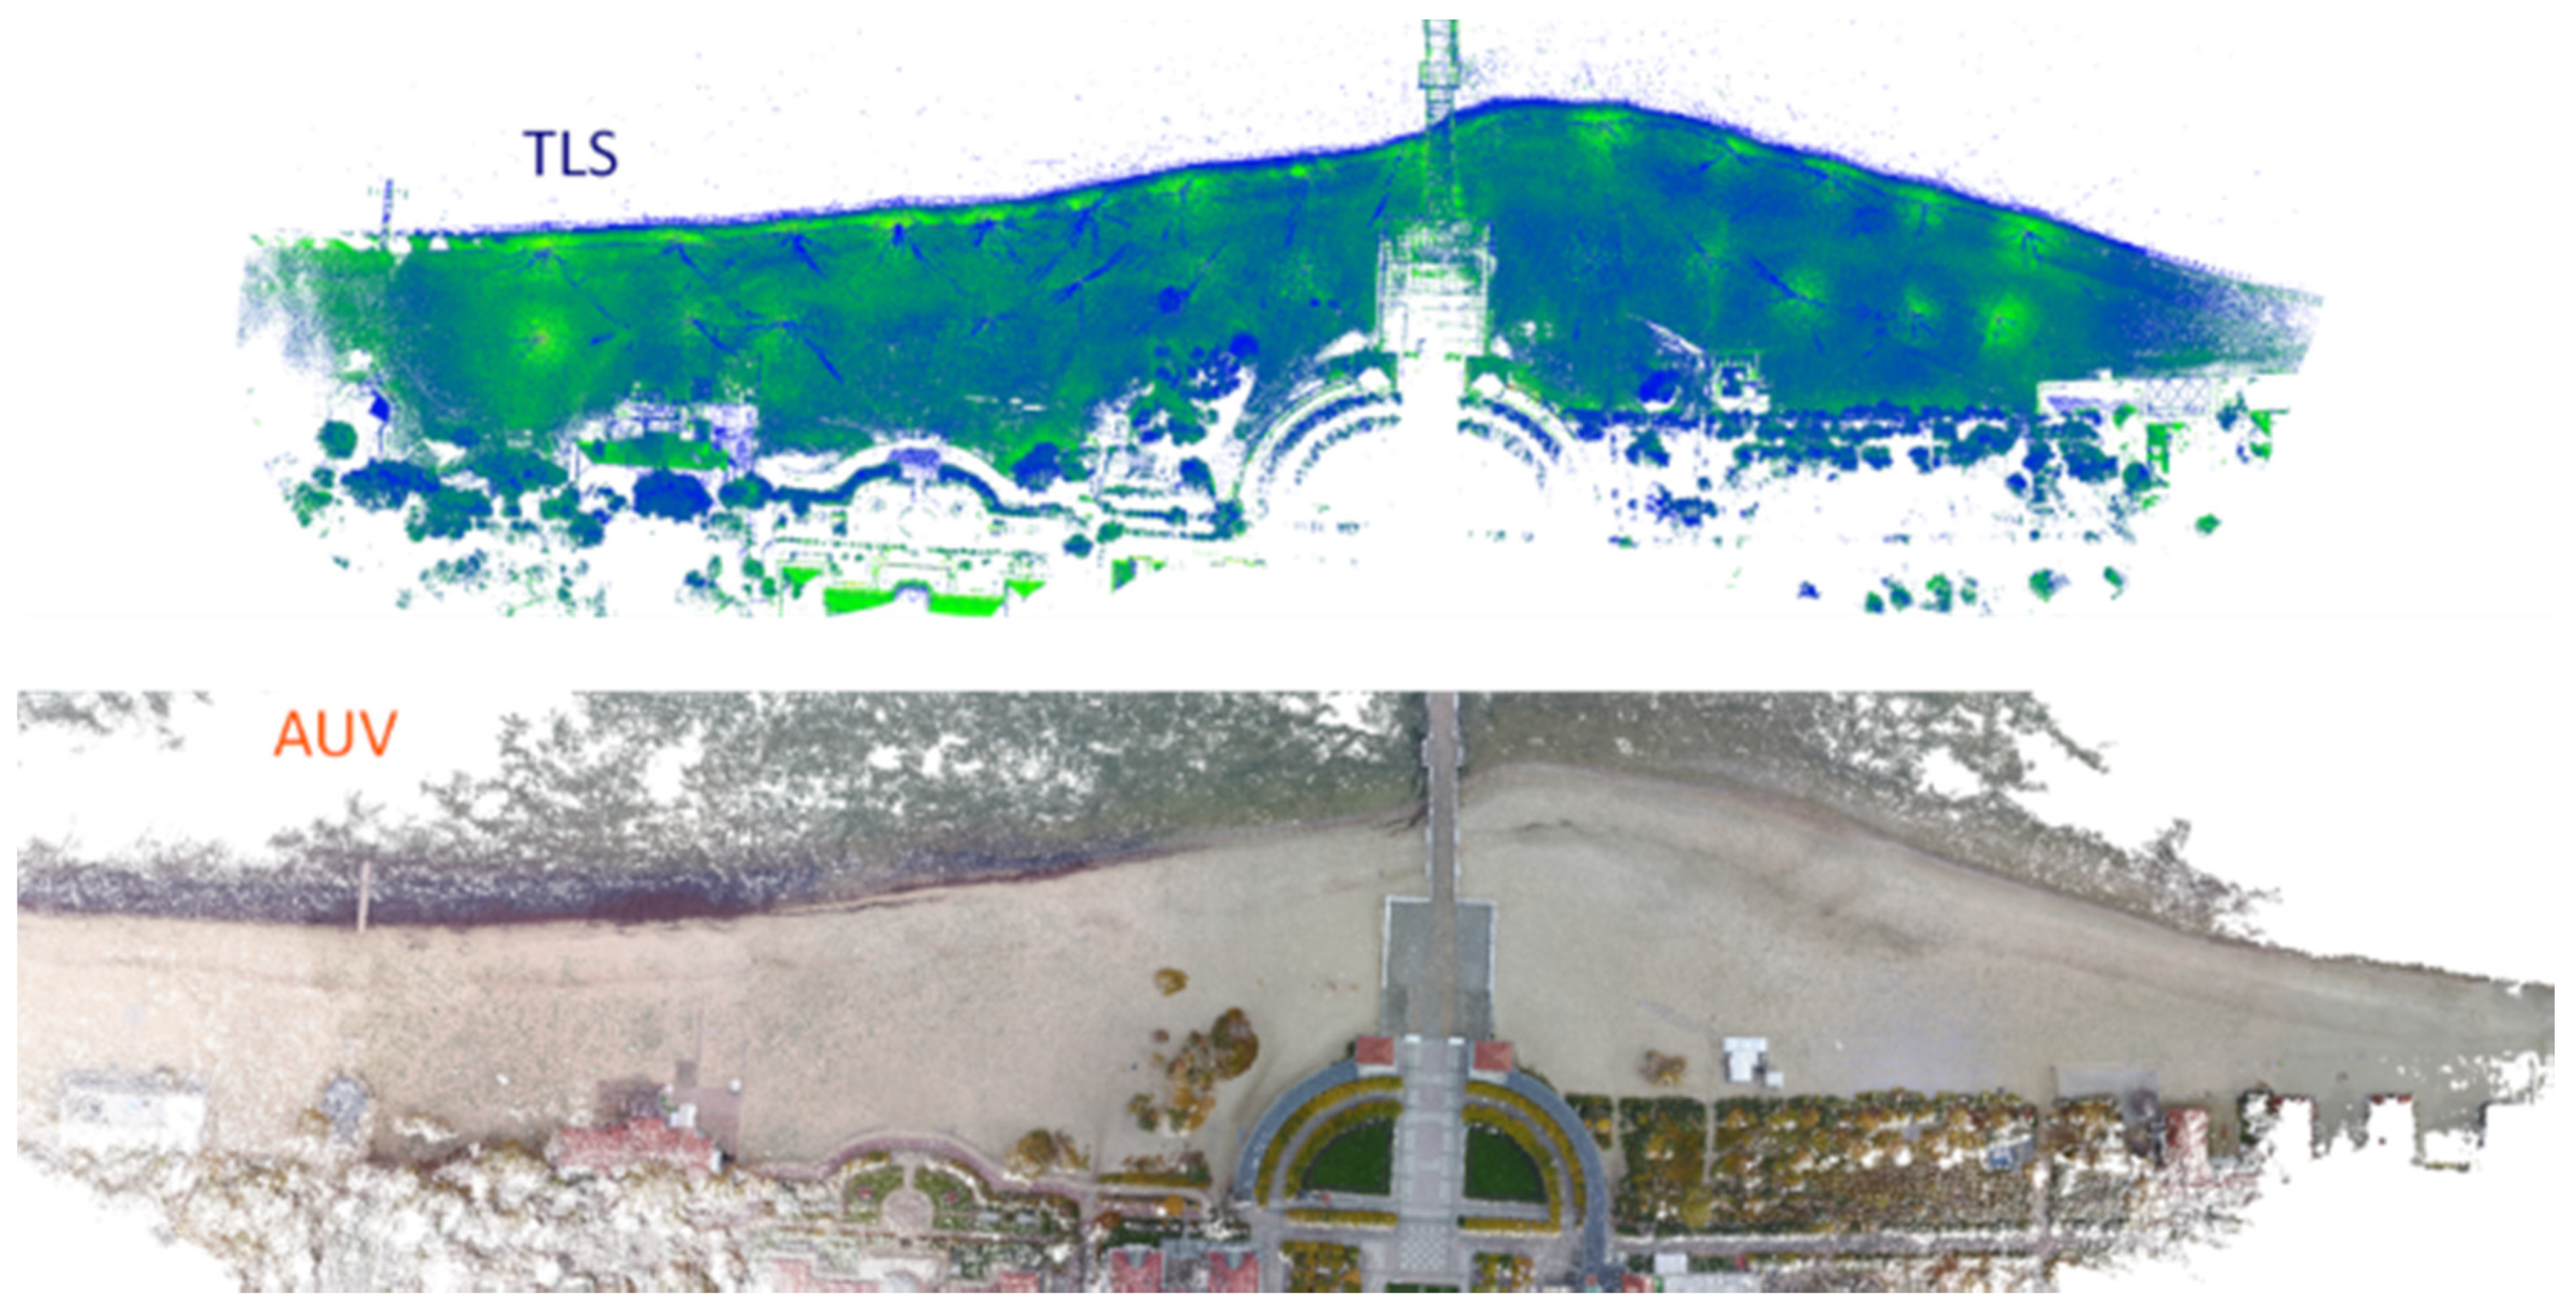
  • Land measurements (geodesy) enable the acquisition of geospatial data of a beach section adjacent to the sea. Measurements of this type can be carried out in two ways. In order to obtain a precise 3D model of the beach adjacent to the shore, the best solution is the use of the terrestrial laser scanning (TLS) [30,31,32]. However, this is a time-consuming method, it requires expensive measurement equipment and advanced methods of point cloud processing. The predicted positioning accuracy (3D) is 2–3 cm, for distances up to 100 m (Figure 6a). An alternative to TLS is the use of photogrammetric methods, where the beach model is developed based on a sequence of photos from the UAV [33,34,35]. The predicted model accuracy (3D) depends on the positioning accuracy of the global navigation satellite systems (GNSSs) used and the type of photogrammetric camera used, ranging from 5 cm to 1 m (Figure 6b).
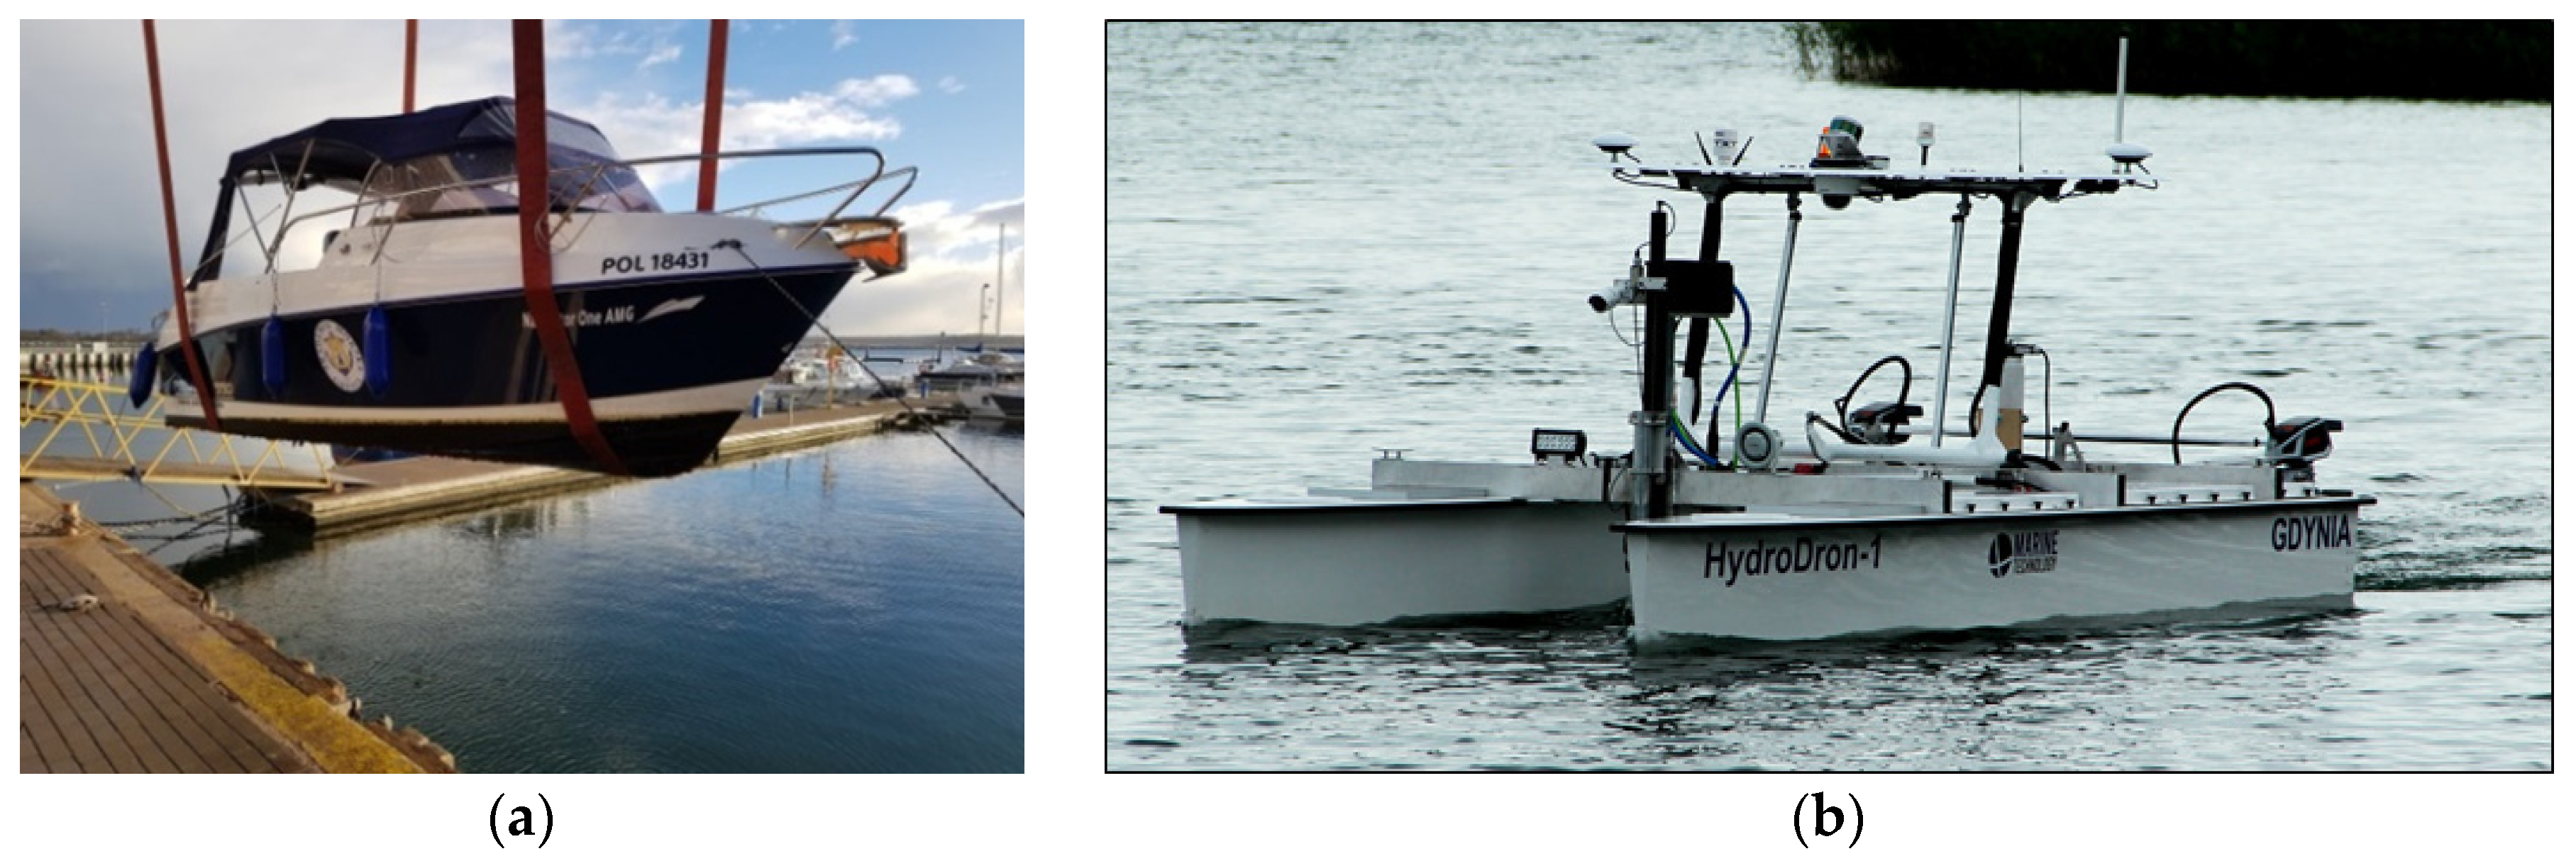
  • Sea surveys (hydrography) for depths below 1 m require the use of an atypical hydrographic vessel that has a very small draft and is equipped with a specialized echo sounder dedicated to ultra-shallow waters, the range of which should be at least 30 cm. The predicted accuracy of this solution allows a depth accuracy of 2–5 cm root mean square (RMS) (Figure 7a). An alternative solution to the use of a manned hydrographic vessel is the use of an unmanned surface vehicle (USV), which is increasingly used in bathymetric measurements [36,37,38]. The predicted accuracy of bathymetric measurements is identical to that of manned hydrographic measurements (Figure 7b).
  • Sea surveys (hydrography) for depths: 0–0.6 m are specific because this part of the waterbody could not, for obvious reasons, be measured by a manned vessel. Therefore, no actual bathymetric data that could determine the spread of the tombolo phenomenon were available in this area. Currently, bathymetric measurements in ultra-shallow waters and on the coastline are carried out by either tachymetric [39] or geodetic method with a person stepping into the sea to a predefined depth using a GNSS receiver operating in real time [40,41,42].

2.2.1. Geodetic Measurements

Creating a 3D beach model can be done on the basis of two methods: using UAV photos or taking measurements based on geodetic laser scanning [31]. The technique of measuring and creating a 3D beach model based on TLS compared to the method using a UAV is much more time consuming, but allows theoretically higher measurement accuracy.
In view of the elongated surface of the beach under measurement, it was necessary to plan and arrange an appropriate number of sites. The measurements were taken with a Trimble TX8 laser scanner without the photo-taking option. Hence, the obtained point clouds had only colours resulting from the calculated laser beam reflection intensity. To cover the assumed study area, it was necessary to establish 27 sites located at a distance of approx. 60 m from each other (Figure 8). In view of the small number of characteristic objects to be used for the recording of a point cloud in the field at a later time, spherical tags (located in the sand in a manner ensuring the stability of their position) were used. The tags had to be located a relatively short distance from the neighboring measurement sites. Therefore, they were located halfway between the measurement sites or in their immediate vicinity. Such an approach ensured that a relatively large set of points on each spherical tag’s surface were obtained during the measurements. This enabled the precise fitting of spheres into the set of points and the determination of their midpoints which, in the recording process, were the points of adjustment for particular local point cloud systems.
Combined point clouds coming from all stations formed a numerical representation of the environment. The connected point clouds contained measurement noise in the form of wrongly registered measurement points. Developing a point cloud often required manual removal of these measurement errors (Figure 9).
The photogrammetric flight pass was performed using a DJI Mavic Pro drone independently for each of the adopted parts. The data were recorded using a Pix4D Capture mobile application. During the mission, 621 photographs were taken at an altitude of 60 m above the drone take-off level (i.e., the beach). The obtained average ground sample distance (GSD) coefficient value amounted to 2.25 cm/pixel (px) at a camera resolution of 4000 x 3000 effective px. The overlap parameter defining the degree of photograph overlapping in transverse and longitudinal directions was determined to be 80%. The main parameters of the camera are:
  • Sensor: 1/2.3” (CMOS), effective px: 12.35 M (total px: 12.71 M).
  • Lens: FOV 78.8° 28 mm (35 mm format equivalent) f/2.2.
  • Distortion: <1.5% focus from 0.5 m to ∞.
  • ISO range: 100–3200 (video), 100–1600 (photo).
  • Shutter speed: 8 s–1/8000 s.
  • Image max size: 4000 × 3000.

2.2.2. Hydrographic Measurements

The marine vessel that was used in the research was the hydrographic survey motorboat Navigator One AMG (Figure 7a), a manned vessel intended for carrying out hydrographic surveys, with a length of 5.5 m, width of 2.55, draft of 0.3 m, a crew of 6, coastal buoyancy class, and a weight of 780 kg. It is equipped with an outboard motor with a power of 115 hp (Suzuki) and the Lowrance HDS Carbon navigation system with the StructureScan 3D module.
The single beam echo sounder (SBES) was calibrated using the tare method, which involves adjusting the average speed of sound in water at known depths to echo sounder indications. The basic method for measuring the speed of sound is the use of a CTD (conductivity, temperature, depth) sensor or a sound velocity profiler (SVP). An alternative is the measurement of water temperature and the determination of the speed of sound based on an empirical equation when the salinity is known. Certain echo sounders determine the speed of sound in water based on the temperature by means of a sensor located in the transducer.
Oceanographic measurements which are part of hydrographic surveys include water level observations and measurements of the speed of sound in water [43]. The water level can be observed on a gauging station which is situated in a marina or port and is referenced to the geodetic height system used in a particular country. In Poland, according to the current regulations [44], water levels are referenced to the height system of Kronstadt (PL-KRON86-NH) (until 2019) and Amsterdam (PL-EVRF2007-NH). For the area of Sopot marina surveys, the closest gauging stations are Gdańsk Port Północny and Gdynia. Interpolation between observations at distant points carries the risk that in the location of bathymetric measurements, the actual water level deviates from the interpolated level due to e.g., wind causing water lifting. Another solution is to periodically measure the water level above the sea level using a GNSS receiver and a geoid model.
During the surveys, the water levels recorded at the Gdańsk Port Północny (at a distance of 9.7 km from Sopot) and Gdynia (at a distance of 7.8 km from Sopot) gauging stations were identical and were adopted for the reduction of depth measurement to the chart datum. The methodology for considering water level measurements during hydrographic surveys is described in detail in [45,46].
Sounding profiles have been planned for the marina and pier areas, taking into account the following assumptions:
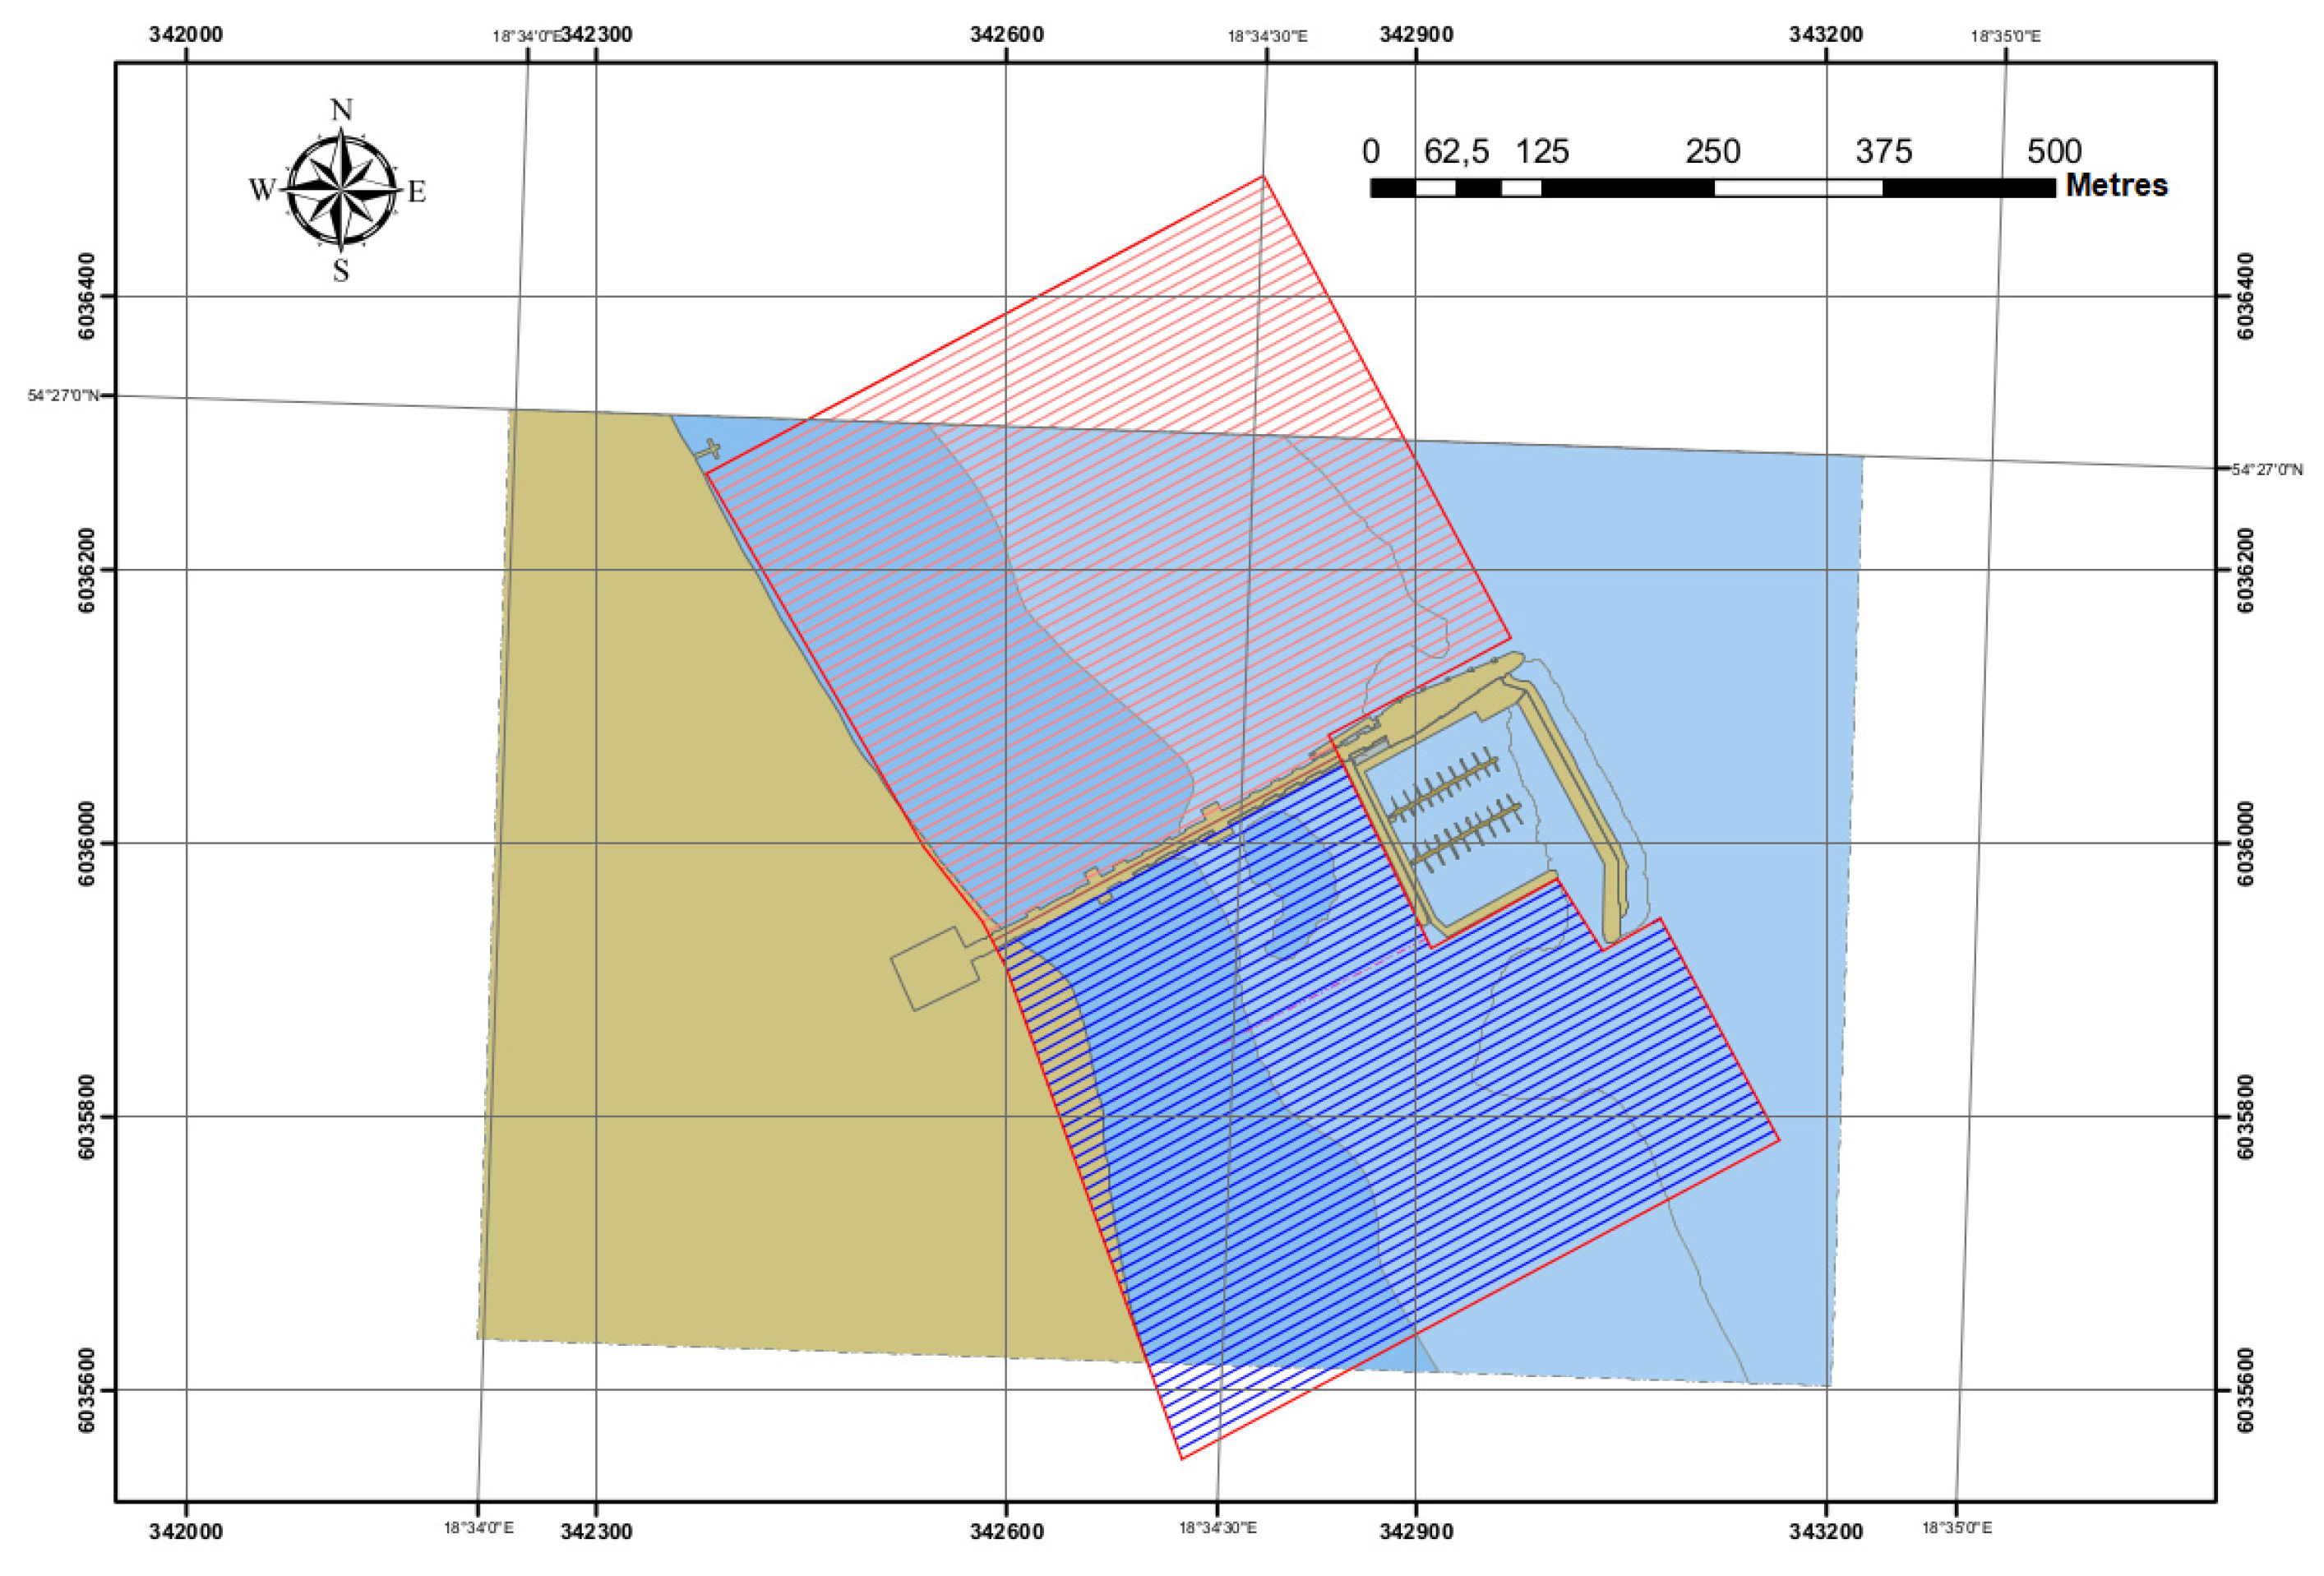
  • Area includes a rectangle 800 m long, calculated along the coast and symmetrical to the pier and 500 m wide corresponding to the pier length, excluding the marina (Figure 10).
  • Profile length: 285–492 m.
  • Total length of profiles: 42 km.
  • Distance between profiles: 8 m.
  • Minimum planned depth: 40 cm.
  • Sea level will be provided by the gauging stations of the Institute of Meteorology and Water Management (IMGW) in Gdańsk Port Północny and Gdynia.

3. Results

3.1. Geodetic Measurement Results

A photogrammetric model was developed using the Pix4d Mapper Pro software which enables photographic data processing and generation based on three-dimensional models and orthophotomaps. A median of 21,128 nodal points on a single photograph was obtained, which indicates a relatively high number of characteristic points and areas, considering the frequently little diversified coverage of the area surface. Figure 11 shows a 3D model built based on the UAV photos [25].
A comparative picture of point clouds is illustrated in Figure 12, obtained from measurements using TLS and UAV methods.
To assess the accuracy of the 3D beach model made, it is necessary to compare it to the state geodetic coordinate system used in Poland (Figure 13) [47].
In the discussed TLS case study, the detailed inaccuracy components of the applied laser scanner measurement are equal to [47]:
  • Inaccuracy of the Trimble Tx8 laser scanner—1 cm horizontally and 1.5 cm vertically.
  • Inaccuracy of the Trimble R10 GNSS receiver used to determine the coordinates of reference points—1 cm horizontally and 1.5 cm vertically.
  • Inaccuracy of the PL-2000 system—2 cm horizontally and vertically.
A cloud of TLS points after transformation to the PL-2000 system, including the data collected at the determined area (terrain), can be a reference set for the cloud of points obtained by the UAV method in the form of terrain digital photos. A series of photos, processed by the appropriate program, enables creation of a space projection of the investigated area (terrain), in which besides the X-Y coordinates, the Z coordinate is determined in relation to each point of the cloud. On the basis of the reference points coordinates, the obtained local coordinates are transformed in the PL-2000 system. In practice, the sequence of operations realized on the basis of photo data does not allow achievement of a satisfactory level of accuracy of the data on the investigated area [47].
In the UAV method of terrain imaging, the picture processing operation resulted in the generation of a cloud containing 20,666,253 points, which translates into a density of approx. 117 points per m2. Numerical data processing was carried out using a high-parameter workstation (16 GB RAM, i7-6600U, GTX 1070) which lasted for 3 hours 42 minutes. The following values of errors for particular coordinates were obtained: 2.83 m (X), 4.08 m (Y) and 9.81 m (Z) [47].
In the discussed UAV case study, the detailed inaccuracy components of the applied unmanned aerial vehicle are equal to [47]:
  • Camera px resolution—2.25 cm.
  • Inaccuracy of UAV position: X, Y—a few meters, Z—several meters.
To estimate the quality of the UAV method measurement, it is proposed to use the TLS data cloud as reference data. These data are obtained in the same area as the data in the UAV data cloud. Then, it is possible to estimate the systematic X-Y-Z coordinates errors components in the UAV cloud, as well as their dispersion (noise) in relation to reference values (Figure 14) [47].
Dedicated software is currently under construction to allow for the determination of the uncertainty characteristics of X-Y-Z coordinates collected in large data files obtained using the UAV method [47].
Results of the executed measurements of the terrain geometry are treated as random variables, that is, they are subject to statistical rules and the probability calculus is used to assess them. The term “metrological aspects” in this paper concerns the estimation of uncertainty in relation to the measurements of the sea shore and the seafloor under investigation [48]. Measurement results obtained with use of the aforementioned methods defined as TLS and UAV, respectively, create the series (clouds) of measurement points. Each of them has different references in the X-Y-Z coordinates system. Consequently, it is possible to estimate an uncertainty of determination of space coordinates of each measurement point in cloud by applying the methodology of type B uncertainty determining [49]. Uncertainty of type B concerns mainly the estimation of inaccuracy of measurement instrumentation. Its calculation requires determination of the absolute error threshold value ΔXt and assumption of the given function of probability distribution for this error. Then, for a given component, the type B standardized uncertainty us(x) is expressed as for normal distribution [47]:
u s ( x ) = Δ X t 3
or for uniform distribution:
u s ( x ) = Δ X t 3
where:
ΔXt—maximum permissible error threshold value.
Taking into account that estimation of the type B measurement procedure may concern a few inaccuracy components characterized by the standard uncertainties us1(x), us2(x), ..., and usn(x), we can calculate the complex uncertainty uc(x) as [47]:
u c ( x ) = u s 1 2 ( x ) + u s 2 2 ( x ) + + u s n 2 ( x )
where:
us1(x), us2(x), ..., and usn(x) correspond to all sources of errors in the considered measurement procedure.
Then, for a given component, the type B extended uncertainty UB(x) is expressed as [47]:
U B ( x ) = k u C ( x )
where:
k—coefficient of extension (coverage factor).
First of all, the detailed uncertainty components can be analysed and calculated for the method TLS and related to its measurement instrumentation. Taking into consideration known instrumental and method data, the following error components are considered [47]:
  • Reference system TLS accuracy.
  • Satellite receiver R10 maximum errors.
  • PL-2000 system errors threshold values.
The uncertainty should be estimated for all three coordinates (X, Y, and Z). The uncertainty budget is shown in Table 1 for X or Y coordinates and in Table 2 for Z coordinate [47].
Assuming the normal distribution of complex uncertainties for all coordinates, the extended uncertainty (5) uTLS is 2.82 cm (X or Y coordinate) and 3.36 cm (Z coordinate) (p = 0.95) [47].

3.2. Hydrographic Measurement Results

Hydrographic measurements enabled creation of the bathymetric chart of the tombolo phenomenon in Sopot. This map was developed based on measurements realised in October 2018. In addition, bathymetric data (isobaths) from the 2011 ENC were processed and supplemented with a point cloud from the beach and pier (Figure 15).
Figure 15 clearly shows that the official 2011 chart of this region differs significantly from the actual results of bathymetric measurements carried out in 2018. Having considered the map presented in Figure 15a, it should be noted that the berthing area located in the eastern part of the pier and in the southern part of the yacht marina is not suitable for navigation due to the very shallow depths (1–1.5 m) occurring there. It should also be stressed that the authors carried out bathymetric measurements of the areas in the vicinity of the Sopot pier using a manned vessel Navigator One AMG, which has one of the shallowest drafts possible (30 cm). Nevertheless, the vessel’s bottom repeatedly scraped the sand on the seafloor, which posed a risk of damage to both the vessel and the measuring equipment. These measurements clearly proved that sailing on such vessels (even with the shallowest draft possible) in ultra-shallow waters is risky and poses a hazard of damaging the measurement systems [50,51].
The shape of the isobaths from measurements of the tombolo phenomenon (Figure 15a) indicates that as a result of reduced sand transport along the coast, sand began to accumulate on the right side of the pier in Sopot. The result of this state is that the seafloor has significantly increased over the entire length of the waterbody connecting the marina with the shore. At the inner marina, the depths decreased by 1.5–2 m. Halfway between the marina and the shore, the seafloor rose by about 1 m. The width of the peninsula, which will be built in the future, can be estimated at about 90–100 m, at the water surface.
The degree of advancement of the progressive tombolo phenomenon can also be estimated by comparing two digital terrain models (DTMs) [52] from 2011 and 2018 (measured). As a result of their comparison, the volume sand deposited over 8 years on the pier area in Sopot was determined. Figure 16 presents a map in which depth differences between the tombolo DTM models developed on the basis of measurements and the ENC data are shown in colour. The volume sand deposited is 31,963,450 m3. This means that to remove all the sand accumulated with the tombolo phenomenon, 2663 large dump trucks with a capacity of 12 m3 would have to be used.
The measurements and bathymetric charts made it possible to determine the areas of dredging works that are planned by the city of Sopot. It is noteworthy that the width of the depth changes due to sand accumulation is about 300 m.

3.3. Additional Research Results

In order to determine the scale of the tombolo phenomenon, it was decided to analyse the coastline course in Sopot over the last 10 years. To this end, aerial photographs from the website https://mapa.trojmiasto.pl/ provided by the MGGP Aero (years 2008, 2011, 2014, and 2016) and satellite photographs from Google Earth Pro, a popular geographical photo and information sharing application, were used. Vectorisation and cartographic adjustment of the photographs in terms of the inclination angle, rotation, and scale helped to identify considerable morphological changes in the coast in the vicinity of Sopot (Figure 17) [25].
Moreover, the conducted analyses enabled both the calculation of the Sopot beach area in selected years and the determination of its area variability degree over the years (Table 3) [25].

4. Discussion

As a result of the construction of the marina in Sopot, there was a change in the morphological forms of the coast around the pier on a sandy beach of 800 m length. Accumulating sediment transport along the beach has caused the seafloor to rise, which has lead to a tombolo in the proceeding years (a narrow belt connecting the mainland with an island lying near the shore formed as a result of sand and gravel being deposited by sea currents). In addition to coastline changes, this phenomenon has led to increased vegetation of this area, threatening the city’s spa character. This publication presents research results aimed at integrating measurement methods and systems of modern geodesy and hydrography for geospatial modeling of the tombolo phenomenon.
As part of the study, TLS and UAV beach measurements were carried out with an analysis of their accuracy, coastline changes were determined based on the analysis of satellite images, bathymetric measurement of the waterbody adjacent to the sea was carried out, and bathymetric charts of the tombolo phenomenon were made and they were compared with data from the ENC. Finally, the volume and area of accumulating sand in the developing tombolo was determined.
The analysis results can be used by the local government in Sopot to solve this important problem for the town, as well as develop a systemic approach to sand removal that is very expensive. It is recommended that dredging works be carried out only in selected places and in such a way that restores sediment transport along the beach, because its complete cessation would accelerate the process of tombolo development, as well as have a significant impact on the waterbody’s vegetation.
Based on Figure 17, it can be concluded that the municipal beach area has been steadily increasing, and the coastline to the east of the pier is increasingly approaching the yacht marina. It can also be seen that in the years 2008–2018, the coastal belt area in this place increased by approx. 13,062 m2, and the coastline shifted towards the sea by 53 m [25]. This has happened mainly as a result of the construction of an additional breakwater protecting the pier against storms. Therefore, it is necessary to conduct continuous cartographic monitoring in this area.
It should also be emphasized that hydrographic measurements with a manned vessel in such shallow water are difficult and can often be unachievable due to the small depths (below 1 m). Hence, future work has focused on the use of the hydrographic USV, which was successfully carried out in December 2019.
The proposed research methodology involving integration of geodetic and hydrographic methods aimed at creating a 3D tombolo model can be successfully used to assess other phenomena of this type.

Author Contributions

Conceptualization, C.S., J.M., and R.M.; data curation, M.S., P.D., and A.M.; investigation, M.S., P.D., and A.M.; methodology, C.S., J.M., and R.M.; supervision, C.S., J.M., and R.M.; visualization, M.S., P.D., and A.M.; writing—original draft, C.S. and M.S.; writing—review & editing, J.M., P.D., R.M., and A.M. All authors have read and agreed to the published version of the manuscript.

Funding

This research received no external funding.

Conflicts of Interest

The authors declare no conflict of interest.

References

  1. National Academy of Sciences. Climate change: Evidence and Causes; National Academies Press: Washington, DC, USA, 2014. [Google Scholar]
  2. Ming, D.; Chiew, Y.-M. Shoreline changes behind detached breakwater. J. Waterw. Port Coast. Ocean Eng. 2000, 126, 63–70. [Google Scholar] [CrossRef]
  3. Szruba, M. Sea shore protection. Mod. Eng. Constr. 2017, 1, 60–63. (In Polish) [Google Scholar]
  4. United States Army Corps of Engineers. Shore Protection Manual; USACE: Washington, DC, USA, 1984; Volume 1. [Google Scholar]
  5. Wawrzyńska, A. Analysis of the causes of security risks for port and marine infrastructure. Part three: Structures protecting the sea shore. Works Fac. Navig. Gdyn. Marit. Univ. 2013, 28, 59–66. (In Polish) [Google Scholar] [CrossRef] [Green Version]
  6. Łabuz, T. Ways to Protect Sea Shores and Their Impact on the Natural Environment of the Polish Baltic Coast. Available online: http://awsassets.wwfpl.panda.org/downloads/raportochronabrzegow.pdf (accessed on 27 January 2020). (In Polish).
  7. President of the City of Sopot. Response to question No. 154/2016 of 7 December 2016. Available online: https://bip.umsopot.nv.pl/Download/get/id,32756.html (accessed on 9 June 2019). (In Polish).
  8. Mohamed, A.S. 2D and 1D numerical model simulations for the effect of a single detached breakwater on the shore. MSc Thesis, Delft University of Technology, Delft, The Netherlands, 1997. [Google Scholar]
  9. Institute of Oceanology of the Polish Academy of Sciences. Conducting Research and Modeling of the Seafloor and Sea Shore Near the Pier in Sopot. Available online: https://bip.umsopot.nv.pl/Download/get/id,32756.html (accessed on 9 June 2019). (In Polish).
  10. Mangor, K.; Drønen, N.K.; Kaergaard, K.H.; Kristensen, N.E. Shoreline Management Guidelines. Available online: https://www.dhigroup.com/marine-water/ebook-shoreline-management-guidelines (accessed on 27 January 2020).
  11. Kim, H. Three-dimensional sediment transport model. PhD Thesis, University of Liverpool, Liverpool, UK, 1993. [Google Scholar]
  12. O’Connor, B.A.; Nicholson, J. A three-dimensional model of suspended particulate sediment transport. Coast. Eng. 1988, 12, 157–174. [Google Scholar] [CrossRef]
  13. Kuroiwa, M.; Kamphuis, J.W.; Kuchiishi, T.; Matsubara, Y.; Noda, H. Medium-term Q-3D coastal area model with shoreline change around coastal structures. In Proceedings of the 29th International Conference on Coastal Engineering (ICCE 2004), Lisbon, Portugal, 19–24 September 2004. [Google Scholar]
  14. Watanabe, A.; Maruyama, K.; Shimizu, T.; Sakakiyama, T. Numerical prediction model of three-dimensional beach deformation around a structure. Coast. Eng. Jap. 1986, 29, 179–194. [Google Scholar] [CrossRef]
  15. Shimizu, T.; Kumagai, T.; Watanabe, A. Improved 3-D beach evolution model coupled with the shoreline model (3D-SHORE). In Proceedings of the 25th International Conference on Coastal Engineering (ICCE 1996), Orlando, FL, USA, 2–6 September 1996. [Google Scholar]
  16. Jörissen, J.G.L. Strandhoofden Gemodelleerd in Delft3D-RAM: Strandhoofden als Instrument voor het Regelen van het Langstransport. MSc Thesis, Delft University of Technology, Delft, The Netherlands, December 2001. [Google Scholar]
  17. Nam, P.T. Numerical Model of Beach Topography Evolution Due to Waves and Currents. Special Emphasis on Coastal Structures. Available online: https://pdfs.semanticscholar.org/c5af/bff0cb81a3dff8f2cc3528016c85bb1b1107.pdf?_ga=2.233758174.1954626850.1580128302-234920152.1580128302 (accessed on 27 January 2020).
  18. Kuchiishi, T.; Kato, K.; Kuroiwa, M.; Matsubara, Y.; Noda, H. Applicability of 3D morphodynamic model with shoreline change using a quasi-3D nearshore current model. In Proceedings of the 14th International Offshore and Polar Engineering Conference (ISOPE 2004), Toulon, France, 23–28 May 2004. [Google Scholar]
  19. Roelvink, D.; Giles, L.; van der Wegen, M. Morphological modelling of the wet-dry interface at various timescales. In Proceedings of the 7th International Conference on Hydroscience and Engineering (ICHE 2006), Philadelphia, PA, USA, 10–13 September 2006. [Google Scholar]
  20. van Koningsveld, M.; van Kessel, T.; Walstra, D.-J.R. A hybrid modelling approach to coastal morphology. In Proceedings of the 5th Coastal Dynamics International Conference (CD 2005), Barcelona, Spain, 4–8 April 2005. [Google Scholar]
  21. Kim, H.; Lee, S.; Park, D.; Lim, H.S. Simulation of tombolo evolution by using CST3D-WA. Vibroeng. PROCEDIA 2017, 12, 196–201. [Google Scholar]
  22. Sopot City Hall. 2016: Tombolo Connects the Beach with the Marina. Available online: https://sopot.gmina.pl/raport-marina-tombolo-2016/ (accessed on 27 January 2020). (In Polish).
  23. Sopot NaszeMiasto.pl. Black beach in Sopot? The City Calms down that it’s Temporary. Available online: https://sopot.naszemiasto.pl/czarna-plaza-w-sopocie-miasto-uspokaja-ze-to-chwilowe/ar/c1-4272244 (accessed on 27 January 2020). (In Polish).
  24. Sopot NaszeMiasto.pl. Sopot Beach to be Corrected Again. Alignment is in Progress. Available online: http://sopot.naszemiasto.pl/artykul/sopocka-plaza-znowu-do-poprawki-trwa-wyrownywanie-zdjecia,2253932,artgal,t,id,tm.html (accessed on 27 January 2020). (In Polish).
  25. Specht, C.; Dąbrowski, P.S.; Specht, M.; Makar, A.; Marchel, Ł.; Skóra, M.; Cywiński, P.; Szychowski, P. Research on the Tombolo Effect of the Marina in Sopot. Available online: https://www.researchgate.net/publication/328998312_Badania_efektu_Tombolo_mariny_w_Sopocie (accessed on 27 January 2020). (In Polish).
  26. Trójmiasto.Wyborcza.pl. A Sand Island has Grown up at the Pier in Sopot. The Sand on the Cliff in Gdynia is Decreasing. Available online: http://trojmiasto.wyborcza.pl/trojmiasto/1,35612,20860078,wyrosla-piaskowa-wyspa-przy-molo-w-sopocie-ubywa-za-to-piasku.html (accessed on 27 January 2020). (In Polish).
  27. Dziennik Bałtycki. A cliff slumped in Gdynia. At Orłowska Street Part of the Cliff Slumped. A Search and Rescue Team Worked on Site. There are no Victims. Available online: https://dziennikbaltycki.pl/w-gdyni-osunal-sie-klif-przy-ul-orlowskiej-osunela-sie-czesc-klifu-na-miejscu-pracowala-grupa-poszukiwawczoratownicza-nie-ma/ar/12936510 (accessed on 27 January 2020). (In Polish).
  28. Kaulbarsz, D. Geology and glaciotectonics of the Orłowo Cliff in Gdynia, northern Poland. Geol. Rev. 2005, 53, 572–581. (In Polish) [Google Scholar]
  29. Szukalski, J. Nature reserve Kępa Redłowska. Ann. Gdyn. 1997, 12, 201–206. (In Polish) [Google Scholar]
  30. Bareth, G.; Bendig, J.; Tilly, N.; Hoffmeister, D.; Aasen, H.; Bolten, A. A comparison of UAV- and TLS-derived plant height for crop monitoring: Using polygon grids for the analysis of Crop Surface Models (CSMs). Photogramm. Fernerkund. Geoinf. 2016, 2, 85–94. [Google Scholar] [CrossRef] [Green Version]
  31. Ruggles, S.; Clark, J.; Franke, K.W.; Wolfe, D.; Reimschiissel, B.; Martin, R.A.; Okeson, T.J.; Hedengren, J.D. Comparison of SfM computer vision point clouds of a landslide derived from multiple small UAV platforms and sensors to a TLS based model. J. Unmanned Veh. Syst. 2016, 4, 246–265. [Google Scholar] [CrossRef]
  32. Xiong, L.; Wang, G.; Bao, Y.; Zhou, X.; Wang, K.; Liu, H.; Sun, X.; Zhao, R. A rapid terrestrial laser scanning method for coastal erosion studies: A case study at Freeport, Texas, USA. Sensors 2019, 19, 3252. [Google Scholar] [CrossRef] [PubMed] [Green Version]
  33. Burdziakowski, P. Low cost real time UAV stereo photogrammetry modelling technique—Accuracy considerations. E3S Web Conf. 2018, 63, 00020. [Google Scholar] [CrossRef]
  34. Burdziakowski, P. UAV in todays photogrammetry—Application areas and challenges. In Proceedings of the 18th International Multidisciplinary Scientific GeoConference (SGEM 2018), Albena, Bulgaria, 2–8 July 2018. [Google Scholar]
  35. Casella, E.; Drechsel, J.; Winter, C.; Benninghoff, M.; Rovere, A. Accuracy of sand beach topography surveying by drones and photogrammetry. Geo-Mar. Lett. 2020, 1–14. [Google Scholar] [CrossRef] [Green Version]
  36. Specht, C.; Weintrit, A.; Specht, M. Determination of the territorial sea baseline—Aspect of using unmanned hydrographic vessels. TransNav Int. J. Mar. Navig. Saf. Sea Transp. 2016, 10, 649–654. [Google Scholar] [CrossRef] [Green Version]
  37. Specht, M.; Specht, C.; Lasota, H.; Cywiński, P. Assessment of the steering precision of a hydrographic Unmanned Surface Vessel (USV) along sounding profiles using a low-cost multi-Global Navigation Satellite System (GNSS) receiver supported autopilot. Sensors 2019, 19, 3939. [Google Scholar] [CrossRef] [Green Version]
  38. Stateczny, A.; Kazimierski, W.; Burdziakowski, P.; Motyl, W.; Wisniewska, M. Shore construction detection by automotive radar for the needs of autonomous surface vehicle navigation. ISPRS Int. J. Geo-Inf. 2019, 8, 80. [Google Scholar] [CrossRef] [Green Version]
  39. Ochałek, A.; Lipecki, T.; Jaśkowski, W.; Jabłoński, M. Modeling and analysis of integrated bathymetric and geodetic data for inventory surveys of mining water reservoirs. E3S Web Conf. 2018, 35, 04005. [Google Scholar] [CrossRef] [Green Version]
  40. Baptista, P.; Bastos, L.; Bernardes, C.; Cunha, T.; Dias, J. Monitoring sandy shores morphologies by DGPS—A practical tool to generate digital elevation models. J. Coast. Res. 2008, 24, 1516–1528. [Google Scholar] [CrossRef]
  41. Specht, C.; Specht, M.; Cywiński, P.; Skóra, M.; Marchel, Ł.; Szychowski, P. A new method for determining the territorial sea baseline using an unmanned, hydrographic surface vessel. J. Coast. Res. 2019, 35, 925–936. [Google Scholar] [CrossRef]
  42. Specht, C.; Weintrit, A.; Specht, M.; Dabrowski, P. Determination of the territorial sea baseline—Measurement aspect. IOP Conf. Ser. Earth Environ. Sci. 2017, 95, 1–10. [Google Scholar] [CrossRef] [Green Version]
  43. Makar, A. The sea bottom surface described by coons pieces. Sci. J. Marit. Univ. Szczec. 2016, 45, 187–190. [Google Scholar]
  44. Council of Ministers of the Republic of Poland. Ordinance of the Council of Ministers of 15 October 2012 on the National Spatial Reference System; Council of Ministers of the Republic of Poland: Warsaw, Poland, 2012. (In Polish)
  45. Sassais, R.; Makar, A. Methods to generate numerical models of terrain for spatial ENC presentation. Ann. Navig. 2011, 18, 69–81. [Google Scholar]
  46. Specht, M.; Specht, C.; Wąż, M.; Naus, K.; Grządziel, A.; Iwen, D. Methodology for performing territorial sea baseline measurements in selected waterbodies of Poland. Applied Sciences 2019, 9, 3053. [Google Scholar] [CrossRef] [Green Version]
  47. Specht, C.; Mindykowski, J.; Dąbrowski, P.; Maśnicki, R.; Marchel, Ł.; Specht, M. Metrological aspects of the tombolo effect investigation—Polish case study. In Proceedings of the 2019 IMEKO TC-19 International Workshop on Metrology for the Sea (IMEKO 2019), Genova, Italy, 3–5 October 2019. [Google Scholar]
  48. Masnicki, R.; Specht, C.; Mindykowski, J.; Dąbrowski, P.; Specht, M. Accuracy analysis of measuring X-Y-Z coordinates with regard to the investigation of the tombolo effect. Sensors 2020, 20, 1167. [Google Scholar] [CrossRef] [Green Version]
  49. Joint Committee for Guides in Metrology. Evaluation of Measurement Data—Guide to the Expression of Uncertainty in Measurement, 1st ed.; JCGM: Sèvres, France, 2008. [Google Scholar]
  50. Stateczny, A.; Grońska, D.; Motyl, W. Hydrodron—New step for professional hydrography for restricted waters. In Proceedings of the 2018 Baltic Geodetic Congress, Olsztyn, Poland, 21–23 June 2018. [Google Scholar]
  51. Stateczny, A.; Włodarczyk-Sielicka, M.; Grońska, D.; Motyl, W. Multibeam echosounder and LiDAR in process of 360-degree numerical map production for restricted waters with HydroDron. In Proceedings of the 2018 Baltic Geodetic Congress, Olsztyn, Poland, 21–23 June 2018. [Google Scholar]
  52. Specht, M.; Specht, C.; Wąż, M.; Dąbrowski, P.; Skóra, M.; Marchel, Ł. Determining the variability of the territorial sea baseline on the example of waterbody adjacent to the municipal beach in Gdynia. Appl. Sci. 2019, 9, 3867. [Google Scholar] [CrossRef] [Green Version]
Figure 1. The nature of the phenomenon that causes the formation of the tombolo effect (a), and the wavy surface of the sea in varying directions resulting from the diffraction of waves around the marina breakwater in Sopot (b).
Remotesensing 12 00737 g001
Figure 2. Forecast development model of the tombolo phenomenon in Sopot.
Remotesensing 12 00737 g002
Figure 3. Removing sand from under the pier in Sopot (a), pine pollen and rotten sand lying around the pier (b), transported to the southern part of the beach in Sopot (c).
Remotesensing 12 00737 g003
Figure 4. Water blooming in the vicinity of the Grand Hotel in Sopot (a) and the yacht marina in Sopot (b).
Remotesensing 12 00737 g004
Figure 5. Bathymetric chart of the marina area in Sopot made on the basis of official electronic navigational chart (ENC) data.
Remotesensing 12 00737 g005
Figure 6. Laser scanner (a) and unmanned aerial vehicle (UAV) DJI Mavic Pro (b) used for geospatial modeling of the beach in Sopot.
Remotesensing 12 00737 g006
Figure 7. Hydrographic vessel with a draft of 30 cm (a) and unmanned surface vehicle (USV) designed for coastal measurements (b).
Remotesensing 12 00737 g007
Figure 8. The location of terrestrial laser scanning (TLS) measurement sites.
Remotesensing 12 00737 g008
Figure 9. 3D point clouds obtained from the terrestrial laser scanning (TLS) containing measurement noise (a) and after their removal (b).
Remotesensing 12 00737 g009
Figure 10. Planned sounding profiles for the hydrographic vessel.
Remotesensing 12 00737 g010
Figure 11. 3D model of the area adjacent to the Sopot pier, obtained using an unmanned aerial vehicle (UAV).
Remotesensing 12 00737 g011
Figure 12. Two point clouds originating from measurements using terrestrial laser scanning (TLS) and unmanned aerial vehicle (UAV) methods.
Remotesensing 12 00737 g012
Figure 13. Algorithm of the terrestrial laser scanning (TLS) method accuracy estimation, where: ΔTx8 and ΔPL-2000 are absolute errors corresponding the Trimble Tx8 laser scanner and PL-2000 national system, respectively. uTLS—uncertainty of the considered method.
Remotesensing 12 00737 g013
Figure 14. Algorithm of the unmanned aerial vehicle (UAV) method accuracy estimation, where CloudTLS and CloudUAV are clouds of points related to the terrestrial laser scanning (TLS) and UAV methods, respectively, Δ and u are absolute values of occurred errors and related uncertainties, uTLS and uUAV are measurement uncertainties characterizing the TLS and UAV methods, respectively.
Remotesensing 12 00737 g014
Figure 15. Bathymetric chart of the tombolo phenomenon in Sopot (a) and a bathymetric map based on data from the 2011 electronic navigational chart (ENC) (b).
Remotesensing 12 00737 g015
Figure 16. Map showing depth differences between tombolo digital terrain models (DTMs) developed on the basis of measurements and electronic navigational chart (ENC) data.
Remotesensing 12 00737 g016
Figure 17. The course of the Sopot beach coastline over the years 2008-2018.
Remotesensing 12 00737 g017
Table 1. Uncertainty budget (X or Y coordinate) of terrestrial laser scanning (TLS) system.
QuantityMax ErrorProbability DistributionStandard Uncertainty
(X, Y)Tx81 cmuniform0.58 cm
(X, Y)R101 cmuniform0.58 cm
(X, Y)PL-20002 cmuniform1.15 cm
uTLS(X, Y) 1.41 cm
Table 2. Uncertainty budget (Z coordinate) of terrestrial laser scanning (TLS) system.
QuantityMax ErrorProbability DistributionStandard Uncertainty
(Z)Tx81.5 cmuniform0.87 cm
(Z)R101.5 cmuniform0.87 cm
(Z)PL-20002 cmuniform1.15 cm
uTLS(Z) 1.68 cm
Table 3. The increase in the beach surface in Sopot due to the tombolo phenomenon, developed on the basis of satellite images.
Month and YearSurface Area [m2]Increase in Surface Area [m2]
May 200837 7860
July 201041 8344 048
April 201142 5834 797
May 201240 6002 814
June 201340 3642 578
July 201448 05910 273
October 201545 4047 618
September 201647 97710 191
August 201750 83013 044
May 201850 84813 062

