Article

Potential of Using Phase Correlation in Distributed Scatterer InSAR Applied to Built Scenarios

1
Institute of Space and Earth Information Science, The Chinese University of Hong Kong, Shatin, N.T., Hong Kong 999077, China
2
Key Lab of Poyang Lake Wetland and Watershed Research of Ministry of Education, School of Geography and Environment, Jiangxi Normal University, Nanchang 330022, China
3
Shenzhen Research Institute, The Chinese University of Hong Kong, Shenzhen 518063, China
4
Department of Geography and Resource Management, The Chinese University of Hong Kong, Shatin, N.T., Hong Kong 999077, China
5
Department of Space Microwave Remote Sensing System, The Institute of Electronics, Chinese Academy of Science, Beijing 100190, China
6
University of Chinese Academy of Sciences, Beijing 100049, China
*
Authors to whom correspondence should be addressed.
Remote Sens. 2020, 12(4), 686; https://doi.org/10.3390/rs12040686
Submission received: 23 December 2019 / Revised: 14 February 2020 / Accepted: 15 February 2020 / Published: 19 February 2020
(This article belongs to the Special Issue InSAR in Remote Sensing)

Abstract

:
The improved spatial resolution of Synthetic Aperture Radar (SAR) images from newly launched sensors has promoted a more frequent use of distributed scatterer (DS) interferometry (DSI) in urban monitoring, pursuing sufficient and detailed measurements. However, the commonly used statistical methods for homogeneous pixel clustering by exploring amplitude information are firstly, computationally intensive; furthermore, their necessity when applied to high-coherent built scenarios is little discussed in the literature. This paper explores the potential of using phase information for the detection of homogeneous pixels on built surfaces. We propose a simple phase-correlated pixel (PCP) clustering and introduce a coherence-weighted phase link (WPL), i.e., PCPWPL, to pursue a faster processing of interferogram phase denoising. Rather than relying on the statistical tests of amplitude characteristics, we exploit vector correlation in the complex domain to identify PCPs with similar phase observations, thus, avoiding the intensive hypothesis test. A coherence-weighted phase linking is applied for DS phase reconstruction. The estimation of geophysical parameters, e.g., deformation, is completed using an integrated network of persistent scatterers (PS) and DS. Efficiency of the proposed method is fairly illustrated by both synthetic and real data experiments. Pros and cons of the proposed PCPWPL were analyzed with the comparison to a conventional amplitude-based strategy using an X-band CosmoSkyMed dataset. It is demonstrated that the use of phase correlation is sufficient for DS monitoring in built scenarios, with equivalent measurement quantity and cheaper computational cost.

1. Introduction

As a space-to-Earth monitoring technology, the Synthetic Aperture Radar Interferometry (InSAR) received great success in a variety of geodetic applications [1,2]. The new generation of SAR sensors (e.g., CosmoSkyMed, TerraSAR-X, Sentinel-1, and the planned NISAR) has brought noticeable progress in both data quality and the promotion of this technique. In addition, the merits of InSAR become increasingly apparent owing to the advancements in data processing algorithms dedicated to multiple application scenarios [1,2,3,4,5,6,7,8,9,10]. In particular, the persistent scatterer (PS) interferometry (PSI) method [6,7] and its extensions were often used for the extraction of 3D information and/or the stability detection of infrastructure [8,9,10]. The wide distribution of phase-stable targets, fine pixel resolution, and the continuously improving techniques such as tomography and object-based MTInSAR [11,12,13] have made this technique more than efficient in the complex urban environment. Readers are referred to [1] for a detailed introduction on the history of PSI. To overcome measurement absence in low-coherence regions, distributed scatterer (DS) interferometry (DSI) was proposed, initially, for rural and natural land covers [14,15]. However, DS-like pixels can exist and even account for a significant proportion of InSAR measurements in built scenarios revealed by high resolution X-band datasets [16,17]. Normally, built areas refer to those lands on which buildings and/or structures are present, such as urban and suburban environment, manmade surfaces of transportation networks, etc. [18,19]. With the improvement of sensor resolution, e.g., one meter, the pixel cell is likely to be smaller than the size of single structure units. Such that, ground features captured by the radar echo tend to be uniform in the pixel, with evenly scattering properties but not a dominated reflection from a persistent scatterer. For example, on the pavements, asphalt roads, building facades, roofs, other concrete surfaces etc., radar returns are weak due to specular reflections [20]. Pixels over these areas are normally with higher phase noise than those of a direct reflecting, which makes them behave like a DS. Therefore, DS measurements have been gradually exploited to assist with PS in built scenarios for the purpose of retrieving more structure details.
Typical DS algorithms refer to the Small Baseline Subsets (SBAS) [21,22], π -rate [23,24], the SqueeSAR [15], the Quasi-PS (QPS) [25], the Temporarily Coherent Points method (TCPInSAR) [26], CAESAR [27], the PD-PSInSAR [28], the Coherent Scatterer InSAR (CSI) [29], etc. Text [2] gives a review of different lines of researches on DS preprocessing and applications. Following the standard strategy of SqueeSAR and its extensions, a regular preprocessing of DS contains the adaptive clustering of statistically homogeneous pixels (SHPs) and the optimization of DS phase history [15]. Identification of homogeneous pixels has normally been based on the statistical goodness-of-fit with the amplitude information [30,31,32]. The reconstruction of DS phase history is completed by phase triangulation algorithms (PTA) using, for example the maximum likelihood (ML) estimators as presented in SqueeSAR [15], or a principal component analysis (PCA) method in CAESAR [27], etc. To examine amplitude homogeneity, statistical test algorithms are adopted including the nonparametric Anderson-Darling (AD) test, the Kolmogorov-Smirnov (KS) test, etc. and the parametric Generalized Likelihood Ratio Test (GLRT). The defect of statistical tests is the intensive computation because they do not have an analytic expression. The fast SHP selection (FaSHPS) method developed by Jiang et al. [31] has provided a practical solution for reducing execution time in the clustering stage. However, the homogeneity test is solely based on amplitude information, whereas phase information is neglected [33]. Therefore, it cannot always be relied on to accurately reflect phase homogeneity [31,33,34,35]. Given that phase stability over built surfaces is usually higher than that of natural land covers, phase information could also be reliable for clustering homogeneous pixels. Nevertheless, for such built areas, little efforts have been made to concretely discuss the capability of testing pixel homogeneity from their phase behavior. To retrieve the optimized phase history of a DS, the clustered homogeneous neighbors are adopted to reconstruct the consistent phases from all the available interferometric pairs described by a coherence matrix. Commonly used strategies for phase reconstruction were demonstrated in their mathematical forms by Cao et al. [36].
This article presents an easy-implementation scheme for homogenous filtering over built areas using correlations between complex-valued phase histories. Theoretically, the built surfaces provide relatively long-time coherent radar return than natural lands [17], even the DS-like targets are usually of higher phase quality although they are not on par with the PSs. We directly explore pixel homogeneity from their interferometric phases, using the correlation of complex-vectors [37,38]. The calculation of correlation does not need to go through the intensive computations of hypothesis test. The workload is thereby substantially decreased in this stage. Moreover, instead of searching an optimal solution of DS phases in the phase reconstruction step, we use the efficient iterative phase link algorithm to estimate the approximation solution [39,40]. The coherence matrix was used to replace the original weight coefficient in the phase link procedure [36,41]. This change has further shortened the execution time, as the matrix inversion operation is omitted in the iteration. To jointly process PS and DS pixels, the two-tier network strategy connecting the PS layer and the DS layer was adopted [20]. Geophysical parameters along the network arcs are resolved using robust estimators of beamforming and M-estimator [42]. We tested the efficiency of the proposed method through both synthetic and real datasets. Pros and cons of the phase-based method were summarized with comparison to a conventional amplitude-based method by using X-band CosmoSkyMed images covering the Hong Kong International Airport (HKIA). The proposed method is easy to implement and was proved to be able to detect equivalent DS points over built surfaces with much cheaper computational cost.

2. Methodologies

2.1. Homogeneous Clustering of Phase-Correlated Pixels (PCPs)

Amplitude information cannot always be reliable to represent a phase property [35,43]. For DS homogeneous filtering, pixels with similar phase behavior (e.g., displacement vector), rather than the amplitude, are more expected to be accurately clustered for the subsequent phase denoising. This is important especially for built scenarios such like complex metropolitan areas where phase discontinuities are presented [17]. In this section, we use correlation of phase vectors to test pixel homogeneity. Correlations were estimated in the complex domain instead of the commonly used real-value [44,45], using interferometric phase vectors. Suppose y as the vector of phases from N single look interferograms, with the orbital component, i.e., flat Earth and orbital inaccuracies, being previously removed, the correlation measure between pixels i and j is:
ρ y i y j = C ( y i , y j ) C ( y i , y i ) C ( y j , y j ) = ( y i y i ¯ ) H ( y j y j ¯ ) ( N 1 ) 1 ( y i y i ¯ ) H ( y i y i ¯ ) ( y j y j ¯ ) H ( y j y j ¯ ) ( N 1 ) = ( y i y i ¯ ) H ( y j y j ¯ ) ( y i y i ¯ ) H ( y i y i ¯ ) ( y j y j ¯ ) H ( y j y j ¯ )
where i and j are the pixel index, C ( · ) provides the covariance value, y ¯ is the arithmetic mean, H is the Hermitian conjugation, is the Hadamard product, and ρ y i y j is a complex valued correlation coefficient. Note that, for real-valued vectors, i.e., y R , Equation (1) gives the value of ρ y i y j between −1 and 1. In the complex domain, the magnitude of correlation is defined as C o r y i y j = | ρ y i y j | [ 0   1 ] . In addition, ρ y i y j also defines the reflectional and rotational correlations between y i and y j , of which the latter will be used in the homogeneity test. y i and y j will be rotationally dependent if one of them is obtained by rotating a certain angle from the other [38]. The phase angle of the rotation is [37]:
t a n ( Φ y i y j ) = i m ( ρ y i y j ) r e ( ρ y i y j )
where Φ y i y j is the rotation, which describes the angle required to go from the orientation of y i to that of y j in the complex plane, i m ( · ) and r e ( · ) indicate the imaginary and real components. A smaller | Φ y i y j | [ 0   π ] means a closer angle distance between y i and y j . Although providing the rotation and reflection information of the two complex vectors, the magnitude of the vector correlation | ρ y i y j | is rotation- and reflection-invariant [37]. A larger magnitude of the correlation, i.e., C o r y i y j = | ρ y i y j | [ 0   1 ] , reveals a higher similarity between the two complex vectors. Figure 1 describes the correlations of different cases where (a) shows the identical vectors, i.e., C o r y i y j = 1 , with different rotation angles, and (b) shows random vectors with both changing C o r y i y j and | Φ y i y j | . Note that the top-left plot in (a) indicates the case of completely same phase histories with C o r y i y j = 1 and | Φ y i y j | = 0 .
As the homogenous patches are supposed to share similar phase histories [15], smaller rotation angle and larger correlation magnitude should be expected between the tested pixel pairs. In the amplitude-based methods, hypothesis tests are operated on a pixel-by-pixel basis to explore pixel homogeneity, which profoundly slows down the process. However, the correlations can be much easier calculated through Equation (1). For a filtering window containing K pixels, the arranged spatiotemporal data stack of the windowed pixels is of the form:
Y = [ y 1 , y 2 , , y K ]
where y k = a k n + i b k n , n = 1 , 2 , , N , is the complex values of N interferograms on pixel k . Based on Equation (1), the problem can be efficiently solved on a window-basis by using the following matrix operation:
Ρ = ( Y Y ¯ ) H ( Y Y ¯ ) ( N 1 ) 1 d i a g ( ( Y Y ¯ ) H ( Y Y ¯ ) ( N 1 ) ) ( d i a g ( ( Y Y ¯ ) H ( Y Y ¯ ) ( N 1 ) ) ) H = ( Y Y ¯ ) H ( Y Y ¯ ) 1 d i a g ( ( Y Y ¯ ) H ( Y Y ¯ ) ) ( d i a g ( Y Y ¯ ) H ( Y Y ¯ ) ) H = [ 1 ρ y 1 y 2 ρ y 1 y 3 ρ y 1 y r ρ y 1 y K 2 ρ y 1 y K 1 ρ y 1 y K ρ y 2 y 1 1 ρ y 2 y 3 ρ y 2 y r ρ y 2 y K 2 ρ y 2 y K 1 ρ y 2 y K ρ y 3 y 1 ρ y 3 y 2 1 ρ y 3 y r ρ y 3 y K 2 ρ y 3 y K 1 ρ y 3 y K ρ y r y 1 ρ y r y 2   ρ y r y 3 1 ρ y r y K 2 ρ y r y K 1 ρ y r y K ρ y K 2 y 1 ρ y K 2 y 2 ρ y K 2 y 3 ρ y K 2 y r 1 ρ y K 2 y K 1 ρ y K 2 y K ρ y K 1 y 1 ρ y K 1 y 2 ρ y K 1 y 3 ρ y K 1 y r ρ y K 1 y K 2 1 ρ y K 1 y K ρ y K y 1 ρ y K y 2 ρ y K y 3 ρ y K y r ρ y K y K 2 ρ y K y K 1 1 ]
where Y ¯ indicates the arithmetic mean of Y , H is the Hermitian conjugation, is the Hadamard product, and d i a g ( ) returns the diagonal elements of the input matrix. Ρ ’s off-diagonal elements represent the complex correlation values between each vector pair of y i and y j . To identify a homogeneous neighborhood, we focus on correlations between surrounding pixels ( y k ) and the reference pixel ( y r ), normally the central pixel of the filtering window. Thus, the column (or row) of Ρ r , i.e., Ρ r = Ρ ( : , r ) , is used. The cluster of phase correlated pixels (PCPs) is then dependent on the pre-set thresholds of T e [ 0   1 ] and T r [ 0   π ] , i.e., qualified PCPs should satisfy C o r > T e and | Φ | < T r .
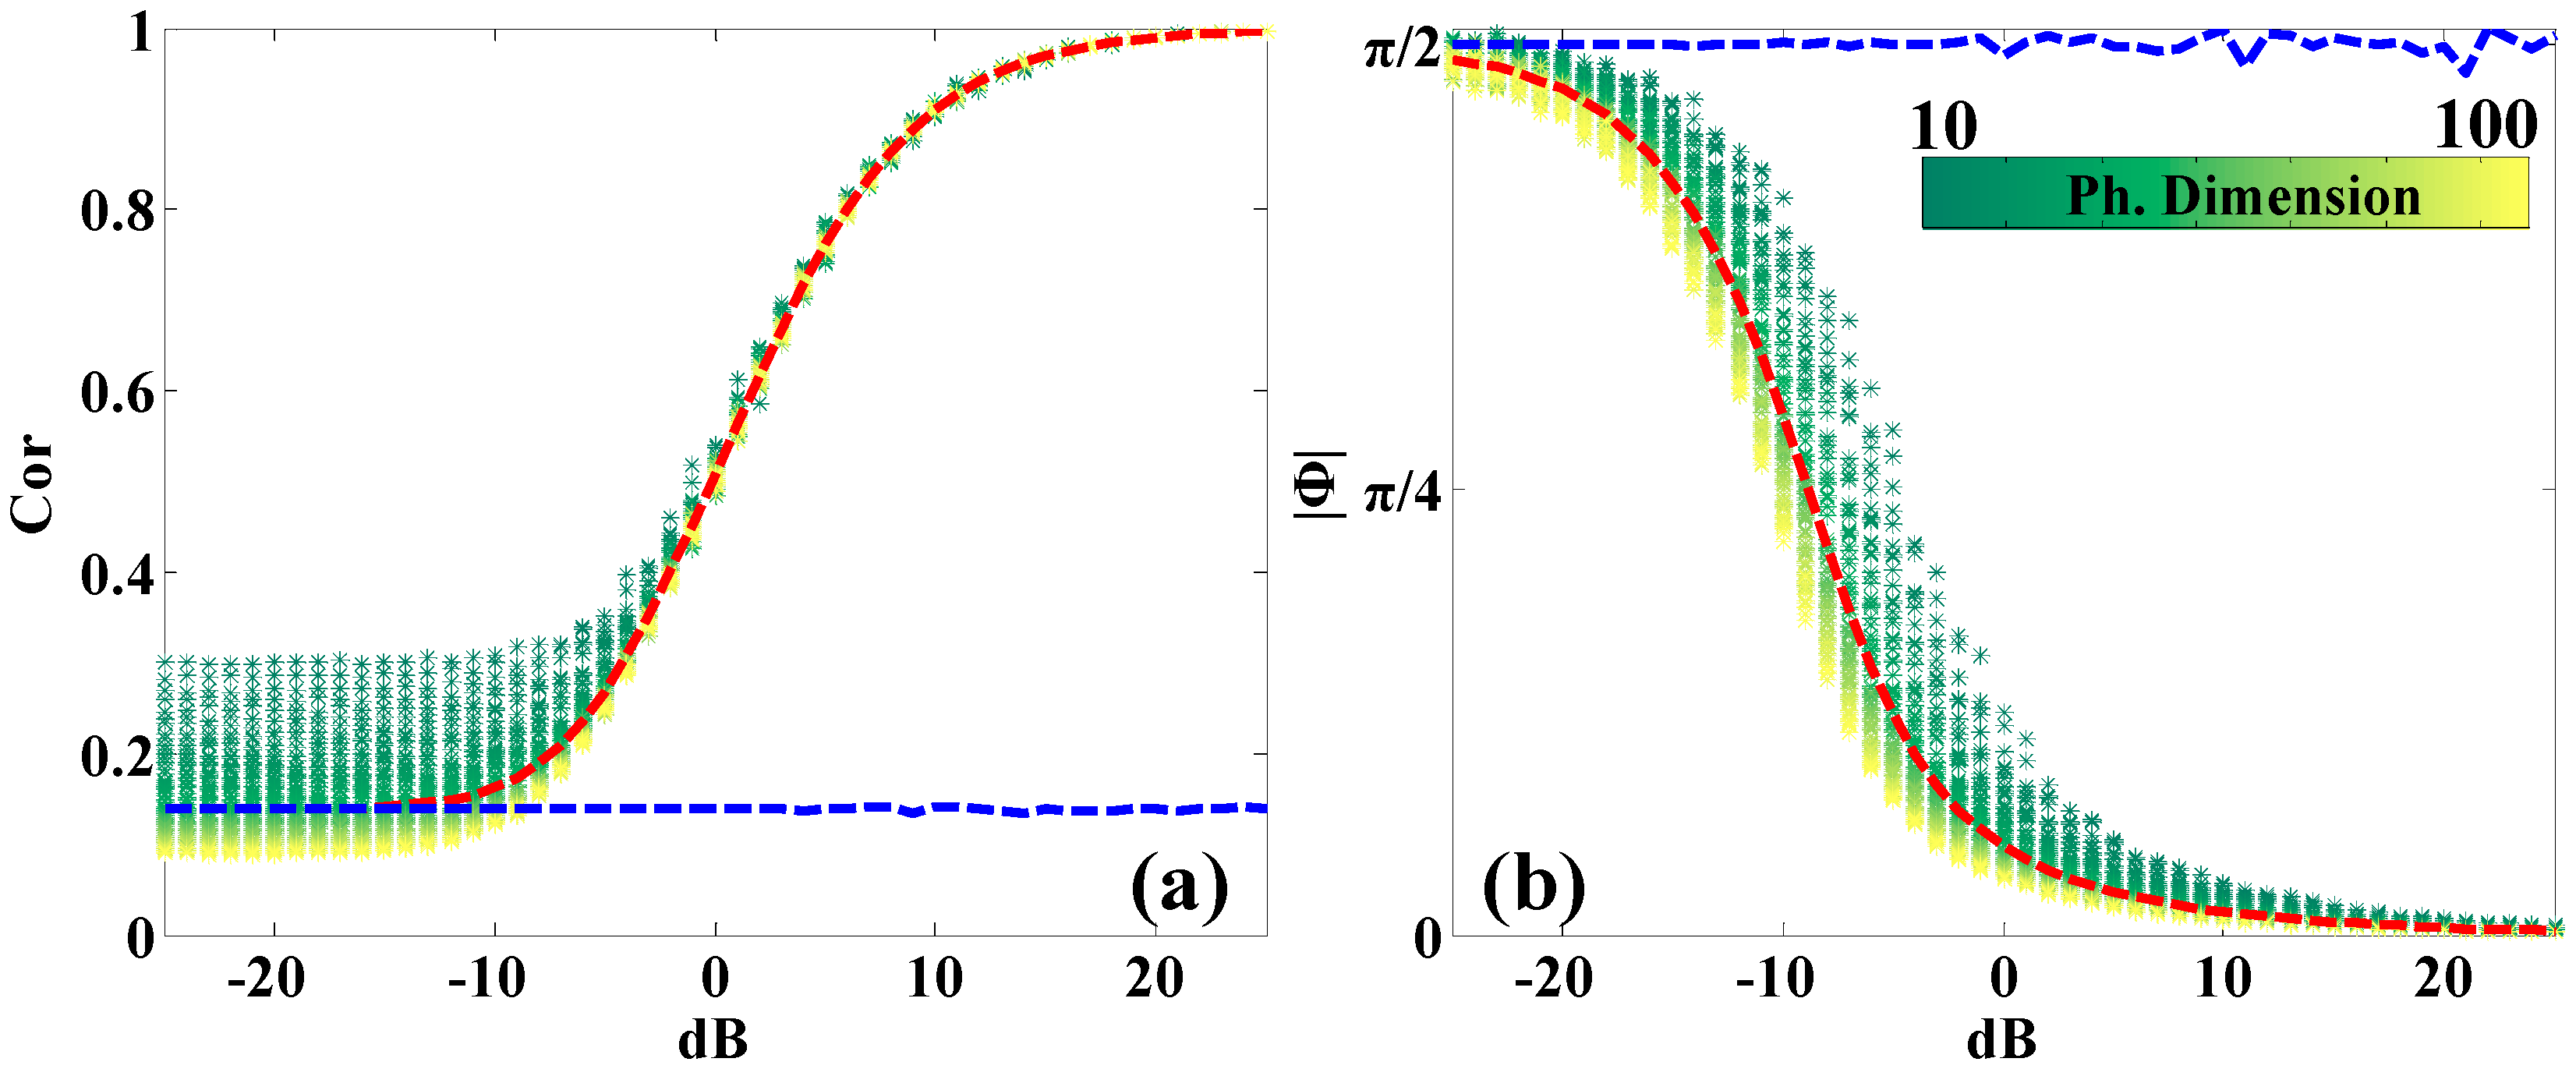
To examine the appropriate values of T e and T r , Monte Carlo simulation was performed to investigate properties of C o r and | Φ | under different phase noise and phase dimensions. Specifically, we consider PCPs to share the same noise-free phase vectors, i.e., the true complex signal, and the non-PCPs with different noise-free phase vectors. For those homogenous regions with useful radar returns, the PCPs should exist for both the high signal-to-noise ratio (SNR) PS pixels and the low SNR DS pixels. In general, phase noise of complex reflectivity follows a complex (circular) Gaussian (CCG) distribution [16,35]. Suppose homogeneous pixels are subject to equivalent level of noise effects, the noisy complex vectors of a pixel pair can be synthesized by adding equal-power noise to the true complex signal. In particular, we use the complex Gaussian white noise with zero mean and 10 P n o i / 10 variance ( P n o i is the power of noise in dBW). The simulation utilized phase vectors with dimensions from 10 to 100 and the SNR level from −25 to 25 dB. For each dimension-SNR combination, we adopted 20 sets of true signals, while for each set the noise treatment was repeated for 200 times, i.e., 4000 simulations. Results of the Monte Carlo simulation are given in Figure 2, where the location of each plotted scatter indicates the mean of the 4000 simulations. Note that for PCPs, C o r is not sensitive to the decrease of noise level at lower SNRs. C o r goes up rapidly when the SNR gets higher, at which level it could probably present a phase-similar PS pixel pair. This means more PCPs are expected to be clustered around higher SNR DSs and/or PSs given their neighborhood share similar phase vectors. On the other hand, the value of | Φ | is more sensitive to noise levels when the SNR is lower. The dashed lines in Figure 2 indicate the mean value of all the plotted scatters in the phase dimension direction. For non-PCP pairs, only the dimensional mean is plotted (blue dashed line). Both of the mean values of C o r and | Φ | from non-PCPs show an invariable trend regardless of different SNRs. C o r curves from the PCP and non-PCP pairs diverge at SNR of ~−10 dB, whereas for | Φ | the discrimination occurs at a much lower level of ~−20 dB. In other words, for lower SNRs, the rotation angle plays a more decisive role in clustering potential PCPs. Without loss of generality, we use the mean values along the red dashed lines for the setting of thresholds in our following analysis. Consider a SNR of −10 dB, the Monte Carlo results suggest that T e and T r should be preferably set as 0.16 and 0.9, respectively. These values are adopted in the simulated experiments presented in Section 3.

2.2. Phase Reconstruction Using Coherence Weighted Phase Link (WPL)

As the coherence matrix of DS is generally not as redundant as that of PS (rank 1), the property of phase triangularity is no longer satisfied for DS. Rather than the N phase values of a PS, we need to address the N ( N 1 ) / 2 interferometric phase values [15]. Strategy to estimate the N DS phase observations refers to the PTA, which reconstructs a set of consistent interferometric phases from a stack of inconsistent multilooked interferograms [36,46]. The multilook uses coherent neighbors that are identified by the PCPs, of which the sample coherence matrix is given by:
C ^ 1 N Ω i Ω d ¯ d ¯ H = | C ^ | ϕ
where C ^ is the estimated coherence matrix, d ¯ = [ d ¯ 1 , d ¯ 2 , , d ¯ N ] T is the normalized complex observation, i.e., E [ | d ¯ i | 2 ] = 1 , Ω is the detected PCP family, N Ω is the number of pixels in Ω , and ϕ is the N × N matrix with the complex interferometric phase observations. According to [46], the phase values are estimated up to an arbitrary additive constant because the C ^ contains only differential (interferometric) phase. The problem is therefore underdetermined given that we have N phases to be solved. Without loss of generality, one of the phase estimates is set to be zero (e.g., the master image) [39]. That way, the interferometric phases are estimated with respect to the assumed master image. The maximum likelihood estimation of N 1 phase estimations can be obtained by:
θ = a r g   max θ { Λ H ( | C ^ | 1 C ^ ) Λ }
where Λ = [ e i ( θ 1 θ o ) , e i ( θ 2 θ o ) , , e i ( θ N θ o ) ] T = [ 1 , e i θ 2 , o , , e i θ N , o ] T is the N-dimensional vector that contains the optimized N 1 phase values, θ o is the phase of the assumed master image. In this case, master image is tagged on the first SAR acquisition, i.e., θ o = θ 1 . Based on the mathematical framework presented in [36], Equation (6) can be rephrased as:
θ = a r g   max θ { s u m ( ( | C ^ | 1 | C ^ | ) ϕ ( Λ Λ H ) T ) } = a r g   max θ { N + 2 m = 1 N n > m N γ m , n cos ( ϕ m , n θ m , n ) } = a r g   max θ { m = 1 N n > m N γ m , n cos ( ϕ m , n θ m , n ) }
where ϕ m , n is the phase observation from the estimated coherence matrix, θ m , n = θ m , o θ n , o is the optimized phase value, and γ m , n is the entry from matrix | C ^ | 1 | C ^ | at row m and column n . Therefore, the maximum likelihood estimation is actually obtained by searching the maximum summation of cos ( ϕ m , n θ m , n ) with their corresponding weights γ m , n . By setting different γ m , n values, estimators of Equation (7) can be recognized as different PTA strategies. To solve this nonlinear system, one option is to use the Broyden–Fletcher–Goldfarb–Shanno (BFGS) algorithm [15]. However, as is well recognized, the quasi-Newton method is extremely time consuming for an optimization solution [40]. Instead, we utilize an iteration procedure learned from Guarnieri and Tebaldini [39], which offers high computational efficiency when the approximate, rather than the optimized, solution is to be estimated. We directly use the coherence matrix as the weight factor in the iteration process, i.e., γ m , n is derived from | C ^ | [41]. The phase reconstruction strategy is referred as coherence weighted phase link (WPL) hereafter, i.e.,:
θ ^ n k = { m n N { C ^ } n m e x p ( j θ ^ n k 1 ) }
where k is the iteration index and θ ^ is the estimated phase. The matrix inversion operation is omitted in the WPL, which accordingly reduced the computation load. To retrieve the interferometric phases with respect to the assumed master image, the phase values can be calculated by θ ^ n , o k = θ ^ n k θ ^ o k . We refer this homogeneous filtering strategy as the PCPWPL method.

2.3. Combined Processing of PS and DS

The amplitude dispersion index (ADI) was adopted for the initial selection of the potential PS pixels [7]. To build up the basis of the first-tier PS network, the Delaunay triangulation network was adapted to connect the PS candidates, i.e., with ADI smaller than a given threshold. The atmospheric phase screen (APS) is considered to be same within a relatively close distance [20,42]. Therefore, the APS on one of the two PSs can be removed by subtracting the phase of its adjacent PS neighbor. Before estimating the arc parameters, we reject these long arcs as the assumption of APS homogeneity may be broken [20,42]. The reserved arcs are then used to estimate arc parameters between the linked PSs, through the beamforming estimator,
γ ^ ( s , v ) = | a ( s , v ) H y | a ( s , v ) H 2 y 2
a ( s , v ) = [ e x p ( j 2 π ( ξ 1 s + η 1 v ) ) e x p ( j 2 π ( ξ N s + η N v ) ) ]
where s and v are the slant elevation and deformation mean velocity in satellite line of sight (LOS), y is the complex data vector after phase compensation and a is the steering vector, ξ n = 2 b n λ R and η n = 2 t n λ are the spatial and temporal frequency, respectively, λ , R , b n , and t n are the wavelength, satellite slant range distance, interferogram normal baseline and temporal baseline, · 2 is the 2-norm calculator. The nature of beamforming is essentially the same as periodogram after the removal of amplitude information in y [7]. By defining different samplings of s and v , the two-dimensional estimates of γ ^ in the elevation and velocity directions can be derived via Equation (10). Qualified PS arcs are selected depending on the maximum magnitude of γ ^ , i.e., the temporal coherence [6,42]. We consider a PS-linked arc if γ ^ > T s , where T s is set between 0 and 1. Otherwise, the arc is rejected from the PS network. After this step, all the relative parameters of s and v on the reserved arcs are estimated by locating their maximum γ ^ . The beamforming uses a discrete interval in the searching space to find its optimal solutions of s and v and it adopts all SAR observations including those with lower SNRs. To improve the accuracy of the PS reference network, we first temporally unwrap the phase based on the preliminary estimates, and then transform the problem into a continuous inversion, i.e.,
Δ ϕ = D J = [ 2 π ξ 1 2 π η 1 2 π ξ N 2 π η N ] [ s v ] T
where Δ ϕ is the unwrapped phase. The arc parameters J can be re-estimated in a continuous searching space using a least square estimation (LSE):
J ^ = ( D T D ) 1 D T Δ ϕ
To mitigate the influence of possible phase outliers, the procedure of iterative weighted LSEs, i.e., M-estimator, was used to solve Equation (12). The M-estimator makes the estimates less vulnerable to phase outliers by iteratively reassigning smaller weights to a large residual phase, please refer to references [20,42]. As to guarantee the accuracy of the reference PS network, the choice of T s and termination of the M-estimator can be appropriately strict in this step. The absolute values of deformation rate and elevation for PS pixels are eventually obtained based on the network adjustment by using one reference point in the monitoring area. Alternatively, to extend and improve the spatial density of the reference network, the coherence threshold of T s can be slightly reduced to include new PS candidates.
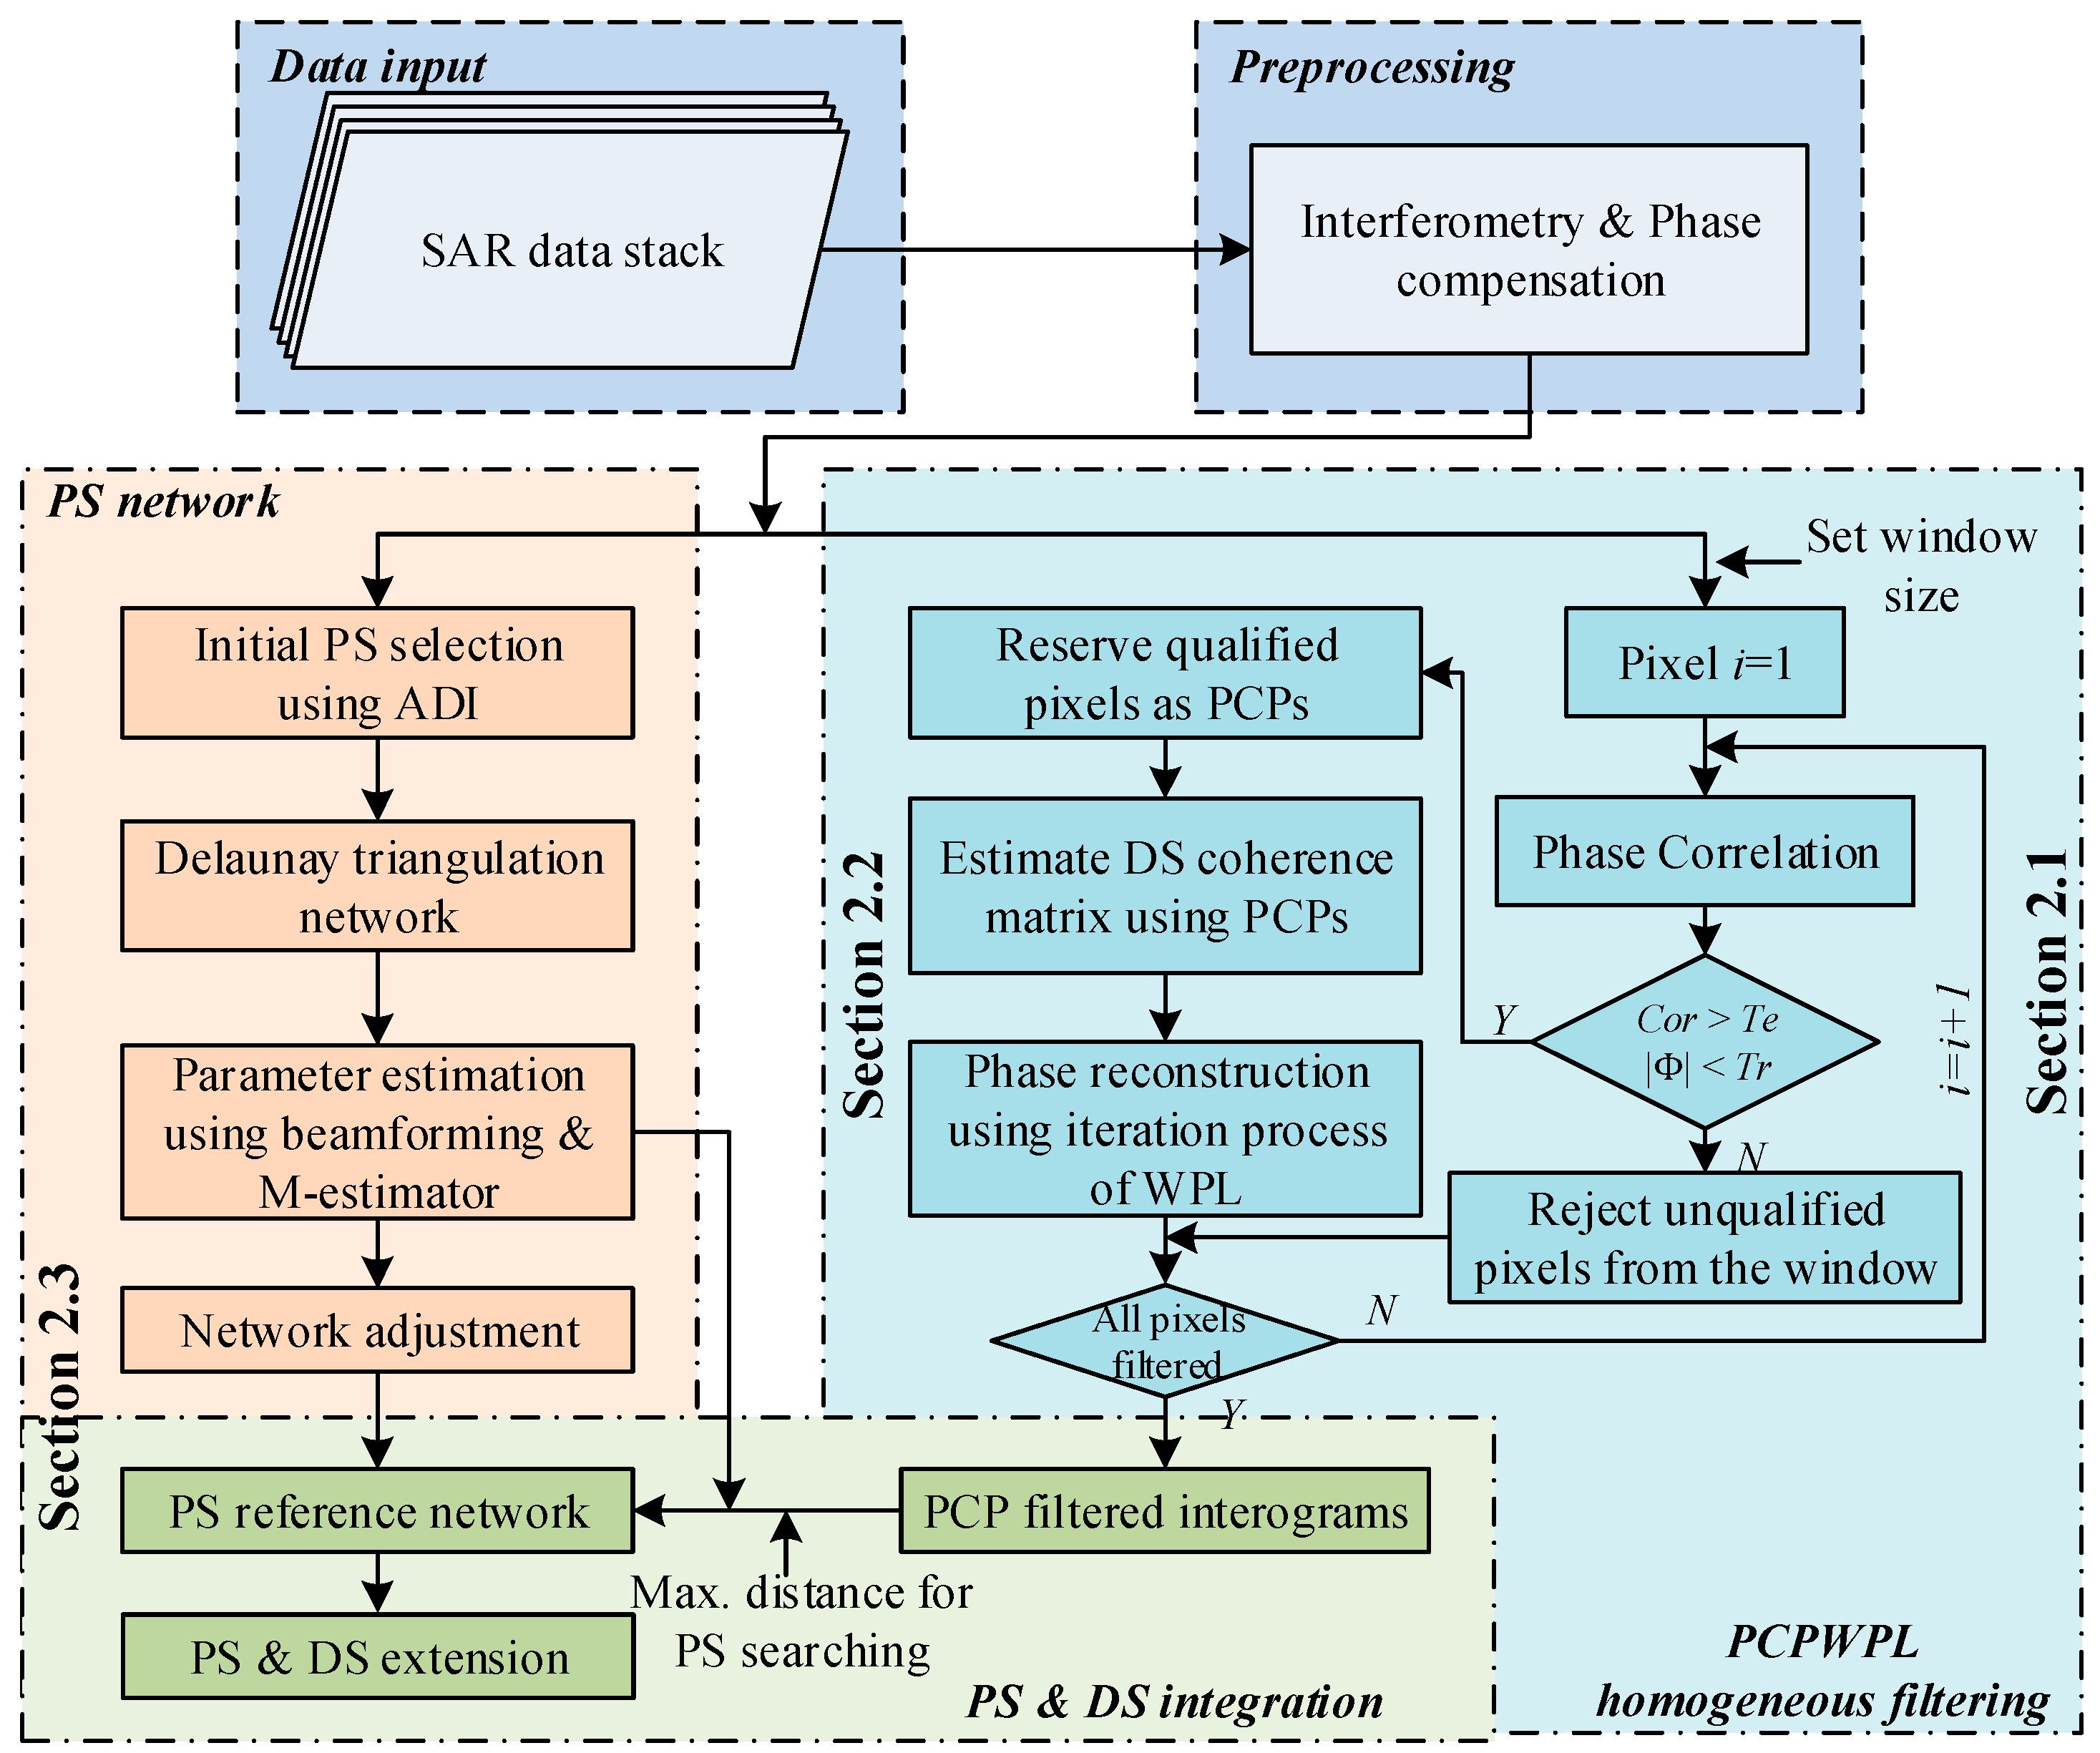
The detection of PS network is based on original interferograms with the valuable PS phases unfiltered. To extend DS measurements, the homogeneously filtered interferograms from PCPWPL are used. In amplitude-based methods, potential DS candidates can be identified by using thresholds such as the number of SHPs [20,40]. However, the exact boundary between PS and DS (or DS-like) pixels cannot be well defined especially when small ground cells are captured by high-resolution sensors [35]. In this paper, all the non-PS pixels that were excluded by the PS result are treated as potential DS candidates, reducing the possible omissions. The extension of DS is then completed based on local star networks that connect the DS candidates to their nearest PS reference point. Parameters along the DS arcs are estimated using the same strategy as the PS network. Alternatively, multiple arc solutions for DS can be adopted to improve the robustness of DS measurements. In that case, the DS candidates are connected to multiple nearest PS points (e.g., the five closest PS pixels in distance). To search nearby PS reference points, a moving window (with its central pixel to be the DS candidate under analysis) is adopted. The size of the window is determined by a distance threshold, within which the detected PSs can be used as reference points. The parameters of interest on DS locations are then obtained by adding the arc solutions with the highest γ ^ to the value of the corresponding connected PS. A flowchart of the proposed procedure is summarized in Figure 3.

3. Simulated Experiments

In this section, the PCPWPL method is tested using a set of simulated SAR data. The complex values z of single look complex (SLC) images were modeled under a CCG model with covariance matrix Σ , i.e.,
f ( z ) = 1 π n d e t ( Σ ) e z H Σ 1 z
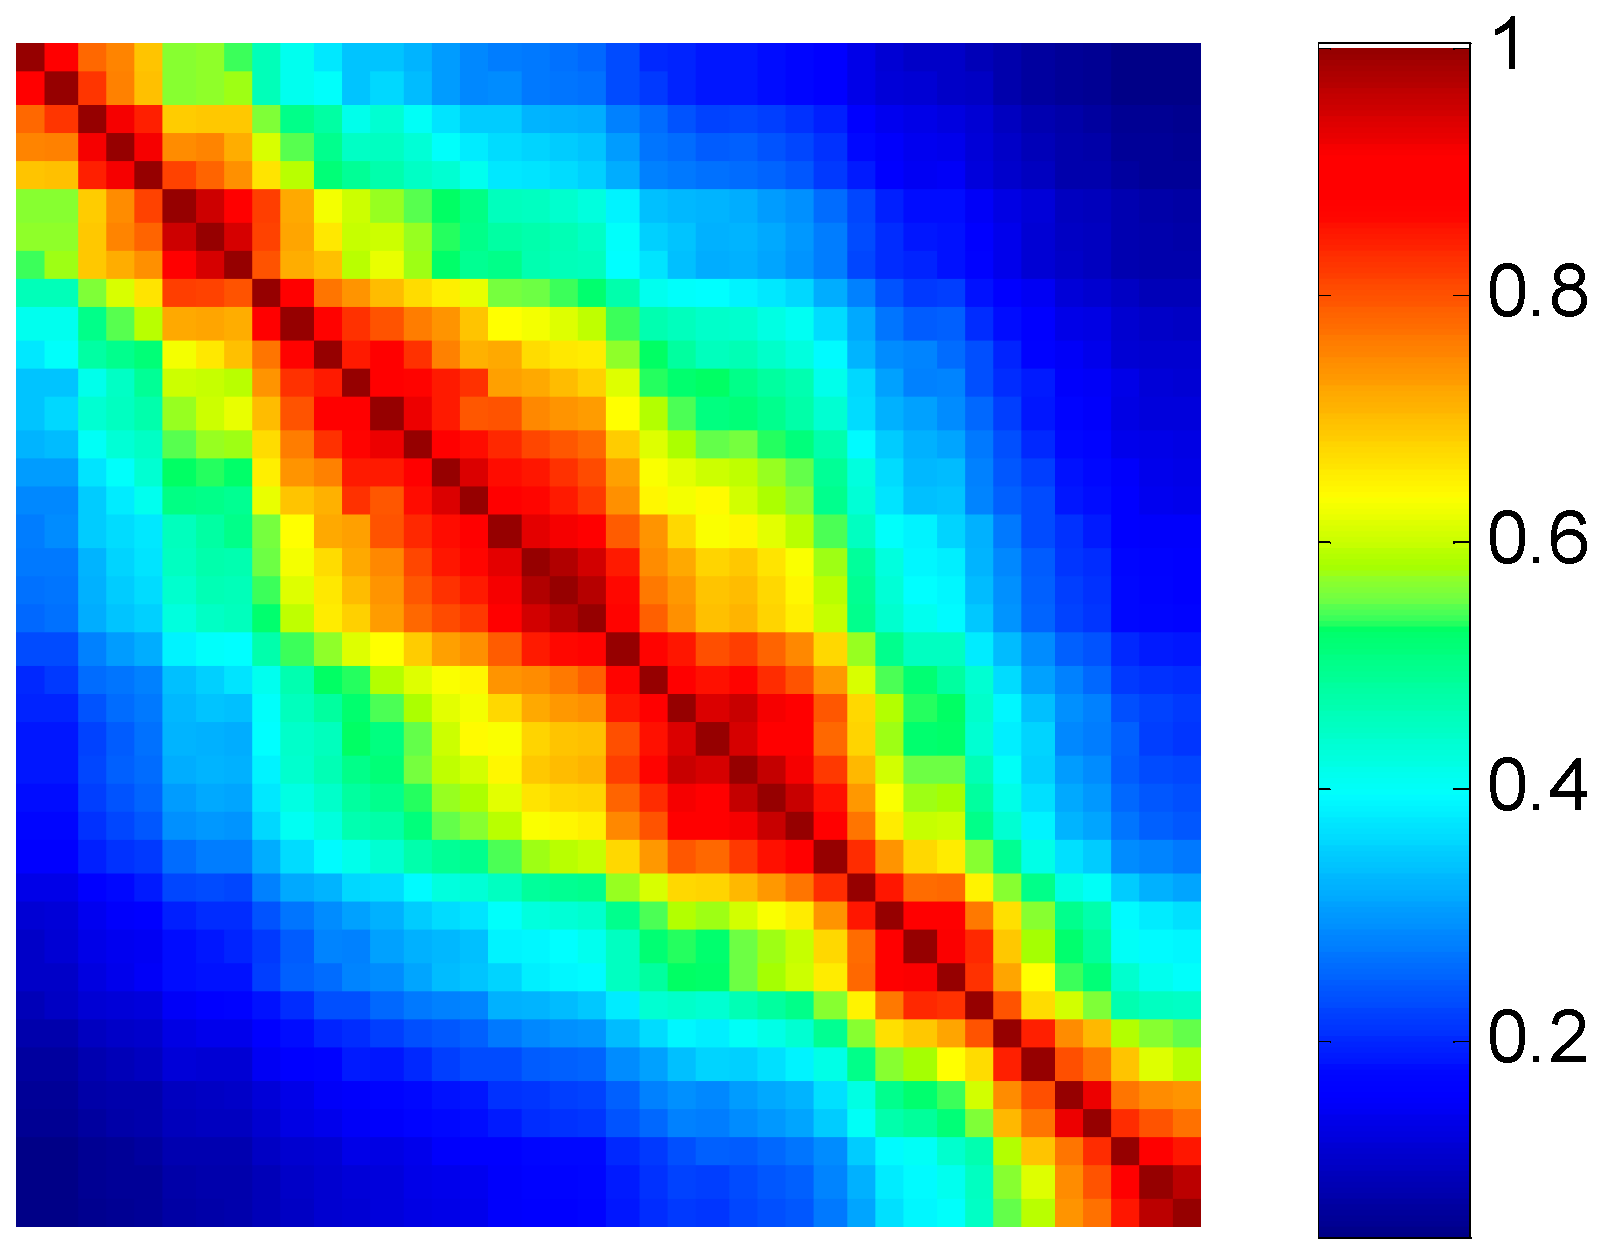
A typical X-band sensor configuration was adopted, e.g., wavelength: 3.1 cm, slant range: 630 km, repeat cycle: 11 days, incidence angle: 38 degrees. Spatial baseline was randomly set between the range of −400 m to 400 m. To simulate coherence between the synthetic SLCs, the temporal and geometrical decorrelation were considered. We assume an exponential decay of the temporal correlation. The decorrelation components γ t e m p and γ g e o m are given in Equation (14), where B T and B are the temporal and perpendicular baselines, t and B m a x are the decorrelation rate and the critical baseline, respectively. t and B m a x in this simulation are set to be 550 days and 7.5 km, respectively. For details of the data simulation, readers are referred to [40,47]. Figure 4 gives a typical coherence matrix of the 40 simulated images under the concerned decorrelation terms.
γ t e m p = e B T t , γ g e o m = m a x ( 1 | B | B m a x , 0 )
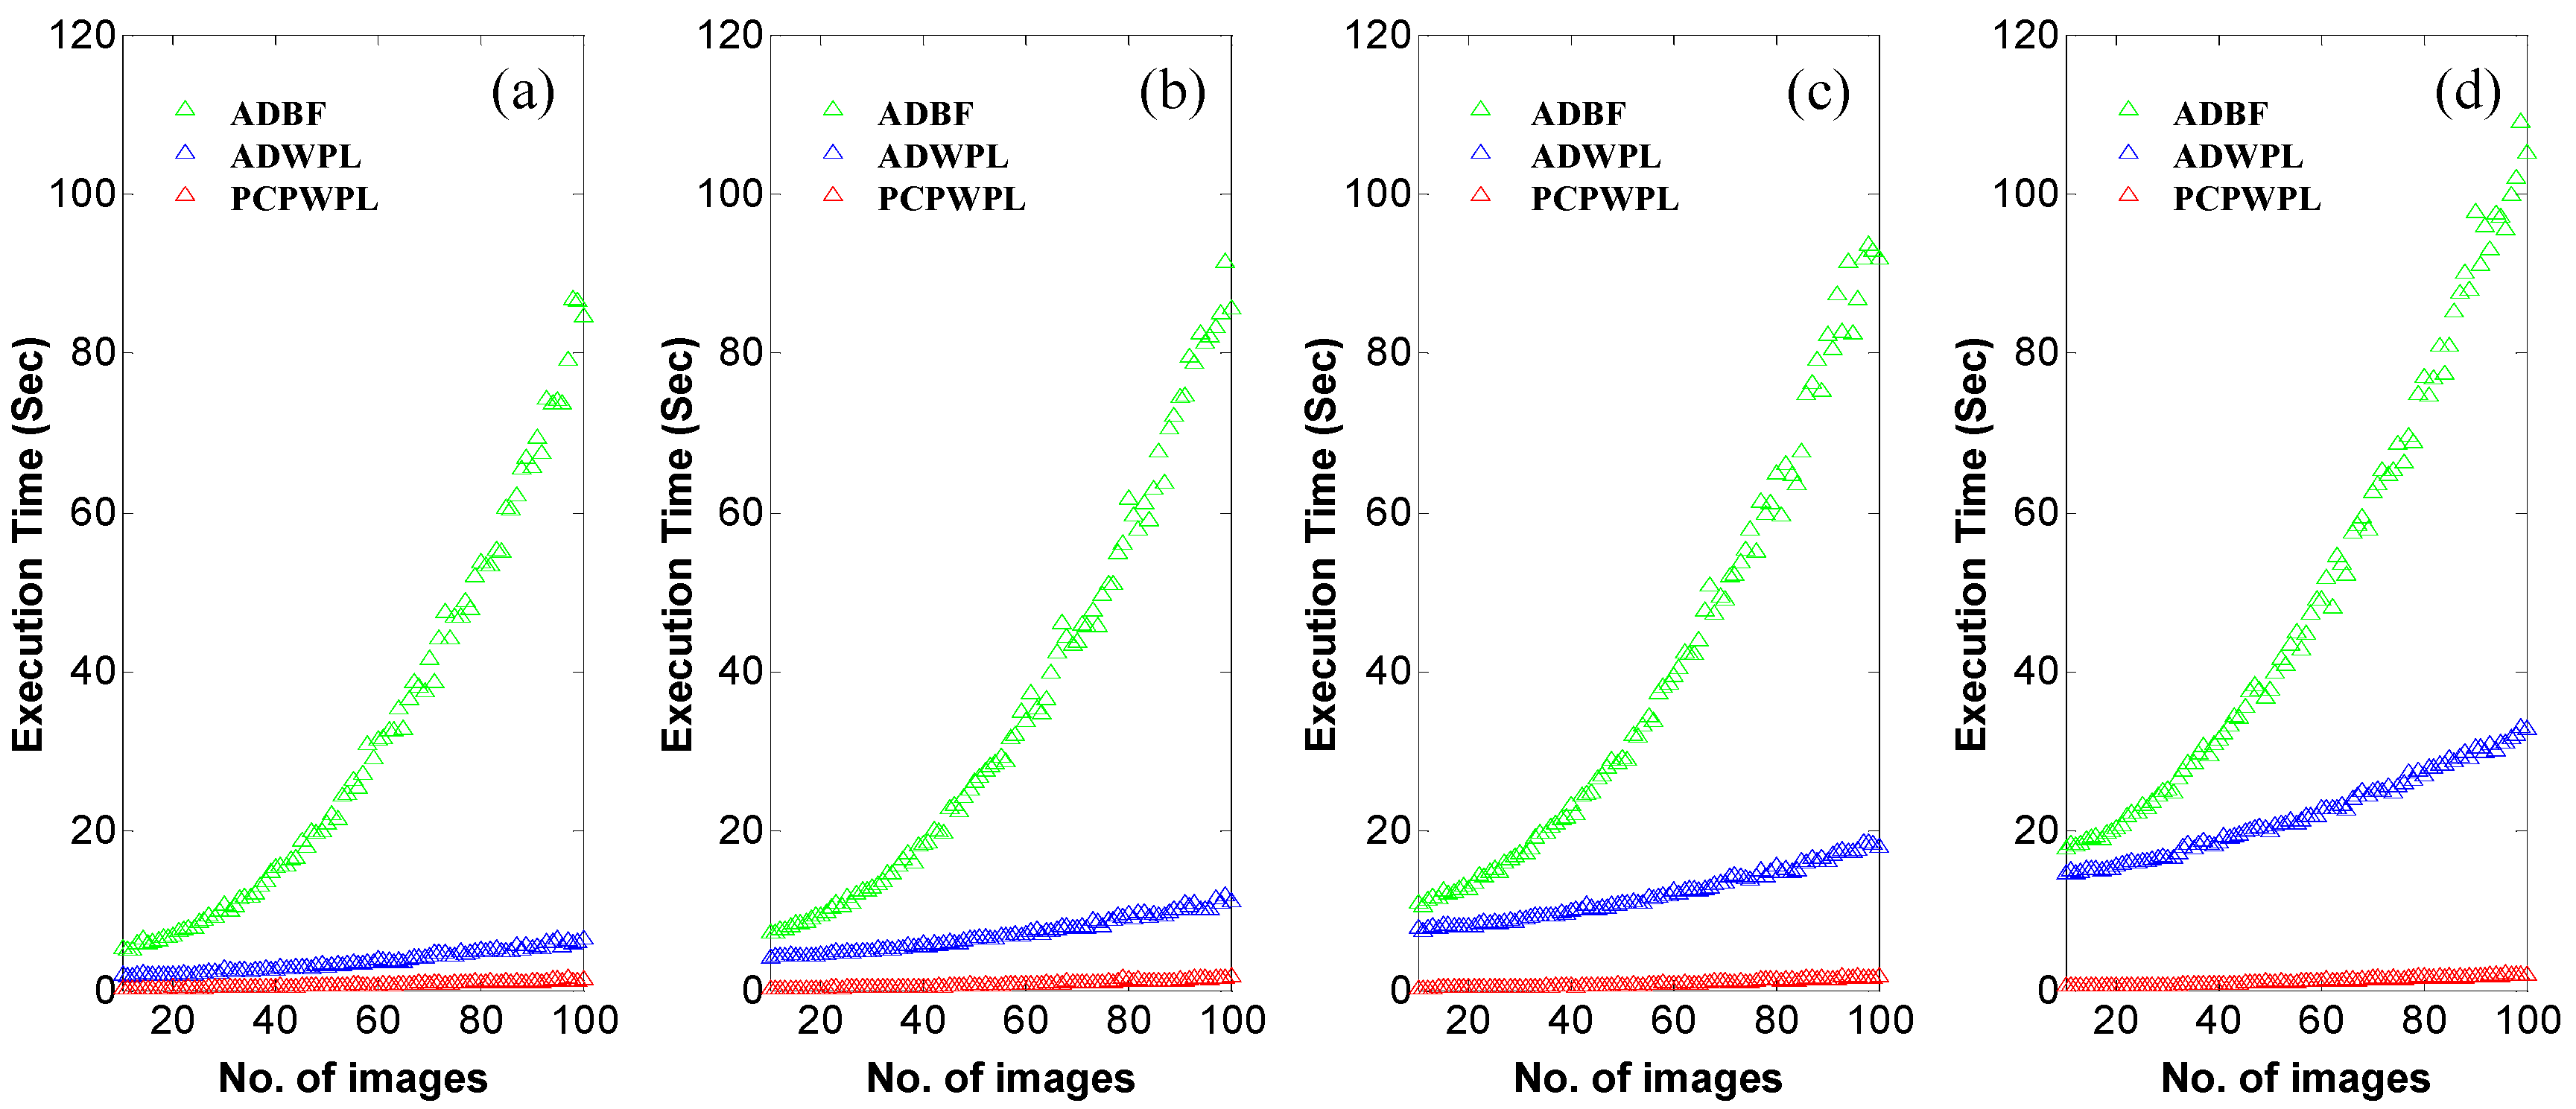
We generated 91 SLC stacks, with image numbers (phase dimensions) of N = 10, 11, …100. The performance of PCPWPL was tested with comparison to the conventional amplitude-based method. The AD test has been proved to outperform other alternative algorithms [48,49], therefore we chose the AD test as the representative for the amplitude-based clustering strategy. Three different strategies were therefore designed for the comparison in their computational efficiency. Namely, the amplitude-based AD test + BFGS (ADBF), the amplitude-based AD test + WPL (ADWPL), and the phase correlated pixel (PCP) + WPL (PCPWPL). To be more specific, AD test is conducted under a significance level of 5%. A threshold of 10−5 between iterations was set for terminating the phase reconstruction procedure, with a maximum iteration number of 300. The running environment is based on Matlab platform R2013b operating on a 2.7 GHz Intel Core i7 CPU. Figure 5 presents the execution time of the tested methods under different configurations for processing 50 pixels. In the first step of pixel clustering, the efficiency of using PCP is significant by comparing the time cost of ADWPL and PCPWPL. In fact, the majority of time consumed in ADWPL was for the SHP detection by the AD test. This deficiency becomes even more conspicuous when the window size gets larger as indicated in Figure 5d. In the second step of phase reconstruction, the BFGS undergoes a nonlinear computational complexity with the increase of image number, which sharply widens the gap in execution time with its competitors. The deficiency of BFGS in retrieving high-dimensional phase histories was also discussed in Zhang et al. [40]. Time consumption curves of ADBF and ADWPL have demonstrated the superiority of using iterative WPL for the refinement of DS phase observation. We give more details of the time comparison regarding the separate steps of pixel clustering and phase reconstruction in Figure S1 of the Supplementary Material. Among the three strategies, PCPWPL remains the lowest execution time in all the tested cases. For example, time cost in Figure 5d (window size 21 × 21) for a N = 100 case is about 1.9s (0.6 s for PCP clustering and 1.3 s for phase reconstruction) for the PCPWPL, 32.8 s for ADWPL, and roughly 105.0 s for the ADBF.
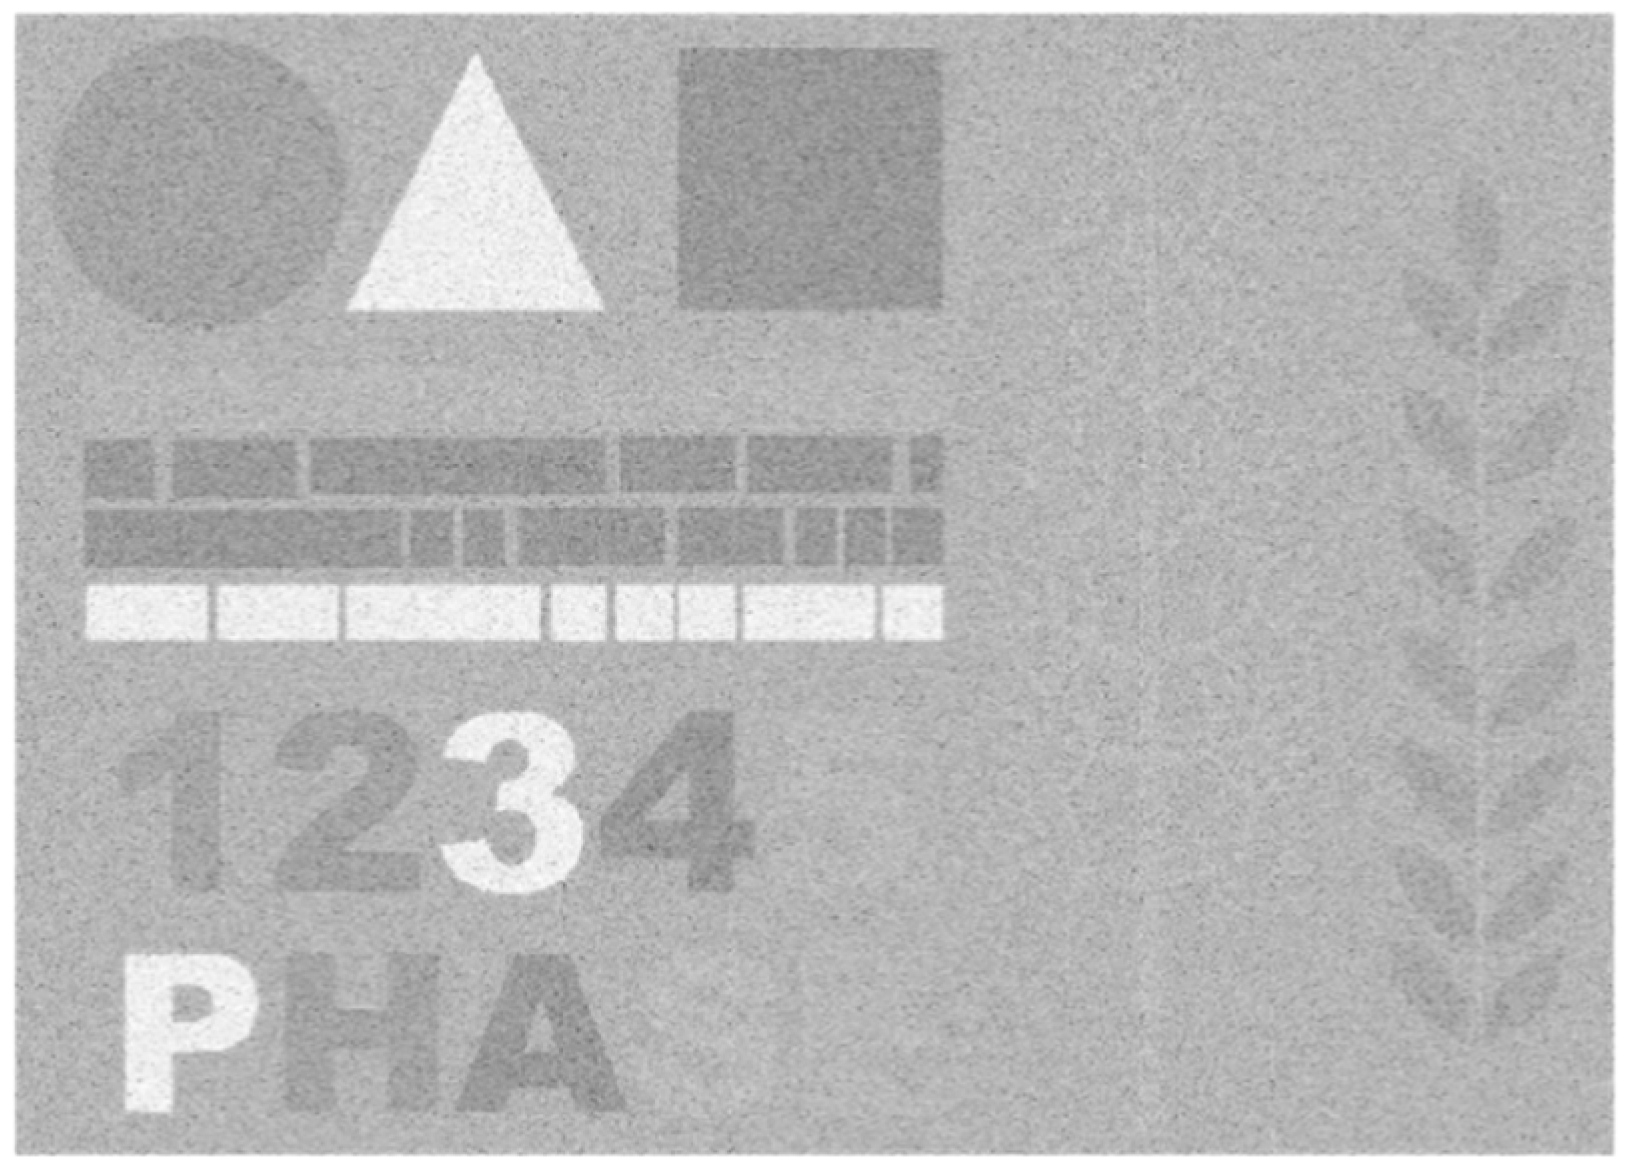
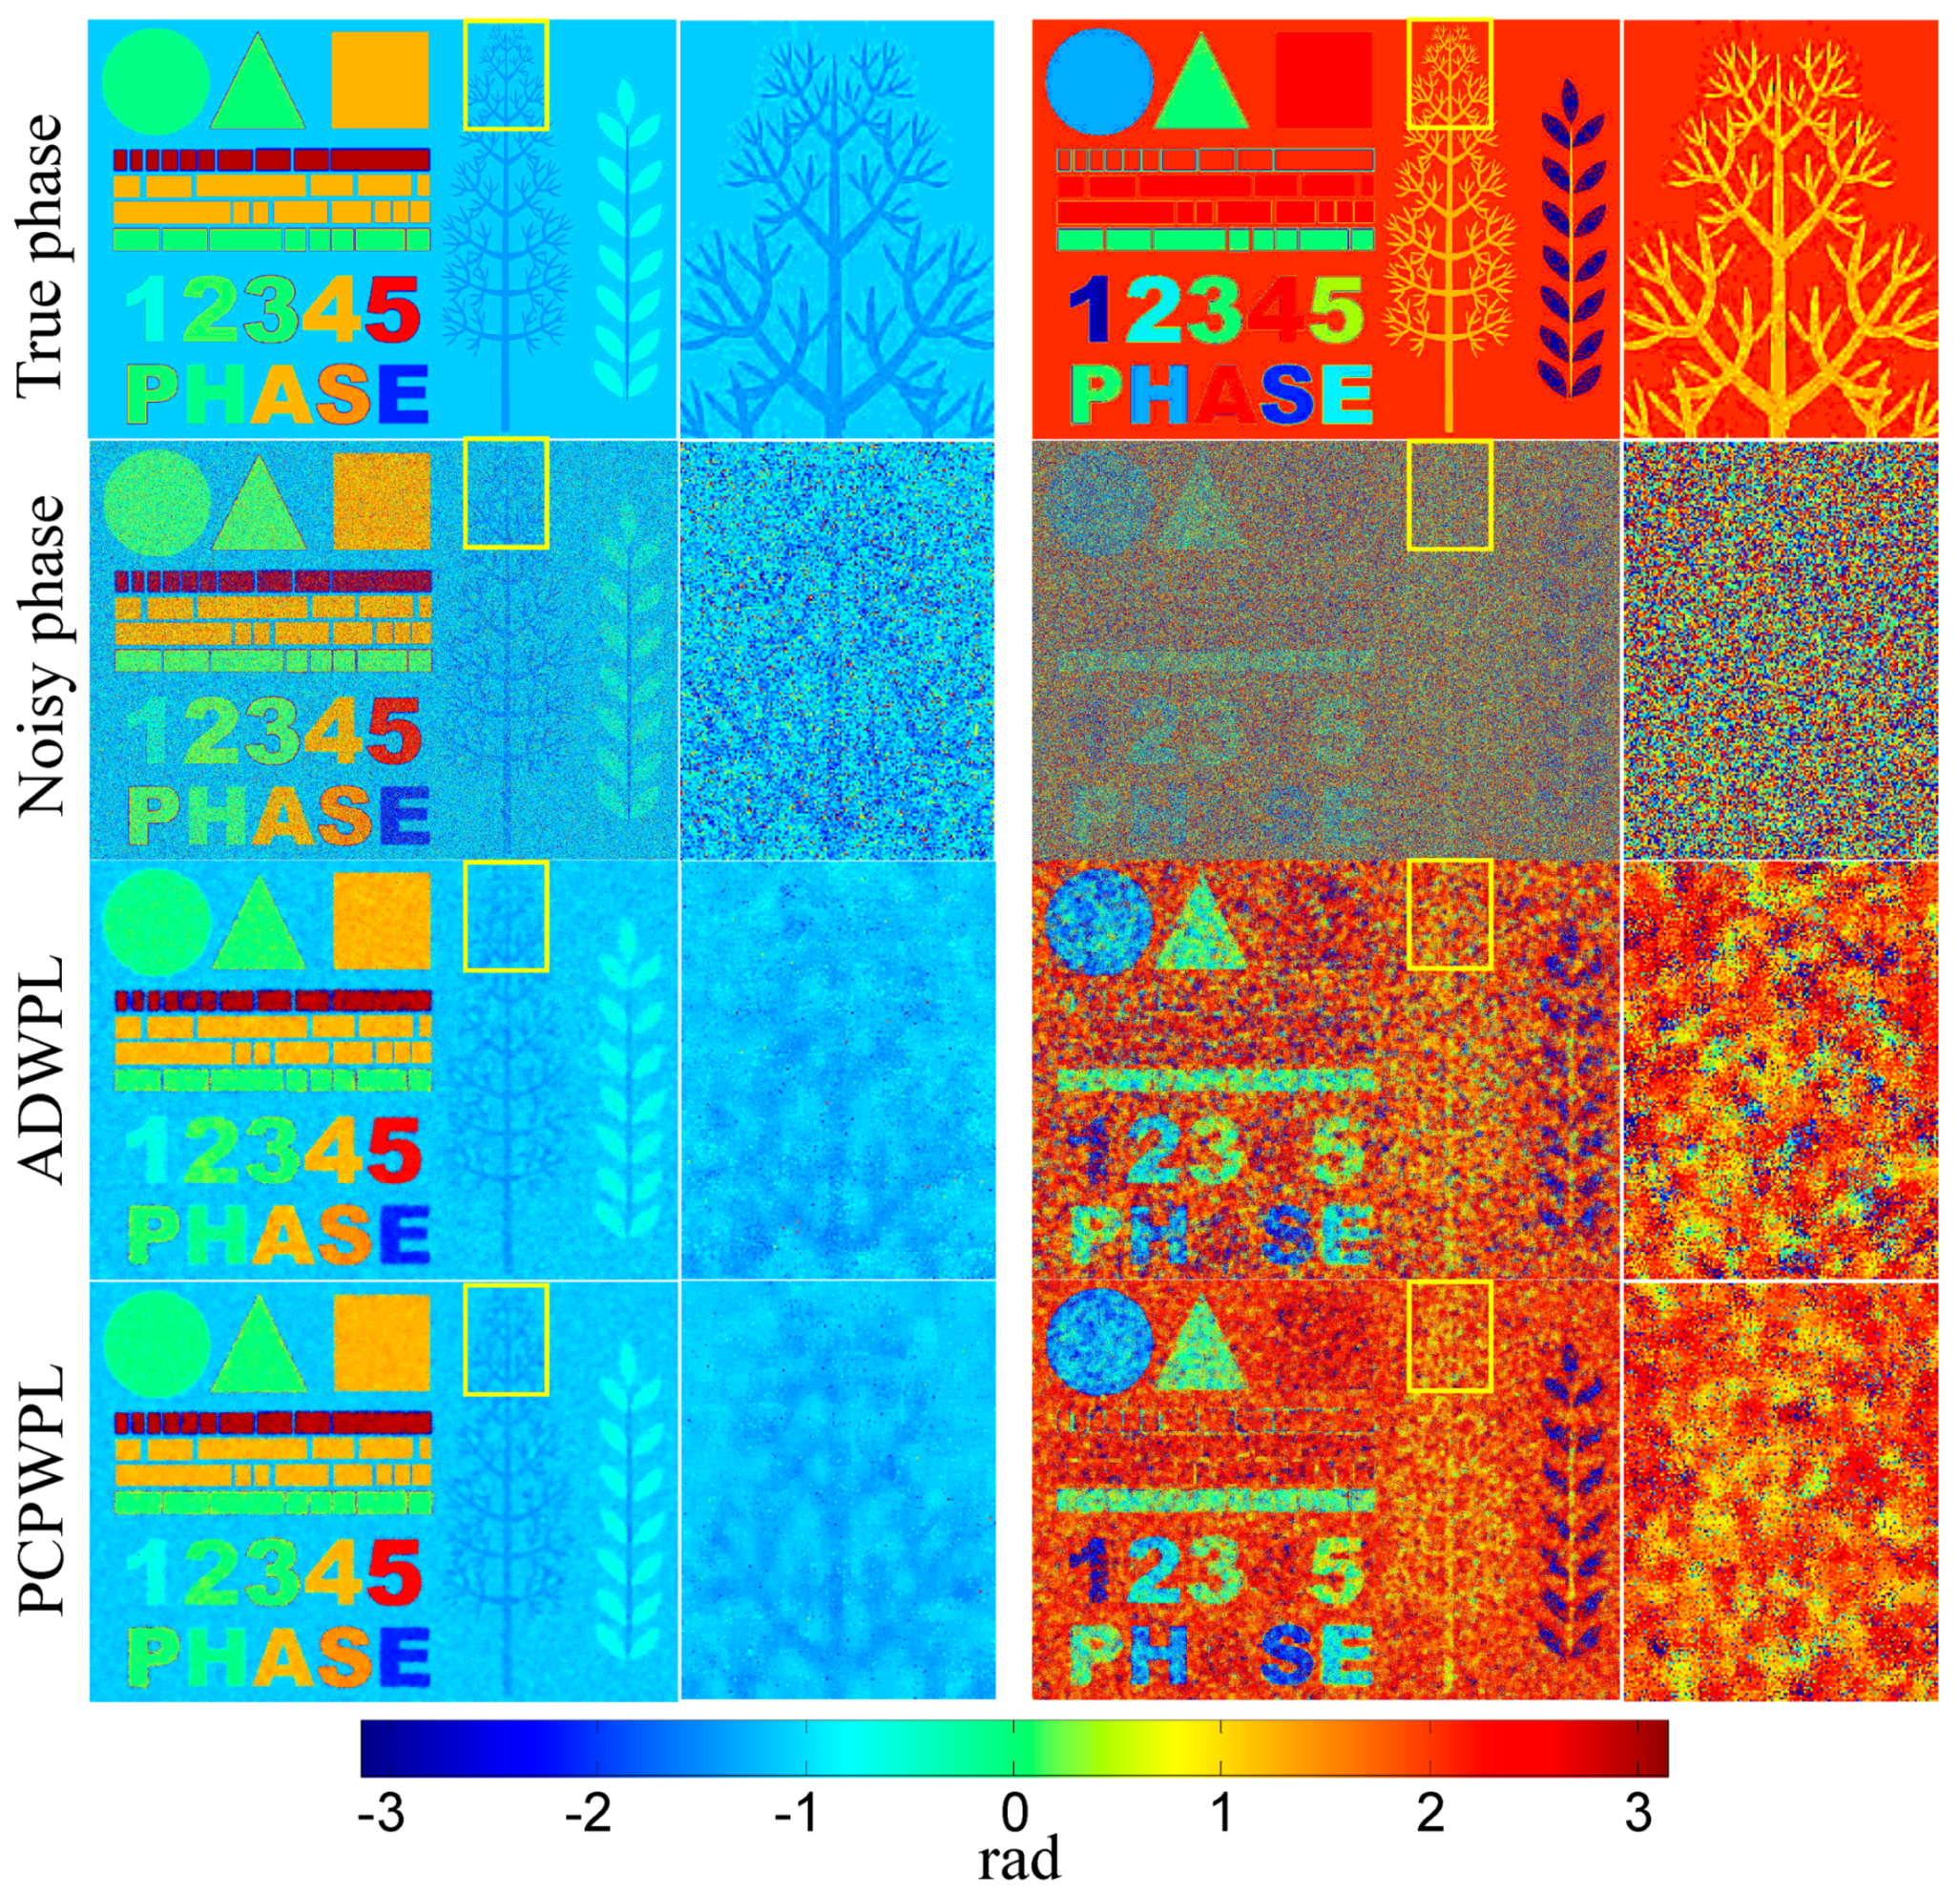
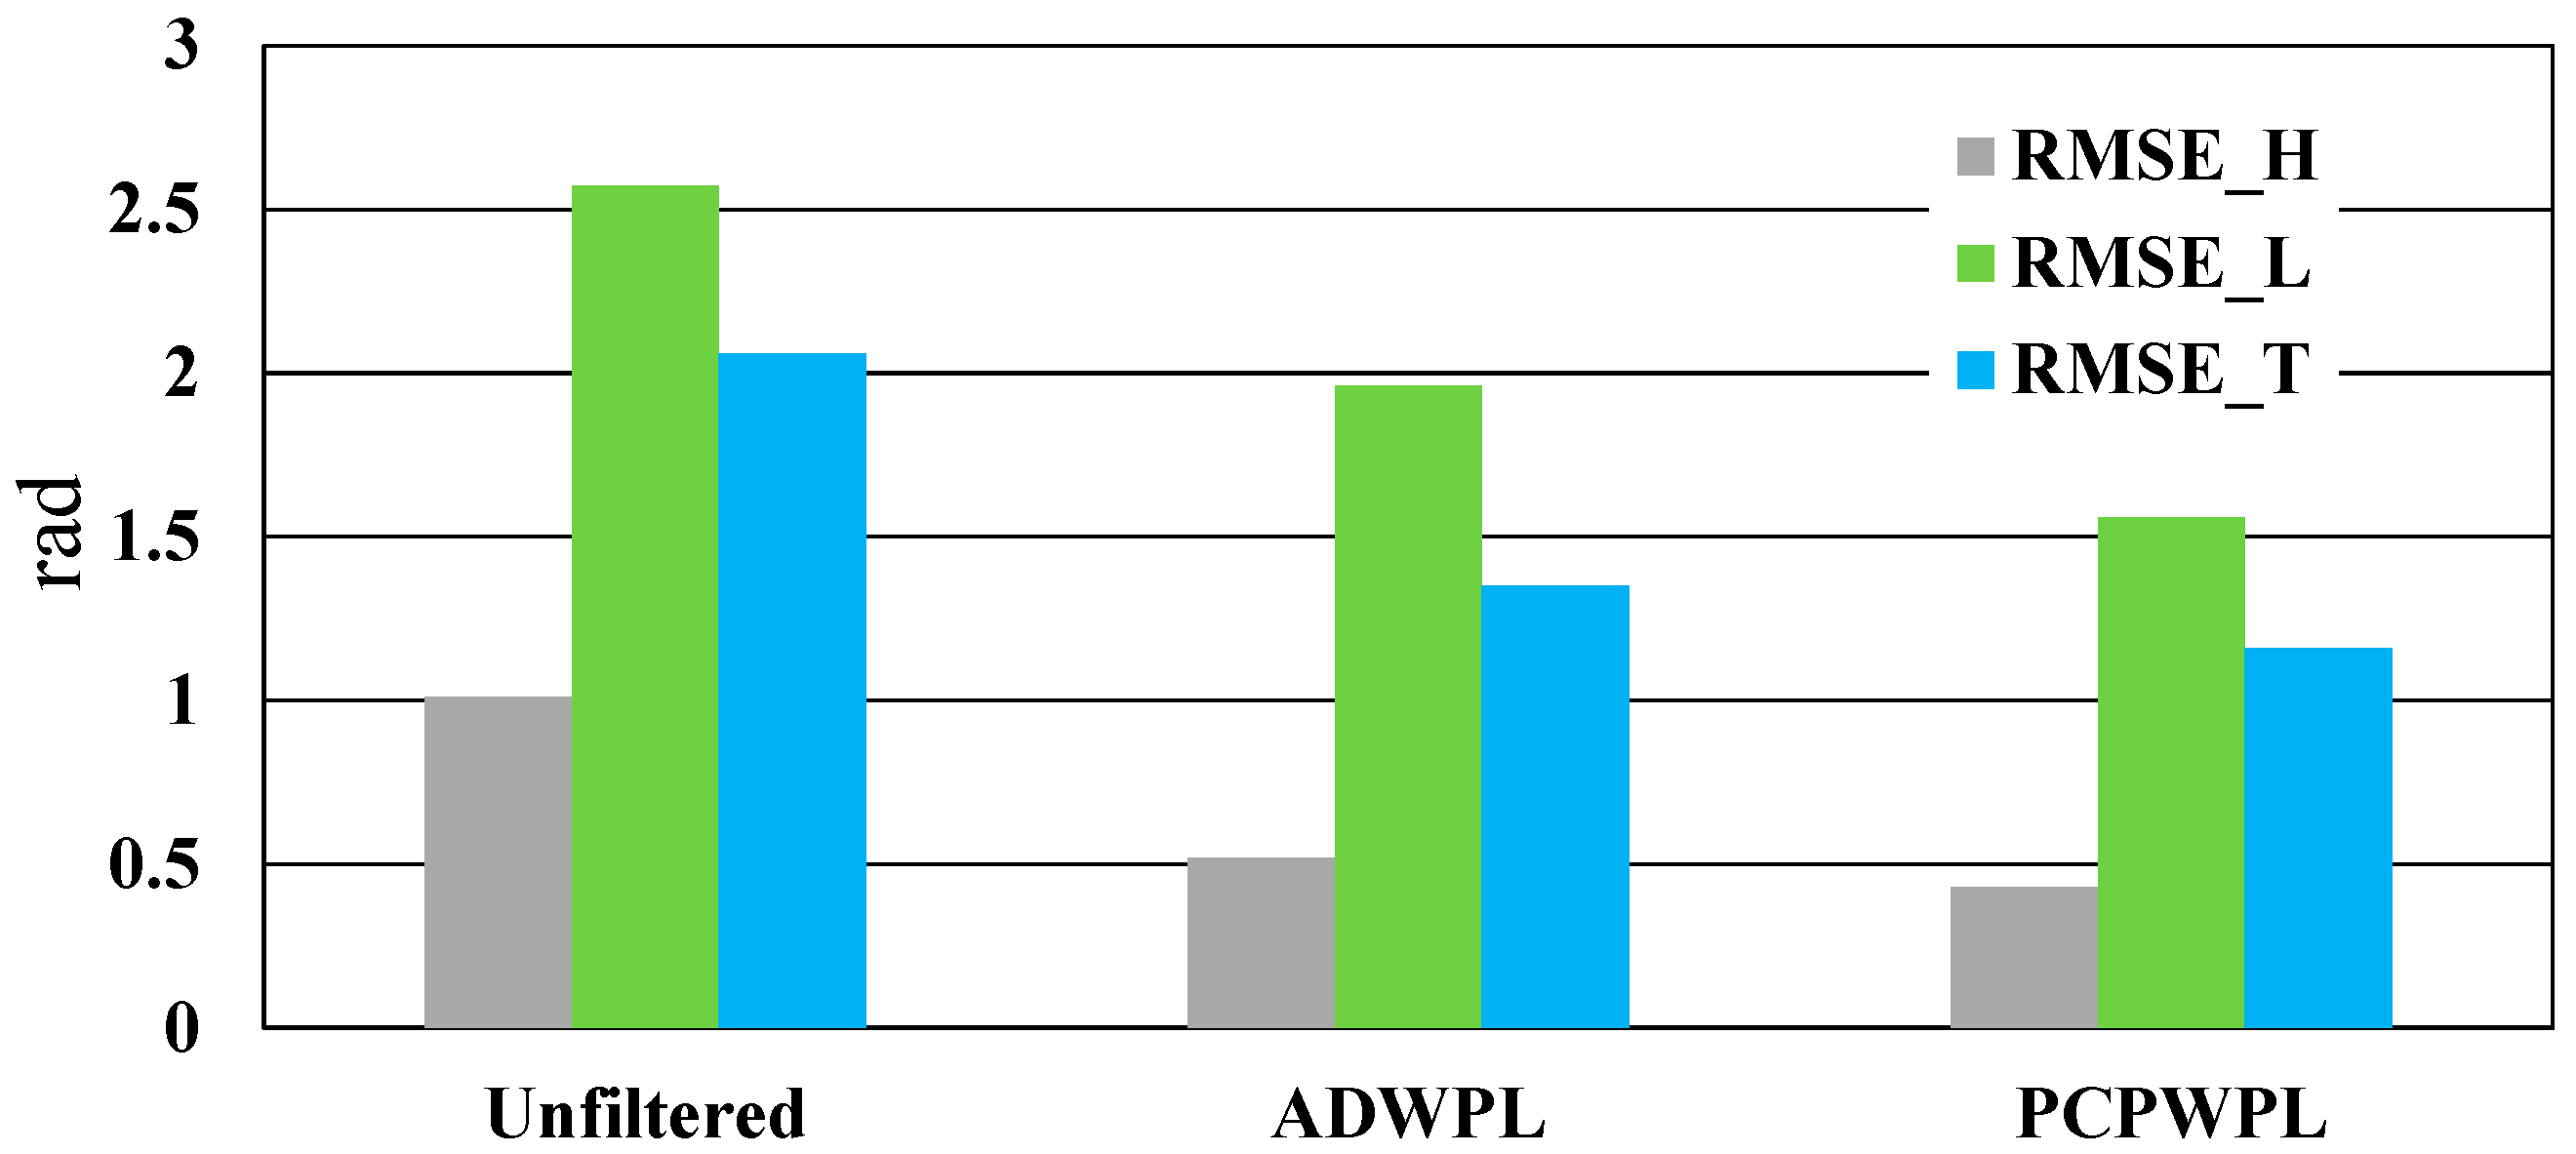
Other than the computation loads, phase qualities were evaluated by comparing denoised interferograms from ADWPL and PCPWPL. We adopt the simulated dataset of N = 40 for the comparative experiment. The mean amplitude map of the simulated SLC images (under a logarithmic stretching) is given in Figure 6. Results are presented with respect to a relatively good coherence pair and a low coherence pair (Figure 7). Both of the methods show good performance in despeckling the noisy interferograms. The yellow boxed area is enlarged for better interpretability of phase details. We notice the phase patterns of tree branches tend to be more accurate from the PCPWPL than that from the ADWPL. This difference is apparent in the low-coherence pair where less noise (blue spots) is seen in the PCPWPL filtered interferogram. Since the two strategies share the same phase reconstruction scheme, the grouping method of homogeneous pixels could be the only reason that brings the different phase patterns. According to Figure 6, the amplitude of the tree branches is not distinctive, if not blurred, to its surroundings, which are also seen at the characters of “5”, “S”, and “E”. When the amplitude is used, the AD test is likely to include SHPs with similar amplitude behavior but disparate phase histories. However, this blurred amplitude could put limited influence on the grouping of PCPs depending on phase correlation. To quantitively reveal this difference, we examined their phase residuals with respect to the true phase value (the noise free interferograms). In Figure 8, root mean square errors (RMSE) with respect to the true phase were calculated regarding the unfiltered, ADWPL filtered, and PCPWPL filtered interferograms. ‘RMSE_H’ and ‘RMSE_L’ in Figure 8 refer to the high and low coherence pairs displayed in Figure 7, whereas the total dataset (40 interferograms) is given by ‘RMSE_T’. The two filters brought considerable improvements in RMSEs of phase values compared to the unfiltered one. For the entire dataset, phase RMSEs from the PCPWPL and ADWPL were decreased by 0.9 and 0.7 rad, respectively. For the high coherence pair, the improvements were literally close between the two methods, 0.6 and 0.5 rad decreased in RMSEs from the PCPWPL and ADWPL results. Advantage of the PCPWPL was reflected in the low coherence pair, where the phase RMSE decreased by 1.0 rad, 0.4 rad higher than that of the ADWPL (0.6 rad decreased). The improvement in phase observation will be the foundation for a satisfactory DS extension in the subsequent steps.

4. Real Data Experiment

4.1. Study Area and Data

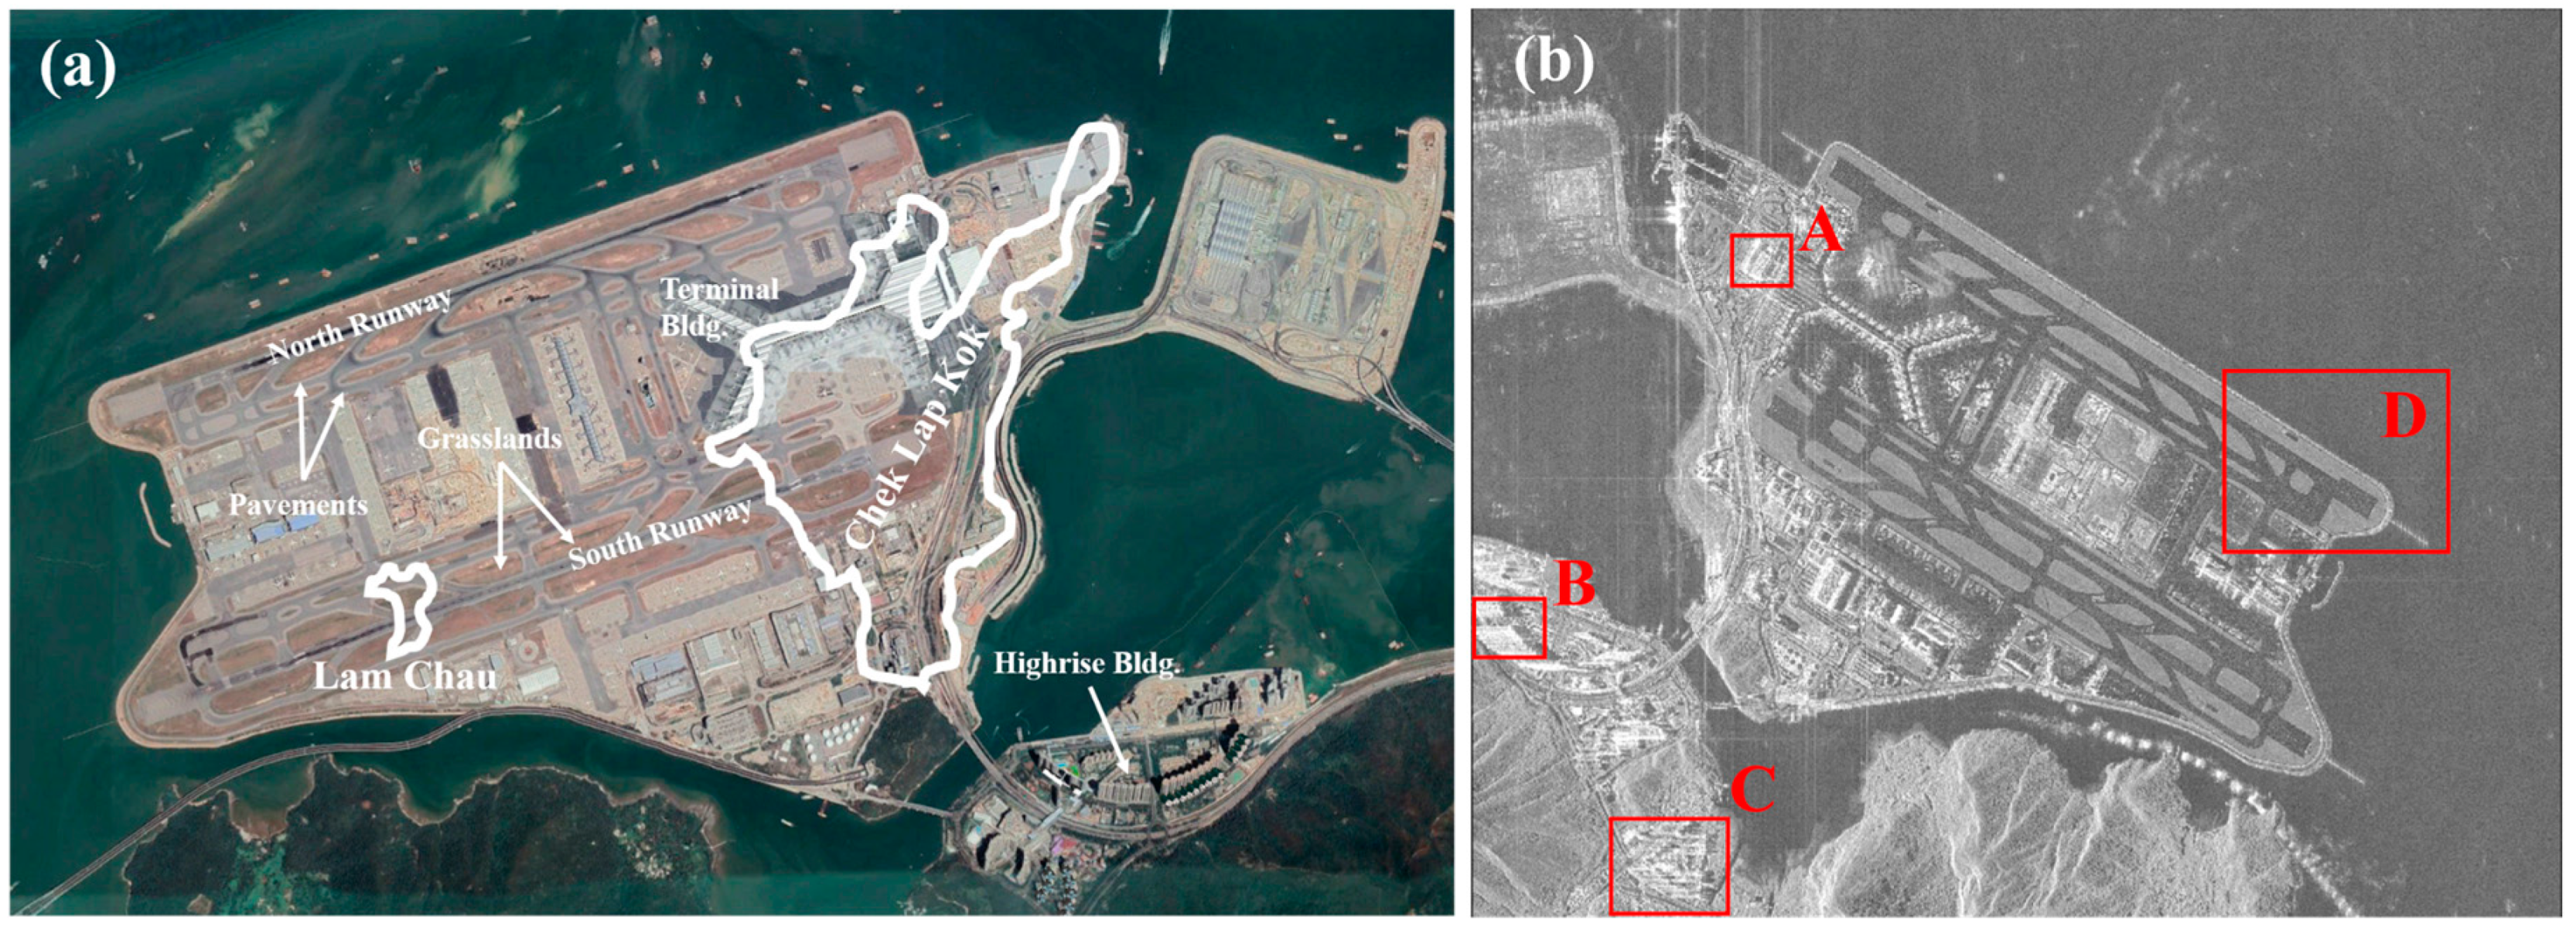
We apply the PCPWPL and ADWPL to real SAR images to jointly detect PS and DS measurements. Specifically, the two methods were used for the monitoring of uneven subsidence on a constructed reclamation of the Hong Kong International Airport (HKIA). HKIA is an artificial island, one of the largest reclaimed areas in the world. 75% of the airport (approximately 12.40 km2) was reclaimed from the sea. Consequently, the ground and accessary facilities are subject to settlement caused by unconsolidated subsurface soil layers and the penetration of seawater [20,50]. The airport was built based on two original rocky islands of Chek Lap Kok and Lam Chau (see white polygon in Figure 9a), which are dominated by granite bedrock. Attributed to their geological conditions, the bedrock regions are stable whereas other parts of the airport are subject to uneven subsidence [51,52].
28 X-band descending CosmoSkyMed stripmap images were used for the experiment, see details of baseline information in Table 1. Interferograms were generated at full pixel resolution with the acquisition of 06/12/2014 being the master image. Figure 9b gives the mean amplitude information of the SLC data stack (under a logarithmic stretching). A window size of 11 × 11 was adopted for the pixel clustering. We set a relatively loose thresholds T e = 0.15 and T r = 1.5 in the PCP selection. Results of the estimated |Φ| and C o r in the HKIA are given by Figure S2 in the Supplementary Material. The AD test was carried out under a significance level of 5%. A tolerance of 10−3 between iterations was used for the termination of phase reconstruction step. To break the possible large searching loops, a maximum iteration of 100 was set for the WPL. As the airport is a textured surface (e.g., pavements, grass lands, buildings), a rotation filtering window is able to find reflectivity homogeneous zones by recognizing similar amplitude patches [20]. For comparison purpose, the PCPWPL without T e and T r thresholds, i.e., using the amplitude-based rotation window only, was also performed. This threshold free method is tagged as PCPWPL’ hereafter in the following text.

4.2. Experimental Results

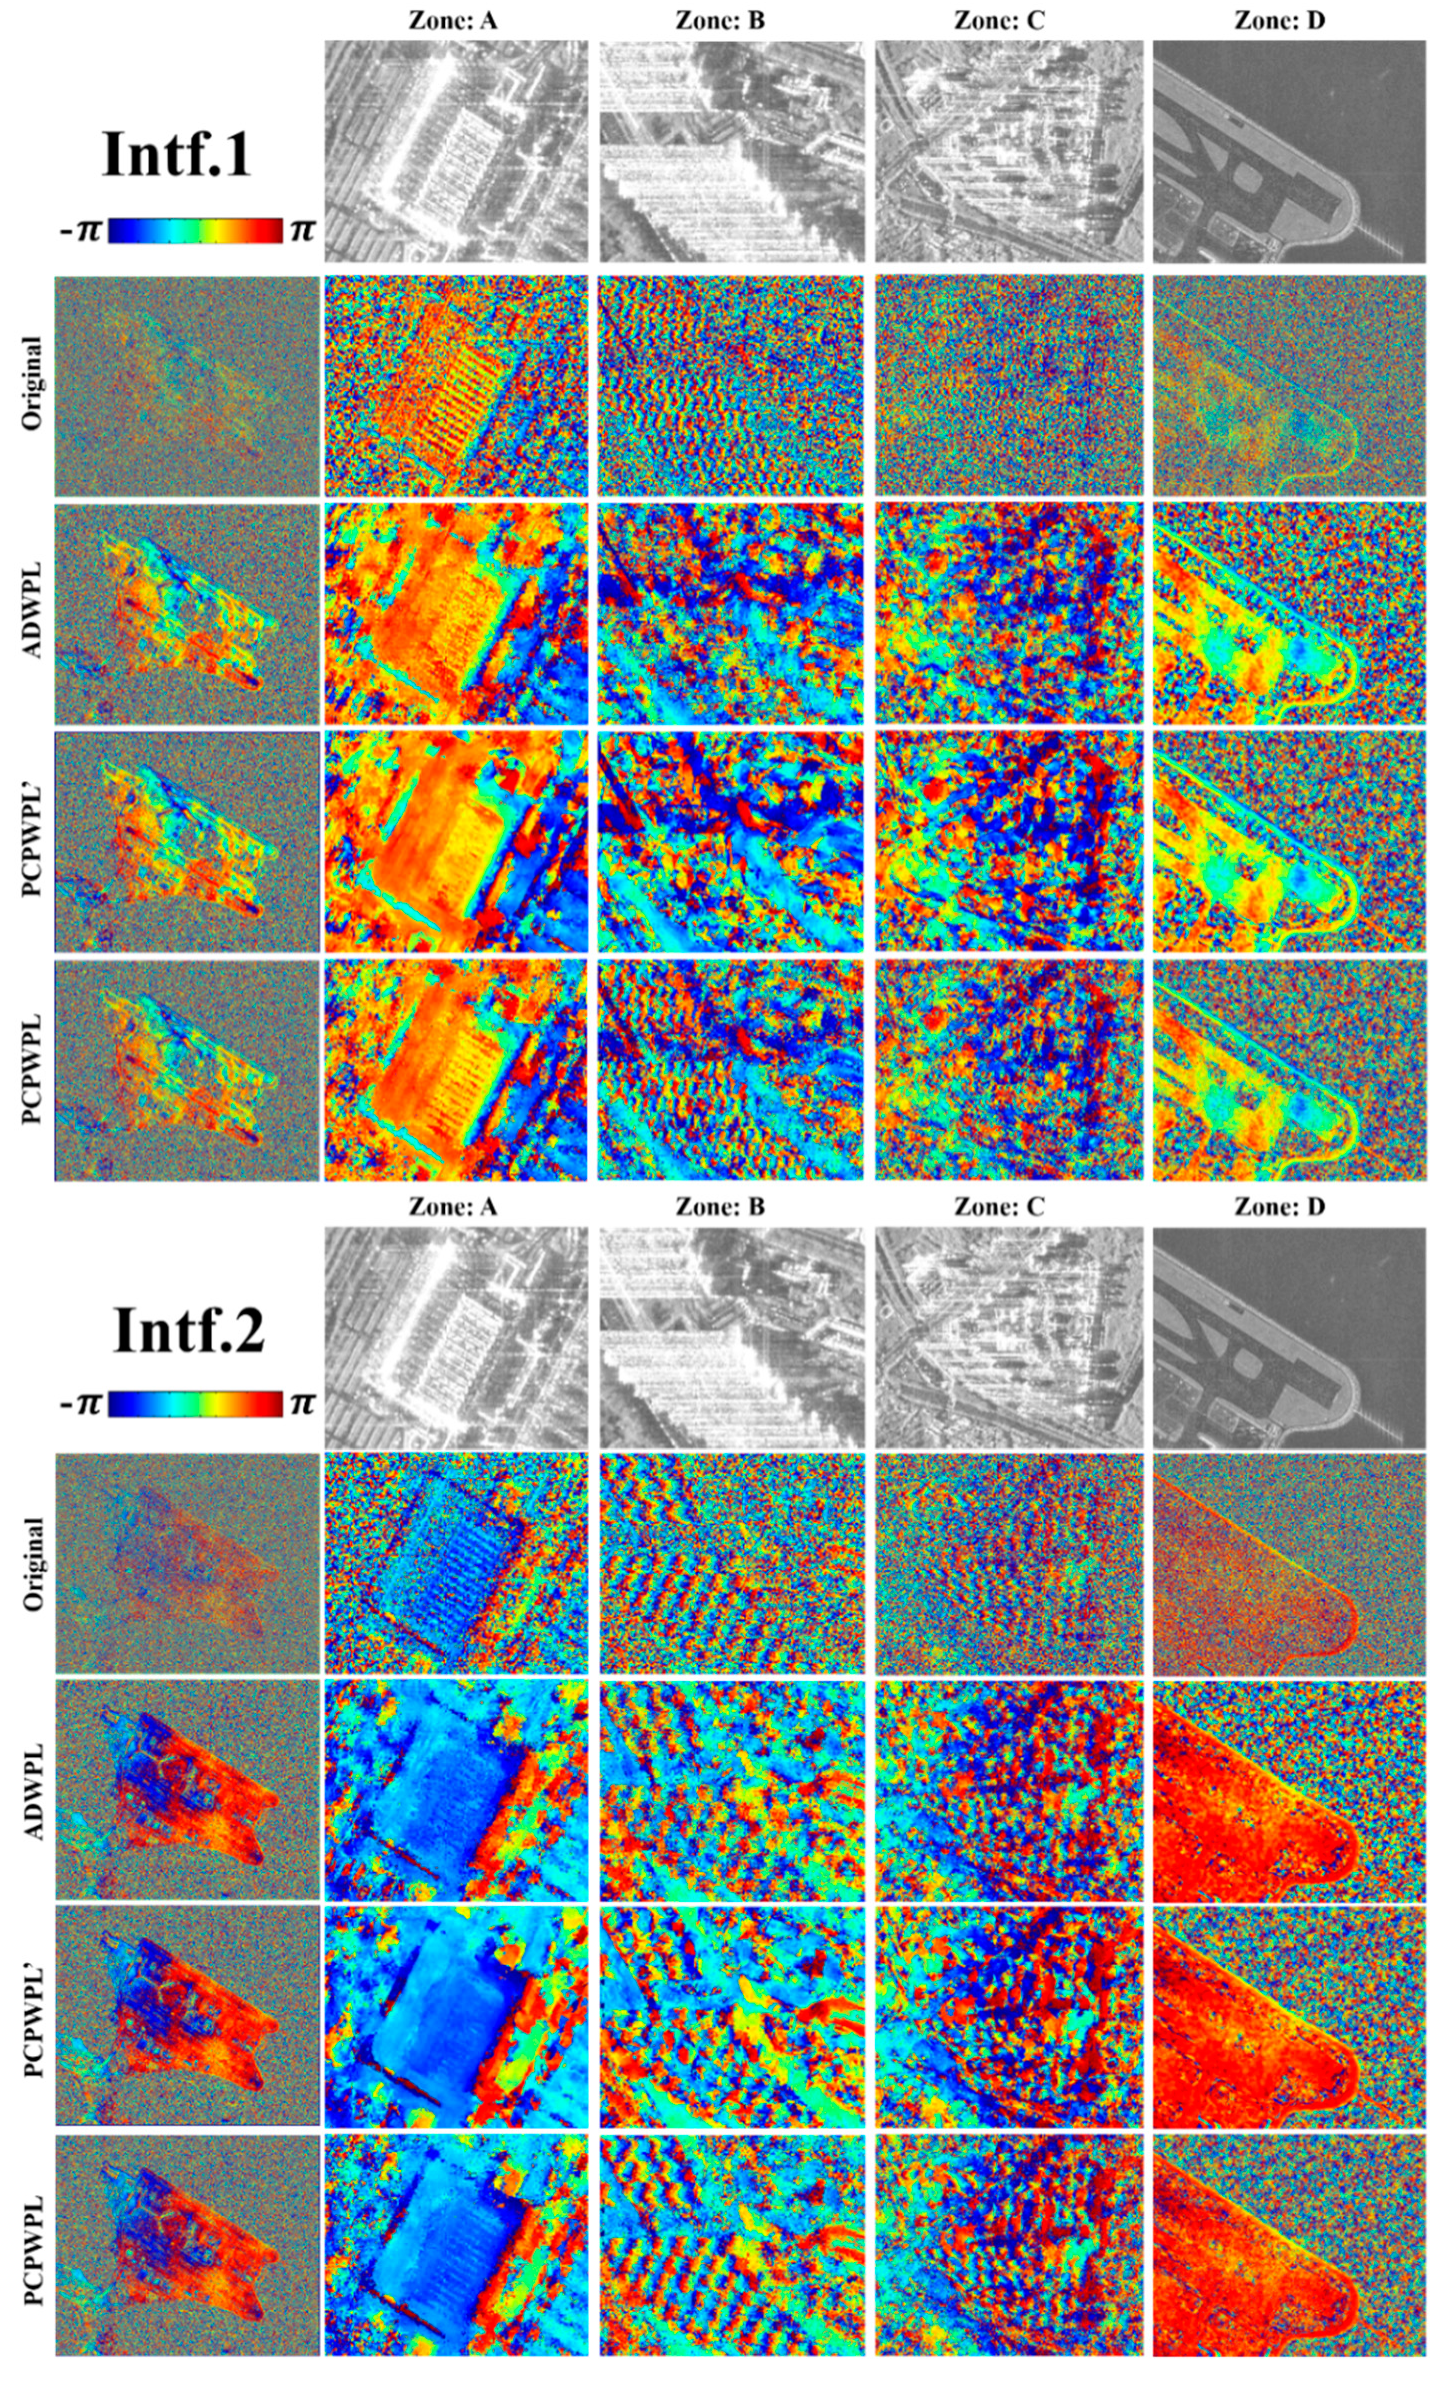
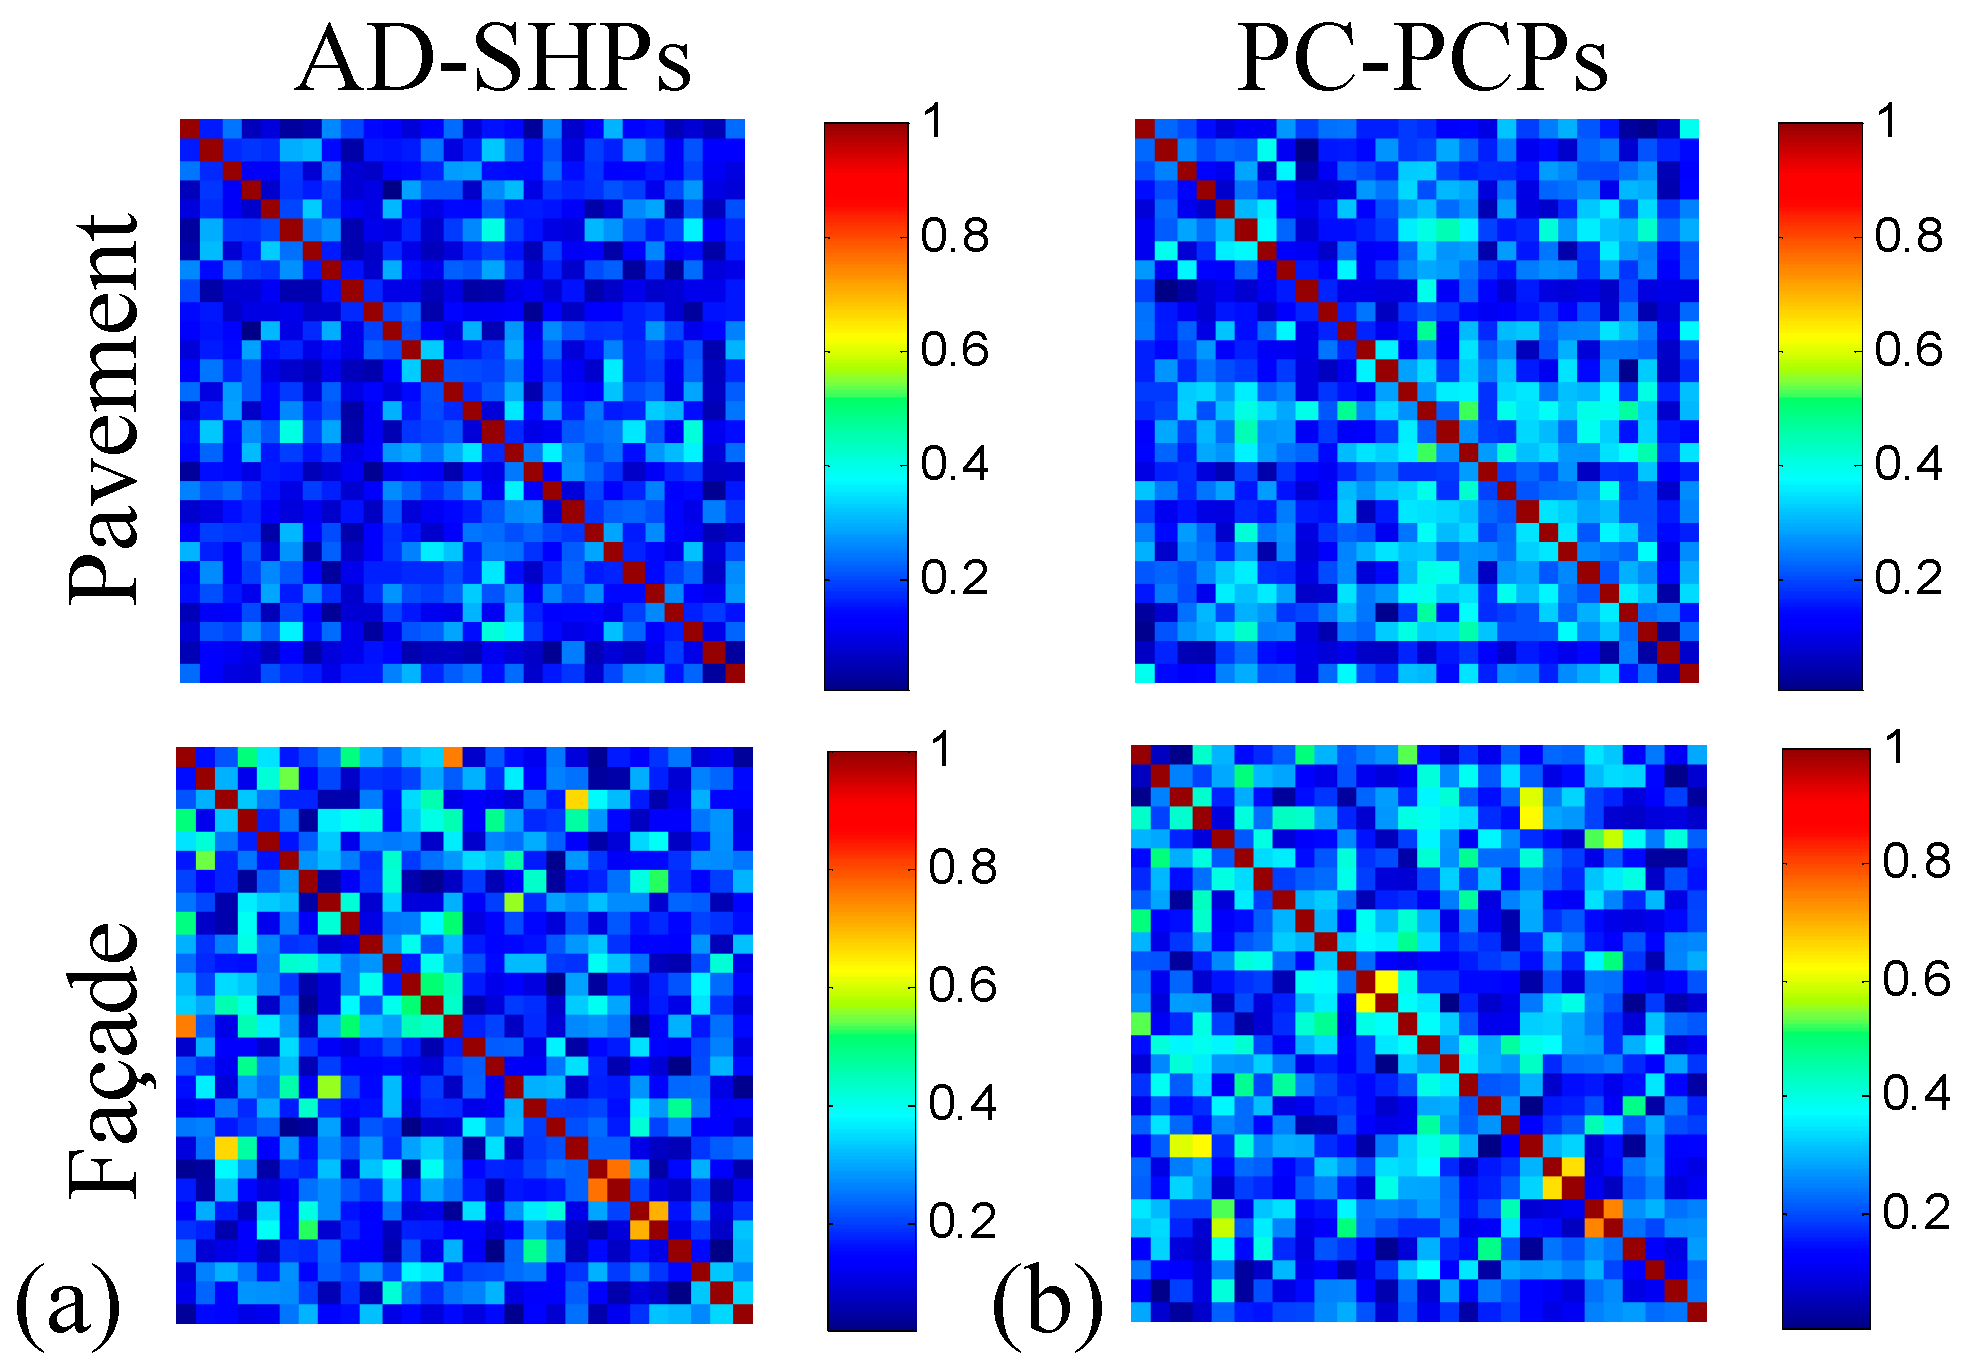
Figure 10 presents two of the filtered interferograms from ADWPL, PCPWPL’, and PCPWPL. Since the PCPWPL’ strategy did not apply any threshold in selecting PCPs, the clustering is solely based on averaging (in the spatial domain) the pixels in the rotation window determined by the mean amplitude [20]. Consequently, interferograms from PCPWPL’ are similar to that of ADWPL. Compared to PCPWPL, the smoother phase pattern from ADWPL and PCPWPL’ means that more pixels are included during the clustering process. For example, in areas with distinguishable amplitude patterns to their surroundings (e.g., zone D), the ADWPL and PCPWPL’ identified more pixels that are theoretically to be homogeneous within the same pavement. However, the PCPWPL strategy did not accept that many pixels as PCPs due to the adoption of T e and T r . The higher phase noise on some individual pixels can exceed the PCP selection criterial, causing slightly rougher phase patterns in zone D. The clustered SHPs and PCPs for a DS pixel in the pavement are displayed in Figure 11. However, in zones A-C, phase details were not well preserved by neither ADWPL nor PCPWPL’. In fact, the majority of façade and roof pixels will be detected as high-quality PSs, although DS-like pixels still exist on locations with relatively lower SNRs [16,17]. Compared to the low reflectivity pavement, the building areas have higher phase SNR in general, which is beneficial for the PCP clustering according to the Monte Carlo test. Therefore, the PCPWPL recovered more precisely the topographic related phase patterns in A-C than the other two. However, the use of amplitude is likely to group biased SHP family that either captures pixels of similar amplitude but incoherent phase or rejects pixels with coherent phase but disparate amplitude. We give an example of detected SHP and PCP neighbors on a façade DS pixel in Figure 11. For those phase correlated pixels detected by PCPs, few of them were selected by the SHPs (Figure 11c). The inaccurate SHP clustering caused more contamination in phase patterns in the ADWPL filtered interferograms (Figure 10). This is to the disadvantage to the following detection of DS-like pixels that are missed by the previous PS solution. The merits of more accurate clustering of phase similar pixels is demonstrated by the corresponding coherence matrixes in Figure 12. Since the DS detection will be relying on filtered interferograms, the diverse outcomes of ADWPL and PCPWPL in these specific zones will accordingly affect their subsequent performance in DS extension.
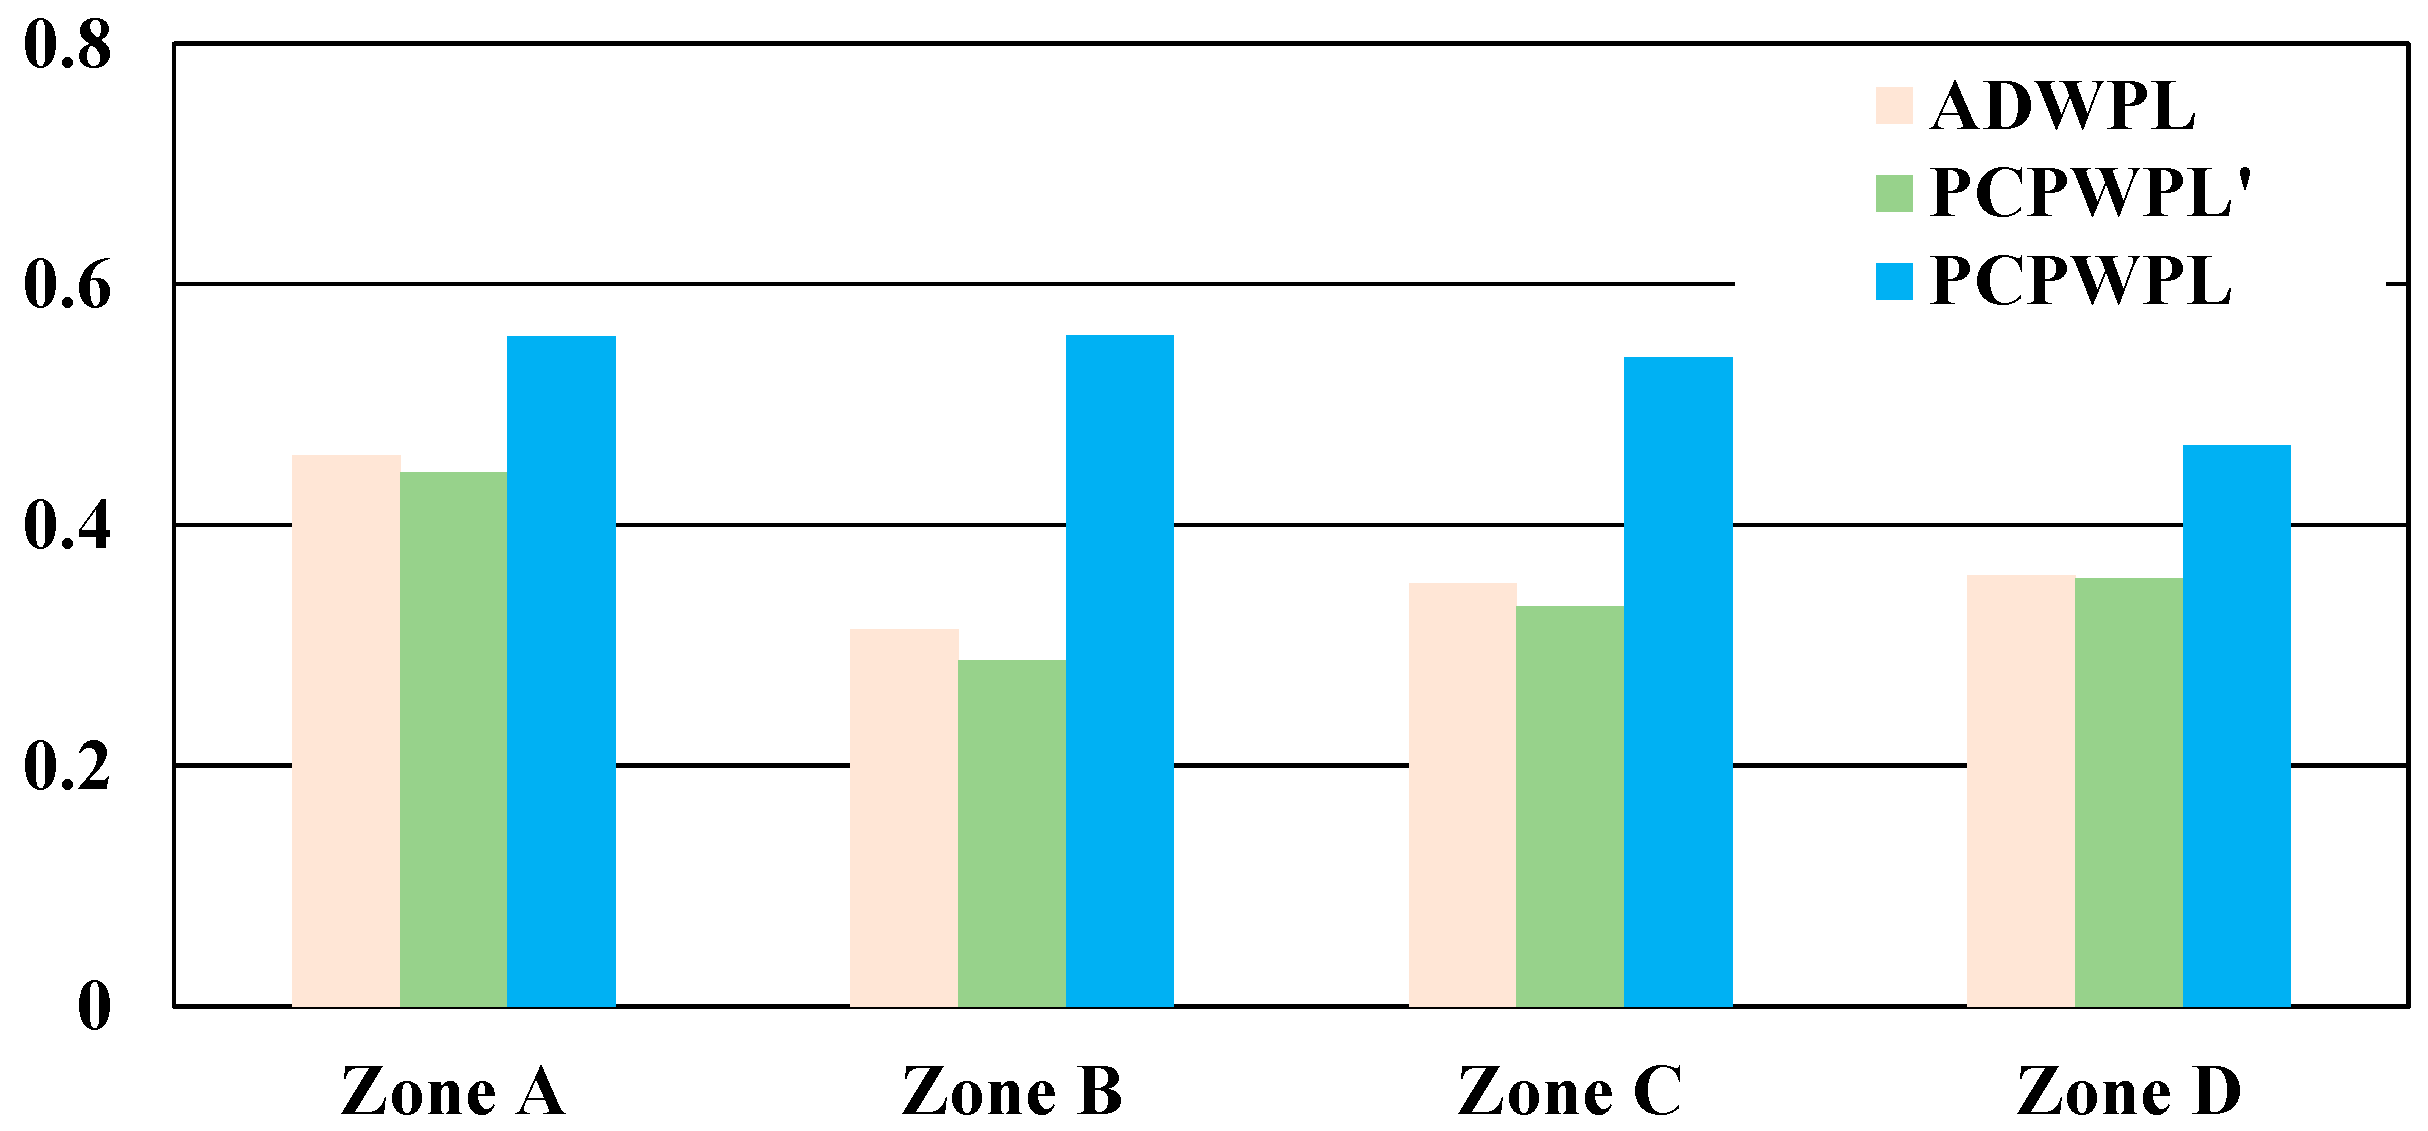
The ‘true’ phase of real datasets is unknown, Equation (15) was used to evaluate the quality of the refined interferograms [15], where ϕ m , n and θ m , n are the original and estimated interferometric phases of pair n and m , respectively. The mean Υ P T A values of the refined interferograms for zones A-D are given in Figure 13. Note that the calculation of mean Υ P T A is based on the common points from the results of ADWPL and PCPWPL in Figure 15 under DS temporal coherence γ ^ = 0.7 . A higher value of Υ P T A indicates that the phase solution should be more accurate [15]. From this aspect, the reconstructed phase from PCPWPL creates the best Υ P T A values, whereas the threshold free PCPWPL’ creates the lowest.
Υ P T A = 1 N 2 N m = 1 N n m N e j ( ϕ m , n θ m , n )
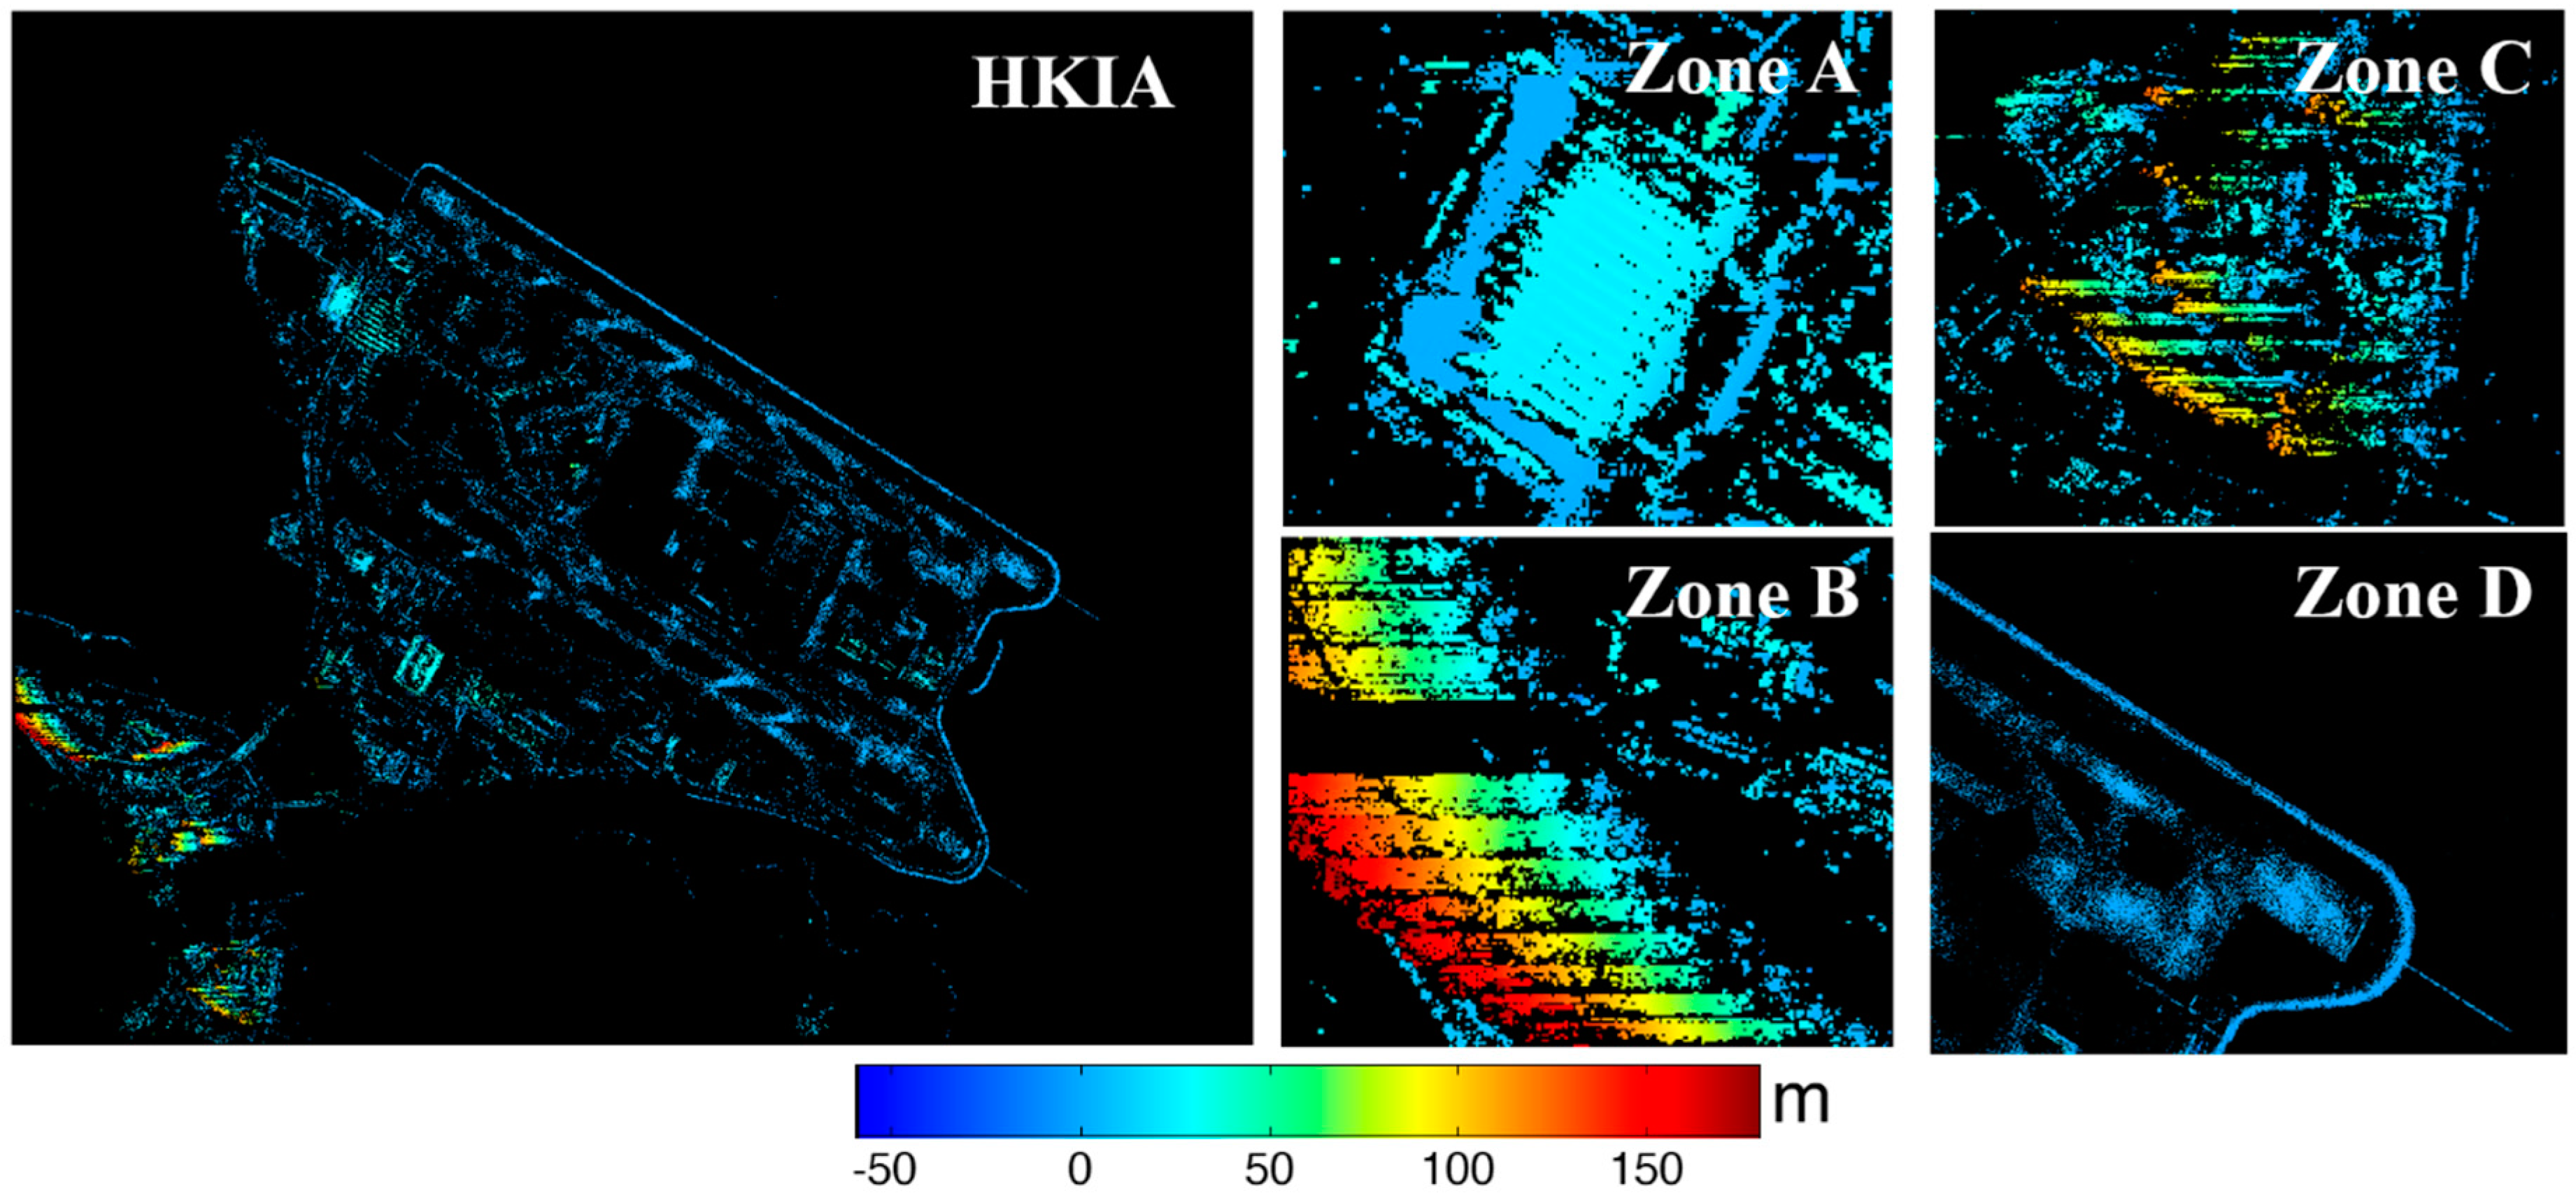
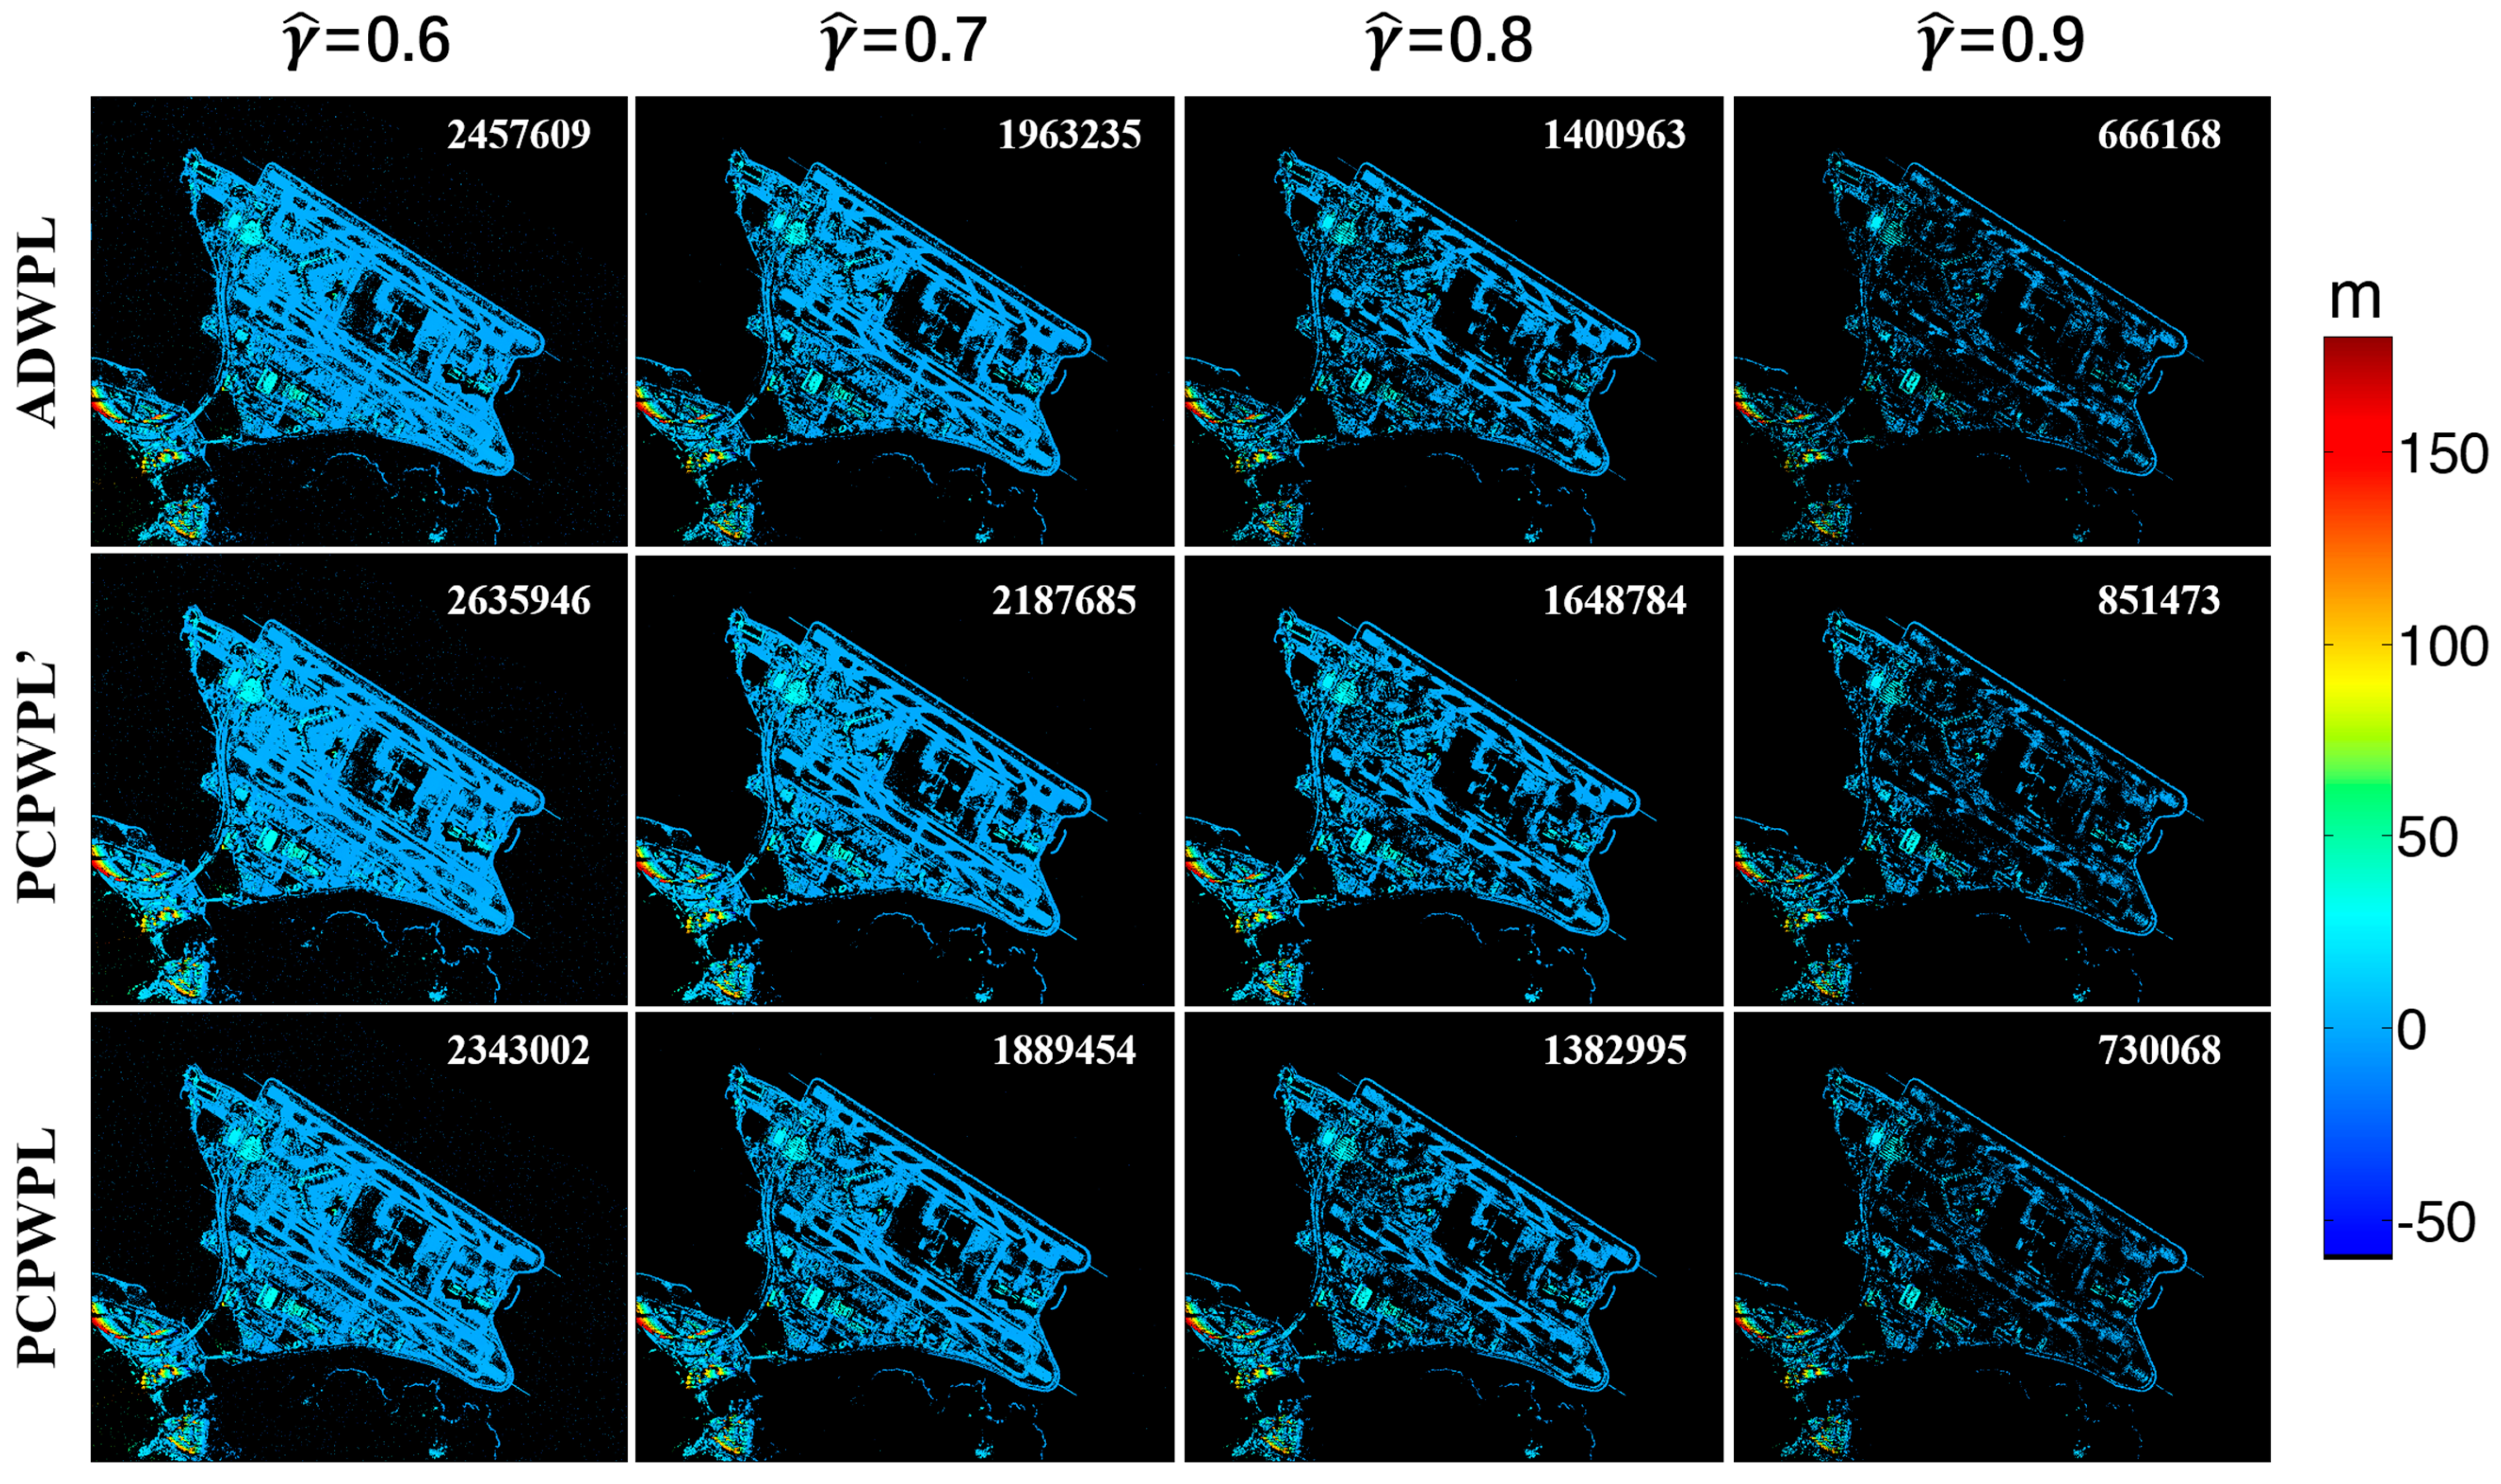
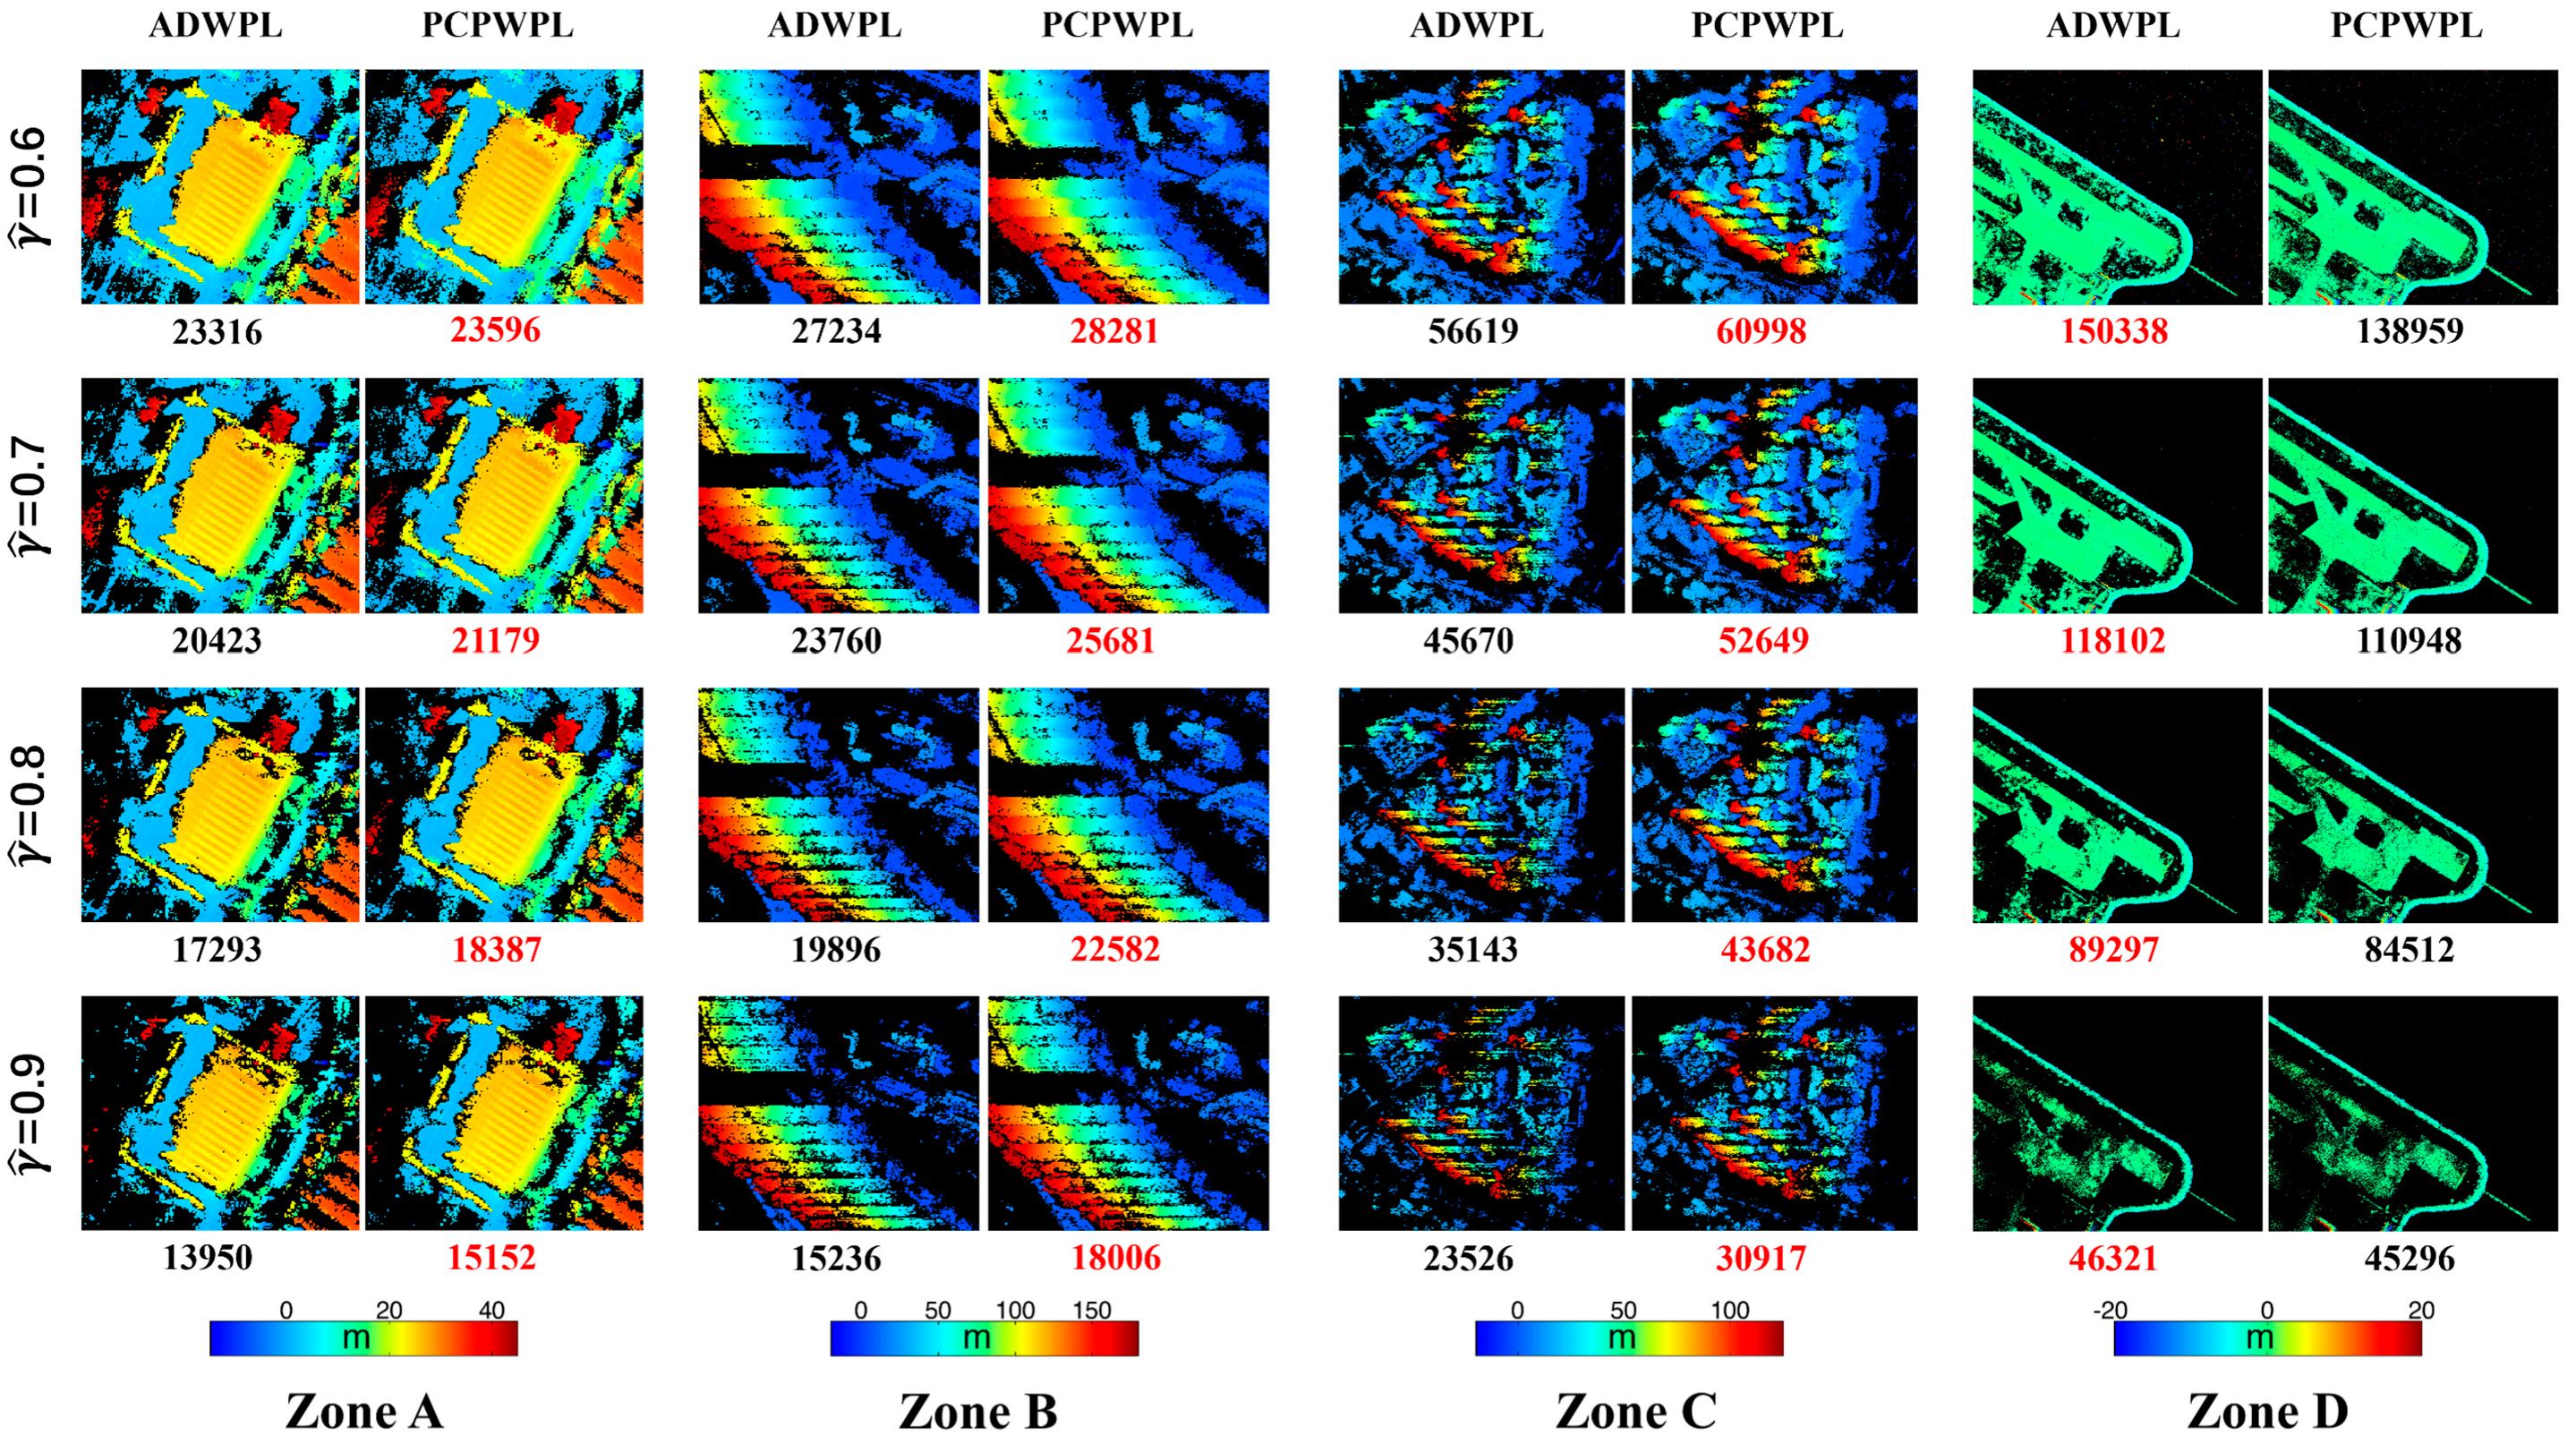
To compare the performances in DS extension, PS reference network was detected using the original unfiltered interferograms. Therefore, the influences from different filtering methods on their subsequent DS detection can be exclusively revealed as the extension was based on the same PS network. We retained PS arc solutions with γ ^ higher than 0.75. Figure 14 shows the PS results displayed in their height values. Denoised interferograms from the three strategies are then used for DS extension. We define all these pixels failed in the PS network detection as the potential DS candidates. Distance threshold for searching of PS reference point is set to be 1 km in this case. When solving DS arcs, different thresholds on γ ^ were set. Figure 15 presents the estimated height map of the DS extension results from ADWPL, PCPWPL’, and PCPWPL, respectively. The number of qualified measurements is annotated in each subplot, where the PCPWPL’ obtains the largest number of measurements under each γ ^ . No PCP criteria is applied, therefore the PCPWPL’ is essentially a mean filter for the interferograms in the spatial domain. The qualification of extra measurements by PCPWPL’ is due to the overall improvement of coherence on the smoothed phase patches, regardless of the phase accuracy. In the following, more interest was assigned to the comparison between ADWPL and PCPWPL. As for the entire imaged region, the ADWPL detects more measurements than the PCPWPL, whereas the gap between them decreased with the increase of γ ^ and the PCPWPL overtakes ADWPL at γ ^ = 0.9 . This shift of the DS quantities suggests that, interferograms from PCPWPL produced DS measurements with higher quality as less DSs were excluded than the ADWPL did when the γ ^ increases. Figure 16 gives the zoom in look of the four specific zones of A-D. As we mentioned in Figure 10, the diverse phase results from the two different strategies have accordingly affected their performance in the DS extension. In the building zones of A-C, the PCPWPL acquires more DS points than the ADWPL for each γ ^ cases. The higher the value of γ ^ , the larger (in general) the gap of DS quantities between the two strategies. This result has demonstrated the deficiency of amplitude-based clustering for such areas with higher phase heterogeneity. However, in zone D, the ADWPL detected more DS points than PCPWPL on the pavement. In addition, zone D shows that ADWPL has made more DS measurements on the grass land between pavements. Due to the low SNR of phase, PCPWPL has its drawbacks in grouping PCPs on natural surfaces. Then again, the gap of DS quantities in zone D between the two methods gets smaller with the increase of γ ^ , suggesting the extra DSs from ADWPL are with relatively lower qualities.

4.3. Deformation Estimates and Cross-Validation

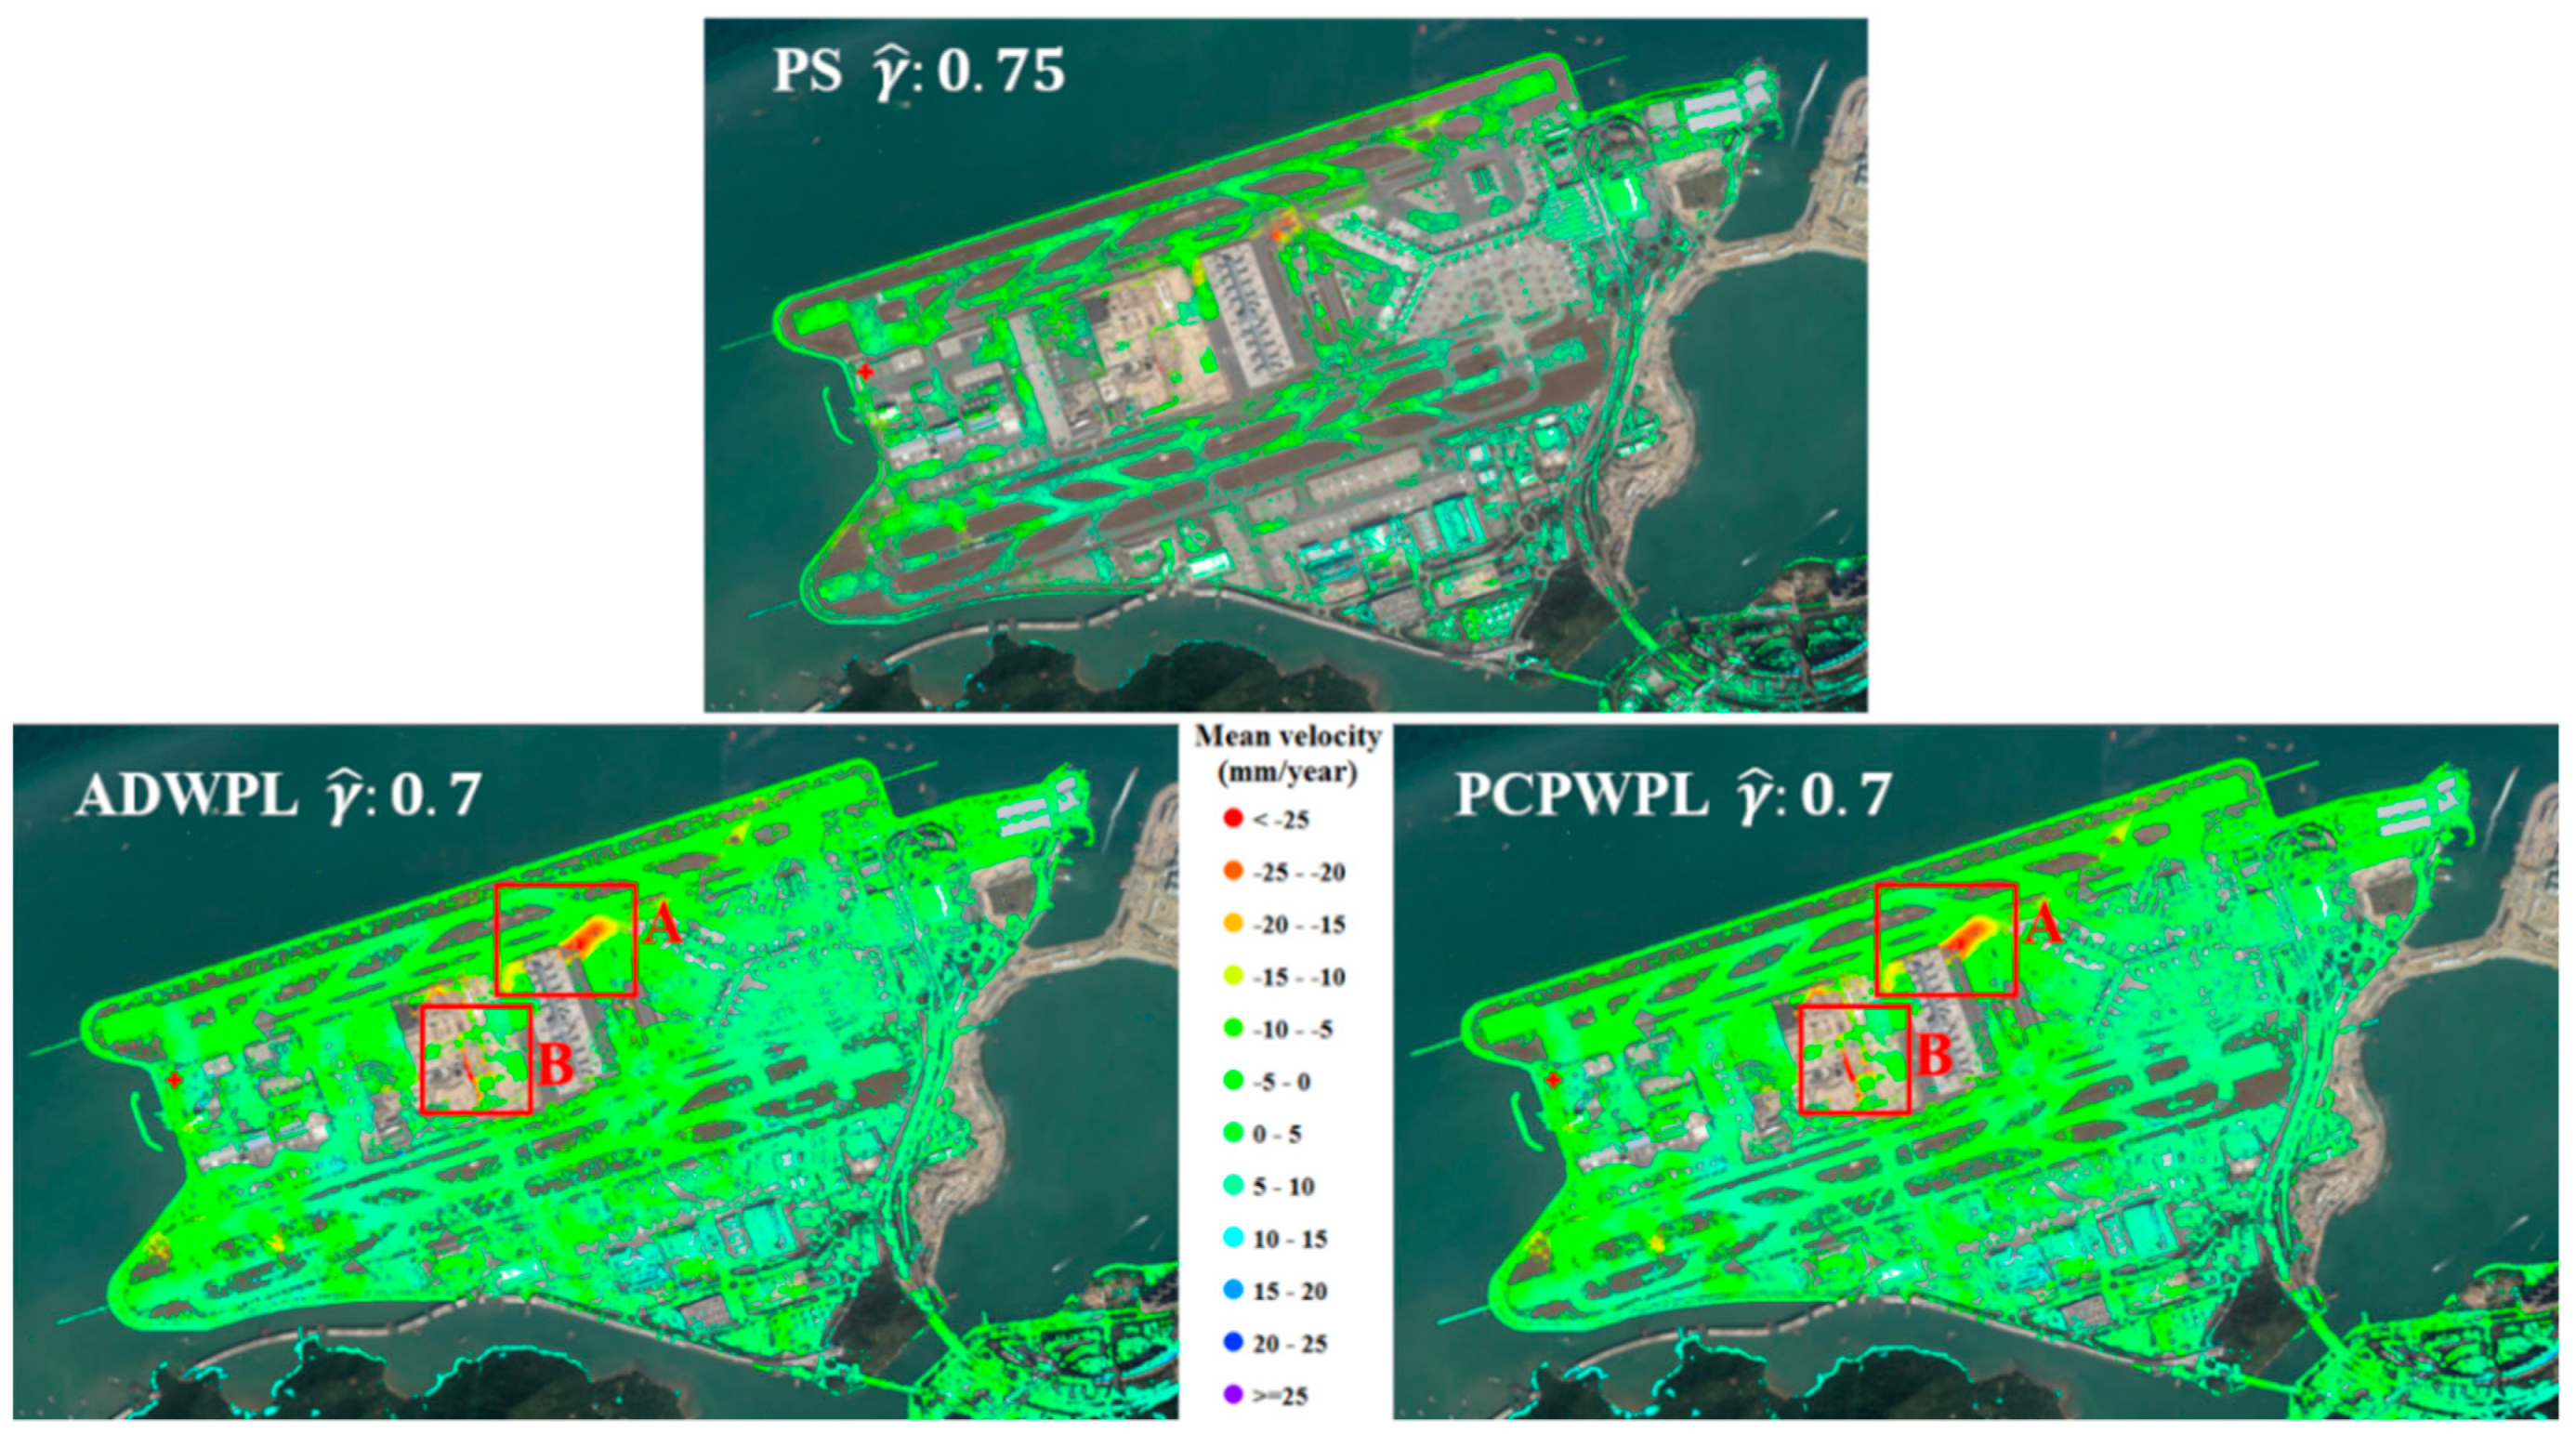
In this section, we compare the deformation estimations from the two methods using a cross-validation. Figure 17 shows the geocoded deformation map of the airport displayed in Google Earth. It is evident that DS pixels still make a significant proportion of the total InSAR measurements, especially in the pavement areas. Results from the two strategies show good consistence with each other in both of the deformation and height estimates. The cross validation is presented in Figure 18a using the common points from both ADWPL and PCPWPL results. The scatter density in Figure 18a indicates that the majority of points from the two methods shares very narrow differences in their estimated values. Histograms of difference values in deformation and height between ADWPL and PCPWPL are given in Figure 18b. The means and standard deviations are 0, 0.47 and −0.01, 1.28 for the deformation and height differences, respectively. The statistics of cross-validation have demonstrated the reliability of the proposed method. For the measured deformation particularly, the most serious subsidence occurs in the north taxiway, which is close to the Y-shaped concourse (zone A in Figure 17), as well as the construction area in the middle (zone B). The two zones were with settlement rates exceeding 20 m m · y 1 . In addition to these two, other places such as the east part of the north runway, the southwest corner, the intersection between south runway and taxiway in the east, etc. were also undergoing subsidence of ~−10 to −20 m m · y 1 .
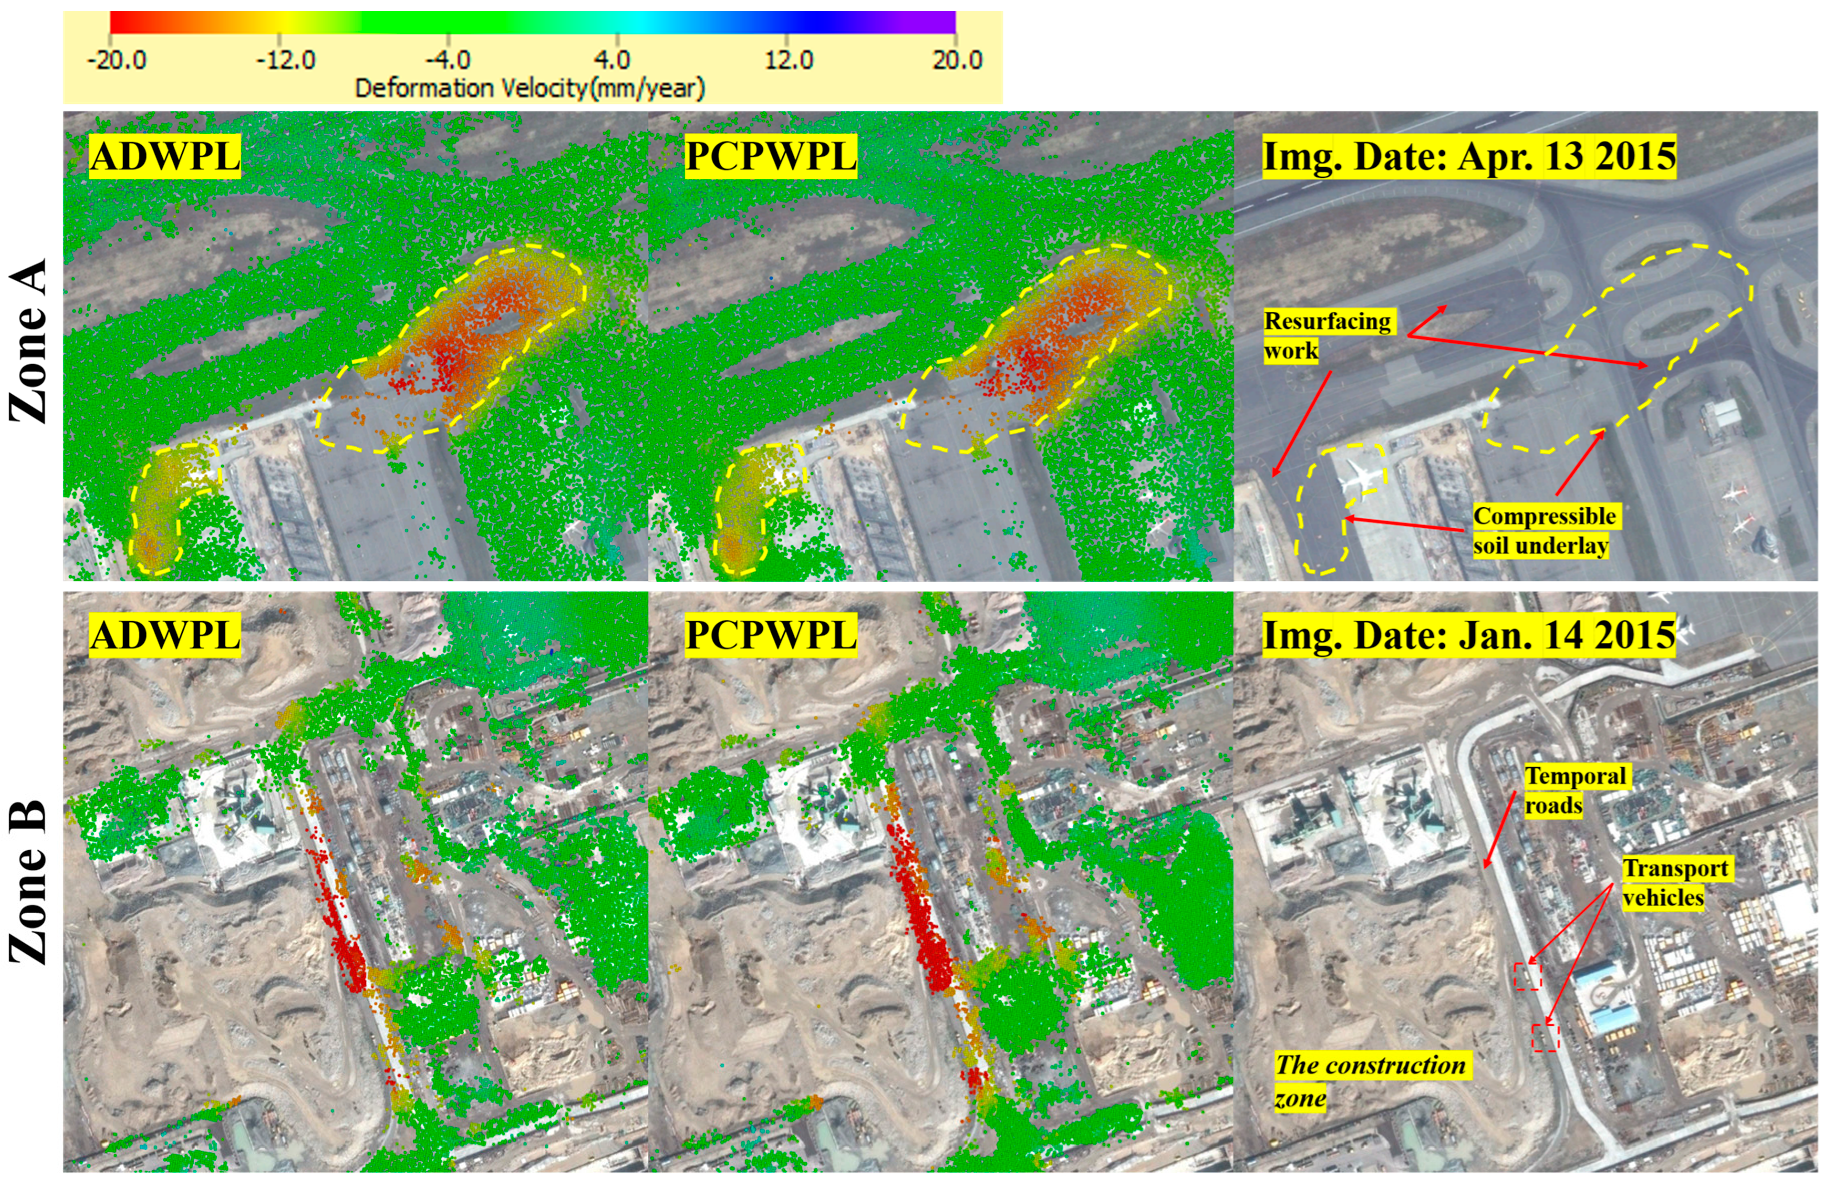
In Figure 19, subsiding zones of A and B are plotted in detail on the Google Earth maps. According to previous studies [50,51], zone A has been continuously subsiding for a long period. This region is likely to be influenced by the unconsolidated and soft soil underlay. For some of the reclamation projects, the long-time consolidation process can even last for decades [53,54,55,56]. We detected a maximum subsidence rate of approximately 23 m m · y 1 in zone A with respect to the reference point. To maintain the stability condition of pavements, resurfacing work was carried out regularly in these areas (Figure 19). Although close to zone A, the Y-shaped terminal building was relatively stable. The terminal building was actually constructed on piled foundations that reach the granite bedrock of Chek Lap Kok (Figure 9), the structure stability is much stronger than the reclaimed areas. In zone B, subsidence was found along the road in the construction area for new parking apron. The road was built as a temporal passage for the transportation of earthwork and building materials. Frequent movement of the loaded vehicles (Figure 19) contributed to the compaction of the soil, leading to distinctive and considerable subsidence along the road. When the construction work finished, the temporal road was covered by the built surfaces and facilities, no such evident subsidence pattern was detected over that area. In general, the main cause of uneven subsidence in HKIA is associated with the second stage of long-term consolidation process. The variability of filling substrate and the external effects such as constructions, airplane landing have together led to the uneven deformation pattern at HKIA. To convincingly demonstrate the applicability of the method, PCPWPL has also been applied to different bands and resolution datasets covering HKIA (Figures S3 and S4 in the Supplementary Material). Regarding details of the airport subsidence, readers are referred to Jiang and Lin [51], Chen and Lin [52], Zhao et al. [57], Shi et al. [20], Sun et al. [50], etc.

5. Conclusions

In this paper, we discussed the potential of using phase information in the application of DSInSAR monitoring for built scenarios. The homogeneous clustering was completed based on the correlation of complex-valued phase observations. The weighted phase link algorithm was used to reconstruct the DS phase history from selected PCPs. The efficiency of the PCPWPL method was fairly demonstrated through both simulated and real data experiments. Pros and cons of the phase-based method were highlighted via the comparative experiments with the ADWPL method, using X-band CosmoSkyMed images covering the HKIA. Table 2 summarized the performance based on the results from the two different strategies. The homogeneous filtering of PCPWPL requires much less computational cost than the conventional amplitude based ADWPL (~5% of ADWPL for the HKIA case), whereas it can provide comparable amount of qualified measurements. The simulation and real experiments have suggested that the use of PCPs brings higher phase accuracy of the filtered interferograms and preserves more structure details. Larger number of DSs is detected by PCPWPL in the building regions highlighted in the HKIA case. However, the amplitude-based method performs better in areas with distinguishable amplitude properties, e.g., the pavements and grasslands. In such regions, phase correlation is likely to lose its function because of the lower SNR. This drawback of PCPWPL has accordingly limited its effective use in the low-coherence natural land covers. Despite the slight sacrifice in measurement quantity, the accurate phase estimates and more importantly the cheaper time cost make PCPWPL a promising method for DS applications in built scenarios.

Supplementary Materials

The following are available online at https://www.mdpi.com/2072-4292/12/4/686/s1, Figure S1: Comparison of execution time regarding pixel clustering and phase reconstruction; Figure S2: Mean values of | ϕ | and C o r for the HKIA case; Figures S3 and S4: PCPWPL applied to different bands and resolution SAR datasets.

Author Contributions

G.S. designed the methodology and performed the experiments. G.S., P.M., and B.H. wrote the article. H.L. and B.H. supervised the research and provided funding support. B.Z., Y.L., and G.S. contributed to results analysis and interpretation. All the authors contributed to paper revision and English editing. All authors have read and agreed to the published version of the manuscript.

Funding

This research is financially supported by the National Natural Science Foundation of China (41671378, 41601356, 41971278), grant from the Research Grants Council of the Hong Kong Special Administrative Region, China (Project No. AoE/E-603/18), the Open Fund of Key Laboratory of Urban Land Resources Monitoring and Simulation, Ministry of Land and Resources(KF-2016-02-025), and the National Key Basic Research Program of China (2015CB954103).

Acknowledgments

The authors would like to thank the editor and anonymous reviewers for their helpful comments and suggestions.

Conflicts of Interest

The authors declare no conflicts of interest.

References

  1. Crosetto, M.; Monserrat, O.; Cuevas-González, M.; Devanthéry, N.; Crippa, B. Persistent scatterer interferometry: A review. ISPRS J. Photogramm. Remote Sens. 2016, 115, 78–89. [Google Scholar] [CrossRef] [Green Version]
  2. Even, M.; Schulz, K. InSAR Deformation Analysis with Distributed Scatterers: A Review Complemented by New Advances. Remote Sens. 2018, 10, 744. [Google Scholar] [CrossRef] [Green Version]
  3. Yu, H.; Lee, H.; Yuan, T.; Cao, N. A novel method for deformation estimation based on multibaseline InSAR phase unwrapping. IEEE Trans. Geosci. Remote Sens. 2018, 56, 5231–5243. [Google Scholar] [CrossRef]
  4. Yu, H.; Lan, Y.; Yuan, Z.; Xu, J.; Lee, H. Phase unwrapping in InSAR: A review. IEEE Geosci. Remote Sens. Mag. 2019, 7, 40–58. [Google Scholar] [CrossRef]
  5. Berardino, P.; Fornaro, G.; Lanari, R.; Sansosti, E. A new algorithm for surface deformation monitoring based on small baseline differential SAR interferograms. IEEE Trans. Geosci. Remote Sens. 2002, 40, 2375–2383. [Google Scholar] [CrossRef] [Green Version]
  6. Ferretti, A.; Prati, C.; Rocca, F. Nonlinear subsidence rate estimation using permanent scatterers in differential SAR interferometry. IEEE Trans. Geosci. Remote Sens. 2000, 38, 2202–2212. [Google Scholar] [CrossRef] [Green Version]
  7. Ferretti, A.; Prati, C.; Rocca, F. Permanent scatterers in SAR interferometry. IEEE Trans. Geosci. Remote Sens. 2001, 39, 8–20. [Google Scholar] [CrossRef]
  8. Ma, P.; Lin, H.; Lan, H.; Chen, F. Multi-dimensional SAR tomography for monitoring the deformation of newly built concrete buildings. ISPRS J. Photogramm. Remote Sens. 2015, 106, 118–128. [Google Scholar] [CrossRef]
  9. Lin, H.; Ma, P. Urban infrastructural health diagnosis with satellite-terrestrial sensing technologies. Ann. GIS 2017, 23, 1–8. [Google Scholar] [CrossRef]
  10. Wang, Y.; Zhu, X.; Zeisl, B.; Pollefeys, M. Fusing meter-resolution 4-D InSAR point clouds and optical images for semantic urban infrastructure monitoring. IEEE Trans. Geosci. Remote Sens. 2017, 55, 14–26. [Google Scholar] [CrossRef] [Green Version]
  11. Zhu, X.; Ge, N.; Shahzad, M. Joint Sparsity in SAR Tomography for Urban Mapping. IEEE J. Sel. Top. Signal Process. 2015, 9, 1498–1509. [Google Scholar] [CrossRef] [Green Version]
  12. Kang, J.; Wang, Y.; Körner, M.; Zhu, X. Robust object-based multipass InSAR deformation reconstruction. IEEE Trans. Geosci. Remote Sens. 2017, 55, 4239–4251. [Google Scholar] [CrossRef]
  13. Kang, J.; Wang, Y.; Schmitt, M.; Zhu, X. Object-Based Multipass InSAR via Robust Low-Rank Tensor Decomposition. IEEE Trans. Geosci. Remote Sens. 2018, 56, 3062–3077. [Google Scholar] [CrossRef] [Green Version]
  14. Hooper, A. A multi-temporal InSAR method incorporating both persistent scatterer and small baseline approaches. Geophys. Res. Lett. 2008, 35, 96–106. [Google Scholar] [CrossRef] [Green Version]
  15. Ferretti, A.; Fumagalli, A.; Novali, F.; Prati, C.; Rocca, F.; Rucci, A. A new algorithm for processing interferometric data-stacks: SqueeSAR. IEEE Trans. Geosci. Remote Sens. 2011, 49, 3460–3470. [Google Scholar] [CrossRef]
  16. Wang, Y.; Zhu, X.; Bamler, R. Retrieval of phase history parameters from distributed scatterers in urban areas using very high resolution SAR data. ISPRS J. Photogramm. Rem. Sens. 2012, 73, 89–99. [Google Scholar] [CrossRef] [Green Version]
  17. Goel, K.; Adam, N. Fusion of Monostatic/Bistatic InSAR Stacks for Urban Area Analysis via Distributed Scatterers. IEEE Geosci. Remote Sens. Lett. 2013, 11, 733–737. [Google Scholar] [CrossRef]
  18. Soergel, U. Potential and limits of InSAR data for building reconstruction in built-up areas. ISPRS J. Photogramm. Rem. Sens. 2003, 58, 113–123. [Google Scholar]
  19. Karathanassi, V.; Iossifidis, C.; Rokos, D. A texture-based classification method for classifying built areas according to their density. Int. J. Remote Sens. 2000, 21, 1807–1823. [Google Scholar] [CrossRef]
  20. Shi, G.; Lin, H.; Ma, P. A Hybrid Method for Stability Monitoring in Low-Coherence Urban Regions Using Persistent and Distributed Scatterers. IEEE J. Sel. Top. Appl. Earth Obs. Remote Sens. 2018, 11, 3811–3821. [Google Scholar] [CrossRef]
  21. Schmidt, D.; Bürgmann, R. Time-dependent land uplift and subsidence in the Santa Clara valley, California, from a large interferometric synthetic aperture radar data set. J. Geophys. Res. Solid Earth 2003, 108, 1–13. [Google Scholar] [CrossRef] [Green Version]
  22. Lanari, R.; Mora, O.; Manunta, M.; Mallorqui, J.; Berardino, P.; Sansosti, E. A small-baseline approach for investigating deformations on full-resolution differential SAR interferograms. IEEE Trans. Geosci. Remote Sens. 2004, 42, 1377–1386. [Google Scholar] [CrossRef]
  23. Biggs, J.; Wright, T.; Lu, Z.; Parsons, B. Multi-interferogram method for measuring interseismic deformation: Denali Fault, Alaska. Geophys. J. Int. 2007, 170, 1165–1179. [Google Scholar] [CrossRef] [Green Version]
  24. Wang, H.; Wright, T.; Yu, Y.; Lin, H.; Jiang, L.; Li, C.; Qiu, G. InSAR reveals coastal subsidence in the Pearl River Delta, China. Geophys. J. Int. 2012, 191, 1119–1128. [Google Scholar] [CrossRef] [Green Version]
  25. Perissin, D.; Wang, T. Time-Series InSAR applications over urban areas in China. IEEE J. Sel. Top. Appl. Earth Obs. Remote Sens. 2011, 4, 92–100. [Google Scholar] [CrossRef]
  26. Zhang, L.; Ding, X.; Lu, Z. Ground settlement monitoring based on temporarily coherent points between two SAR acquisitions. ISPRS J. Photogramm. Rem. Sens. 2011, 66, 146–152. [Google Scholar] [CrossRef]
  27. Fornaro, G.; Verde, S.; Reale, D.; Pauciullo, A. CAESAR: An approach based on covariance matrix decomposition to improve multibaseline–multitemporal interferometric SAR processing. IEEE Trans. Geosci. Remote Sens. 2015, 53, 2050–2065. [Google Scholar] [CrossRef]
  28. Cao, N.; Lee, H.; Jung, H. A phase-decomposition-based PSInSAR processing method. IEEE Trans. Geosci. Remote Sens. 2016, 54, 1074–1090. [Google Scholar] [CrossRef]
  29. Dong, J.; Zhang, L.; Tang, M.; Liao, M.; Xu, Q.; Gong, J.; Ao, M. Mapping landslide surface displacements with time series SAR interferometry by combining persistent and distributed scatterers: A case study of Jiaju landslide in Danba, China. Remote Sens. Environ. 2018, 205, 180–198. [Google Scholar] [CrossRef]
  30. Parizzi, A.; Brcic, R. Adaptive InSAR stack multilooking exploiting amplitude statistics: A comparison between different techniques and practical results. IEEE Geosci. Remote Sens. Lett. 2011, 8, 441–445. [Google Scholar] [CrossRef] [Green Version]
  31. Jiang, M.; Ding, X.; Hanssen, R.; Malhotra, R.; Chang, L. Fast statistically homogeneous pixel selection for covariance matrix estimation for multitemporal InSAR. IEEE Trans. Geosci. Remote Sens. 2015, 53, 1213–1224. [Google Scholar] [CrossRef]
  32. Song, H.; Sun, Y.; Wang, R.; Li, N.; Zhang, B.; Wang, Y.; Fei, W. An Adaptive Multilook Approach for Small Sets of Multitemporal SAR Data Based on Adaptive Joint Data Vector. IEEE Geosci. Rem. Sens. Lett. 2017, 14, 1161–1165. [Google Scholar] [CrossRef]
  33. Schmitt, M.; Schönberger, J.; Stilla, U. Adaptive Covariance Matrix Estimation for Multi-Baseline InSAR Data Stacks. IEEE Trans. Geosci. Remote Sens. 2014, 52, 6807–6817. [Google Scholar] [CrossRef]
  34. Jiang, M.; Yong, B.; Tian, X.; Malhotra, R.; Hu, R.; Li, Z.; Yu, Z.; Zhang, X. The potential of more accurate InSAR covariance matrix estimation for land cover mapping. ISPRS J. Photogramm. Rem. Sens. 2017, 126, 120–128. [Google Scholar] [CrossRef]
  35. Narayan, A.; Tiwari, A.; Dwivedi, R.; Dikshit, O. A Novel Measure for Categorization and Optimal Phase History Retrieval of Distributed Scatterers for InSAR Applications. IEEE Trans. Geosci. Remote Sens. 2018, 56, 5843–5849. [Google Scholar] [CrossRef]
  36. Cao, N.; Lee, H.; Jung, H. Mathematical framework for phase-triangulation algorithms in distributed-scatterer interferometry. IEEE Geosci. Rem. Sens. Lett. 2015, 12, 1838–1842. [Google Scholar]
  37. Hanson, B.; Klink, K.; Matsuura, K.; Robeson, S.; Willmott, C. Vector Correlation: Review, Exposition, and Geographic Application. Ann. Assoc. Am. Geogr. 1992, 82, 103–116. [Google Scholar] [CrossRef]
  38. Schreier, P. A Unifying Discussion of Correlation Analysis for Complex Random Vectors. IEEE Trans. Signal Process. 2008, 56, 1327–1336. [Google Scholar] [CrossRef]
  39. Guarnieri, A.; Tebaldini, S. On the exploitation of target statistics for SAR interferometry applications. IEEE Trans. Geosci. Remote Sens. 2008, 46, 3436–3443. [Google Scholar] [CrossRef]
  40. Zhang, K.; Song, R.; Wang, H.; Wu, D.; Wang, H. Interferometric phase reconstruction using simplified coherence network. ISPRS J. Photogramm. Rem. Sens. 2016, 119, 1–9. [Google Scholar] [CrossRef]
  41. Zhang, B.; Wang, R.; Deng, Y.; Ma, P.; Lin, H.; Wang, J. Mapping the Yellow River Delta land subsidence with multitemporal SAR interferometry by exploiting both persistent and distributed scatterers. ISPRS J. Photogramm. Remote Sens. 2019, 148, 157–173. [Google Scholar] [CrossRef]
  42. Ma, P.; Lin, H. Robust detection of single and double persistent scatterers in urban built environments. IEEE Trans. Geosci. Remote Sens. 2016, 54, 2124–2139. [Google Scholar] [CrossRef]
  43. Hooper, A.; Segall, P.; Zebker, H. Persistent scatterer InSAR for crustal deformation analysis, with application to Volcán Alcedo, Galápagos. J. Geophys. Res. 2007, 112, 19. [Google Scholar] [CrossRef] [Green Version]
  44. Hotelling, H. Relations between two sets of variates. Biometrika 1936, 28, 321–377. [Google Scholar] [CrossRef]
  45. Kettenring, J. Canonical analysis of several sets of variables. Biometrika 1971, 58, 433–451. [Google Scholar] [CrossRef]
  46. Samiei-Esfahany, S. Exploitation of Distributed Scatterers in Synthetic Aperture Radar Interferometry. Ph.D. Thesis, Delft University of Technology, Delft, The Netherlands, 2017. [Google Scholar]
  47. Deledalle, C.; Denis, L.; Tupin, F. NL-InSAR: Nonlocal Interferogram Estimation. IEEE Trans. Geosci. Remote Sens. 2010, 49, 1441–1452. [Google Scholar] [CrossRef]
  48. Wang, Y.; Deng, Y.; Fei, W.; Wang, R.; Song, H.; Wang, J.; Li, N. Modified statistically homogeneous pixels’ selection with multitemporal SAR images. IEEE Geosci. Rem. Sens. Lett. 2016, 13, 1930–1934. [Google Scholar] [CrossRef]
  49. Wang, Y.; Zhu, X.; Bamler, R. Advanced coherence stacking technique using high resolution TerraSAR-X spotlight data. In Proceedings of the 2011 Joint Urban Remote Sensing Event (IEEE), Munich, Germany, 11–13 April 2011; pp. 233–236. [Google Scholar] [CrossRef]
  50. Sun, Q.; Jiang, L.; Jiang, M.; Ma, P.; Wang, H. Monitoring Coastal Reclamation Subsidence in Hong Kong with Distributed Scatterer Interferometry. Remote Sens. 2018, 10, 1738. [Google Scholar] [CrossRef] [Green Version]
  51. Jiang, L.; Lin, H. Integrated analysis of SAR interferometric and geological data for investigating long-term reclamation settlement of Chek Lap Kok Airport, Hong Kong. Eng. Geol. 2010, 110, 77–92. [Google Scholar] [CrossRef]
  52. Chen, F.; Lin, H. Multi-baseline differential SAR interferometry analysis of Lantau Highway, Hong Kong, using ENVISAT ASAR data. Remote Sens. Lett. 2011, 2, 167–173. [Google Scholar] [CrossRef]
  53. Berry, P. Application of consolidation theory for peat to the design of a reclamation scheme by preloading. Q. J. Eng. Geol. Hydrogeol. 1983, 16, 103–112. [Google Scholar] [CrossRef]
  54. Mimura, M.; Shibata, T.; Nozu, M.; Kitazawa, M. Deformation analysis of a reclaimed marine foundation subjected to land construction. Soils Found. 1990, 30, 119–133. [Google Scholar] [CrossRef] [Green Version]
  55. Kim, S.; Wdowinski, S.; Dixon, T.; Amelung, F.; Kim, J.; Won, J. Measurements and predictions of subsidence induced by soil consolidation using persistent scatterer InSAR and a hyperbolic model. Geophys. Res. Lett. 2010, 37, 87–105. [Google Scholar] [CrossRef] [Green Version]
  56. Shi, G.; Lin, H.; Bürgmann, R.; Ma, P.; Wang, J.; Liu, Y. Early soil consolidation from magnetic extensometers and full resolution SAR interferometry over highly decorrelated reclaimed lands. Remote Sens. Environ. 2019, 231, 111231. [Google Scholar] [CrossRef]
  57. Zhao, Q.; Lin, H.; Gao, W.; Zebker, H.; Chen, A.; Yeung, K. InSAR detection of residual settlement of an ocean reclamation engineering project: A case study of Hong Kong International Airport. J. Oceanogr. 2011, 67, 415–426. [Google Scholar] [CrossRef]
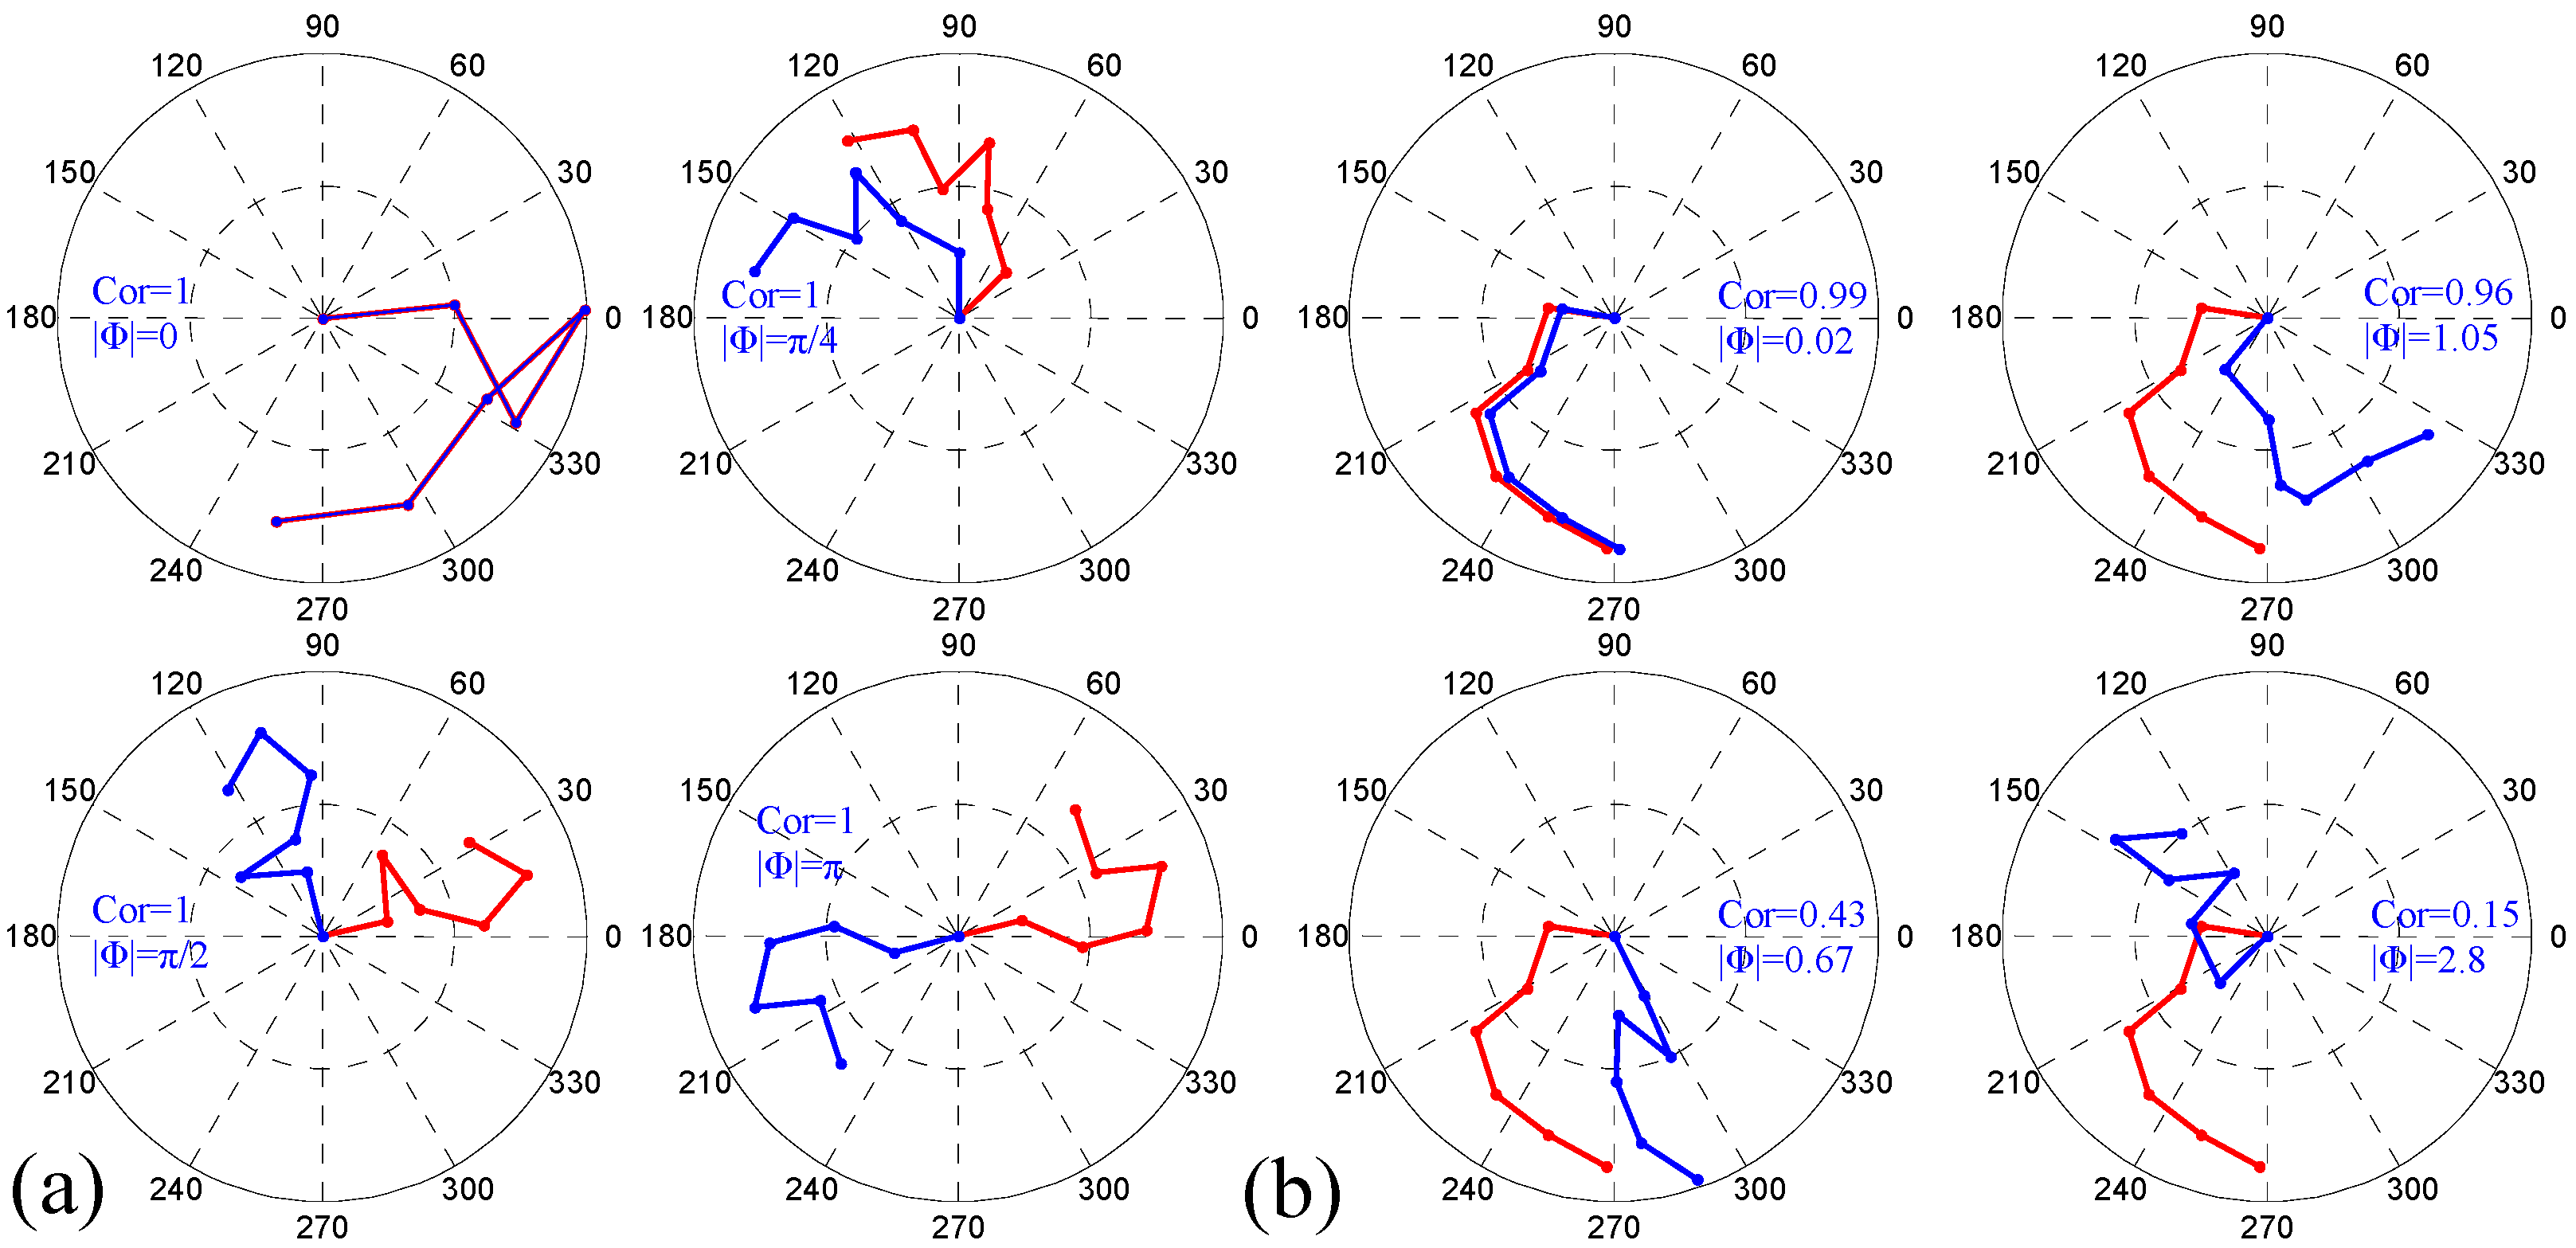
Figure 1. Correlations of complex vectors: (a) identical complex vectors with C o r = 1 and different rotations, and (b) random complex vectors with different C o r and rotation |Φ|.
Remotesensing 12 00686 g001
Figure 2. Monte Carlo simulation under different SNRs and phase dimensions for (a) correlation magnitude C o r and (b) rotation angle | Φ | . Dashed lines indicate mean value of all the different phase dimensions, red for the PCP pairs with the same true phase signal and blue for the non-PCP pairs with different phase signals. Color tone indicates different dimensions of phase.
Remotesensing 12 00686 g002
Figure 3. Flowchart of the proposed procedure for PS and DS integration using PCPWPL homogeneous filtering.
Remotesensing 12 00686 g003
Figure 4. Coherence matrix of the simulated SLCs, with image number N = 40.
Remotesensing 12 00686 g004
Figure 5. Execution time of the tested methods under different window size of (a) 7 × 7, (b) 11 × 11, (c) 15 × 15, and (d) 21 × 21.
Remotesensing 12 00686 g005
Figure 6. Mean amplitude of the simulated SLC data stack.
Remotesensing 12 00686 g006
Figure 7. Homogeneous filtered interferograms for the N = 40 simulated data stack, with the boxed patch enlarged for better interpretability. (left) A relatively high coherence pair and (right) a relatively low coherence pair.
Remotesensing 12 00686 g007
Figure 8. Quantitative comparison of the filtered interferograms with ‘RMSE_H’, ‘RMSE_L’, and ‘RMSE_T’ corresponding to the high-, low- coherence pairs presented in Figure 7, and the total dataset.
Remotesensing 12 00686 g008
Figure 9. The Hong Kong International Airport. (a) Google Earth view, white polygons indicate the two original rocky islands of Chek Lap Kok and Lam Chau. (b) Mean amplitude map of the CosmoSkyMed dataset, red boxes are regions for the detailed phase comparison in Figure 10.
Remotesensing 12 00686 g009
Figure 10. Filtered results of two interferograms by the ADWPL, PCPWPL’, and PCPWPL. Phase details are given using the amplified zones of A-D indicated by red boxes in Figure 9b, with their corresponding amplitude patterns shown in the first row.
Remotesensing 12 00686 g010
Figure 11. Neighborhood estimated by (a) SHPs from AD test, (b) PCPs from phase correlation and (c) their overlaps of a DS pixel on a pavement surface and building façade, respectively. Red and green dots indicate the reference point and the SHP/PCP neighbors.
Remotesensing 12 00686 g011
Figure 12. Coherence matrix of DS on pavement and façade estimated from (a) SHP neighbors and (b) PCP neighbors indicated in Figure 11.
Remotesensing 12 00686 g012
Figure 13. Mean Υ P T A values in zones A-D from ADWPL, PCPWPL’, and PCPWPL, using the common points of qualified measurements in Figure 15 under γ ^ = 0.7 .
Remotesensing 12 00686 g013
Figure 14. PS measurements detected under γ ^ = 0.75 , (left) the entire airport and (right) the four zones of A-D in Figure 9. Pixels are displayed in their height values for reflecting structure details.
Remotesensing 12 00686 g014
Figure 15. Qualified measurements (displayed in height) of HKIA under different coherence levels for DS extension, with their numbers of detected points annotated in top right.
Remotesensing 12 00686 g015
Figure 16. Height maps of the four zones A-D derived by DS extension from ADWPL and PCPWPL under different γ ^ levels. The number of qualified points is annotated below each subplot with the red color indicating more points detected.
Remotesensing 12 00686 g016
Figure 17. Geocoded deformation velocity of PS result, ADWPL result, and PCPWPL result. DSs are detected under γ ^ = 0.7 . Values are displayed in the normal vertical direction, assuming all the LOS deformation are due to vertical movement. Reference point is marked as red cross, background optical map is from Google Earth.
Remotesensing 12 00686 g017
Figure 18. (a) Cross-validation using common pixels from ADWPL and PCPWPL, (left) deformation, (right) height; (b) histogram of the difference values between ADWPL and PCPWPL in (left) deformation and (right) height.
Remotesensing 12 00686 g018
Figure 19. Subsidence in zone A: the consolidation of underlying compressible soil and zone B: the temporal transport road of the construction area.
Remotesensing 12 00686 g019
Table 1. Basic information of the 28 -CosmoskyMed descending images.
No. Date B p e r p   ( m ) B t e m p   ( d ) No. Date B p e r p   ( m ) B t e m p   ( d )
104/10/2013−570.273−4281506/12/201400
216/10/2013167.686−4161623/01/2015−203.35248
317/11/2013−407.913−3841708/02/2015−32.42264
419/12/2013−434.414−3521812/03/2015600.77096
508/01/2014446.206−3321929/04/201510.405144
621/02/2014192.603−2882031/05/2015−450.135176
713/03/2014378.852−2682120/06/2015−632.838196
828/05/2014−315.396−1922202/07/2015−625.484208
929/06/2014−608.571−1602303/08/2015260.131240
1019/07/2014−543.693−1402408/09/2015259.052276
1104/08/2014284.433−1242510/10/2015567.223308
1217/09/2014−757.191−802623/11/2015−118.312352
1303/10/2014−681.466−642709/12/2015482.739368
1420/11/2014−538.350−162814/01/2016723.162404
Table 2. Performance comparison between ADWPL and PCPWPL in the HKIA case.
ItemsADWPLPCPWPL
Computational costHigherLower
Υ P T A valueLowerHigher
Number of detected points (road surface and grass)HigherLower
Number of detected points (complex built area)LowerHigher