Abstract
Precipitation serves as a crucial factor in the study of hydrometeorology, ecology, and the atmosphere. Gridded precipitation data are available from a multitude of sources including precipitation retrieved by satellites, radar, the output of numerical weather prediction models, and extrapolation by ground rain gauge data. Evaluating different types of products in ungauged regions with complex terrain will not only help researchers in applying scientific data, but also provide useful information that can be used to improve gridded precipitation products. The present study aims to evaluate comprehensively 12 precipitation datasets made by raw retrieved products, blended with rain gauge data, and blended multiple source datasets in multi-temporal scales in order to develop a suitable method for creating gridded precipitation data in regions with snow-dominated regions with complex terrain. The results show that the Multi-Source Weighted-Ensemble Precipitation (MSWEP), Global Satellite Mapping of Precipitation with Gauge Adjusted (GSMaP_GAUGE), Tropical Rainfall Measuring Mission (TRMM_3B42), Climate Prediction Center Morphing Technique blended with Chinese observations (CMORPH_SUN), and Climate Hazards Group Infrared Precipitation with Stations (CHIRPS) can represent the spatial pattern of precipitation in arid/semi-arid and humid/semi-humid areas of the Qinghai-Tibet Plateau on a climatological spatial pattern. On interannual, seasonal, and monthly scales, the TRMM_3B42, GSMaP_GAUGE, CMORPH_SUN, and MSWEP outperformed the other products. In general, the Precipitation Estimation from Remotely Sensed Information using Artificial Neural Networks-Cloud Classification System (PERSIANN_CCS) has poor performance in basins of the Qinghai-Tibet Plateau. Most products overestimated the extreme indices of the 99th percentile of precipitation (R99), the maximal of daily precipitation in a year (Rmax), and the maximal of pentad accumulation of precipitation in a year (R5dmax). They were underestimated by the extreme index of the total number of days with daily precipitation less than 1 mm (dry day, DD). Compared to products blended with rain gauge data only, MSWEP blended with more data sources, and outperformed the other products. Therefore, multi-sources of blended precipitation should be the hotspot of regional and global precipitation research in the future.
1. Introduction
Precipitation serves as a crucial factor used by decision makers who are tasked with water allocation as well as in understanding hydrological processes, atmospheric research, and hazard prevention [1,2,3,4]. Data sources related to precipitation mainly include ground-based rain gauges, numerical weather prediction (NWP) models, weather radar retrieval, and satellite data retrieval. However, traditional precipitation measurements based on rain gauges and weather radar are usually collected near human settlements, and these observations are sparsely scattered across regions with vulnerable environments (e.g., Central Asia, Northern Africa and polar areas). Therefore, satellite-retrieved precipitation (SRP) and NWP’s precipitation estimates could solve problems involving the scarcity of precipitation observations in those regions.
Although SRP and NWP model precipitation estimates can cover ungauged regions, such as the Qinghai-Tibet Plateau, potential uncertainties caused by various factors (e.g., deficiency of the retrieved algorithm as well as systematic and random errors) still exist [5]. Thus, these gridded precipitation datasets should be carefully evaluated before applying these data. An evaluation of SRPs in China is summarized in Table 1. It shows that most studies, which employed gauge observations and hydrological models (e.g., the Soil and Water Assessment Tool [SWAT], Variable Infiltration Capacity [VIC], and Xinanjiang models), have been using the SRP products at a hydrological basin scale or China regional scale. The SRP with bias correction from gauge observations (e.g., the product of Climate Prediction Center morphing technique with corrected bias [CMORPH_adj], Tropical Rainfall Measuring Mission (TRMM) Multisatellite Precipitation Analysis [TRMM_3B42/43], Precipitation Estimation from Remotely Sensed Information using Artificial Neural Networks-Climate Data Record [PERSIANN-CDR], and Global Satellite Mapping of Precipitation [GSMaP_analysis]) is usually better than near real-time raw SRP data (e.g., TRMM_3B42 RT and the product of Climate Prediction Center morphing technique in near real-time [CMORPH_RAW]), which is only bias-corrected with climatological gridded observations. Therefore, if SRPs were bias-corrected with gauge information in an area, the SRP would be evaluated as having better performance and vice versa. The auto-correlation between bias correction of SRP and the evaluation of SRP becomes a mathematical game.

Table 1.
Summary of satellite retrieved precipitation data in China.
With the development of NWP models and the increased availability of computational resources, models have the ability to simulate precipitation in horizontal resolutions from meters to kilometers. The highest horizontal resolution in the High Asia Reanalysis (HAR) [47] and Western China Reanalysis (WCR) datasets were 10 km and 12 km, respectively, which is close to the horizontal resolution of SRP (e.g., Global Precipitation Measurement Integrated Multi-satellite Retrievals (GPM IMERG, 0.10°, ~11.1 km), GSMaP (0.10°, ~11.1 km), and CMORPH (8 km)). In East China [48] and Europe [49], NWP models used for operational weather forecast had a horizontal resolution of less than 4 km. Therefore, the global/regional atmospheric reanalysis dataset provides a promising proxy of SRP. The precipitation observations were not assimilated into the model without the evaluation problem of SRP mentioned above. In addition, these high-resolution regional reanalysis datasets have not been comprehensively evaluated for use in the Qinghai-Tibet Plateau.
Convective precipitation systems (e.g., heavy precipitation and typhoons) can be easily captured by SRP in a fine time-scale [50,51], but the studies listed in Table 1 show that SRP failed to fairly represent a front precipitation system in cold seasons. However, NWP models have performed well in cold seasons and cold regions [47,52,53], when compared with its weak performance in warm seasons and locations [54]. Multi-source blended precipitation (MSBP), which blends precipitation datasets from ground-based gauges, precipitation retrieved from ground-based radar, SRP, and NWP models, compensates for the advantages and shortcomings of both NWP models and SRP. Thus, MSBP provides a useful tool for gaining insight into meteorological and hydrological processes in snow-dominated areas with complex terrain (e.g., the Qinghai-Tibet Plateau and the Tianshan Mountains). Multi-Source Weighted-Ensemble Precipitation (MSWEP), which is an MSBP, has been evaluated in Iran [55], East Africa [56], India [57], and Eastern China [20]. A brief evaluation of MSWEP in the Qinghai-Tibet Plateau has been conducted with a new dataset of the EMSPD-DBMA (Ensemble Multi-Satellite Precipitation Dataset using a Dynamic Bayesian Model Averaging scheme), which contains more ground-based gauges than other SRPs [12]. However, this new dataset has not been evaluated comprehensively with other SRPs to compare the spatiotemporal pattern and intensity.
Previous studies (Table 1) have normally evaluated the SRP on a climatological scale (e.g., daily, seasonal and annual scales). This paradigm could fit the climatological spatiotemporal variation because SRP has corrected the bias at a climatological scale. However, at a weather synoptic scale, even CMORPH and TRMM fail to the capture the spatiotemporal patterns of extreme precipitation [58]. Studies using SRP have shown an uneven performance in different latitudes when used at a basin scale [59]. Because the scarcity of ground gauge observations creates limitation, previous studies have normally evaluated the Qinghai-Tibet Plateau as a whole. Those studies have always statistically averaged the small amount of precipitation received in arid lands (e.g., the Qaidam Basin) with precipitation falling in humid regions with abundant precipitation, thus ignoring the specified statistical properties of arid climates. Therefore, an evaluation should be conducted to distinguish the difference between precipitation in arid and the humid regions.
Most gridded precipitation datasets entail a great amount of uncertainty in the Qinghai-Tibet Plateau because of its complex terrain [60]. Thus, gridded precipitation should be comprehensively evaluated before being applied. The main objective in this study is to provide further insight into evaluating the reliability of SRP, high-resolution regional reanalysis datasets, and MSBP in basins of the Qinghai-Tibet Plateau on different temporal scales, and to compare their strengths and weaknesses.
2. Datasets and Methodology
2.1. Datasets
Daily rain gauge observations were downloaded from the China Meteorological Administration (CMA) website (http://data.cma.cn). Before using these observational data, we performed strict data quality control in order to improve the reliability and credibility of the evaluation. First, we checked the missing values in the raw records and deleted the records of any rain gauge station with >100 missing values during 9 years. Second, we labeled daily precipitation outliers as missing; here, an outlier was a value >100 mm/day. Finally, the present study selected 83 stations covering most of the Qinghai-Tibet Plateau and having coverage by all products from 2003–2010. Figure 1 shows the topography of the Qinghai-Tibet Plateau including 10 river basins. Because observations were limited by the total number of weather observation stations, each river basin should have at least three stations. Therefore, eight river basins were selected: (1) Brahmaputra River (BRA; 23 stations), (2) Hei River Basin (HEX; three stations), (3) Inner Tibetan Plateau (INN; five stations), (4) Mekong River Basin (MEK; seven stations), (5) Qaidam Basin (QAI; seven stations), (6) Salween River (SAL; eight stations), (7) Yangtze River Basin (YAN; 15 stations), and (8) the Yellow River Basin (YEI; 15 stations). Both QAI and INN have a climate classification of arid land, while all of the others are humid regions.
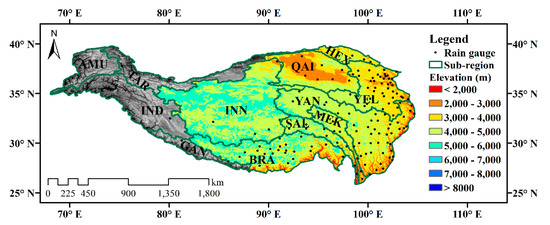
Figure 1.
Rain gauge observation network and main hydrological basins in the Qinghai-Tibet Plateau. The base map of elevation is based on dataset of the global digital elevation model known as Global 30 Arc-Second Elevation (GTOPO30) [61]. The registered number of the map is GS2016 (2925). River basins include: BRA, Brahmaputra River Basin; HEX, Hei River Basin, INN, inner Tibetan Plateau; MEK, Mekong River Basin; SAL, Salween River Basin; QAI, Qaidam Basin; YAN, Yangtze River Basin; YEL, Yellow River Basin.
The present study evaluated 12 gridded precipitation datasets (Table 2). The first is TRMM_3B42 V7, which has a long-term series of almost 20 years. GSMaP_GAUGE was retrieved by an ensemble Kalman Filter (EnKF). Datasets 3–5 are the CMORPH family of datasets created by the National Oceanic and Atmospheric Administration (NOAA) and CMA, respectively. Datasets 6–8 provide SRP retrieved from infrared information. Datasets 9–11 are precipitation datasets output from NWP models. The last is the MSBP dataset. In these precipitation datasets, only CMORPH_RAW and Precipitation Estimation from Remotely Sensed Information using Artificial Neural Networks-Cloud Classification System (PERSIANN_CCS) are pure SRP datasets, while TRMM_3B42, GSMaP_GAUGE, CMORPH_ADJ, Climate Prediction Center Morphing Technique blended with Chinese observations (CMORPH_SUN), Precipitation Estimation from Remotely Sensed Information using Artificial Neural Networks-Climate Data Record (PERSIANN_CDR), and Climate Hazards Group Infrared Precipitation with Stations (CHIRPS) are SRP with bias correction from ground-based rain gauge data, or blended with ground-based rain gauge data. MSWEP is blended with ground-based rain gauge data, reanalysis, and SRP. Furthermore, CMORPH_SUN use more ground-based rain gauge data than the other products covering China mainland, China.

Table 2.
Precipitation datasets employed in the present study.
The datasets in Table 2 have different spatiotemporal resolutions. If we processed these gridded precipitation data into a coarse grid or lower horizontal resolution, the few, unevenly distributed in situ observations in the Qinghai-Tibet Plateau could only adequately evaluate the data in the areas with the observations located. In addition, precipitation evaluation on complex terrain like Qinghai-Tibet Plateau has great uncertainty. Thus, we regrid all gridded data into a grid of 0.1°, and interpolate the data into spatial point that represent rain gauge by bilinear interpolation method. The evaluation work in this study is done by a point-to-point method.
2.2. Evaluation Methods
Three statistical metrics were utilized in this study. First, the mean error (ME) (Equation (1)) was used to assess the difference between precipitation datasets and rain gauge data. The other metrics were the root-mean-square error (RMSE) (Equation (2)) and Pearson’s correlation coefficient (CC) (Equation (3)). The mathematical expressions are as follows:
where PE and GND denote rainfall amounts from precipitation datasets and rain gauge data, respectively.
For extreme precipitation, the cases with high spatiotemporal resolution observations (e.g., radar-retrieved precipitation and high-density rain gauge observation networks) should be selected for evaluation. The complex topography of the Qinghai-Tibet Plateau limits the range of several weather radars, however. The valley-peak topography also limits the deployment of automatic weather stations. Therefore, the present study used R99, Rmax, R5dmax, and DD to measure extremely wet conditions and extremely dry conditions. R99 is precipitation in the 99th percentile of a year after excluding zero values for daily precipitation. Rmax is the day with the maximal amount of daily precipitation in a year. R5dmax is the maximal of pentad accumulation of precipitation in a year. It ranges from 0–73. DD indicates the total number of days with daily precipitation is <1 mm.
In the present study, spring, summer, autumn and winter are defined as March–May, June–August, September–November, and December–February, respectively. In addition, the ranges of light rain, moderate rain, and heavy rain are 0–10 mm/day, 10–25 mm/day, and 25–50 mm/day, respectively.
3. Results
3.1. Comparison of the Spatial Pattern of Multi-Year Mean Annual Precipitation
Figure 2 shows that most precipitation products (except PERSIANN_CCS) can represent the spatial pattern of precipitation in arid and semi-arid land (annual precipitation <200 mm and between 200–400 mm, respectively). In Figure 2, the GSMaP_GAUGE (b), PERSIANN_CDR (f), CHIRPS (h), and MSWEP (l) datasets present the climatological spatial pattern of precipitation with a smooth boundary in basins of the Qinghai-Tibet Plateau, compared with the TRMM_3B42 (a) and CMORPH family (c–e) datasets, which have slightly high values points for precipitation in the study basins. These products may neglect the local and orographic spatial pattern of precipitation, even if the horizontal resolution of CHIRPS reaches 0.05°. Therefore, these quantitative precipitation estimate (QPE) products with gauges are suitable for research related to climatological change or for synoptic analysis on a large scale. In the INN and QAI basins, CMORPH_RAW (c) and reanalysis products (i–k) reproduced the zones of high precipitation (400–800 mm) near the Kunlun and Altun mountains (35°N), and nothing in other products. In terms of multiyear mean annual precipitation in Figure 2, it was discovered that the WCR (1117 mm/year) and PERSIANN_CCS (989 mm/year) provided overestimates compared to observation (446 mm/year). Of the NWP models, HAR (532 mm/year) outperformed CSFR (625 mm/year) and WCR. In the CMORPH family, the annual precipitation values from CMORPH_RAW, CMORPH_ADJ, and CMORPH_SUN were 765 mm/year, 421 mm/year and 427 mm/year, respectively. CMORPH_RAW lacked bias correction compared to CMORPH_ADJ and CMORPH_SUN. Thus, bias correction with ground-based rain gauges is a key factor, that impacts performance. The TRMM 3B42 (535 mm/year) and GSMaP_GAUGE (458 mm/year), which were bias-corrected, displayed small differences from the observations.
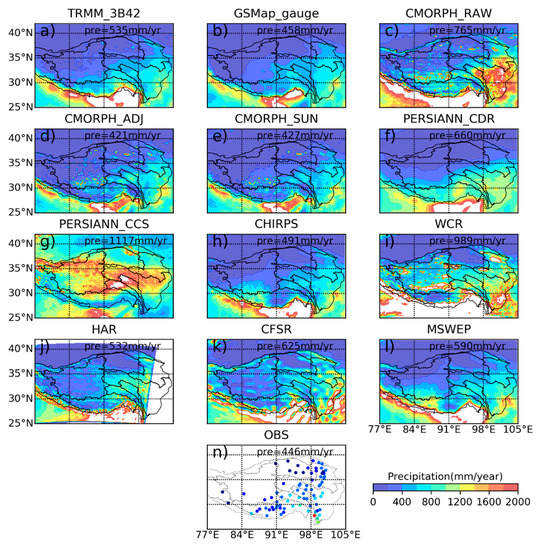
Figure 2.
Spatial patterns of multi-year mean annual precipitation (2003–2010) based on the following datasets: (a) Tropical Rainfall Measuring Mission Multi-satellite Precipitation Analysis Version 7 (TRMM_3B42 V7); (b) Global Satellite Mapping of Precipitation with Gauge Adjusted (GSMaP_GAUGE); (c) Climate Prediction Center Morphing Technique origin version (CMORPH_RAW); (d) Climate Prediction Center Morphing Technique with bias-correction (CMORPH_ADJ); (e) Climate Prediction Center Morphing Technique blended by Shuai Sun (CMORPH_SUN); (f) Precipitation Estimation from Remotely Sensed Information using Artificial Neural Networks-Climate Data Record (PERSIANN_CDR); (g) Precipitation Estimation from Remotely Sensed Information using Artificial Neural Networks-Cloud Classification System (PERSIANN_CCS); (h) Climate Hazards Group Infrared Precipitation with Stations (CHIRPS); (i) Western China Reanalysis (WCR); (j) High Asia Reanalysis (HAR); (k) NCEP Climate Forecast System Reanalysis (CFSR); (l) Multi-Source Weighted-Ensemble Precipitation Version 1.0 (MSWEP V1); (n) rain gauge observations. The “pre” in each subplot indicates the multiyear mean annual precipitation (unit: mm/year), which was calculated by 83 stations from each product interpolation.
In the BRA Basin, CMORH_ADJ (d) and CMORPH_SUN (e) indicated the presence of a larger number of arid/semi-arid areas than the other databases. In the YAN Basin, PERSIANN_CDR (f) showed an annual precipitation of 800–1200 mm compared to annual precipitation of 400–800 mm in the TRMM_3B42 and CMORPH family datasets (with the exception of CMORPH_RAW). In other basins, some spatial shape in the form of a “bull’s eye” was observed in precipitation products. In regions covered with a dense rain gauge network, rain gauge data were available for correcting QPE products. However, in ungauged areas, incorrect spatial patterns may be created. In the middle and western parts of the Qinghai-Tibet Plateau, CMORPH_RAW (c) and PERSIANN_CCS (g) indicated the presence of regions with annual precipitation >2000 mm when compared with the other products. In the HEX Basin, the products with gauge bias correction could represent conditions in the relatively dry and wet regions in western and eastern basins, respectively. For reanalysis products, WCR (i) and HAR (j) also reproduced these spatial pattern. Global/regional reanalysis products can reproduce the arid climatic conditions in the QAI Basin, and the current semi-arid areas in the INN Basin; this was especially true for the WCR dataset. Furthermore, only CFSR showed discrete strips with high precipitation rates in the INN Basin. In the YAN and YEL basins, HAR and CFSR present a spatial pattern similar to that of MSWEP with precipitation in the range of 800–1200 mm annually.
3.2. Evaluation on an Annual Scale
On an interannual scale, great differences were obvious between products and rain gauges (Figure 3a). The GSMaP_GAUGE was closest to the observations. In contrast, PERSIANN_CCS, and WCR exhibited the largest biases. CMORH_ADJ, and CMORPH_SUN slightly underestimated precipitation from 2003–2005. After 2006, the two products were close to observation. This is because CMORPH_SUN originated from CMORPH_ADJ, which blends more surface rain gauges during production. Meanwhile, TRMM_3B42 and CHIRPS overestimated precipitation by <100 mm annually. In addition, CFSR and MSWEP overestimated precipitation by 200 mm annually. PERSIANN_CCS dataset also resulted in overestimation. Although WCR overestimated precipitation, it could still capture the variability of the change in precipitation over time. HAR performed better than WCR with obvious overestimation of precipitation after 2006.
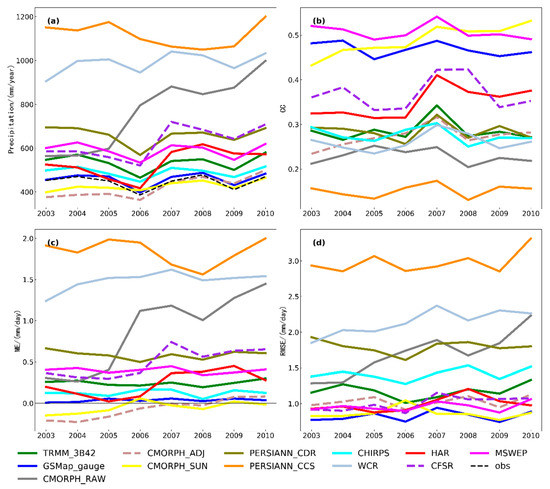
Figure 3.
Interannual statistical characteristics of precipitation datasets in the Qinghai-Tibet Plateau. Mean error and root mean square error (RMSE) were calculated in a daily series. (a) Total annual precipitation 2003–2010; (b) correlation coefficient; (c) mean error; (d) RMSE.
The MSWEP, CMORPH_SUN, and GSMaP_GAUGE datasets had a CC of more than 0.40, and higher than the other datasets; in particular, the CC of MSWEP was more than 0.50. Meanwhile, PERSIANN_CCS had the lowest CCs, at less than 0.20. The CC of the other products ranged from 0.20–0.40. The CC in various products peaked in 2006–2007. The CC in TRMM 3B42 was higher than the CC in CMORPH ADJ. In some years, the CC of PERSIANN_CDR was higher than the CC in TRMM 3B42. The CC in CMORPH_RAW was a little higher than those in PERSIANN_CCS. The CC in CFSR and HAR were close. Recently, more rain gauges in China have become available in the Global Telecommunication System; as a result, the availability of CC in products with bias correction is expected to increase. However, slightly variability occurred in Figure 3b. CC has been increasing in only HAR and CMORPH_SUN.
The ME in most products was ±0.5 mm/d (Figure 3c) including in PERSIANN_CCS, WCR, and CMORPH_RAW in particular, it was more than 1.5 mm/d in PERSIANN_CCS. The ME was positive TRMM, PERSIANN_CDR, CFSR, and MSWEP and negative in CMORPH_ADJ, CMORPH_SUN, and GSMAP_GAUGE. Among them, the positive ME in CMORPH_RAW increased rapidly over time. The ME of HAR and CHIRPS varied slightly.
The RMSE in most products was stable and stayed within 2 mm/d (Figure 3d). In addition, CMORPH_RAW, CHIRPS, WCR, and PERSIANN_CCS had relatively large RMSEs while those of GSMAP_GAUGE, HAR, MSWEP, and CFSR were relatively small. In 2006 and 2009, the RMSEs in all products were relatively small compared with the larger values in 2007 and 2008.
Quantitative precipitation estimates (QPE) were higher than observations in most products (Table 3) including in GSMAP_GAUGE, CMORPH_SUN, and CMORPH_ADJ. The QPEs of CHIRPS were close to observation. However, PERSIANN_CCS and WCR severely overestimated precipitation. On a seasonal scale, products without bias correction (CMORPH_RAW and PERSIANN_CCS) more severely overestimated precipitation than Global/Regional reanalysis datasets (CFSR and HAR).

Table 3.
Multi-year mean annual and seasonal total precipitation of precipitation datasets (2003–2010) employed in the present study (unit: mm).
3.3. Evaluation on a Seasonal Scale
Most products overestimated and underestimated the intensity of precipitation of heavy and relatively light rain, respectively (Figure 4). However, GSMaP_GAUGE (b), CMORPH_ADJ (c), and CHIRPS (h) overestimated light rain and underestimated moderate and heavy rain. In spring, WCR (i) overestimated precipitation intensity. CMORPH_SUN (e) showed a slight underestimation of precipitation intensity. The QPE in products exhibited a general overestimation of precipitation in summer; this was especially true for TRMM_3B42 (a), CMORPH_RAW (d), PERSIANN_CDR (f), PERSIANN_CCS (g), WCR (i), and MSWEP (l). In addition, other QPEs overestimated heavy rain, while underestimating light and moderate rain. In autumn, the bias in QPE and observation was the smallest of all seasons. GSMaP_GAUGE, CMORPH_ADJ, and CMORPH_SUN underestimated precipitation intensity in all bins, which can be compared with overestimation of CMORPH_RAW, WCR, and CFSR (k). In winter, except for PERSIANN_CCS and WCR, other QPEs overestimated the precipitation during light rain events, and underestimated it during moderate and heavy rain. The frequency of precipitation intensity of TRMM_3B42, GSMAP_GAUGE, CMORPH_SUN, CHIRPS, and MSWEP had a similar pattern with small bias when compared with observations. Bias between QPE and observation was present in summer and winter. For precipitation intensity, QPE overestimates light and moderate rain and underestimates heavy rain. In winter, the precipitation intensity was normally <25 mm.
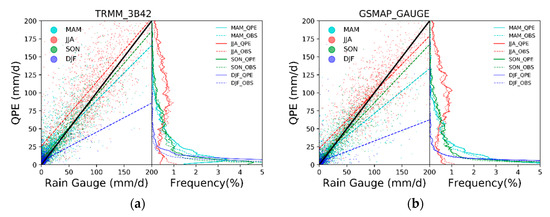
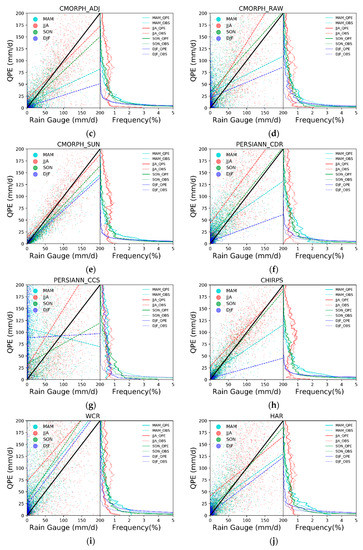
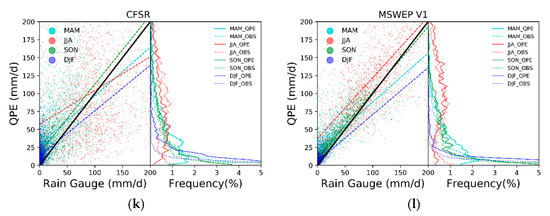
Figure 4.
Seasonal statistical characteristics of precipitation datasets in the Qinghai-Tibet Plateau. The left subplot in each part of the figure indicates the seasonal scatter plot between rain gauge observations and precipitation datasets (QPEs). The right subplot indicates the seasonal frequency distribution of rain gauge observation and precipitation datasets (QPEs). The black line in left subplot is 1:1 line and the dotted lines indicate the regression lines between rain gauge and QPEs. The seasons are: MAM, March–May; JJA, June–August; SON, September–November; DJF, December–February.
3.4. Evaluation on a Monthly Scale
In addition to PERSIANN_CCS most products can capture the monthly bell-shaped temporal pattern of precipitation, more so in the warm season and less in the cold season. The WCR dataset systematically overestimated monthly precipitation (Figure 5a). In the warm season (July–September), WCR, PERSIANN_CDR, and CMORPH_RAW severely overestimated precipitation. Even in the cold season (September–April), CFSR and CMORPH_RAW also overestimated the monthly precipitation. It is known that lower brightness temperatures of cloud tops indicate stronger precipitation intensity. Since lower clouds (e.g., cumulus and nimbostratus), have heights > 5 km in the Qinghai-Tibet Plateau (the average height of the Qinghai-Tibet Plateau is 4 km.), their means the brightness temperatures are quite low. So, IR-retrieved precipitation (the PERSIANN family) may overestimated. The parameters of the WCR are suitable for Xinjiang since this region has a lower elevation than the Qinghai-Tibet Plateau. Thus, the WCR also overestimates precipitation due to its inappropriate parameters for the altitude of the plateau. A higher CC was observed in CMORPH_SUN, GSMAP_GAUGE, and MSWEP, which exceeded 0.60. The CCs in CHIRPS and TRMM were similar and relatively low in November and December. For reanalysis, the CCs in CFSR and HAR were more than that of WCR. The monthly changes in CC for CMORPH_ADJ and CMORPH_RAW were similar to the high values in April–October, with CMORPH_ADJ being only a little higher than CMORPH_RAW. Although TRMM_3B42, CMORPH_RAW and CMORPH_ADJ had relatively low values in the cold season, TRMM_3B42 was generally better than CMORPH_RAW and CMORPH_ADJ.
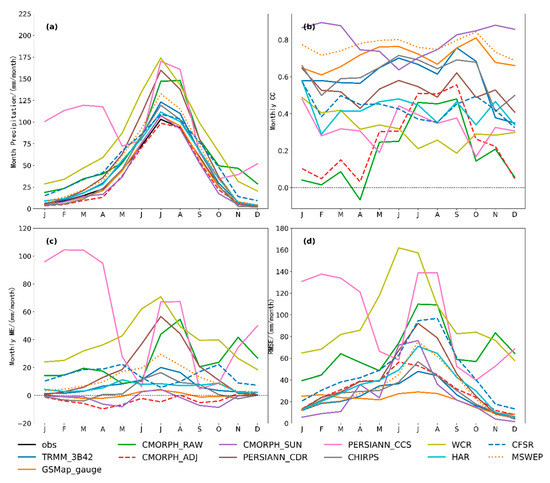
Figure 5.
Statistical metrics of precipitation datasetes on the monthly scale. (a) Monthly precipitation; (b) monthly correlation coefficient (CC); (c) monthly mean error (ME); (d) monthly root mean square error (RMSE).
ME in most products was greater in the warm season (May–August; Figure 5c). In each month, ME in PERSIANN_CCS, WCR, CMORPH_RAW, and PERSIANN_CDR was over 20 mm while the ME for other products was less than 20 mm. The CMORPH_ADJ and CMORPH_SUN datasets had a negative ME, and the ME in GSMaP_GAUGE was almost zero. The temporal pattern of RMSE was basically the same with a greater RMSE in the warm season (May–September; Figure 5d). With a precipitation intensity of 50–150 mm, RMSE in PERSIANN_CCS and WCR were greater than the other datasets. GSMaP_GAUGE had a relatively small annual RMSE throughout the year, especially in winter (less than 20 mm/month).
3.5. Evaluation by Scorecard
Scorecards are normally utilized when evaluating numerical weather prediction. In Figure 6, the middle column is the CC for eight hydrological regions. The y-axis is the gridded precipitation, and the x-axis represents the 12 months of a year. The red color represents the positive CC, and the blue color represents negative CC. Colors appearing more red or warmer indicate higher positive CC, while colors appearing more blue or cooler indicate higher negative CC. The same color representation is used for ME in the third column. The varying color intensities should assist in making quick and judgements of the statistical metrics.
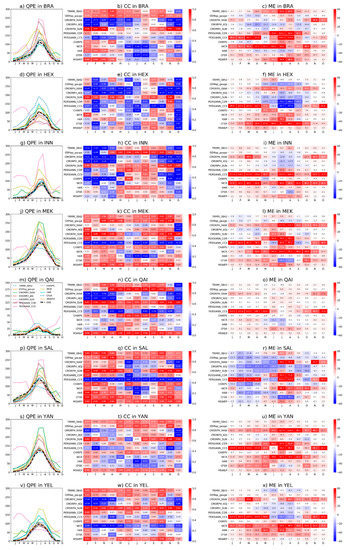
Figure 6.
Statistical metrics of monthly precipitation in eight basins of the Qinghai-Tibet Plateau. The quantitative precipitation estimates (QPEs), Correlation coefficients (CCs), and mean error (MEs) are shown respectively in eight river basins as follows: (a–c) Brahmaputra, BRA; (d–f) Hei, HEX; (g–i) Inner Tibetan Plateau, INN; (j–l) Mekong River Basin, MEK; (m–o) Salween River, SAL; (p–r) Qaidam Basin, QAI; (s–u) Yangtze River Basin, YAN; (v–x) Yellow, YEL.
In the BRA Basin, CC in TRMM_3B42 and GSMaP_GAUGE was greater than 0.60 in a year, and CC in the CMORPH family of datasets (except CMORPH_SUN) was below 0.40 (Figure 6b). Regional reanalysis of WCR and HAR had a higher CC in the cold season (September–April). Most products overestimated the monthly precipitation except for an underestimation by CMORPH_ADJ in Mar–July. In the HEX Basin, most products performed poorly, especially the CMORPH family of datasets (except CMORPH_SUN). The CMORPH_SUN had a higher CC than other products (Figure 6e). CFSR had a comparatively ME in May–September, and PERSIANN_CDR had small ME in July–September. In the INN Basin, CC in GSMaP_GAUGE and CMORPH_SUN was relatively high (Figure 6h). The CC in other products performed better in the warm season and more poorly in the cold season. The PERSIANN_CCS and WCR had an obvious positive ME. The ME in GSMaP_GAUGE, CMORPH_ADJ, and CMORPH_SUN was lower than other products in a year. In the MEK Basin (Figure 6k), the CC in TRMM_3B42, GSMaP_GAUGE, MSWEP, CHIRPS, and CMORPH_SUN was >0.60 in a year. The CC of the HAR was <0.30 in June–September, and the CC in CFSR was a little higher than the CCs in WCR. TRMM_3B42, GSMAP, MSWEP, CHIRPS, CMORPH_SUN, and CMORPH_ADJ had smaller MEs than those of other products.
In the QAI Basin (Figure 6n), for the CMORPH family of datasets (with the exception of CMORPH_SUN) the CC was lower during the cold season and higher during the warm season. In general, the CCs in TRMM_3B42, GSMaP_GAUGE, CMORPH_SUN, and MSWEP were higher than in other databases. Moreover, the CC in CHIRPS and PERSIANN_CDR was also relatively high. In addition to WCR, and HAR, which had a weakly negative ME in the warm season, the other products had a small positive ME in a single year. In the SAL Basin (Figure 6q), the CC in CMORPH_ADJ, CMORPH_RAW, PERSIAN CDR, and WCR (except PERSIANN_CCS) was relatively low in July–September. In addition, these products also had a negative ME. In the YAN and YEL basins (Figure 6u,x), the ME in TRMM_3B42, GSMAP_GAUGE, CMORPH_ADJ, CMORPH_SUN, and CHIRPS was relatively small compared with other datasets having positive ME.
3.6. Evaluation of Precipitation Intensity
In general, QPE products in the present study could capture the pattern of intensity for daily precipitation in the Qinghai-Tibet Plateau. In addition to CMORPH_RAW, PERSIANN_CCS, and WCR, Figure 7a,b show that most products in the INN and QAI basins overestimated precipitation at intensities of 0.1–1.0 mm/d. Moreover, they underestimated precipitation intensity that was more than 10 mm/d. For precipitation intensities over 15 mm/d in other basins, WCR, CMORPH_RAW, and PERSIANN_CCS obviously overestimated and could be compared to the underestimation in MSWEP, CFSR, and GSMAP_GAUGE. The CHIRPS dataset, underestimated precipitation intensity of 0.1–3.0 mm/d, but overestimated precipitation intensity over 3 mm/d. In contrast, MSWEP overestimated precipitation intensity of 0.1–2.0 mm/d and underestimated it in other precipitation intensity bins.
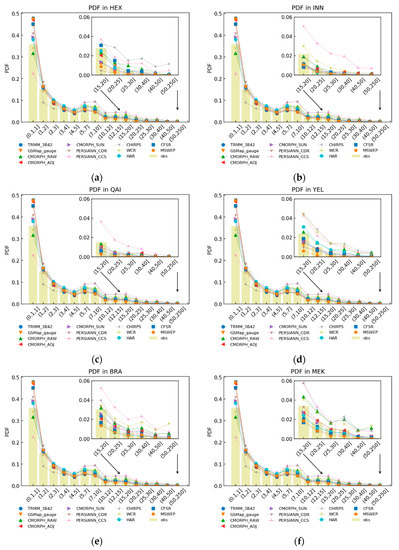
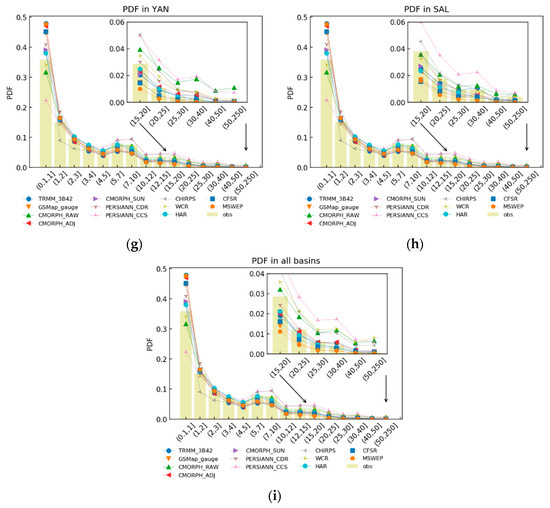
Figure 7.
The probability density function of precipitation in eight basins of the Qinghai-Tibet Plateau.The river basins include: (a) Hei River Basin (HEX); (b) Inner Tibetan Plateau (INN); (c) Qaidam Basin (QAI); (d) Yellow River Basin (YEL); (e) Brahmaputra River Basin (BRA); (f) Mekong River Basin (MEK); (g) Yangtgz River Basin (YAN); (h) Salween River Basin (SAL); (i) all eight river basins.
In all basins, PERSIANN_CCS obviously underestimated precipitation intensity of 0.1–1.0 mm/d, and overestimated precipitation intensity of >5 mm/d. For CMORPH_RAW, it slightly underestimated precipitation intensity of 0.1–1.0 mm/d and overestimated precipitation intensity of >20 mm/d compared to PERSIANN_CCS. However, CHIRPS, which was infrared (IR)-retrieved precipitation with ground-based rain gauge bias correction, only underestimated in precipitation intensity of 2–5 mm/d. In precipitation intensity of 0.1–1.0 mm/d, MSWEP, TRMM_3B42 and CMORPH_ADJ overestimated compared to observations. However, these products always keep the overestimating order of TRMM_3B42 > MSWEP > CMORPH_ADJ. In precipitation intensity of >15 mm/d, MSWEP showed a stronger underestimating trend than TRMM_3B42 and CMORPH_ADJ. In most basins, CMORPH_SUN showed a stronger underestimating trend than CMORPH_ADJ in precipitation intensity of >15 mm/d.
In the Qinghai-Tibet Plateau, the instrument used to measure precipitation is the tipping bucket rain gauge, without protection from the wind. After 2013, weighing rain gauges began to deploy. Most official weather stations in the Qinghai-Tibet Plateau do not experience summer, during which the 2 m air temperature is >22 °C for five consecutive days. The majority of the time, when precipitation intensity is low, the precipitation type is either snowfall or sleet. Therefore, precipitation observations are strongly impacted by wind. Moreover, most rain gauges located in valleys are indicated as points, whereas the precipitation products are grids, indicating an area. In complex terrain, rain gauges in the mountains could get more precipitation than the ones in valleys. Therefore, heavy rain observations have great uncertainty, and it is possible that the precipitation products were correct.
3.7. Evaluation of Extreme Precipitation
Most products overestimated R99 more than the observations did (Figure 8a). Most products performed better in the INN and QAI basins than other basins. CMORPH_RAW, PERSIANN_CCS, and WCR generated a larger value of R99 than that of other products. Most products maintained a similar intensity for Rmax when compared with Rmax of observation (Figure 8b), with the exception of CMORPH_RAW, and PERSIANN_CCS. This illustrates that most products could capture the daily extreme precipitation events, but overestimated their intensity. R5dmax (Figure 8c) had the same pattern as Rmax. In the MEK Basin, R5dmax was greater than in the other basins. The DD in CMORPH_RAW, PERSIANN_CCS, WCR, and MSWEP had lower values than for other products (Figure 8d). In addition, these products underestimated R5dmax in the MEK, SAL, and YAN basins than in other basins.
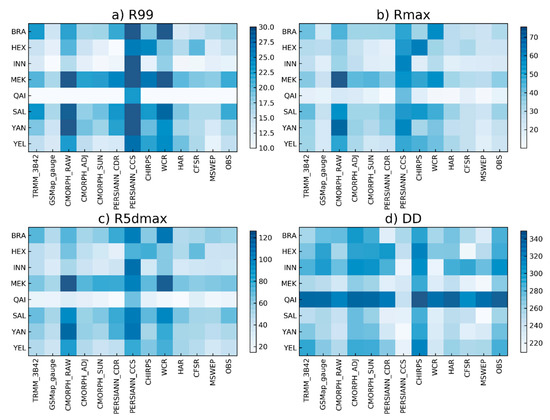
Figure 8.
Statistical metrics of extreme precipitation in eight basins of the Qinghai-Tibet Plateau. The units in subplots (a–d) are mm/d, mm/d, mm/5 d, and days/year, respectively.
In the view of extreme precipitation intensity (including R99, Rmax and R5dmax), observations in BRA, MEK and SAL showed bigger values of extreme precipitation index than one in other basins. In these products, TRMM_3B42, CMORPH_ADJ, CMORPH_SUN, PERSIANN_CDR, and MSWEP could capture the spatial pattern of these extreme precipitation index in all basins. In addition, GSMaP_GAUGE, CHIRPS and CFSR also show insignificant spatial pattern. For CFSR, it shows stronger extreme precipitation intensity in HEX. Moreover, HAR could capture extreme precipitation intensity in SAL and MEK, but fail in BRA.
4. Discussion and Future Work
Western China Reanalysis more severely overestimated precipitation than HAR, especially in mountainous areas (Figure 2 and Figure 3; Table 3). However, the horizontal resolution in the regional reanalysis of HAR and WCR was close to 10 km. The two differences that may cause these errors exist in both datasets. First, the forcing datasets of the HAR and WCR are the NCEP FNL (Final) Operational Global Analysis data and the NCEP2 reanalysis datasets, respectively. The data assimilation technology in FNL was four-dimensional variational data assimilation (4DVar), which was more advanced than three-dimensional variational data assimilation (3DVar) used in NCEP2. Thus, the atmospheric moisture in FNL, which plays an important role in predicting precipitation, was more accurate than NCEP2. Second, the Weather Research and Forecasting Model (WRF) in HAR runs a 36-h simulation, which uses 12 h for initialization and retains the subsequent 24-h simulation. For WCR, this simulation from 1979–2013 was separated into 35 running streams in order to reduce climatic drift. Hence, the precipitation simulation in WCR was mainly affected by the cloud microphysics and cumulus convective schemes in WRF. However, HAR can refresh the initialization by FNL during cyclical data assimilation. For the global reanalysis dataset of CFSR, which has a horizontal resolution of 0.313° (~38 km), this dataset can retain the annual trend with observation in the Qinghai-Tibet Plateau with a little overestimation. In addition, even CFSR reanalysis data had its bias corrected by gridded observation. Therefore, the statistical metrics in CFSR were close to those of SRP (Table 3 and Figure 3). That means global/regional reanalysis can replace the SRP in the specified region. The highest horizontal resolutions of NOAA’s global forecast system and the European Centre for Medium-Range Weather Forecasts’ Integrated Forecasting System are 11 km and 9 km, respectively These horizontal resolutions were quite close to the state-of-the-art horizontal resolution of the Global Precipitation Mission of Integrated Multi-satellite Retrievals. Thus, horizontal resolution will not limit the development of applications used for global/regional reanalysis.
Furthermore, WCR showed that many high values of precipitation were centered in the lake regions of the Qinghai-Tibet Plateau in comparison with the natural orographic spatial pattern of precipitation in HAR (Figure 2). First, HAR uses the Lake Model [73], which was migrated from the Common Land Model 4.5 in WRF while WCR does not. There was a hypothesis that these high precipitation values were caused by higher temperature on the water surface in WCR, which may come from the process of interpolating the nearest ocean’s (warmer Indian Ocean’s) sea surface temperature into the water surface of the lake regions of the Qinghai-Tibet Plateau by WPS (in the WRF preprocess system). Hence, the surface temperature in lake regions was higher than the surface temperature of the surrounding environment. When the atmospheric moisture was high enough, the warmer surface of lake regions in WCR can form more frequent and intense local convective systems, which can cause more local convective precipitation than actually occurred from the surface of lakes in the regions in HAR. However, the lake model in HAR can decrease the intensity of this surface temperature difference between the surface of lake regions and the surrounding environment after the first 12 h of initialization in WRF.
Aside from WCR, TRMM, and CMORPH also had relatively high value points of annual precipitation in the lake regions of the Qinghai-Tibet Plateau (Figure 2). Tian et al. indicated that water surface produce a rainfall-like signature when higher-frequency passive microwave channels are used for scattering-based algorithms tuned to land surfaces [74]. Western China has many lakes, especially in the Qinghai-Tibet Plateau. These will lead to some abnormally large values for precipitation when precipitation is retrieved by passive microwave instruments (e.g., TRMM and CMORPH) when compared with ground gauge observations.
The PERSIANN family is retrieved from the brightness temperature on top of cloud. The lower brightness temperature indicates stronger precipitation intensity. However, the lower cloud (e.g., Cumulus clouds) normally exists in the height of 5~6 km in the Qinghai-Tibet Plateau, as the average height of the Qinghai-Tibet Plateau is more than 4 km. This means the brightness temperature of these lower cloud is quite low. Therefore, IR-retrieved precipitation might overestimate. Generally, IR-retrieved precipitation model is based on a machine-learning algorithm (e.g., Artificial Neural Network, ANN). It strongly depends on train datasets, especially ground-based rain gauges that represents local climatic characteristics. If a region lacks rain gauges observations, the IR-retrieved precipitation could not get good performance. The product with bias correction, such as PERSIANN_CDR, could be better than PERSIANN_CCS, even though it has higher spatiotemporal resolution. In all of the above analyses, MSWEP generally outperformed other SRPs. Because MSWEP dynamically blended precipitation datasets from SRPs, rain gauges, and NWP models with difference weights. MSWEP has obvious advantage when compared with SRP with bias correction. Hence, in the future, MSBP can blend SRP-retrieved data from the third generation of geostationary satellite (e.g., Japanese Himawari-8, Chinese Fengyun-4A, and US Geostationary Operational Environmental Satellite-R), which have a horizontal resolution higher than 2 km. Meanwhile, MSBP can also blend regional NWP models from WRF, ARPS, and COSMO datasets. Thus, the problems related to downscaling and uncertainty can be solved. In China, the China Meteorological Administration blends data from radar-retrieved precipitation, a dense network of ground-based rain gauge observations, and SRP [75], which had a horizontal resolution of 1 km and performed well. In addition, a previous study using WRF assimilated SRP by 4D-Var Data Assimilation significantly improved WRF precipitation estimation over the Huaihe River Basin, China [76]. Therefore, in future, two-way blending or hybrid blending may provide a new method for MSBP.
In this study, there are still some limitations. The relationship between observation and SRPs with bias correction in Figure 9 is summarized from references [36,46,77,78,79,80,81]. All SRPs are bias-corrected by gridded observation. These gridded observations (with the exception of GPCP) are only interpolated by rain gauges from surface rain gauge databases, which include Global Telecommunication System (GTS), Global Historical Climate Network (GHCN) and Global Surface Summary of the Day (GSOD). Therefore, these SRPs shares the same surface rain gauge database for bias correction. The different performances come from difference between the products’ satellite sources and precipitation retrieval algorithms. However, the number of rain gauges in these rain gauge databases and CMA’s database are 46 stations and 143 stations, respectively. The CMA’s database includes those rain gauges (46 stations) used in the SRPs’ bias correction. Thus, it should be cautious that the evaluation in this study is not completely independent, especially CMORPH_SUN. To avoid this evaluation problem, the reference observation could be used the proxy gridded precipitation (e.g., precipitation retrieved from soil moisture [82]), and the evaluation method could be used in the hydrological model (e.g., HBV model [Hydrologiska Byråns Vattenbalansavdelning model] [46]) in future.
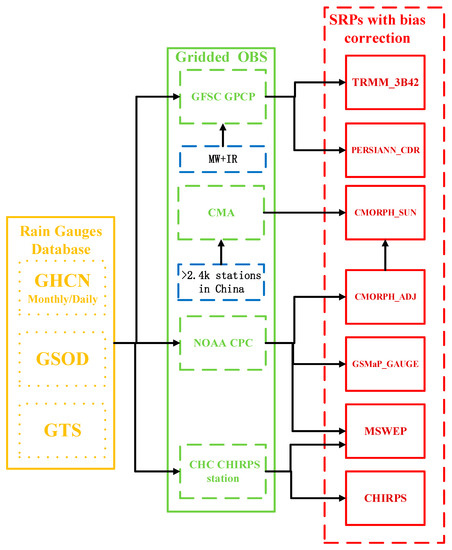
Figure 9.
The relationship between observation and satellite-retrieved precipitations (SRPs) with bias correction. CHC indicates Climate Hazards Group. GFSC indicates the National Aeronautics and Space Administration (NASA) Goddard Space Flight Center.
5. Conclusions
In a complex terrain, such as the Qinghai-Tibet Plateau, knowing which precipitation datasets can be suitably applied in hydrometeorology and understanding the effects of climatic change are distinct challenges. In the present study, we evaluated the daily precipitation estimates from 12 precipitation datasets from global/regional reanalysis, satellite-retrieved precipitation, and multiple sources of blended precipitation in 2003–2010. The main conclusions are as follows.
- For the spatial pattern of climate, MSWEP, GSMaP_GAUGE, TRMM_3B42, CMORPH_SUN, and CHIRPS can be used to represent the spatial pattern of precipitation in arid/semi-arid and humid/semi-humid areas of the Qinghai-Tibet Plateau. Although the horizontal resolution of GSMaP_GAUGE and CHIRPS was more than 0.10°, they fail to reproduce the spatial pattern of orographic precipitation (e.g., in the Kunlun Mountains of the northern Qinghai-Tibet Plateau). Furthermore, the CMORPH family, TRMM_3B42 and WCR have high value regions, which are incorrect values caused by an algorithm from NWP models and a satellite retrieved algorithm.
- Except for CMORPH_RAW and PERSIANN_CCS, most precipitation products can capture the variability of change on an interannual scale. On an interannual scale, the correlation coefficients in MSWEP, GSMaP_GAUGE, and CMORPH_SUN were higher than those of the other products. In addition, the mean errors in TRMM_3B42, GSMaP_GAUGE, CMORPH_ADJ, CMORPH_SUN, and CFSR were close to zero. GSMaP_GAUGE, CMORPH_SUN, and MSWEP had a smaller root mean square error than the other products. In basins of the Qinghai-Tibet Plateau, the correlation coefficients in the Hei River Basin and Inner Tibetan Plateau were relatively low. In the Qaidam River Basin, the mean error had smaller values than in other basins. In addition, in the Salween River Basin, mean error generally had negative values.
- On a seasonal scale, the quantitative precipitation estimate in all precipitation datasets performed poorly in summer and winter. Precipitation datasets generally overestimate light rain and underestimate heavy rain. On a monthly scale, TRMM_3B42, GSMaP_GAUGE, CMORPH_SUN, and MSWEP performed better than the other products. On a daily scale, quantitative precipitation estimates in all precipitation datasets can basically reproduce the pattern of daily probability density function. In arid/semi-arid areas, most products overestimate the probability of light rain (0.1–1.0 mm) and underestimate the probability of moderate and heavy rain (over 10 mm), even including MSWEP, CFSR, and GSMAP_GAUGE. Most extreme precipitation was generally overestimated the extreme indices of R99, Rmax, and R5dmax and underestimated the extreme index of the total number of days with daily precipitation less than 1 mm.
- MSWEP, which employed three sources datasets (global reanalysis precipitation, satellite retrieved precipitation, and ground-based) rain gauge observations, performed better than satellite-retrieved precipitation with gauge bias correction and reanalysis. Furthermore, TRMM_3B42, GSMaP_GAUGE, and CMORPH_SUN, which are blended and have bias correction with ground observations, performed better than single-source precipitation (CMORPH_RAW, PERSIANN_CCS, WCR, and HAR). Therefore, multi-source blended precipitation products will be expected to be the hotspots of global and regional precipitation research in the future.
Author Contributions
Conceptualization, L.B.; methodology, L.B., C.S., and Y.W.; validation, L.B., Y.Y., F.Z., and J.M.; formal analysis, L.B., J.W., S.S., Y.P., and J.G.; writing—original draft preparation, L.B. writing—review and editing, L.B., Y.W., and C.S.; supervision, C.S.; funding acquisition, L.B., F.Z., Y.W., and C.S. All authors have read and agreed to the published version of the manuscript.
Funding
This research was funded by the National Key R&D Program of China (Grant No. 2018YFC1407405 and 2018YFC1506601), Fundamental Research Funds for the Central Universities (WUT: 2019IVA103), and National Natural Science Foundation of China (Grant No. 51709218).
Conflicts of Interest
The authors declare no conflict of interest.
References
- Yan, D.-H.; Han, D.-M.; Wang, G.; Yuan, Y.; Hu, Y.; Fang, H.-Y. The evolution analysis of flood and drought in Huai River Basin of China based on monthly precipitation characteristics. Nat. Hazards 2014, 73, 849–858. [Google Scholar] [CrossRef]
- Yang, N.; Zhang, K.; Hong, Y.; Zhao, Q.; Huang, Q.; Xu, Y.; Xue, X.; Chen, S. Evaluation of the TRMM multisatellite precipitation analysis and its applicability in supporting reservoir operation and water resources management in Hanjiang basin, China. J. Hydrol. 2017, 549, 313–325. [Google Scholar] [CrossRef]
- Vicente-Serrano, S.M.; Beguería, S.; López-Moreno, J.I. A Multiscalar Drought Index Sensitive to Global Warming: The Standardized Precipitation Evapotranspiration Index. J. Clim. 2010, 23, 1696–1718. [Google Scholar] [CrossRef]
- Zhu, Q.; Xuan, W.; Liu, L.; Xu, Y.-P. Evaluation and hydrological application of precipitation estimates derived from PERSIANN-CDR, TRMM 3B42V7, and NCEP-CFSR over humid regions in China. Hydrol. Process. 2016, 30, 3061–3083. [Google Scholar] [CrossRef]
- Tian, Y.; Peters-Lidard, C.D. A global map of uncertainties in satellite-based precipitation measurements. Geophys. Res. Lett. 2010, 37, L24407. [Google Scholar] [CrossRef]
- Zhang, Z.; Jin, Q.; Chen, X.; Xu, C.-Y.; Chen, S.; Moss, E.M.; Huang, Y. Evaluation of TRMM Multisatellite Precipitation Analysis in the Yangtze River Basin with a Typical Monsoon Climate. Adv. Meteorol. 2016, 1–13. [Google Scholar] [CrossRef]
- Liu, X.; Yang, T.; Hsu, K.; Liu, C.; Sorooshian, S. Evaluating the streamflow simulation capability of PERSIANN-CDR daily rainfall products in two river basins on the Tibetan Plateau. Hydrol. Earth Syst. Sci. 2017, 21, 169–181. [Google Scholar] [CrossRef]
- Li, Z.; Yang, D.; Hong, Y. Multi-scale evaluation of high-resolution multi-sensor blended global precipitation products over the Yangtze River. J. Hydrol. 2013, 500, 157–169. [Google Scholar] [CrossRef]
- Yang, Y.; Tang, J.; Xiong, Z.; Dong, X. Evaluation of High-Resolution Gridded Precipitation Data in Arid and Semiarid Regions: Heihe River Basin, Northwest China. J. Hydrometeorol. 2017, 18, 3075–3101. [Google Scholar] [CrossRef]
- Gao, Y.C.; Liu, M.F. Evaluation of high-resolution satellite precipitation products using rain gauge observations over the Tibetan Plateau. Hydrol. Earth Syst. Sci. 2013, 17, 837–849. [Google Scholar] [CrossRef]
- Tong, K.; Su, F.; Yang, D.; Hao, Z. Evaluation of satellite precipitation retrievals and their potential utilities in hydrologic modeling over the Tibetan Plateau. J. Hydrol. 2014, 519, 423–437. [Google Scholar] [CrossRef]
- Ma, Y.; Yang, Y.; Han, Z.; Tang, G.; Maguire, L.; Chu, Z.; Hong, Y. Comprehensive evaluation of Ensemble Multi-Satellite Precipitation Dataset using the Dynamic Bayesian Model Averaging scheme over the Tibetan plateau. J. Hydrol. 2018, 556, 634–644. [Google Scholar] [CrossRef]
- Yang, Y.; Tang, G.; Lei, X.; Hong, Y.; Yang, N. Can Satellite Precipitation Products Estimate Probable Maximum Precipitation: A Comparative Investigation with Gauge Data in the Dadu River Basin. Remote Sens. 2018, 10, 41. [Google Scholar] [CrossRef]
- Alazzy, A.A.; Lü, H.; Chen, R.; Ali, A.B.; Zhu, Y.; Su, J. Evaluation of Satellite Precipitation Products and Their Potential Influence on Hydrological Modeling over the Ganzi River Basin of the Tibetan Plateau. Adv. Meteorol. 2017, 2017, 1–23. [Google Scholar] [CrossRef]
- Yang, Y.; Luo, Y. Evaluating the performance of remote sensing precipitation products CMORPH, PERSIANN, and TMPA, in the arid region of northwest China. Appl. Clim. 2014, 118, 429–445. [Google Scholar] [CrossRef]
- Liu, J.; Duan, Z.; Jiang, J.; Zhu, A.-X. Evaluation of Three Satellite Precipitation Products TRMM 3B42, CMORPH, and PERSIANN over a Subtropical Watershed in China. Adv. Meteorol. 2015, 2015, 1–13. [Google Scholar] [CrossRef]
- Guo, R.; Liu, Y. Evaluation of Satellite Precipitation Products with Rain Gauge Data at Different Scales: Implications for Hydrological Applications. Water 2016, 8, 281. [Google Scholar] [CrossRef]
- Hu, Q.; Yang, D.; Wang, Y.; Yang, H. Accuracy and spatio-temporal variation of high resolution satellite rainfall estimate over the Ganjiang River Basin. Sci. China Technol. Sci. 2013, 56, 853–865. [Google Scholar] [CrossRef]
- Yang, X.; Yong, B.; Hong, Y.; Chen, S.; Zhang, X. Error analysis of multi-satellite precipitation estimates with an independent raingauge observation network over a medium-sized humid basin. Hydrol. Sci. J. 2016, 61, 1–18. [Google Scholar] [CrossRef]
- Wu, Z.; Xu, Z.; Wang, F.; He, H.; Zhou, J.; Wu, X.; Liu, Z. Hydrologic Evaluation of Multi-Source Satellite Precipitation Products for the Upper Huaihe River Basin, China. Remote Sens. 2018, 10, 840. [Google Scholar] [CrossRef]
- Jiang, S.; Liu, S.; Ren, L.; Yong, B.; Zhang, L.; Wang, M.; Lu, Y.; He, Y. Hydrologic Evaluation of Six High Resolution Satellite Precipitation Products in Capturing Extreme Precipitation and Streamflow over a Medium-Sized Basin in China. Water 2018, 10, 25. [Google Scholar] [CrossRef]
- Zhu, Q.; Hsu, K.-l.; Xu, Y.-P.; Yang, T. Evaluation of a new satellite-based precipitation data set for climate studies in the Xiang River basin, southern China. Int. J. Clim. 2017, 37, 4561–4575. [Google Scholar] [CrossRef]
- Qi, W.; Zhang, C.; Fu, G.; Sweetapple, C.; Zhou, H. Evaluation of global fine-resolution precipitation products and their uncertainty quantification in ensemble discharge simulations. Hydrol. Earth Syst. Sci. 2016, 20, 903–920. [Google Scholar] [CrossRef]
- Zhu, H.; Li, Y.; Huang, Y.; Li, Y.; Hou, C.; Shi, X. Evaluation and hydrological application of satellite-based precipitation datasets in driving hydrological models over the Huifa river basin in Northeast China. Atmos. Res. 2018, 207, 28–41. [Google Scholar] [CrossRef]
- Zeng, Q.; Wang, Y.; Chen, L.; Wang, Z.; Zhu, H.; Li, B. Inter-Comparison and Evaluation of Remote Sensing Precipitation Products over China from 2005 to 2013. Remote Sens. 2018, 10, 168. [Google Scholar] [CrossRef]
- Deng, X.; Nie, S.; Deng, W.; Cao, W. Statistical evaluation of the performance of gridded monthly precipitation products from reanalysis data, satellite estimates, and merged analyses over China. Appl. Clim. 2018, 132, 621–637. [Google Scholar] [CrossRef]
- Huang, A.; Zhao, Y.; Zhou, Y.; Yang, B.; Zhang, L.; Dong, X.; Fang, D.; Wu, Y. Evaluation of multisatellite precipitation products by use of ground-based data over China. J. Geophys. Res. Atmos. 2016, 121, 10654–10675. [Google Scholar] [CrossRef]
- Li, C.; Tang, G.; Hong, Y. Cross-evaluation of ground-based, multi-satellite and reanalysis precipitation products: Applicability of the Triple Collocation method across Mainland China. J. Hydrol. 2018, 562, 71–83. [Google Scholar] [CrossRef]
- Yatagai, A.; Kamiguchi, K.; Arakawa, O.; Hamada, A.; Yasutomi, N.; Kitoh, A. APHRODITE: Constructing a Long-Term Daily Gridded Precipitation Dataset for Asia Based on a Dense Network of Rain Gauges. Bull. Am. Meteor. Soc. 2012, 93, 1401–1415. [Google Scholar] [CrossRef]
- Wu, J.; Gao, X.-J. A gridded daily observation dataset over China region and comparison with the other datasets (in Chinese). Chin. J. Geophys. 2013, 56, 1102–1111. [Google Scholar] [CrossRef]
- Chen, Y.; Yang, K.; He, J.; Qin, J.; Shi, J.; Du, J.; He, Q. Improving land surface temperature modeling for dry land of China. J. Geophys. Res. 2011, 116, 251. [Google Scholar] [CrossRef]
- Rodell, M.; Houser, P.R.; Jambor, U.; Gottschalck, J.; Mitchell, K.; Meng, C.-J.; Arsenault, K.; Cosgrove, B.; Radakovich, J.; Bosilovich, M.; et al. The Global Land Data Assimilation System. Bull. Am. Meteor. Soc. 2004, 85, 381–394. [Google Scholar] [CrossRef]
- Nie, S.; Wu, T.; Luo, Y.; Deng, X.; Shi, X.; Wang, Z.; Liu, X.; Huang, J. A strategy for merging objective estimates of global daily precipitation from gauge observations, satellite estimates, and numerical predictions. Adv. Atmos. Sci. 2016, 33, 889–904. [Google Scholar] [CrossRef]
- Saha, S.; Moorthi, S.; Pan, H.-L.; Wu, X.; Wang, J.; Nadiga, S.; Tripp, P.; Kistler, R.; Woollen, J.; Behringer, D.; et al. The NCEP Climate Forecast System Reanalysis. Bull. Am. Meteorol. Soc. 2010, 91, 1015–1058. [Google Scholar] [CrossRef]
- Ushio, T.; SASASHIGE, K.; Kubota, T.; Shige, S.; Okamoto, K.I.; Aonashi, K.; INOUE, T.; Takahashi, N.; Iguchi, T.; Kachi, M.; et al. A Kalman Filter Approach to the Global Satellite Mapping of Precipitation (GSMaP) from Combined Passive Microwave and Infrared Radiometric Data. JMSJ 2009, 87A, 137–151. [Google Scholar] [CrossRef]
- Huffman, G.J.; Bolvin, D.T.; Nelkin, E.J.; Wolff, D.B.; Adler, R.F.; Gu, G.; Hong, Y.; Bowman, K.P.; Stocker, E.F. The TRMM Multisatellite Precipitation Analysis (TMPA): Quasi-Global, Multiyear, Combined-Sensor Precipitation Estimates at Fine Scales. J. Hydrometeorol. 2007, 8, 38–55. [Google Scholar] [CrossRef]
- Joyce, R.J.; Janowiak, J.E.; Arkin, P.A.; Xie, P. CMORPH: A Method that Produces Global Precipitation Estimates from Passive Microwave and Infrared Data at High Spatial and Temporal Resolution. J. Hydrometeorol. 2004, 5, 487–503. [Google Scholar] [CrossRef]
- Hsu, K.-l.; Gao, X.; Sorooshian, S.; Gupta, H.V. Precipitation Estimation from Remotely Sensed Information Using Artificial Neural Networks. J. Appl. Meteor. 1997, 36, 1176–1190. [Google Scholar]
- Mega, T.; Ushio, T.; Takahiro, M.; Kubota, T.; Kachi, M.; Oki, R. Gauge-Adjusted Global Satellite Mapping of Precipitation. IEEE Trans. Geosci. Remote Sens. 2019, 57, 1928–1935. [Google Scholar] [CrossRef]
- Xie, P. A 15-Year High—Resolution Gauge—Satellite Merged Analysis of Precipitation: A 15-Year High - Resolution Gauge—Satellite Merged Analysis of Precipitation. In Proceedings of the 93rd American Meteorological Society Annual Meeting, Austin, TX, USA, 5–10 January 2013. [Google Scholar]
- National Meteorological Science Data Center—Online Data. Available online: http://data.cma.cn/data/online.html?t=6 (accessed on 4 August 2018).
- Xu, B.; Xie, P.; Xu, M.; Jiang, L.; Shi, C.; You, R. A Validation of Passive Microwave Rain-Rate Retrievals from the Chinese FengYun-3B Satellite. J. Hydrometeor. 2015, 16, 1886–1905. [Google Scholar] [CrossRef]
- Kanamitsu, M.; Ebisuzaki, W.; Woollen, J.; Yang, S.-K.; Hnilo, J.J.; Fiorino, M.; Potter, G.L. NCEP–DOE AMIP-II Reanalysis (R-2). Bull. Am. Meteorol. Soc. 2002, 83, 1631–1644. [Google Scholar] [CrossRef]
- Meehl, G.A.; Goddard, L.; Murphy, J.; Stouffer, R.J.; Boer, G.; Danabasoglu, G.; Dixon, K.; Giorgetta, M.A.; Greene, A.M.; Hawkins, E.; et al. Decadal Prediction: Can it be skillful? Bull. Am. Meteorol. Soc. 2009, 90, 1467–1486. [Google Scholar] [CrossRef]
- Hou, A.Y.; Kakar, R.K.; Neeck, S.; Azarbarzin, A.A.; Kummerow, C.D.; Kojima, M.; Oki, R.; Nakamura, K.; Iguchi, T. The Global Precipitation Measurement Mission. Bull. Am. Meteorol. Soc. 2014, 95, 701–722. [Google Scholar] [CrossRef]
- Beck, H.E.; van Dijk, A.I.J.M.; Levizzani, V.; Schellekens, J.; Miralles, D.G.; Martens, B.; De Roo, A. MSWEP: 3-hourly 0.25 global gridded precipitation (1979-2015) by merging gauge, satellite, and reanalysis data. Hydrol. Earth Syst. Sci. 2017, 21, 589–615. [Google Scholar] [CrossRef]
- Maussion, F.; Scherer, D.; Mölg, T.; Collier, E.; Curio, J.; Finkelnburg, R. Precipitation Seasonality and Variability over the Tibetan Plateau as Resolved by the High Asia Reanalysis. J. Clim. 2014, 27, 1910–1927. [Google Scholar] [CrossRef]
- NWP >> GRAPES_MESO >> Regional products >> Eastern China >> 3h accumulated precipitation + 10 m wind field. Available online: http://www.nmc.cn/publish/area/he/3h10mw.html (accessed on 3 August 2018).
- COSMO-1—High-Resolution Forecasts for the Alpine Region-MeteoSwiss. Available online: https://www.meteoswiss.admin.ch/home/measurement-and-forecasting-systems/warning-and-forecasting-systems/cosmo-forecasting-system/cosmo-1-high-resolution-forecasts-for-the-alpine-region.html (accessed on 3 August 2018).
- Wang, R.; Chen, J.; Wang, X. Comparison of IMERG Level-3 and TMPA 3B42V7 in Estimating Typhoon-Related Heavy Rain. Water 2017, 9, 276. [Google Scholar] [CrossRef]
- Cai, Y.; Jin, C.; Wang, A.; Guan, D.; Wu, J.; Yuan, F.; Xu, L. Spatio-temporal analysis of the accuracy of tropical multisatellite precipitation analysis 3B42 precipitation data in mid-high latitudes of China. PLoS ONE 2015, 10, e0120026. [Google Scholar] [CrossRef]
- Monaghan, A.J.; Clark, M.P.; Barlage, M.P.; Newman, A.J.; Xue, L.; Arnold, J.R.; Rasmussen, R.M. High-Resolution Historical Climate Simulations over Alaska. J. Appl. Meteorol. Climatol. 2018, 57, 709–731. [Google Scholar] [CrossRef]
- Kim, T.; Jin, E.K. Impact of an interactive ocean on numerical weather prediction: A case of a local heavy snowfall event in eastern Korea. J. Geophys. Res. Atmos. 2016, 121, 8243–8253. [Google Scholar] [CrossRef]
- Di, Z.; Duan, Q.; Gong, W.; Wang, C.; Gan, Y.; Quan, J.; Li, J.; Miao, C.; Ye, A.; Tong, C. Assessing WRF model parameter sensitivity: A case study with 5 day summer precipitation forecasting in the Greater Beijing Area. Geophys. Res. Lett. 2015, 42, 579–587. [Google Scholar] [CrossRef]
- Alijanian, M.; Rakhshandehroo, G.R.; Mishra, A.K.; Dehghani, M. Evaluation of satellite rainfall climatology using CMORPH, PERSIANN-CDR, PERSIANN, TRMM, MSWEP over Iran. Int. J. Clim. 2017, 37, 4896–4914. [Google Scholar] [CrossRef]
- Sahlu, D.; Moges, S.A.; Nikolopoulos, E.I.; Anagnostou, E.N.; Hailu, D. Evaluation of High-Resolution Multisatellite and Reanalysis Rainfall Products over East Africa. Adv. Meteorol. 2017, 2017, 1–14. [Google Scholar] [CrossRef]
- Nair, A.; Indu, J. Performance Assessment of Multi-Source Weighted-Ensemble Precipitation (MSWEP) Product over India. Climate 2017, 5, 2. [Google Scholar] [CrossRef]
- Chen, S.; Liu, H.; You, Y.; Mullens, E.; Hu, J.; Yuan, Y.; Huang, M.; He, L.; Luo, Y.; Zeng, X.; et al. Evaluation of high-resolution precipitation estimates from satellites during July 2012 Beijing flood event using dense rain gauge observations. PLoS ONE 2014, 9, e89681. [Google Scholar] [CrossRef] [PubMed]
- Jiang, S.; Ren, L.; Yong, B.; Hong, Y.; Yang, X.; Yuan, F. Evaluation of latest TMPA and CMORPH precipitation products with independent rain gauge observation networks over high-latitude and low-latitude basins in China. Chin. Geogr. Sci. 2016, 26, 439–455. [Google Scholar] [CrossRef]
- Tong, K.; Su, F.; Yang, D.; Zhang, L.; Hao, Z. Tibetan Plateau precipitation as depicted by gauge observations, reanalyses and satellite retrievals. Int. J. Clim. 2014, 34, 265–285. [Google Scholar] [CrossRef]
- Global 30 Arc-Second Elevation (GTOPO30) | The Long Term Archive. Available online: https://lta.cr.usgs.gov/GTOPO30 (accessed on 4 August 2018).
- TRMM Data Downloads | Precipitation Measurement Missions. Available online: https://pmm.nasa.gov/data-access/downloads/TRMM (accessed on 7 August 2018).
- JAXA Global Rainfall Watch (GSMaP). Available online: http://sharaku.eorc.jaxa.jp/GSMaP/index.htm (accessed on 7 August 2018).
- CPC: Monitoring and Data-Global Precipitation Analyses. Available online: http://www.cpc.ncep.noaa.gov/products/janowiak/cmorph_description.html (accessed on 7 August 2018).
- Data Portal. Available online: http://chrsdata.eng.uci.edu/ (accessed on 7 August 2018).
- CHG-Data-CHIRPS. Available online: http://chg.geog.ucsb.edu/data/chirps/ (accessed on 7 August 2018).
- Cold and Arid Regional Science Data Centre-Products-The air temperature and precipitation datasets in northern China regions based on the WRF model in 1979–2013. Available online: http://westdc.westgis.ac.cn/data/40895e03-f919-4721-893f-a6fee9feab81 (accessed on 7 August 2018).
- Fachgebiet Klimatologie-Institut für Ökologie-Technische Universität Berlin. Available online: https://www.klima.tu-berlin.de/index.php?show=forschung_asien_tibet_har&lan=en (accessed on 7 August 2018).
- Meng, J.; Yang, R.; Wei, H.; Ek, M.; Gayno, G.; Xie, P.; Mitchell, K. The Land Surface Analysis in the NCEP Climate Forecast System Reanalysis. J. Hydrometeorol. 2012, 13, 1621–1630. [Google Scholar] [CrossRef]
- gloh2o-Toward Locally Relevant Global Hydrological Simulations. Available online: http://gloh2o.org/ (accessed on 7 August 2018).
- Chen, M.; Shi, W.; Xie, P.; Silva, V.B.S.; Kousky, V.E.; Wayne Higgins, R.; Janowiak, J.E. Assessing objective techniques for gauge-based analyses of global daily precipitation. J. Geophys. Res. 2008, 113, 1147. [Google Scholar] [CrossRef]
- Xie, P.; Arkin, P.A. Global Precipitation: A 17-Year Monthly Analysis Based on Gauge Observations, Satellite Estimates, and Numerical Model Outputs. Bull. Am. Meteorol. Soc. 1997, 78, 2539–2558. [Google Scholar] [CrossRef]
- Gu, H.; Jin, J.; Wu, Y.; Ek, M.B.; Subin, Z.M. Calibration and validation of lake surface temperature simulations with the coupled WRF-lake model. Clim. Chang. 2015, 129, 471–483. [Google Scholar] [CrossRef]
- Tian, Y.; Peters-Lidard, C.D. Systematic anomalies over inland water bodies in satellite-based precipitation estimates. Geophys. Res. Lett. 2007, 34, 335. [Google Scholar] [CrossRef]
- Shen, Y.; Hong, Z.; Pan, Y.; Yu, J.; Maguire, L. China’s 1 km Merged Gauge, Radar and Satellite Experimental Precipitation Dataset. Remote Sens. 2018, 10, 264. [Google Scholar] [CrossRef]
- Yi, L.; Zhang, W.; Wang, K. Evaluation of Heavy Precipitation Simulated by the WRF Model Using 4D-Var Data Assimilation with TRMM 3B42 and GPM IMERG over the Huaihe River Basin, China. Remote Sens. 2018, 10, 646. [Google Scholar] [CrossRef]
- Bui, H.T.; Ishidaira, H.; Shaowei, N. Evaluation of the use of global satellite–gauge and satellite-only precipitation products in stream flow simulations. Appl. Water Sci. 2019, 9, 617. [Google Scholar] [CrossRef]
- Huffman, G.J.; Adler, R.F.; Arkin, P.; Chang, A.; Ferraro, R.; Gruber, A.; Janowiak, J.; McNab, A.; Rudolf, B.; Schneider, U. The Global Precipitation Climatology Project (GPCP) Combined Precipitation Dataset. Bull. Am. Meteorol. Soc. 1997, 78, 5–20. [Google Scholar] [CrossRef]
- Ashouri, H.; Hsu, K.-l.; Sorooshian, S.; Braithwaite, D.K.; Knapp, K.R.; Cecil, L.D.; Nelson, B.R.; Prat, O.P. PERSIANN-CDR: Daily Precipitation Climate Data Record from Multisatellite Observations for Hydrological and Climate Studies. Bull. Am. Meteorol. Soc. 2015, 96, 69–83. [Google Scholar] [CrossRef]
- Funk, C.; Peterson, P.; Landsfeld, M.; Pedreros, D.; Verdin, J.; Shukla, S.; Husak, G.; Rowland, J.; Harrison, L.; Hoell, A.; et al. The climate hazards infrared precipitation with stations—A new environmental record for monitoring extremes. Sci. Data 2015, 2, 150066. [Google Scholar] [CrossRef]
- Xie, P.; Joyce, R.; Wu, S.; Yoo, S.-H.; Yarosh, Y.; Sun, F.; Lin, R. Reprocessed, Bias-Corrected CMORPH Global High-Resolution Precipitation Estimates from 1998. J. Hydrometeorol. 2017, 18, 1617–1641. [Google Scholar] [CrossRef]
- Brocca, L.; Ciabatta, L.; Massari, C.; Moramarco, T.; Hahn, S.; Hasenauer, S.; Kidd, R.; Dorigo, W.; Wagner, W.; Levizzani, V. Soil as a natural rain gauge: Estimating global rainfall from satellite soil moisture data. J. Geophys. Res. Atmos. 2014, 119, 5128–5141. [Google Scholar] [CrossRef]
© 2020 by the authors. Licensee MDPI, Basel, Switzerland. This article is an open access article distributed under the terms and conditions of the Creative Commons Attribution (CC BY) license (http://creativecommons.org/licenses/by/4.0/).