Article

Reevaluating Mare Moscoviense And Its Vicinity Using Chang’e-2 Microwave Sounder Data

1
College of Geoexploration Science and Technology, Jilin University, Changchun 130026, China
2
State Key Laboratory of Remote Sensing Science, Institute of Remote Sensing and Digital Earth, Chinese Academy of Sciences, Beijing 100101, China
3
State Key Laboratory of Lunar and Planetary Sciences, Macau University of Science and Technology, Macau, China
4
Key Laboratory of Lunar and Deep-space Exploration, National Astronomical Observatories, Chinese Academy of Sciences, Beijing 100101, China
*
Author to whom correspondence should be addressed.
Remote Sens. 2020, 12(3), 535; https://doi.org/10.3390/rs12030535
Submission received: 5 December 2019 / Revised: 4 February 2020 / Accepted: 5 February 2020 / Published: 6 February 2020
(This article belongs to the Special Issue Lunar Remote Sensing and Applications)

Abstract

:
Mare Moscoviense (148°E, 27°N) is one of the few large maria on the lunar farside, with the thinnest crust and a positive gravity anomaly. In this paper, the Chang’E-2 Microwave Sounder (CELMS) data was employed to study the microwave thermal emission features of mare basalts in Moscoviense Basin. The time angle and linear interpolation method are used to generate the brightness temperature (TB) maps at noon and night, as well as the TB difference (dTB) map. The obtained important results are as follows. (1) A new geologic map is generated with the TB and dTB maps using the maximum likelihood method, which gives a new expression about the basaltic units in Mare Moscoviense compared to the optical results; (2) the substrate temperature of Moscoviense Basin is likely warmer than what we know; (3) unit Ihtm (a Late (?) Imbrian, mid- to high-Ti, high-Fe basalt) is re-understood as two independent volcanic features with their own fissures; (4) the dTB maps firstly indicate that the depth lunar regolith is homogeneous in the highlands surrounding Mare Moscoviense, at least in the microwave domain, and secondly that there exists a special material bringing about the low dTB anomaly in the shallow layer of the east highlands. The results will be of great significance to better understand the basaltic volcanism of the Moon.

1. Introduction

Moscoviense Basin, centered at (148.12°E, 27.28°N), is a multi-ringed impact basin on the lunar farside located within the Feldspathic Highland Terrain (Figure 1a). It hosts abundant mare deposits, which cover an area of 35,000 km2 within the 420 km diameter basin (Figure 1b) [1,2,3,4]. It was reported that Mare Moscoviense has some of the thinnest crust on the entire Moon and a large positive gravity anomaly for a basin in this size [5,6,7]. Therefore, observations and studies of the lunar regolith in Moscoviense Basin with the passive microwave data will be of great significance to improve understanding the basaltic volcanism on the lunar farside.
Up to now, five different volcanic units across the Basin were recognized, which were mainly based on spectral properties and composition, namely, high-Ti basalts, low-Ti basalts, ancient mare units, cryptomare, and highland basin soils [8,9]. Using Clementine data, Craddock et al. [10] revealed the unique, complex nature of the geology in Mare Moscoviense and found the evidence for large-scale pyroclastic material on the northern lunar farside through the analysis of compositions and the ages of basalt units. Mainly dependent on the iron and titanium abundances (FTA) (Figure 1c), Mare Moscoviense is divided into four broad units, namely: Im (an Early(?) Imbrian, very low-Ti, low-Fe basalt), Iltm (an Imbrian-age, low-Ti, mare basalt), Ikm (an Imbrian low-Ti basalt that partially fills the crater Komarov), and Ihtm (a Late(?) Imbrian, mid- to high-Ti, high-Fe basalt) by Kramer et al. [9] or named Ehtm (Eratosthenian mid to high-Ti, high-Fe basalt) by Morota et al. [11] (Figure 1d). Through analysis of the previously mapped mare units using the Chandrayaan-1 Moon Mineralogy Mapper (M3) data, Thaisen et al. suggested that the oldest mare unit Im was likely the remnant of the impact melt sheet, which was important to explore the geologic context of initial lunar crustal development and modification [12]. Pieters et al. found that there were several small exposures of three separate but distinctive rock types along the innermost Moscoviense Basin ring using M3 data and detected olivine, orthopyroxene, and Mg-rich spinel along the southwest sector of the peak-ring [13]. Bhatt et al. re-classified the previously mapped unit Iltm using Chandrayaan-1 visible-near infrared (VIS-NIR) data and named the northern part as unit Ivltm (Imbrian very low Ti and very low Fe) because of its lower titanium and the absolute model age [14]. The different understanding of the basaltic units also presents the difficulty in studying the basaltic volcanism by only using the spectral data.
This is mainly because the penetration depth of the used spectral data is rather low, only several microns below the lunar regolith [15,16,17,18]. In such depth, the regolith can easily be affected by the space weathering and the impact ejecta from nearby, or even far away regions [14,15]. The impact events from Titov crater (150.28°E, 28.55°N) within the Basin floor and abundant craters outside have clearly altered the surface compositions and topography, which is inevitable to affect the understanding of the basaltic units of Mare Moscoviense. How to mitigate such disadvantages and to better explore the regolith thermophysical features in situ is a critical problem in current lunar studies.
It is known that the observations in the microwave domain can eliminate well the aforementioned disadvantages [15,16,17,18]. For the first time, the Microwave Sounder (CELMS) onboard Chang’E-1/2 (CE-1/2) missions was used to measure the thermal emission of the lunar regolith in microwave domain. For the absence of the water on the Moon, the signal in microwave range can penetrate the regolith up to 10 to 20 times the wavelength [15,16]. The wavelength of the microwave used by the CELMS instrument is about 10 cm at 3.0 GHz, 3.85 cm at 7.8 GHz, 1.55 cm at 19.35 GHz, and 0.81 cm at 37 GHz. Correspondingly, the penetration is about 1 m–2 m at 3.0 GHz, 38.5 cm to 75 cm at 7.8 GHz, 15.5 cm to 31 cm at 19.35 GHz, and 8.1 cm to 16.2 cm at 37 GHz, which is decided by the FTA of the lunar regolith [15,16,17,18]. Moreover, the CELMS data has been proved to be sensitive to the substrate compositions and temperature [16,17,18,20,21]. Therefore, the CELMS data provides a potential chance to better understand the basaltic units in Mare Moscoviense. In this paper, the CELMS data from CE-2 satellite is used to evaluate the regolith thermophysical features of the mare basalts in Mare Moscoviense. In Section 2, the brightness temperature (TB) and its influential factors are numerically studied with the radiative transfer simulation. The CELMS data processing is presented in Section 3. Section 4 briefly presents the TB features of basaltic units at noon and at midnight, as well as the corresponding absorption features. Section 5 gives interpretations of the special findings in Moscoviense Basin indicated by the CELMS data, and Section 6 presents the conclusions.

2. Brightness Temperature of the Lunar Regolith

The TB of the Moon and its characteristics were well investigated theoretically by a number of authors [22,23]. The orbital TB measurements at different frequencies were proposed since the 1980s [24], with the expectation that they could lead to the knowledge of global lunar heat flow and average regolith thickness. This thermal information could provide a reliable estimation of substrate thermophysical features which are less contaminated by the ejecta in the uppermost layer [20,25,26].
To better understand the findings with the TB and the TB difference (dTB) derived from the CE-2 CELMS data, the radiative transfer theory is used to model the thermal emission from the regolith. A commonly used regolith model is a two-layer model, which only takes into account the regolith and rock layers [20,24]. TB of the lunar regolith has two components: TB1, representing the radiation from the regolith layer, and TB2, representing the radiation from the rock layer. TB1 also comprises upwelling, T1up, and downwelling, T1dn, radiations. The expression is expressed as follows:
T B = T B 1 + T B 2 = T 1 up + T 1 dn + T 2 up .
here,
d T 1 up = 1 r p 1 1 L k a 1 ( z ) T ( z ) sec θ 1 e 0 z k a 1 ( z ) sec θ 1 d z d z ,
d T 1 dn = ( 1 r p 1 ) r p 2 1 L k a 1 ( z ) T ( z ) sec θ 1 e ( z d k a 1 ( z ) sec θ 1 d z + 0 d k a 1 ( z ) sec θ 1 d z ) d z ,
d T 2 up = ( 1 r p 1 ) ( 1 r p 2 ) 1 L k a 2 ( z ) T ( z ) sec θ 2 e d z k a 2 ( z ) sec θ 2 d z d z e 0 d k a 1 ( z ) sec θ 1 d z
where d is the regolith layer thickness, θ1 and θ2 are the incidence angles of the regolith and the rock, respectively, p = h or v, which corresponds to the horizontal and vertical polarizations, ka1 and ka2 are the absorption coefficients in the lunar regolith and rock layers, respectively, T(z) is the temperature profile, rp1 and rp2 represent the effective reflectivity values of the free space-regolith and regolith-rock interfaces, respectively, and 1/(1−L) is the multi-reflection coefficient.
The dielectric constant is a decisive factor for the parameters including rp1, rp2, ka1, and ka2., which was obtained by Heiken et al. through assessing the relationship between the real part of the dielectric constant ε’, the loss tangent tanδ and the FTA value S (wt.%), based on the experimental study [27]. The relationship is expressed in the following:
{ ε = 1.919 ρ , tan δ = 10 0.038 S + 0.312 ρ 3.260 ,
where ρ is the density of the lunar regolith.
Then, the relationship between TB and the thermophysical parameters of the lunar regolith can be constructed by integrating Equations (1) to (3) over the total thickness d.
The observation angle of the CELMS instrument is 0°, so that the polarization effect can be eliminated from the simulation. Moreover, Meng et al. proposed that the regolith thickness d plays a weak role on the TB [28]. Thus, the regolith is assumed to be a 6-m-thick layer with a smooth surface. The temperature profile is calculated with the thermal conductivity model and the outmost depth temperature is assumed to be 252 K [23] as a constraint to solve the model. The hyperbolic model is used as the density profile ρ. The dielectric constant of the substrate rock is assumed to be 6.15 + i0.155 (dielectric constant of sample No.1555 from Apollo 15 mission). Meanwhile, the lunar surface temperature changes greatly with time of a day and the latitude position. Supposing the surface temperatures of 390, 300 (typical daytime temperature), and 200, 100 K (typical nighttime temperature), the change of TB with FTA for the different surface temperatures can be simulated with Equations (1) to (3) (Figure 2).
Figure 2 postulates a good description of the TB performances over the lunar surface as the following three aspects.
Firstly, the daytime TB is higher than the nighttime TB. Moreover, the daytime TB at high frequency is higher than that at low frequency, while the nighttime TB at a high frequency is lower than that at a low frequency. This conclusion is fundamentally important to understand the distribution of the TB over the lunar surface.
Secondly, with the FTA increase from 1 wt.% to 41 wt.%, the noon TB monotonously increases about 90 K at 37 GHz and about 30 K at 3.0 GHz, while the midnight TB monotonously decreases about 80 K at 37 GHz and about 27 K at 3.0 GHz. Thus, the TB in the region with high FTA should be higher than that with low FTA at noon, but it should be lower than that with low FTA at night. This conclusion is important to understand the high TB anomaly of the Basin floor.
Thirdly, the dTB, defined as the difference of the same-channel TB from noontime to midnight, has been proved to be directly related to the regolith thermophysical features within the corresponding microwave penetration depth. In theory, the dTB is similar to the TB change caused by variation of physical temperature. Interestingly, the dTB is up to about 320 K at 37 GHz and about 100 K at 3.0 GHz (40 wt.% FTA), which is considerably higher than the TB changes only brought by the FTA at daytime or nighttime. Even if the FTA is about 1 wt.%, the dTB is still up to 70 K at 37 GHz and 9 K at 3.0 GHz. Therefore, the dTB is more sensitive to the FTA compared to the other regolith thermophysical parameters. This conclusion is important to understand the basaltic units identified by the CELMS data.
Moreover, besides the aforementioned regolith thermophysical parameters, the particle size of the regolith is also an essential parameter to affect the propagation of the microwave [22,23,24]. However, for the mean particle size is only about 77 µm, the wavelength of the microwave used by the CELMS instrument is far longer than the particle size. Additionally, when studying the TB performances in highlands with even FTA distribution, Meng et al. proposed that the particle size of the lunar regolith has a little effect on TB [29]. Thus, the effect of the regolith particle size is neglected in this study.

3. Methods and Data Processing

The study area includes the whole Mare Moscoviense and the nearby highlands.

3.1. CELMS Data

CE-2 satellite is the second Chinese lunar satellite and was successfully launched on 1 October 2010. CE-2 has carried seven payloads, one of which is the CELMS instrument, aiming to acquire brightness temperature (TB) data of the Moon both at noon and at night.
The CELMS instrument operated at 3.0 GHz, 7.8 GHz, 19.35 GHz, and 37 GHz, and the corresponding bandwidths are over 100 MHz, 200 MHz, 500 MHz, and 500 MHz, respectively. Integration time of CELMS is 200 ms [21,30]. The observation angle is 0° and the temperature sensitivity is better than 0.5 K. The original spatial resolution is about 1° (about 30 km at the lunar equator) along the latitude, which is identical for the four channels. All data used was in 2C-level after system calibration and geometric correction, and it follows the format of Planetary Data System. As a single file, the 2C-level data contains a header and a table of measured data, which present the observation time, four-channel brightness temperatures, solar incidence and azimuth angles, selenographic latitude and longitude, orbit altitude, and data quality state. The CELMS data is available on request from http://moon.bao.ac.cn/searchOrder_pdsData.search.
A detailed description of the CELMS instrument and data was given by Wang et al. [26], Cai and Lan [30], and Zhu et al. [21].

3.2. TB Maps Generation

From October of 2010 to May of 2011, the CELMS operated for near 5000 h cumulatively, and a total of 2394 tracks of swath CELMS data were collected. The observed data are enough to cover the Moon at least eight times.
In this paper, the study area is given as 18°N to 35°N in latitude and 135°E to 157°E in longitude, which includes the whole Mare Moscoviense and the nearby highlands. According to the range, the number of the selected original CELMS data is up to 29,454 points.
The CELMS data processing procedure is similar to that of the processing used in Mare Imbrium and Apollo Basin [17,18]. Firstly, the time angle, defined as the longitude difference between the observation point and the subsolar point, is used to attribute the selected data into 24 time spans. For the limitation of the observation time of the CE-2 satellite, only in the time spans from 13 to 14 o’clock and from 0 to 1 o’clock, the numbers of the CELMS data are present in enough quantity to cover the whole study area. Thereafter, the bilinear interpolation method is used to generate the TB maps with a spatial resolution of 0.25° × 0.25°, about 7 km × 7 km in this region. Figure 3 is the generated TB map in the time spans from 13 to 14 o’clock, which largely represents the microwave thermal emission (MTE) features of the lunar regolith at noontime. Figure 4 is the TB map in the time spans from 0 to 1 o’clock, which represents the MTE features of the lunar regolith at midnight. The surface temperature at noontime is considerably higher, about 370 K, than that at midnight, about 71 K [27,31]. These time spans represent the two extreme phases of the MTE, which are appropriate to study the regolith thermophysical features of the basaltic units [17,18,32].

3.3. Image Analysis

The CELMS was the first orbital instrument to measure the MTE of the lunar regolith [33], which makes it hard to evaluate the spatial patterns of the generated TB maps. Therefore, the geologic map proposed by Kramer et al. [9] is vectorized and overlain on the TB maps to analyze the spatial patterns of TB maps.
Figure 3 and Figure 4 show, largely, a decent agreement between the geologic units and the TB distributions. Especially in unit Ihtm in the eastern part of Mare Moscoviense, there exists an excellent coincidence between the unit boundary and the highest TB at noon. Jin et al. [25], Wang et al. [26], Fang and Fa [16], and Meng et al. [20,34] all suggested that the region with higher FTA will have a relatively higher TB at noon. Thus, the strong correlation between the high TB at noon and high FTA in unit Ihtm directly indicates the rationality of the generated TB maps.
Until recently, the TB maps of the whole Moon were available by Wang et al. [26], Chan et al. [35], and Zheng et al. [36] using CE-1 CELMS data and Cai and Lan [30] and Zhu et al. [21] using CE-2 CELMS data. Our TB maps agree well with the previous results, especially in Basin floor, which shows a relatively higher TB than the nearby highlands both at noontime and midnight. This again implies the rationality of the generated TB maps. In addition, our TB maps firstly present a detailed view of the basaltic units in Mare Moscoviense compared to the previous results on a global scale.
However, there occur several belts with abnormally low TB values in Figure 4c, indicating the problem of the data quality in this channel. Despite this setback, the TB beyond the anomaly belts presents a good correlation with the TB in other three channels. Therefore, the 19.35 GHz TB at noon is only used as a reference in this study.
Theoretically, the surface slope also plays a significant role on the TB [18,20,21,35,36,37], which may change the surface temperature and then indirectly alter the thermal emission of the lunar regolith. Correspondingly, the weakened TB in the northern part of the Basin wall is just located in the slope opposite to the solar illumination as shown in green line in Figure 5, while the TB in the southern part of the Basin rim is clearly enhanced. To better understand the influence of the surface topography, the elevation map from Lunar Reconnaissance Orbiter (LRO) lunar orbiter laser altimeter (LOLA) data is also introduced (Figure 6).
However, Figure 5 indicates that, though the change in the elevation is about 10 km in Moscoviense Basin, regions seldom show the topography feature in the TB maps. Even in the surrounding mountains and the considerably large craters such as Titov and Komarov, no special TB distributions can be attributed to the slope. Moreover, in the following dTB maps as shown in Figure 6, no surface topography is reflected. Therefore, the TB distributions are slightly affected by the surface topography, which is also neglected in the following discussion.
Furthermore, the TB distributions show a good corresponding with the basaltic units with high FTA, indicating potential geologic feasibility in understanding the basaltic units compared to the optical, thermal infrared data, and other sources of data.

3.4. Maximum Likelihood Classification

To better understand the basaltic units objectively, the classification method is preferred to comprehensively categorize the TB into different geologic units. Among all the classification methods, the maximum likelihood classification (MLC) has a relatively higher precision [38,39], which is adopted in this study.
MLC is a classic probabilistic method based on the Bayes’ principle. In this classification, a pixel is assigned to the class that has the highest probability (that is, the maximum likelihood). Mean vector and covariance metrics are the key component of MLC that can be retrieved from training data selected by the regions of interest (ROIs) file [38,39]. According to the maps by Morota et al. [11] and Bhatt et al. [14], six classes are interpreted, including the units Ihtm, Iltm north (unit Iltm1), Iltm south (unit Iltm2), Im, Ikm, and the highlands unit. The TB data in Figure 3 and Figure 4, and the following dTB data in Figure 6, except that at 19.35 GHz, are used for our re-classification. That is, T B = ( T B 1 , T B 2 , T B 3 , T B 4 , T B 5 , T B 6 , T B 7 , T B 8 , T B 9 ) is used for MLC classification. For each pixel T B s = ( T B 1 , s , T B 2 , s , T B 3 , s , T B 4 , s , T B 5 , s , T B 6 , s , T B 7 , s , T B 8 , s , T B 9 , s ) , the MLC assumes that its distribution obeys the Gaussian distribution conditional on one specific class, { s | s = ( i , j ) , 1 i m , 1 j n } and m × n is the size of the image. Thus, the probability is expressed as:
P ( T B s | c l ) = 1 ( 2 π ) 3 det | Σ l | 1 / 2 exp { 1 2 ( T B s μ l ) T Σ l 1 ( T B s μ l ) } ,   1 l 9
where θ l = ( μ l , Σ l ) is the mean and variance of Gaussian distribution for class c l (   1 l 6 ), and det | Σ l | is the corresponding determinant of Σ l . According to this equation, the discriminant likelihood function of each class   c l for T B s is:
L ( c l , θ l , T B s ) = P ( c l | T B s ) = P ( c l ) P ( T B s | c l ) P ( T B s ) ,     1 l 9
Because ln [ P ( T B s ) ] is a constant for all the classes, the energy function is expressed as:
l ( c l , θ l , T B s ) = ln [ L ( c l , θ l , T B s ) ] = ln [ P ( T B s | c l ) ] ln [ P ( c l ) ] = 3 ln ( 2 π ) 1 2 ln [ det | Σ l | ] + 1 2 ( T B s μ l ) T Σ l 1 ( T B s μ l ) ln [ P ( c l ) ] ,       1 l 9
where P ( c l ) is the priori probability. According to the MLC, the optimal class c l * of T B s should have the maximum L ( c l , θ l , T B s ) , i.e., the minimum l ( c l , θ l , T B s ) . That is:
c l * = a r g max   c l L ( c l , θ l , T B s ) = a r g min   c l l ( c l , θ l , T B s ) = a r g min   c l 0.5 * ln [ det | Σ l | ] + 0.5 * ( T B s μ l ) T Σ l 1 ( T B s μ l ) ln [ P ( c l ) ] ,       1 l 9
The MLC method is used to re-understand the basaltic units in Section 5.1.

4. Results

Based on the overlap of the interpreted geologic boundary over the generated maps, a distinct perspective of the basaltic units compared to the visible image is presented in Figure 3 and Figure 4.

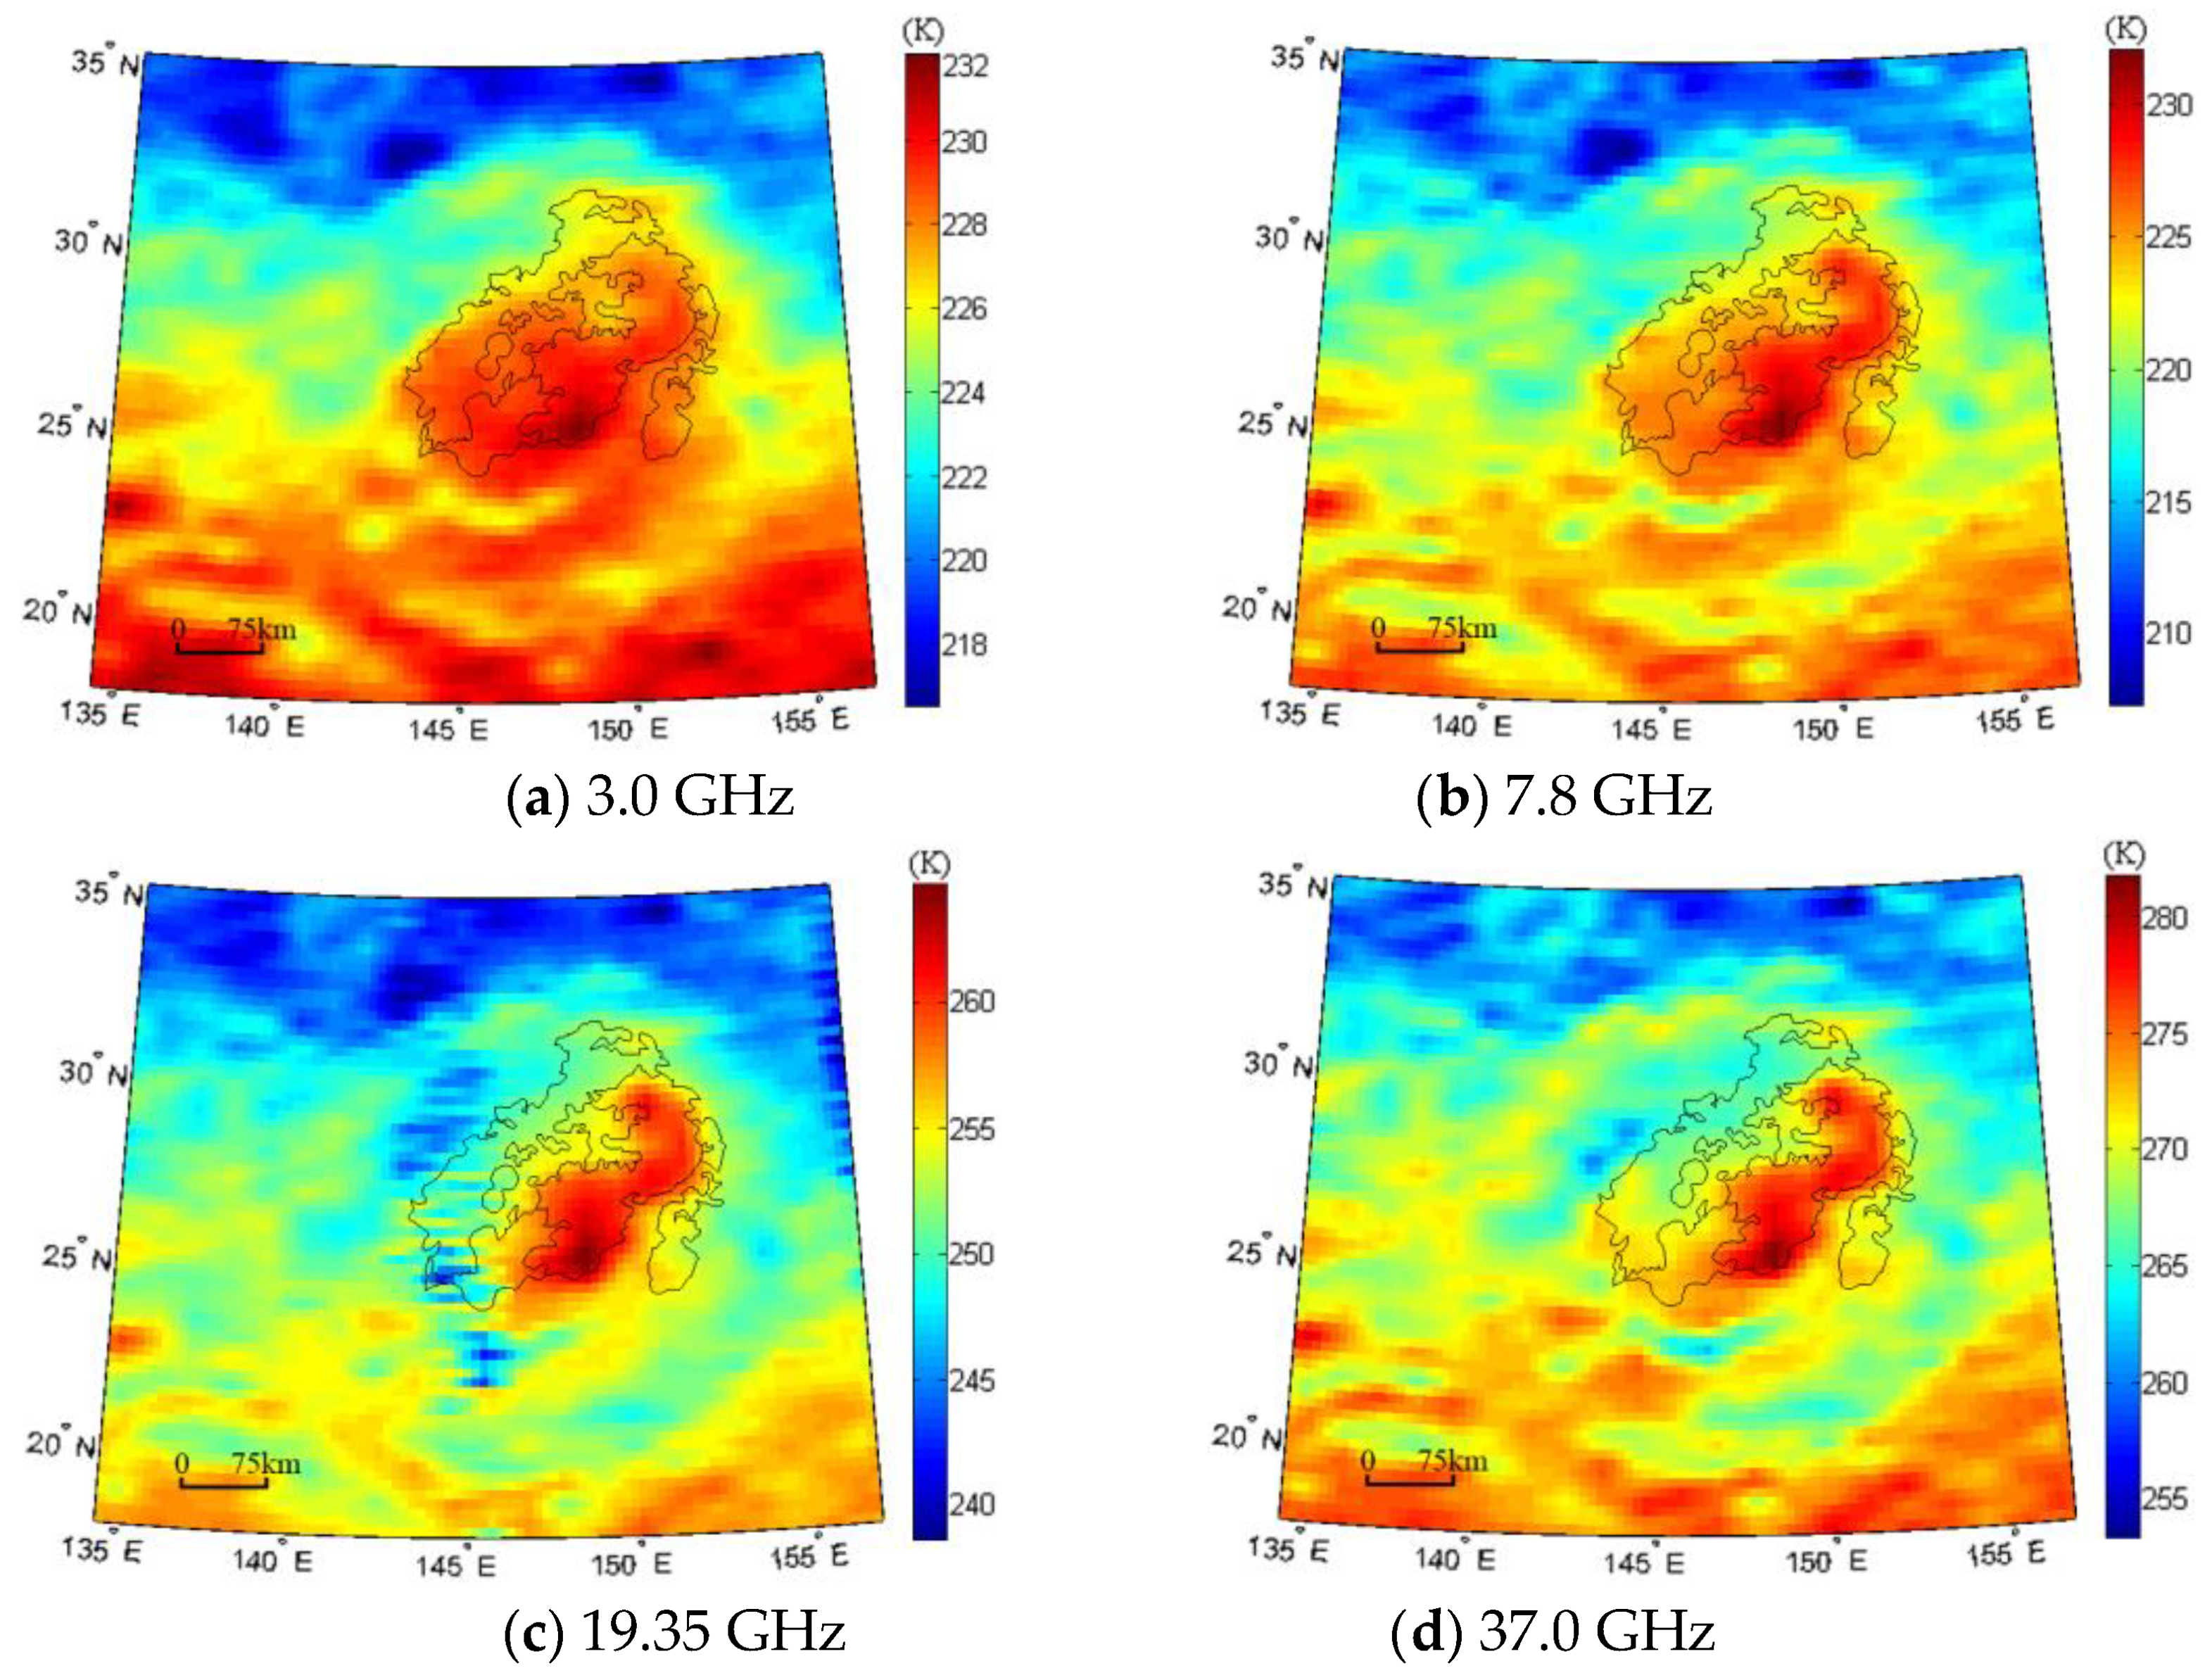
4.1. Noontime TB Features

Figure 3 is the TB of Moscoviense Basin at noon. To better understand the thermophysical features of the mare, the maximum, minimum, average, and standard deviation (std.) of the TB values in the four basaltic units interpreted by Kramer et al. [9] are presented in Table 1.
Figure 3 and Table 1 both indicate that unit Ihtm (the southern part of Mare Moscoviense) has the highest TB at noon. Correspondingly, the FTA is highest in this unit. This correlation agrees well with the theoretical simulation [17,18,20], also indicating the rationality of the generated TB maps.
In unit Iltm (the western and northern parts of Mare Moscoviense), the TB performance is rather complex. Morota et al. [11] and Bhatt et al. [14] have mentioned the difference of the regolith components and the absolute ages between the southern and northern parts of this unit. Figure 3 shows that the TB in the northern part is apparently lower than that in the southern part at the four-channel maps, while the boundary indicating the abrupt TB changes is not clear between the two parts. Additionally, considering the decrease of the surface temperature with the latitude increase, about 20 K from 18°N to 35°N, this TB performance should not be attributed completely to the difference in the regolith thermophysical features.
Moreover, the TB in the southern part of unit Iltm is similar to that in unit Im (the southwestern part of Mare Moscoviense), while the TB in the northern part is clearly higher than the nearby highlands at 3.0 GHz but similar to the nearby highlands in the other three channels. Additionally, the area of the region with relatively lower TB becomes larger with the increasing frequency. Combined with the penetrative features of the microwave signals [15,20], this implies the rapid change of the regolith thermophysical features in vertical direction because of the very different TB performances at the four channels.
Unit Im presents a special TB performance. Figure 3 postulates a relatively higher TB compared to unit Iltm. Table 1 validates this finding by maximum and average values. However, Figure 1c illustrates that the FTA in this unit is lower than unit Iltm, which is not supported by the theoretical simulation as shown in Figure 2. What brings such enhanced TB performance should be further studied.
Because the area of unit Ikm (mainly within Komarov crater) is rather small compared to the original spatial resolution of the CELMS data, about 30 km along the latitude, the MTE features of unit Ikm are hard to understand in Figure 3. Though there exists the TB variation within the unit, the difference between the unit and its vicinity is not clear.
Interestingly, there exists a very high TB region near (148.5°E, 25°N) in the southern part of unit Ihtm, but there is not any terrain or FTA distribution that is consistent with this anomaly. This abnormal TB will be further discussed in Section 5.2.
Furthermore, though there occurs an about 20 K TB variation with the latitude, the TB in Basin floor is still higher than the highlands, especially in unit Ihtm. This means that the regolith thermophysical parameters play a relatively more important role on the observed CELMS data.

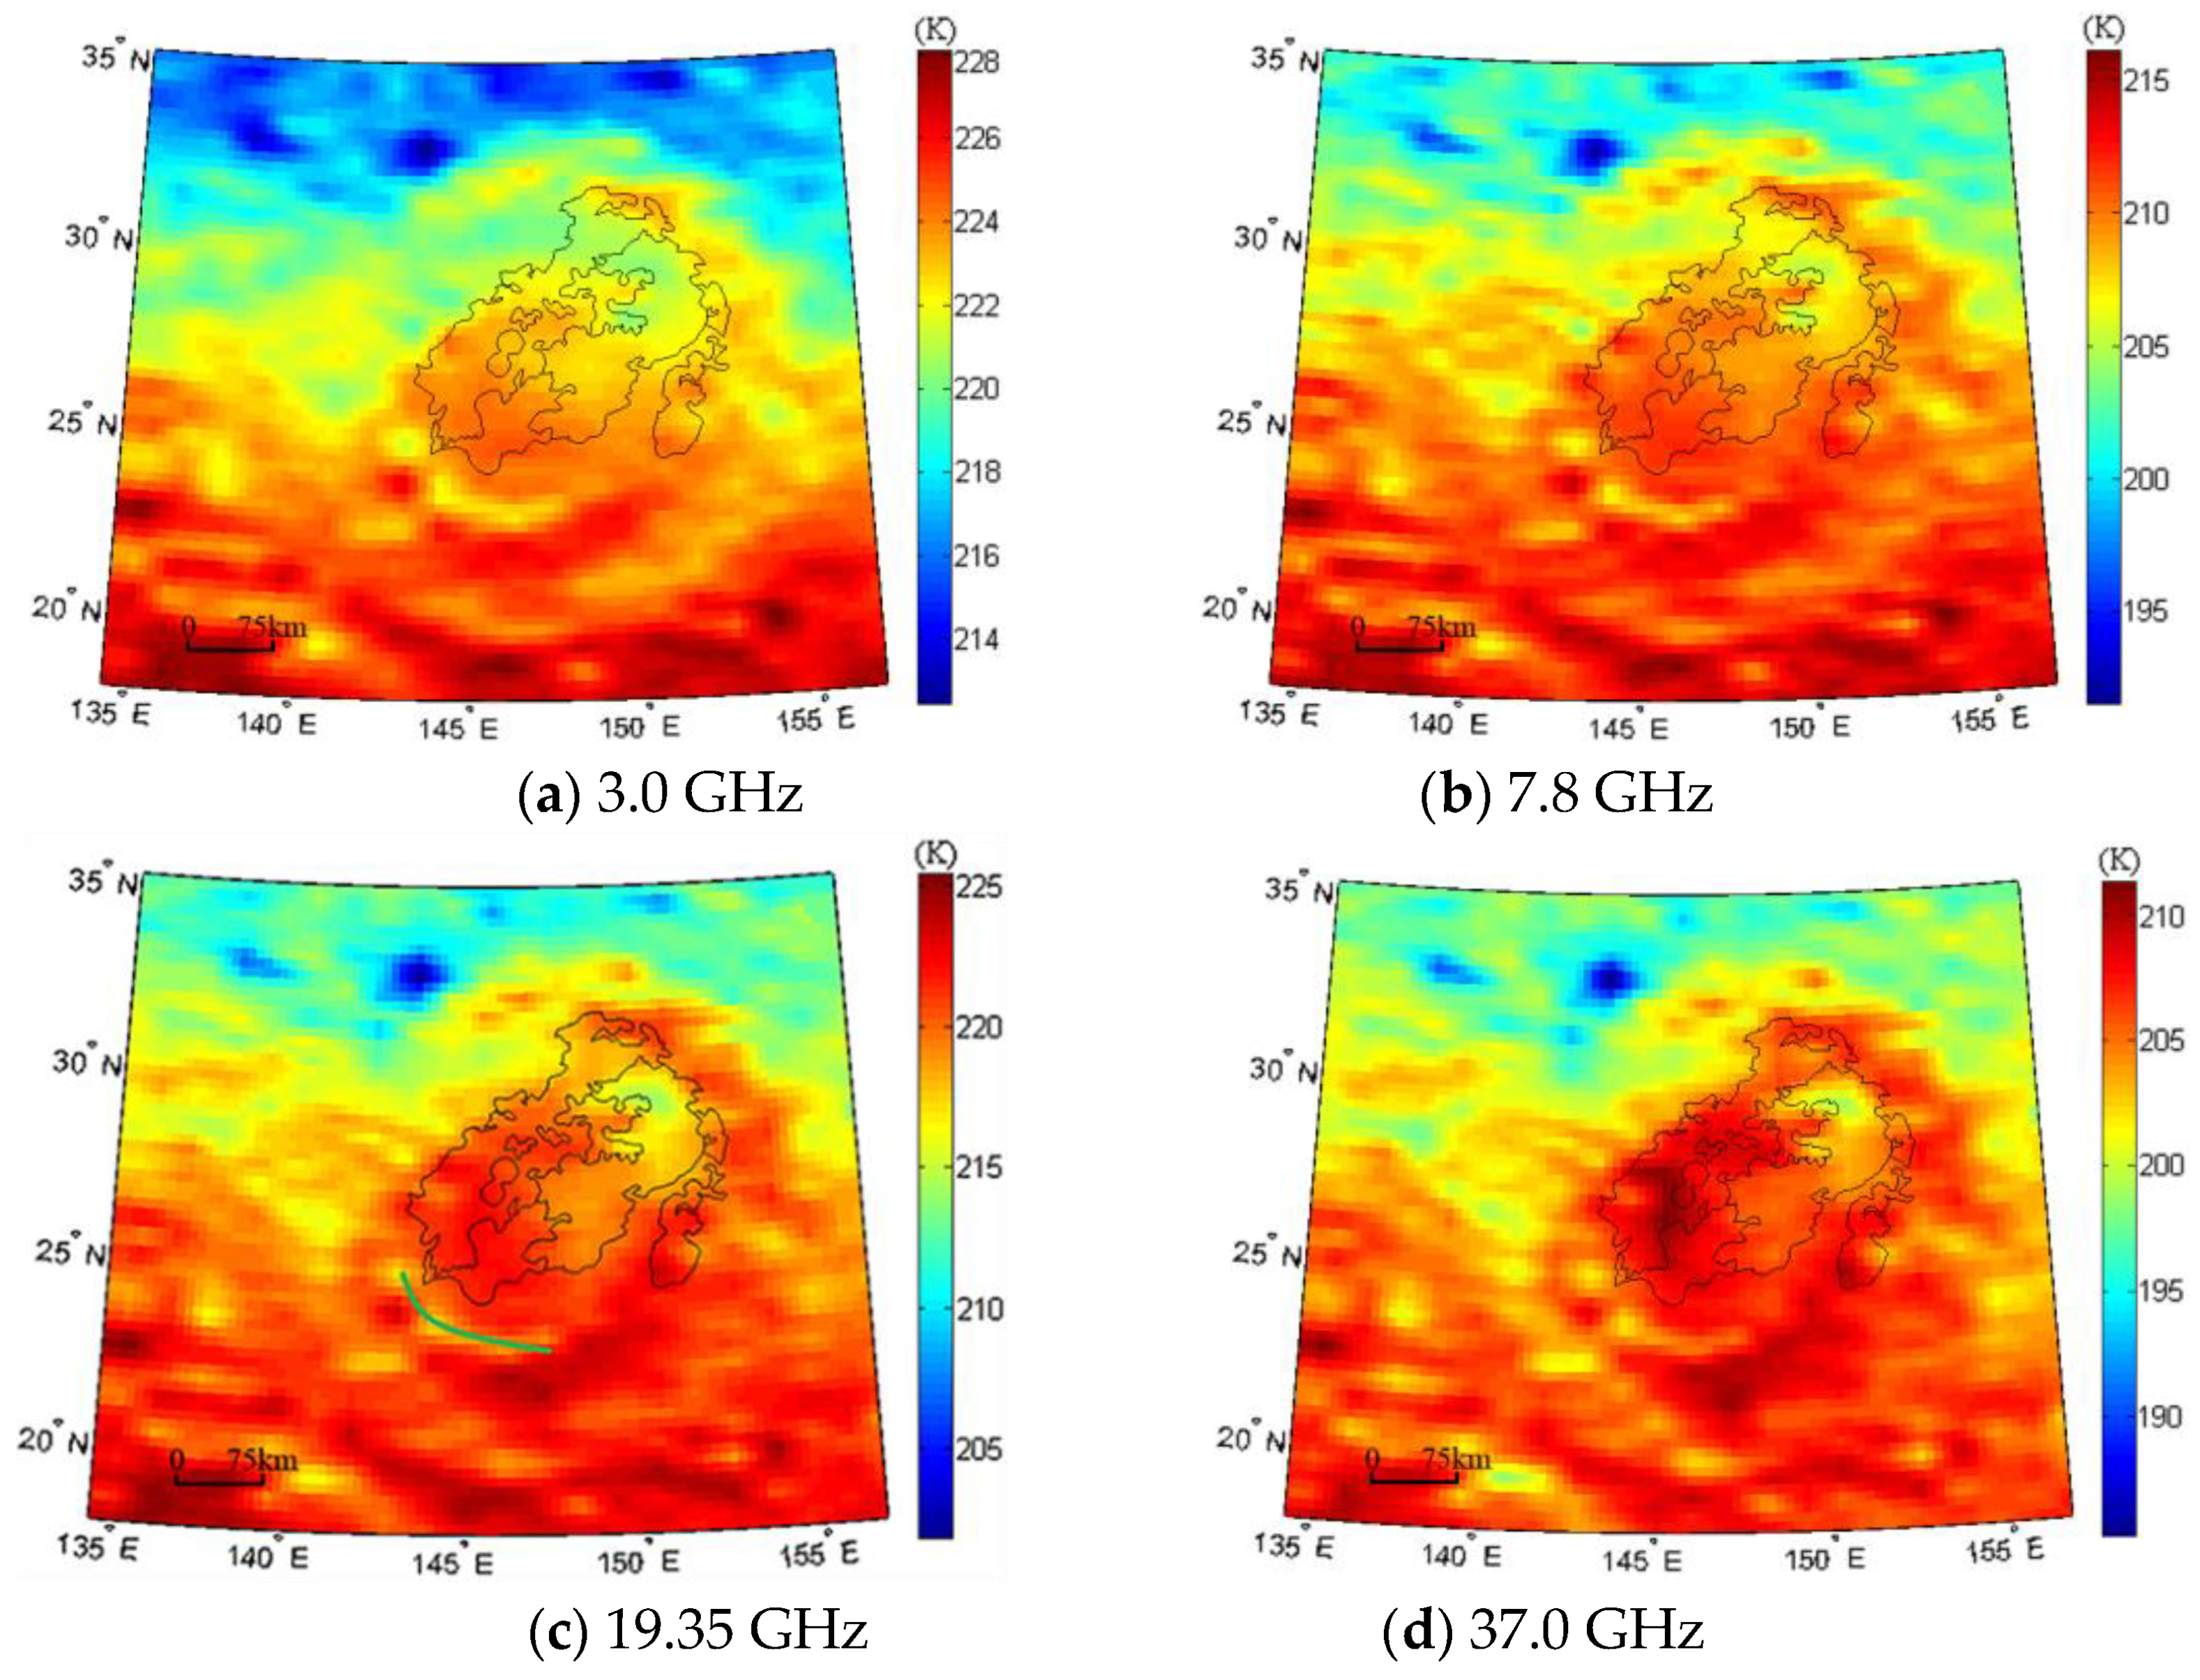
4.2. Nighttime TB Features

Compared to Figure 3, Figure 4 provides an alternate view about the MTE features of the basaltic units. Table 2 also gives the statistical values of the TB in the four basaltic units.
Figure 4 and Table 2 both indicate that the lowest TB occurs in unit Ihtm and the highest TB occurs in unit Im. Combined with the FTA in units Ihtm, Iltm, and Im, this nighttime TB performance is rational according to the theoretical simulation and the findings with the CELMS data [34], again justifying the use of the generated TB maps.
In unit Iltm, similar complex phenomena again exist. The TB in the northern part is largely lower than that in the southern part at the four-channel maps. Furthermore, the area of the region with relatively lower TB is decreasing with the increasing frequencies. Interestingly, at 37 GHz, the highest TB of Moscoviense Basin occurs in the southern part of Iltm unit. This verifies the complexity of the regolith thermophysical features in this unit as demonstrated by the TB performances at noon.
Theoretically, the TB performances at noon will be inversely corresponding to those at midnight [20,26,34]. However, the difference among the average TB values of the four units is rather weak, no more than 3 K. This is much less than that at noon, up to 10 K. The reason for the low TB difference should be further studied to better understand the substrate regolith thermophysical features of the Msocoviense Basin.
What was found to be quite puzzling is the TB performance within the Basin floor. Here, since the FTA is higher than the nearby highlands, the TB during daytime is higher than the nearby highlands. However, the TB at nighttime is still higher than the highlands along the same latitude, which is contrary to the theoretical simulation. The causes of the high TB anomaly should be further discussed in the following study.

4.3. dTB Features

Though Figure 3 and Figure 4 are largely adequate at indicating the thermophysical features of the mare basalts in Moscoviense Basin, the change of the TB with latitude limits our understanding of the distribution features of the basaltic units.
Considering that the great change of the lunar regolith temperature only occurs in the upper 15 cm [26,37], Meng et al. [17,18,20] suggested that the dTB should be directly related to the regolith thermophysical features within the corresponding microwave penetration depth based on the theoretical simulation. Therefore, the dTB map is also generated in this study (Figure 6). Table 3 gives the statistical values of the dTB in the four basaltic units.
Figure 6 shows an interesting dTB performance, which can be expressed as follows.
Firstly, comparing the three basaltic units in the Basin floor, the highest dTB exists in unit Ihtm at all channels, which is about 2 K at 3.0 GHz, 5 K at 7.8 GHz, and 7 K at 37 GHz higher than that in the second highest region, unit Im.
Interestingly, the dTB difference between unit Im and unit Iltm is not clear at low frequencies. The dTB in unit Iltm is only about 0.1 K at 3.0 GHz and 0.5 K at 7.8 GHz higher than that in unit Iltm, which means that the substrate materials in depth layer of the two units are likely similar. However, at 37 GHz, the dTB in unit Im is up to 4.5 K higher than that in unit Iltm, indicating that the difference of the materials in the two units only occur in the shallow layer.
Comparatively, unit Ikm has the lowest dTB at 3.0 and 7.8 GHz, while the dTB in this unit is approximately 2 K higher than that in unit Iltm at 37 GHz. Moreover, the regions with high dTB values do not coincide with the boundary of unit Ikm. Such dTB performance is hard to interpret, which also deserves to be further studied.
Secondly, in highlands, Figure 6 indicates a new view on the regolith thermophysical features. The dTB variation in highlands beyond Mare Moscoviense is no more than 2 K at 3.0 GHz and 4 K at 7.8 GHz. Moreover, the aforementioned dTB variations should be attributed in part to the topography, as the change of the surface elevation is approximately 10 km [27]. The approximate dTB values imply the similar lunar regolith parameters in highlands surrounding Mare Moscoviense, which at least indicates the homogeneity of the regolith thermophysical parameters in the depth layer of the highlands. This also indicates that the CELMS data is a good candidate to evaluate the basaltic units in Moscoviense Basin.
However, at 37 GHz, the dTB in the eastern part is about 6 K lower than that in the western part. Interestingly, the area with rather low dTB originates from the boundary between units Iltm and Im, extending along the northeast direction, and spreading toward the southwest direction along the southern boundary of unit Ihtm. The rather low dTB regions clearly terminate in the south part of the Basin. Especially in the region near (145°E, 20°N), the boundary between the low dTB region and the high dTB region is fairly clear, although they both belong to the highland regions. Additionally, although the data quality is not good at 19.35 GHz, the regions with relatively lower dTB largely coincide with that at 37 GHz. Such a coincidence verifies that this is an actual difference in the regolith thermophysical features between the eastern and western highlands of the Moscoviense Basin. Combined with the previous analysis, the depth of the special materials is more than 16.2 cm but less than 76.9 cm.
The surface topography (Figure 1b and Figure 5), the FTA map (Figure 1c), and even the rock abundance from Bandfield et al. [40] could not be responsible for the abnormally low dTB, indicating that this is a special finding only revealed by the CELMS data. What brought about the low dTB here leaves much room for further studies, which may consequently bring about an improved understanding of the formation of the highlands.
Thirdly, in general, the FTA in the Basin floor is higher than the nearby highlands. Theoretically, the dTB in the Basin floor should also be higher than the nearby highlands. The dTB performances at 3.0 and 7.8 GHz are good evidence to support this theoretical simulation. Additionally, at 37 GHz, the dTB performance in units Ihtm and Im agrees well with the theoretical simulation. However, the dTB in unit Iltm is not only lower than in unit Im, but also lower than in the western highlands, and it is just as low as in the eastern highlands. This is also a new finding revealed by the CELMS data, which will test our understanding on the basaltic volcanism in Mare Moscoviense.
Additionally, there exists a significant TB change in maps near 26°N both at noon and midnight. However, no surface topography or composition distribution can be responsible for the TB change. Particularly, the dTB performances do not support this TB change near 26°N, which indicate the similar values in the highlands surrounding Mare Moscovinse at 3.0 and 7.8 GHz maps. Thus, combined with the numerical simulation, this TB change is likely brought by the great change of the surface temperature with latitude, which is about 20 K from 18°N to 35°N.
This also postulates that the surface temperature has a weak effect on the dTB, which is very important to further explore the lunar surface with the CELMS data.

5. Discussion

The TB and dTB features indicate several special findings of Mare Moscoviense.

5.1. A New View of Basaltic Units

The understanding of the basaltic volcanism is mainly depended on the identification of the basaltic units. Until now, the most important dependence to divide the Basin floor into units is the spectral data and the inferred FTA with Clementine UV-VIS data and the Chandyayaan Moon Mineralogy Mapper data here [9,11,14]. However, the penetration depth of the spectral data is limited at the uppermost layer of the lunar regolith, which is easily impacted by the space weathering and ejecta from other regions [15,16,27]. Therefore, the previous interpretation of the basaltic units could be re-evaluated using the microwave data with better penetration capability.
In Mare Moscoviense, the identification of the basaltic units is mainly based on the Clementine UV-VIS data [9], Selene Terrain Camera data [11], and Chandrayaan-1 M3 data [14]. However, the geologic interpretations do not entirely agree with each other. Especially to the unit Iltm, Bhatt et al. [14] re-classified it as unit Ivltm (Imbrian very low Ti and very low Fe) in the northern part and kept unit Iltm in the western part, where the iron and titanium contents in unit Ivltm is 2–4 wt.% lower than unit Iltm.
Interestingly, the TB performances show that only unit Ihtm is largely consistent with the spectral interpretation [9]. The difference between the southern and northern parts of unit Iltm is not clear in TB maps. To better understand the basaltic volcanism objectively, the MLC method mentioned in Section 3.4 is preferred to comprehensively categorize the TB into different geologic units.
Here, the ArcGIS software (version 10.2) is used to select the ROIs for every geologic unit, which are shown in Figure 7a. The training samples are used to estimate the mean vectors and covariance matrixes for the MLC classifier. These two parameters determine the properties of the multivariate normal models. Thereafter, the trained classifier was used to classify every pixel in the image into one of the desired classes. In order to reduce poor classification due to small probabilities, the predetermined threshold is set to 5% of the average measurements, and the total number of iterations is set to 1000. Once the training process terminates, the maximum likelihood classifier will rapidly identify the corresponding geologic unit for any given set of input parameters, TB.
Through this method, the basaltic units and the highlands were interpreted as shown in Figure 7b. To better understand the new geologic map, the geologic map by Kramer et al. [9] was also vectorized and overlaid on the new map as shown in Figure 7b.
Figure 7b again indicates an excellent coincidence in unit Ihtm and highlands. This not only validates the rationality of the generated geologic map, but also verifies the reliability of the used CELMS data. However, there were also multiple patches indicated as mare units in the highlands. This is probably brought by the uncertainty of the MLC method, which is inevitable to misclassify few pixels with the remote sensing methods. Interestingly, when checking Figure 3, Figure 4, Figure 5 and Figure 6 in these regions, we mentioned that the TB and dTB performances are abnormal compared to their vicinities. Particularly, the TB and dTB performances are abnormal in the crater near (153°E, 20°N), which is classified as unit Ikm; while TB performances are normal in the nearby crater at (151°E, 20°N), which is classified as unit highlands. This means the difference of the two craters in volumetric regolith thermophysical features. This also hints the significance of the CELMS data in studying the deposits of the lunar surface.
In most cases, the unit boundary is smoother than that interpreted by Kramer et al. [9]. This results from the low spatial resolution of the CELMS data, about 7 km in this study, which will not be considered in the following discussions.
Compared to the previous results, the differences mainly occur in three aspects.
Firstly, unit Iltm does not agree with the western and northern separations by Bhatt et al. [14]. Figure 7b shows that unit Iltm2 is largely enclosed by Iltm1 unit. However, between units Iltm1 and Ihtm, there again occurs unit Iltm2. This phenomenon implies that the difference between units Iltm1 and Iltm2 are likely in the uppermost layer of the lunar regolith as indicated by the spectral data, but not in volume. Interestingly, Figure 6 indicates a similar dTB performance as unit Im at 3.0 and 7.8 GHz, but a different performance at 37 GHz. Considering the probing penetration of the microwave is about 10 to 20 times the used wavelength [15], this phenomenon implies that the regolith properties in the shallow layer are different from those in depth. The FTA in mare basalts is relatively high compared to the highlands; this depth is more than 8.1 cm indicated by the 37 GHz map, but less than 38.5 cm indicated by the 7.8 GHz map. Thus, the aforementioned phenomena indicate that unit Iltm should be covered by a shallow layer of special material, which would then produce a rather low dTB. That is, the difference between units Iltm1 and Iltm2 results from the ejecta overlay, but not from the mare basalts in different periods.
Additionally, a swirl occurs in this unit, which is often interpreted as albedo anomalies due to their immensely brighter, sinuous textures, and high immaturity [41]. The surge of magnetic fields in the swirl regions almost has no relation to topographical deformations [41]. Thus, this magnetic anomaly and the composition with spectral data may give some meaningful clues to improve understanding the very low dTB and even the basaltic volcanism of the lunar farside, which should be further studied with more sources of data in future.
Secondly, the distribution of unit Im is much more extensive than that interpreted by Kramer et al. [9]. Unit Im is represented by the second highest TB at noon, highest TB at midnight, and the second highest dTB. In the new geologic map, the area of unit Im extends in southwest direction, occupying the southwestern part of unit Iltm, and in northeast direction, forming a long belt in the southeast part of unit Ihtm. This is because, although the FTA in the extended regions is lower than the basaltic units, it is still higher than the nearby highlands. Correspondingly, the TB performances are similar to that of unit Im.
Notably, the area of this unit near Titov crater is much less than before, part of which is identified as unit Ihtm. This again validates that such regions are covered by the impact ejecta with low FTA.
Thirdly, Figure 7b gives a good definition about unit Ikm. Though it is always attributed to unit Iltm [11,14], it is actually an independent unit in TB performances. Compared to the geologic map by Kramer et al. [9], unit Ikm is limited in the western part of Komarov crater, while the northern part of the unit beyond Komarov crater is reclassified as unit Im. On the other hand, unit Ikm occurs in the southwest part next to unit Im and the highland regions far from Mare region, indicating the complexity of the regolith thermophysical features in this unit.
Generally, the CELMS data provides a new view about the basaltic units in Mare Moscoviense compared to the Clementine UV-VIS results and the Chandrayaan-1 M3 results. Especially, the changes of the TB and dTB with the frequency bring some essential information about the substrate deposits. This is of special importance to promote the applications of the CELMS data in understanding the basaltic volcanism of the Moon.

5.2. Warm TB Anomaly

Jin et al. [25], Wang et al. [26], and Meng et al. [34] proposed that the regions with high FTA will postulate high TB at daytime, low TB at nighttime, and a high dTB as indicated by the simulation results in Section 2. Combined with Figure 1c and Figure 3, Figure 4, and Figure 6, the TB performances within Moscoviense Basin obviously support the conclusion. Here, the FTA of unit Ihtm is much higher than that in unit Iltm at noon, while it is apparently lower than unit Iltm at night, especially at 37 GHz. Again, the highest dTB values in unit Ihtm clearly verify the conclusion.
Additionally, two phenomena should be mentioned.
Firstly, the FTA in the highlands beyond the Moscoviense Basin is much lower than that in highlands (Figure 1c). The TB at noon and dTB performances are corresponding to their FTA performances. These performances agree with the theoretical conclusion.
However, at midnight, the TB in the Basin floor is still much higher than that in the highlands along the same latitude with lower FTA. This is totally opposite the aforementioned conclusion, hinting a warm TB anomaly existed in the Basin floor. However, what brought about this warm TB anomaly?
Interestingly, a similar phenomenon also occurs in the Orientale Basin. Combined with the theoretical simulation, Meng et al. [20] thought that there were three possible explanations to the abnormally high TB at night, including the FTA, the surface slope, and the given substrate temperature. Additionally, Bandfield et al. [41] thought the rock abundance (RA) would bring about the hot TB anomaly of the lunar surface in the thermal infrared domain. That is, in previous studies, the TB anomaly is attributed to four regolith thermophysical features, including the FTA, surface slope, RA, and the substrate temperature.
The first parameter, the FTA of the lunar regolith, can be eliminated, because it gives an opposite result to interpret the warm TB anomaly in the Moscoviense Basin.
The second parameter, surface slope, can also be neglected. As we know, the elevation change is more than 10 km from the Basin center to nearby highland, while there are no special TB variations in Figure 3, Figure 4, and Figure 6 related to the Basin range, indicating the weak influence of the topography in macro-scale on the TB performances. Additionally, what we found in Hertzsprung Basin also supports the conclusion [29]. That is, the influence of the surface slope on the warm TB anomaly is rather weak and can, therefore, also be neglected.
For the third parameter, Chan et al. [35], Zheng et al. [36], and Meng et al. [29,42] suggested that the regions with higher RA will introduce the lower TB at night. For the dielectric constants of the regolith with rocks will be enhanced, thus, the penetration depth of the microwave is reduced and the warm medium in depth cannot be sensed by the CELMS instrument as mentioned in Section 2. Moreover, according to the simulation results with the theoretical model, Gong and Jin [43] also proposed that the higher RA will bring about the lower TB at night, which is also opposite to the observations in this study. Thus, this parameter can be omitted, too.
Therefore, the only leftover influential parameter is the substrate temperature. Until now, there were only two measured substrate temperatures at Apollo 15 and 17 sites, 250 K and 252 K, respectively [27]. The two values are always used as the substrate temperature when studying the MTE features over the whole lunar surface [20,25,26]. However, if the other parameters are omitted, only the higher substrate can be responsible for the higher TB at night. A similar conclusion can also be obtained in Mare Orientale and Crisium using the CELMS data [20,44]. That is, the substrate temperature of the lunar regolith in Moscoviense Basin is likely much higher than what we know.
The second phenomenon is that the FTA derived from the optical data is higher in unit Iltm than that in unit Im [9,12,14]. Thus, according to the theoretical simulation, the TB in unit Iltm should be higher than that in unit Im. However, the TB performances in the two units are just opposite to the theoretical simulation, as the observed TB in unit Iltm is lower than that in unit Im at noon.
The above two phenomena together develop a new view on the temperature in the substrate within Mare Moscoviense, that is, the substrate temperature should be higher than the Apollo measurements and the relatively higher substrate temperature should occur exclusively in unit Im. Moreover, the TB in unit Im is only 1.3 K higher than that in unit Iltm, indicating that the substrate temperature is about 3 K or less than the mentioned supposed depth temperature used in the numerical simulation in Section 2.
This is a new understanding about the distribution of the substrate temperatures in the shallow layer of the lunar surface. It is essential to study the thermal evolution of the Moon, which can be further studied with the experiment and, possibly, the in-situ observations.

5.3. Revealed Special Terrains

Figure 3, Figure 4 and Figure 6 show that the TB performance in the southern part of unit Ihtm (marked Region A) is much different from that in the northern part (marked Region B) (Figure 8). Combined with Figure 1c and Figure 3, Figure 4, Figure 5 and Figure 6, a special volcanic process is expressed in unit Ihtm.
Firstly, Figure 1c indicates that, though the FTA in Region A is similar to that in Region B, the value in Region A is about 3 wt.% higher than that in Region B.
Secondly, Figure 3 indicates that the TB in Region A is similar in amount to that in Region B at noon, while Figure 4 indicates a higher TB in Region A compared to Region B at night.
Thirdly, Figure 6 illustrates that, at the four channels, Region A is not continuous with Region B, though they have the similar dTB performances. Additionally, the regions with relatively higher dTB are largely in the north-south direction, and the areas are decreased from the central part to the boundaries.
Therefore, Region A and Region B should be two isolated volcanic structures though they belong to one basaltic unit.
Moreover, the shape of the two regions is interesting, which indicates the inverse “C” pattern. Such patterns with similarly high FTA are widely identified in Marius Hills plateau and even on Earth, which is interpreted as the volcanic construct [12,45]. That is, Region A and Region B are most likely two independent volcanic features, probably the volcanic constructs.
Moreover, seeking for the volcanic origins is difficult on the lunar surface for the space weathering and the contamination of the impact crater ejecta [45,46]. Here, as mentioned in Section 3, they both have one small patch with highest dTB in the four channels in Regions A and B. Considering the basalts with higher FTA are formed in the late volcanism [46], unit Ihtm has been identified as the late-stage lava basalt and the latest basalts should exist in the two small patches as indicated by the arrows in Figure 8 (up). Thus, the small patches with the highest dTB in Region A and Region B are likely the locations of the fissures of the volcanic activity that led to the filling of Moscoviense Basin. Therefore, there likely exist two volcanic features in Moscoviense Basin. The diameters of the two volcanic features are about 60 km, which is much larger than the discovered volcanic constructs in most other regions of the lunar surface [47,48], therefore, hinting at the great strength of the volcanic sources in the Basin. This conclusion may in part be supported by the discovered thinnest crust of the entire Moon beneath Mare Moscoviense [5,6], for the eruption of the mare basalts in such depth may be easier than that in the regions with thick crust. If so, such huge volcanic features bring a special understanding about the basaltic volcanism over the lunar farside, which directly reveals the potential volcanic features beyond the optical data for the first time. This is of essential significance to re-understand the basaltic volcanism on the Moon with the CELMS data.
Additionally, the area of the patch with highest dTB in Region A becomes smaller with increasing frequency. Moreover, in the 37 GHz map, the results are unclear. This means that the basaltic origin was disturbed in the shallow layer, which is also the reason that they are not observed by the spectral data. Furthermore, we checked the WAC image of Regions A and B as presented in Figure 8 (bottom), and multiple wrinkle ridges are found. We know little about the relationship between the wrinkle ridges and the basaltic volcanism, but the strong correlation between the wrinkle ridges and the high dTB anomalies again validates the advantages of the CELMS data in the lunar volcanism study.
One more thing should be mentioned is the presence of floor-fractured craters in Moscoviense Basin. In particular, Komarov crater has extensive fractures and a massively bulging anomaly beneath the floor, indicating the ever-existed strong volcanic activities. Interestingly, the TB in the crater floor is slightly higher in the southwestern part of unit Ikm than its vicinity both at noon and at night. Again, there exists a slightly high dTB anomaly in the central part of the crater at 19.35 and 37 GHz maps, which can support the aforementioned correlation to certain extend. However, considered that the diameter of Komarov crater is only about 85 km and that the spatial resolution of the used CELMS data is about 30 km, it is difficult to further discuss the dTB anomaly in the crater. Moreover, the weak dTB anomaly may probably attribute in part to the difference in the formation mechanism of wrinkle ridge and floor fracture. More passive microwave observations are indispensable to improve studying the relationship between the wrinkle ridges and the high dTB anomalies.

5.4. Homogeneity of Lunar Highlands

Pieters [49] and Tompkins and Pieters [50] proposed the idea that the lunar highlands crust below the surface is compositionally diverse by investigating the mineralogy of the central peaks. Wu et al. [51] studied the elemental abundances of the topmost surface of the lunar highlands with CE Interference Imaging Spectrometer (IIM) data, and concluded that the lunar highlands crust is relatively uniform on the quadrant scale, but inhomogeneous on the global scale. However, attention is seldom paid to the materials in the local highlands.
Until now, the regolith parameters in Moscoviense Basin have been widely studied with the Clementine UV-VIS data and Chandrayaan-1 M3 data [8], but no reports are related to the highlands materials surrounding the Basin floor. The dTB has proved to be directly related to the regolith thermophysical features within the corresponding microwave penetration depth [17,18,20]. Thus, the four-channel dTB maps in Figure 6 presents a new view of the homogeneity of the lunar highlands.
Figure 6 shows that the total dTB variations are less than 4 K at 3.0 GHz and about 6 K at 7.8 GHz in the highlands regions surrounding the Moscoviense Basin. If the abnormally high and low dTB values are excluded, the corresponding variations are only about 2 and 4 K, respectively. In previous studies, the temperature change as a result of solar illumination was reported to be up to 300 K from noon to midnight [27]. Such small dTB variations in highlands regions directly indicate the similar regolith thermophysical features, indicating that lunar regolith is homogeneous in the highlands surrounding Mare Moscoviense at least in microwave domain.
However, at 19.35 and 37 GHz, the dTB in the east highlands is about 6 K lower than that in the west highlands, which clearly suggests that the materials are not identical. The low dTB region originates from the boundary between units Iltm and Im, extends along the northeast direction, and continues towards the southwest direction along the southern boundary of unit Ihtm, which is outlined in Figure 9. Moreover, low dTB appears as well in the northwest corner of the image. The dTB values there are quite similar to those included in the outlined anomaly in the highlands on the southeast–north sectors of the Basin, which should be similar to the outlined anomaly, too. Thus, what are the causes for the low dTB anomaly?
Though Kramer et al. [8], Morota et al. [11], Thaisen et al. [12], Pieters et al. [13], and Bhatt et al. [14] studied the compositions in Moscoviense Basin, no special material was mentioned in the surrounding highlands. This implies that the material is likely not identified by the optical data.
Interestingly, in geography, the low dTB anomaly largely occurs in the eastern part of a ring structure as indicated by the green circle in Figure 1b. This is one of the rings related to the formation of Moscoviense Basin, meaning that the special material should be related to the excavation process during the formation of the Basin [52]. Moreover, the special material is largely within the second ring next to the innermost ring, which hints that it should be ejected from the late stage impact forming the Basin floor. Considering Mare Moscoviense has the thinnest crust on the entire Moon [5,6,7], the special material should be excavated from the lower crust.
However, since the microwave has no ability to identify the components of the lunar regolith, the special material is still unknown. Meaningfully, Meng et al. [18,43,53] found that the low dTB anomaly also occurs in the peak ring of Apollo and Schrödinger Basins and in the place surrounding Copernicus crater, indicating that the extensive occurrence of the low dTB anomaly over the lunar surface. Moreover, the dTB in unit Iltm and its north vicinity also indicates the rather low values, which is even lower than the east highlands. The relationship between this low dTB anomaly and the east highlands is still not clear. Optimistically, after checking the TB performances in Von Kármán crater, the low noontime and nighttime TB anomalies clearly exist in the central part of the crater floor [54]. The on-going CE-4 mission is counted upon to bring some useful information to better understand the formation mechanism of the low dTB anomaly and its geologic representations.

6. Conclusions

In this paper, the CE-2 CELMS data was systematically processed to study the MTE features of Mare Moscoviense. The TB and dTB performances present some interesting information about Moscoviense Basin and the surrounding highlands.
Firstly, according to the TB and dTB performances, the basaltic units in Mare Moscoviense is re-understood using the maximum likelihood method, which suggests a different view about the mare deposits compared to the Clementine UV-VIS results and the Chandrayaan-1 M3 results.
Secondly, the TB and dTB performances show good correlations with the FTA distributions, especially for part of the geologic units. Through the comparison the between TB performances in the Moscoviense Basin and those in the nearby highlands, a high substrate temperature in the Basin floor is obtained. Additionally, the TB performances of the four units imply that the abnormally high substrate temperature likely occurs in the depth of unit Im.
Thirdly, unit Ihtm likely comprises two huge independent volcanic features based on its TB and dTB performances. The two highest dTB regions are proposed as the locations of the fissures of the volcanic activities. This finding also indicates the potential significance of the CELMS data in the lunar volcanism study.
Finally, based on the dTB performances, the highlands materials are re-evaluated. Our findings indicate that the shallow layer of the lunar crust should be homogeneous, and that there exists a low dTB anomaly in the east highlands. We thought that the low dTB anomaly is likely brought by a special material from the lower crust, which is still unstudied.
More work deserves to be done to further explore the CELMS data in the current lunar volcanism and composition studies.

Author Contributions

Conceptualization, Z.M. and Y.Z. (Yuanzhi Zhang); methodology, S.C. and Y.W.; software, T.W. and Z.C.; validation, Z.M., Y.Z. (Yuanzhi Zhang), and S.H.; formal analysis, Z.M.; investigation, S.C.; resources, Y.W.; data curation, Z.M. and S.C.; writing—original draft preparation, Z.M. and Y.W.; writing—review and editing, S.C., Y.Z. (Yuanzhi Zhang), and Y.Z. (Yongchun Zheng); visualization, T.W.; supervision, Z.C.; project administration, Z.M., Y.W., and Y.Z. (Yongchun Zheng); funding acquisition, S.C. and Y.Z. (Yongchun Zheng). All authors have read and agreed to the published version of the manuscript.

Funding

This work was supported in part by the Open Fund of State Key Laboratory of Remote Sensing Science (No. OFSLRSS201911), the Fundamental Research Funds for the Central Universities, the National Natural Science Foundation of China under Grants (41490633, 41490634), the opening fund of State Key Laboratory of Lunar and Planetary Sciences (Macau University of Science and Technology) (Macau FDCT grant No. 119/2017/A3), the Science and Technology Development Fund of Macau under Grant 0012/2018/A1, the Program for JLU Science and Technology Innovative Research Team under Grant 2017TD-26, the Graduate Innovation Fund of Jilin University under Grant 101832018C042, the Pioneer Science and Technology Special Training Program B (No. XDPB11-01-04) of Chinese Academy of Sciences, and the China-Italy Collaborate Project for Lunar Surface Mapping (No. 2016YFE0104400).

Acknowledgments

The authors express their thanks to the people helping with this work, and acknowledge the valuable suggestions from the peer reviewers. In this study, the surface slope and RA data were downloaded from JMARS SOFTWARE (http://oss.mars.asu.edu/svn/jmars/). We are grateful for allowing us to use their data.

Conflicts of Interest

The authors declare no conflict of interest regarding the publication of this paper.

References

  1. Wilhelms, D.E. The Geological History of the Moon; United States Geological Survey: Washington, DC, USA, 1987; p. 1348.
  2. Gillis, J.J. The Composition and Geological Setting of Mare Deposits on the Far Side of the Moon. Ph.D. Thesis, Rice University, Houston, TX, USA, 1998. [Google Scholar]
  3. Jolliff, B.L.; Gillis, J.J.; Haskin, L.A.; Korotev, R.L.; Wieczorek, M.A. Major lunar crustal terranes: Surface expressions and crust-mantle origins. J. Geophys. Res. 2000, 105, 4197–4216. [Google Scholar] [CrossRef] [Green Version]
  4. Head, J.W. Orientale multi-ringed basin interior and implications for the petrogenesis of lunar highland samples. Earth Moon Planet. 1974, 11, 327–356. [Google Scholar] [CrossRef]
  5. Ishihara, Y.; Goossens, S.; Matsumoto, K.; Noda, H.; Araki, H.; Namiki, N.; Hanada, H.; Iwata, T.; Tazawa, S.; Sasaki, S. Crustal thickness of the Moon: Implications for farside basin structures. Geophys. Res. Lett. 2009, 36, 82–90. [Google Scholar] [CrossRef]
  6. Wieczorek, M.A.; Neumann, G.A.; Nimmo, F.; Kiefer, W.S.; Taylor, G.J.; Melosh, H.J.; Phillips, R.J.; Solomon, S.C.; Andrews-Hanna, J.C.; Asmar, S.W.; et al. The Crust of the Moon as Seen by GRAIL. Science 2013, 339, 671–675. [Google Scholar] [CrossRef]
  7. Namiki, N.; Iwata, T.; Matsumoto, K.; Hanada, H.; Noda, H.; Goossens, S.; Ogawa, M.; Kawano, N.; Asari, K.; Tsuruta, S.; et al. Farside gravity field of the Moon from four-way Doppler measurements of SELENE (Kaguya). Science 2009, 323, 900–905. [Google Scholar] [CrossRef]
  8. Gillis-Davis, J.J.; Lucey, P.G.; Hawke, B.R. Mare Moscoviense a window into the interior of the Moon. In Proceedings of the 37th Annual Lunar and Planetary Science Conference, Houston, TX, USA, 13–17 March 2006. [Google Scholar]
  9. Kramer, G.Y.; Jolliff, B.L.; Neal, C.R. Distinguishing high-alumina mare basalts using Clementine UVVIS and Lunar Prospector GRS data: Mare Moscoviense and Mare Nectaris. J. Geophys. Res. Planet. 2008, 113, 769–775. [Google Scholar] [CrossRef]
  10. Craddock, R.A.; Robinson, M.S.; Hawke, B.R.; McEwen, A.S. Clementine-based geology of the Moscoviense Basin, lunar farside. In Proceedings of the Lunar and Planetary Science Conference, Houston, TX, USA, 17–21 March 1997. [Google Scholar]
  11. Morota, T.; Haruyama, J.; Honda, C.; Ohtake, M.; Yokota, Y.; Kimura, J.; Matsunaga, T.; Ogawa, Y.; Hirata, N.; Demura, H.; et al. Mare volcanism in the lunar farside Moscoviense region: Implication for lateral variation in magma production of the Moon. Geophys. Res. Lett. 2009, 33, 272–277. [Google Scholar] [CrossRef]
  12. Thaisen, K.G.; Head, J.W.; Taylor, L.A.; Kramer, G.Y.; Isaacson, P.; Nettles, J.; Petro, N.; Pieters, C.M. Geology of the Moscoviense Basin. J. Geophys. Res. Planet. 2011, 116, E00G07. [Google Scholar] [CrossRef] [Green Version]
  13. Pieters, C.M.; Besse, S.; Boardman, J.; Buratti, B.; Cheek, L.; Clark, R.N.; Combe, J.P.; Dhingra, D.; Goswami, J.N.; Green, R.O.; et al. Mg-spinel lithology: A new rock type on the lunar farside. J. Geophys. Res. Planet. 2011, 116, E00G08. [Google Scholar] [CrossRef] [Green Version]
  14. Bhatt, M.; Wöhler, C.; Dhingra, D.; Thangjam, G.; Rommel, D.; Mall, U.; Bhardwaj, A.; Grumpe, A. Compositional studies of Mare Moscoviense: New perspectives from Chandrayaan-1 VIS-NIR data. Icarus 2008, 303, 149–165. [Google Scholar] [CrossRef]
  15. Campbell, B.A.; Carter, L.M.; Hawke, B.R.; Campbell, D.B.; Ghent, R.R. Volcanic and impact deposits of the moon’s aristarchus plateau: A new view from earth-based radar images. Geology 2008, 36, 135–138. [Google Scholar] [CrossRef]
  16. Fang, T.; Fa, W.Z. High frequency thermal emission from the lunar surface and near surface temperature of the Moon from Chang’E-2 microwave radiometer. Icarus 2014, 232, 34–53. [Google Scholar] [CrossRef]
  17. Meng, Z.G.; Hu, S.; Wang, T.X.; Li, C.; Cai, Z.C.; Ping, J.S. Passive microwave probing mare basalts in Mare Imbrium using CE-2 CELMS data. IEEE J STARS 2018, 11, 3097–3104. [Google Scholar] [CrossRef]
  18. Meng, Z.G.; Wang, Y.Z.; Chen, S.B.; Zheng, Y.C.; Shi, J.C.; Wang, T.X.; Zhang, Y.Z.; Ping, J.S.; Hou, L.L. MTE features of Apollo Basin and its significance in understanding the SPA Basin. IEEE J STARS 2019, 12, 2575–2583. [Google Scholar] [CrossRef]
  19. Lucey, P.G.; Blewett, D.T.; Jolliff, B.L. Lunar iron and titanium abundance algorithms based on final processing of Clementine ultraviolet-visible images. J. Geophys. Res. Planet. 2000, 105, 20297–20305. [Google Scholar] [CrossRef]
  20. Meng, Z.G.; Zhang, J.D.; Tang, Z.S.; Ping, J.S.; Cai, Z.C. Microwave thermal emission features of Mare Orientale revealed by CELMS data. IEEE J STARS 2017, 10, 2991–2998. [Google Scholar] [CrossRef]
  21. Zhu, Y.C.; Zheng, Y.C.; Fang, S.B.; Zou, Y.L.; Pearson, S. Analysis of the brightness temperature features of the lunar surface using 37 GHz channel data from the Chang’E-2 microwave radiometer. Adv. Space Res. 2019, 63, 750–765. [Google Scholar] [CrossRef]
  22. Hagfors, T. Microwave Studies of Thermal Emission from the Moon. Adv. Astronomy Astrophys. 1971, 8, 1–28. [Google Scholar]
  23. Keihm S, J. Effects of subsurface volume scattering on the lunar microwave brightness temperature spectrum. Icarus 1982, 52, 570–584. [Google Scholar] [CrossRef]
  24. Keihm S, J. Interpretation of the lunar microwave brightness temperature spectrum: Feasibility of orbital heat flow mapping. Icarus 1984, 60, 568–589. [Google Scholar] [CrossRef]
  25. Jin, Y.Q.; Yan, F.H.; Liang, Z.C. Simulation for remote sensing of the lunar soil and rock by using multi-channels microwave radiometers. Chin. J. Radio Sci. 2003, 18, 477–486. [Google Scholar]
  26. Wang, Z.Z.; Li, Y.; Jiang, J.S.; Li, D.H. Lunar surface dielectric constant, regolith thickness, and 3He abundance distributions retrieved from the microwave brightness temperatures of CE-1 Lunar Microwave Sounder. Sci. China Earth Sci. 2010, 53, 1365–1378. [Google Scholar] [CrossRef]
  27. Heiken, G.H.; Vaniman, D.T.; French, B.M. Lunar Sourcebook: A User’s Guide to the Moon; Cambridge University Press: London, UK, 1991. [Google Scholar]
  28. Meng, Z.G.; Chen, S.B.; Edward, M.O.; Wang, Z.J.; Cui, T.F. Research on water ice content in Cabeus crater using the data from the microwave radiometer onboard Chang’e-1 satellite. Sci. China Phys. Mech. 2010, 53, 2172–2178. [Google Scholar] [CrossRef]
  29. Meng, Z.G.; Wang, Q.S.; Wang, H.H.; Wang, T.X.; Cai, Z.C. Potential Geological Significances of Hertzsprung Basin Revealed by CE-2 CELMS Data. IEEE J. STARS 2018, 11, 3713–3720. [Google Scholar]
  30. Cai, Z.; Lan, T. Lunar Brightness Temperature Model Based on the Microwave Radiometer Data of Chang’E-2. IEEE Trans. Geosci. Remote 2017, 55, 5944–5955. [Google Scholar] [CrossRef]
  31. Meng, Z.G.; Xu, Y.; Zheng, Y.C.; Zhu, Y.C.; Jia, Y.; Chen, S.B. Inversion of lunar regolith layer thickness with CELMS data using BPNN method. Planet. Space Sci. 2014, 101, 1–11. [Google Scholar] [CrossRef]
  32. Ulaby, F.T.; Moore, R.K.; Fung, A.; Feng, J.C. Microwave Remote Sensing; Addison-Wesley: Reading, MA, USA, 1981; pp. 51–61. [Google Scholar]
  33. Jiang, J.S.; Wang, Z.Z.; Zhang, X.H.; Zhang, D.H.; Li, Y.; Lei, L.Q.; Zhang, W.G.; Cui, H.Y.; Guo, W.; Li, D.H.; et al. China probe CE -1 unveils world first Moon -globe microwave emission map-the microwave Moon some exploration results of Chang’E-1 microwave sounder. Remote Sens. Technol. Appl. 2009, 4, 409–422. [Google Scholar]
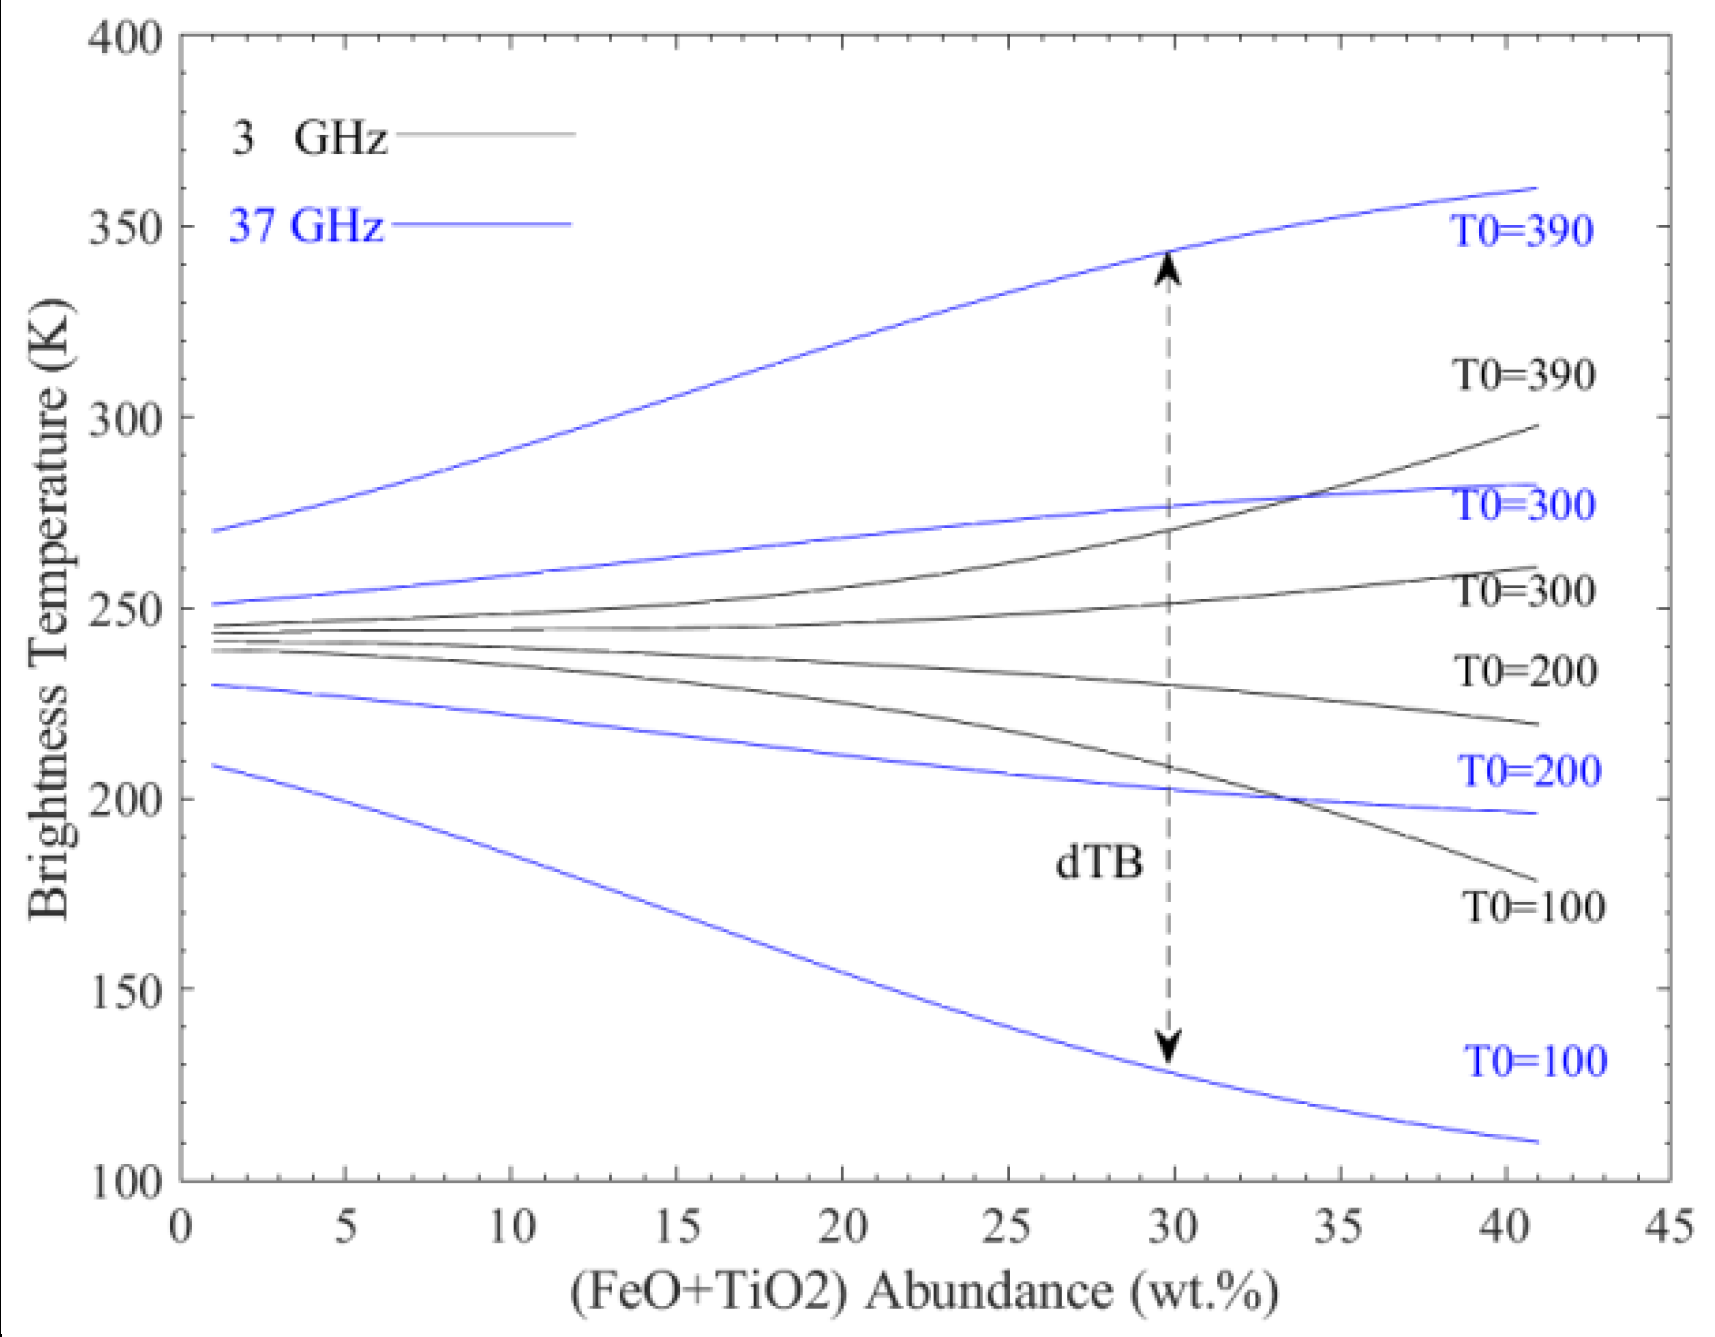
  34. Meng, Z.G.; Yang, G.D.; Cai, Z.C.; Gusev, A.; Osei, E.M. Influence of (FeO+TiO2) abundance on the microwave thermal emissions of lunar regolith. Sci. China Earth Sci. 2016, 59, 1498–1507. [Google Scholar] [CrossRef]
  35. Chan, K.L.; Tsang, K.T.; Kong, B.; Zheng, Y.C. Lunar regolith thermal behavior revealed by Chang’E-1 microwave brightness temperature data. Earth Planet. Sci. Lett. 2010, 295, 287–291. [Google Scholar] [CrossRef]
  36. Zheng, Y.C.; Tsang, K.T.; Chan, K.L.; Zou, Y.L.; Zhang, F.; Ouyang, Z.Y. First microwave map of the Moon with Chang’E-1 data: The role of local time in global imaging. Icarus 2012, 219, 194–210. [Google Scholar] [CrossRef]
  37. Hu, G.P.; Chen, K.; Huang, Q.; Guo, W.; Li, Q.; Cheng, Y. Brightness Temperature Calculation of Lunar Crater: Interpretation of Topographic Effect on Microwave Data from Chang’E. IEEE Trans. Geosci. Remote 2014, 52, 4499–4510. [Google Scholar]
  38. Kerle, N.; Janssen, L.L.F.; Huumeman, G.C. Principles of Remote Sensing; The International Institute for Geo-information Science and Earth Observation (ITC): Enschede, The Netherlands, 2009. [Google Scholar]
  39. Zhu, W.Q.; Lin, W.P. Remote Sensing Digital Image Processing; Higher Education Press: Beijing, China, 2015. [Google Scholar]
  40. Bandfield, J.L.; Ghent, R.R.; Vasavada, A.R.; Paige, D.A.; Lawrence, S.J.; Robinson, M.S. Lunar surface rock abundance and regolith fines temperatures derived from LRO Diviner Radiometer data. J. Geophys. Res. Planet. 2011, 116, E00H02. [Google Scholar] [CrossRef]
  41. Blewett, D.T.; Coman, E.I.; Hawke, B.R.; Gillis-Davis, J.J.; Purucker, M.E.; Hughes, C.G. Lunar swirls: Examining crustal magnetic anomalies and space weathering trends. J. Geophys. Res. Planet. 2011, 116, E02002. [Google Scholar]
  42. Meng, Z.G.; Li, X.Y.; Chen, S.B.; Zheng, Y.C.; Shi, J.C.; Wang, T.X.; Zhang, Y.Z.; Ping, J.S.; Lu, Y. Thermophysical Features of Shallow Lunar Crust Demonstrated by Typical Copernican Craters Using CE-2 CELMS Data. IEEE J. STARS 2019, 12, 2565–2574. [Google Scholar] [CrossRef]
  43. Gong, X.H.; Jin, Y.Q. Diurnal change of thermal emission with “hot spots” and “cold spots” of fresh lunar craters observed by Chinese Chang’E-1. Sci. China Inf. Sci. 2012, 42, 923–935. [Google Scholar]
  44. Meng, Z.G.; Wang, H.H.; Li, X.Y.; Wang, T.X.; Cai, Z.C.; Ping, J.S.; Fu, Z. Potential geological significations of Crisium Basin revealed by CE-2 CELMS data. ISPRS 2018, 42, 1279–1284. [Google Scholar] [CrossRef] [Green Version]
  45. Arya, A.S.; Rajasekhar, R.P.; Thangjam, G.; Ajai, K.; Kumar, A.S.K. Detection of potential site for future human habitability on the moon using chandrayaan-1 data. Curr. Sci. 2011, 100, 524–529. [Google Scholar]
  46. Hiesinger, H.; Head, J.W., III; Wolf, U.; Jaumann, R.; Neukum, G. Lunar mare basalt flow units: Thickness determined from crater size-frequency distributions. Geophys. Res. Lett. 2002, 29, 1248. [Google Scholar] [CrossRef] [Green Version]
  47. Hiesinger, H.; Jaumann, R.; Neukum, G.; Head, J.W. Ages of mare basaltson the lunar nearside. J. Geophys. Res.Planet. 2000, 105, 29239–29275. [Google Scholar] [CrossRef]
  48. Spudis, P.D.; Mcgovern, P.J.; Kiefer, W.S. Large shield volcanoes on the Moon. J. Geophys. Res. Planet. 2013, 118, 1063–1081. [Google Scholar] [CrossRef]
  49. Pieters, C.M. Compositional diversity and stratigraphy of the lunar crust derived from reflectance spectroscopy. In Remote Geochemical Analysis: Elemental and Mineralogical Composition; Pieters, C., Englert, P., Eds.; Cambridge Univ. Press: Cambridge, UK, 1993; pp. 309–339. [Google Scholar]
  50. Tompkins, S.; Pieters, C.M. Mineralogy of the lunar crust: Results from Clementine. Meteorit. Planet. Sci. 1999, 34, 25–41. [Google Scholar] [CrossRef]
  51. Wu, Y.Z.; Xue, B.; Zhao, B.C.; Lucey, P.G.; Chen, J.; Xu, X.S.; Li, C.L.; Ouyang, Z.Y. Global estimates of lunar iron and titanium contents from the Chang’E-1 IIM data. J. Geophys. Res. Planet. 2012, 117, E02001. [Google Scholar] [CrossRef]
  52. Yue, Z.Y.; Johnson, B.C.; Minton, D.A.; Melosh, H.J.; Di, K.C.; Hu, W.; Liu, Y. Projectile remnants in central peaks of lunar impact craters. Nat. Geosci. 2013, 6, 435–437. [Google Scholar] [CrossRef]
  53. Meng, Z.G.; Wang, H.H.; Zheng, Y.C.; Miyamoto, H.; Cai, Z.C.; Ping, J.S. Several Geological Issues of Schrödinger Basin Exposed by CE-2 CELMS Data. Adv. Astron. 2019, 2019, 3926082. [Google Scholar] [CrossRef]
  54. Meng, Z.G.; Wang, H.H.; Chen, S.B.; Ping, J.S.; Huang, Q.; Cai, Z.C.; Wu, Y.Z. Potential Geologic Issues of Von Karman Crate Revealed by Multisource Remote Sensing Data. ISPRS 2019, XLII–2/W13, 1425–1430. [Google Scholar] [CrossRef] [Green Version]
Figure 1. (a) Position of Mare Moscoviense (Green rectangle) on the lunar farside. (b) A mosaic of optical images from Lunar Reconnaissance Orbiter Camera (LROC), which was downloaded from https://astrogeology.usgs.gov/search/map/Moon/LRO/LROC_WAC; the green circle is an identified circle related to the rim of Mare Moscoviense. (c) Iron and titanium abundances (wt.%), which was estimated with the Lucey model [19] based on Clementine ultraviolet-visible (UV-VIS) data downloaded from https://astrogeology.usgs.gov/search/map/Moon/Clementine/UVVIS. (d) Geologic map [9] of Mare Moscoviense.
Remotesensing 12 00535 g001
Figure 2. Change of simulated TB with(FeO+TiO2) abundance and surface temperature.
Remotesensing 12 00535 g002
Figure 3. Noontime TB maps of Mare Moscoviense at 3.0 GHz (a), 7.8 GHz (b), 19.35 GHz (c), and 37 GHz (d) (Lambert Conformal Conic projection). The black line indicates the geologic boundaries proposed by Kramer et al. [9].
Remotesensing 12 00535 g003
Figure 4. Nighttime TB maps of Mare Moscoviense at 3.0 GHz (a), 7.8 GHz (b), 19.35 GHz (c), and 37 GHz (d) (Lambert Conformal Conic projection). The black line indicates the geologic boundaries proposed by Kramer et al. [9].
Remotesensing 12 00535 g004
Figure 5. Elevation map of Moscoviense Basin. The green line is in the same place as in Figure 4c. The data is downloaded from https://pds-geosciences.wustl.edu/missions/lro/lola.htm.
Remotesensing 12 00535 g005
Figure 6. dTB map of Mare Moscoviense at 3.0 GHz (a), 7.8 GHz (b), 19.35 GHz (c), and 37 GHz (d) (Lambert Conformal Conic projection). The black line indicates the geologic boundaries proposed by Kramer et al. [9].
Remotesensing 12 00535 g006
Figure 7. (a) The selected regions of interest (ROIs) for the classification. (b) The classification results related to the basaltic units overlaid by Kramer’s result [9].
Remotesensing 12 00535 g007
Figure 8. Two potential volcanic features outlined in dTB map at 7.8 GHz (up) and the wide angle camera (WAC) images of Region A (bottom, left) and Region B (bottom, left), whose sizes are about 24 km × 23 km.
Remotesensing 12 00535 g008
Figure 9. Low dTB anomaly outlined in dTB map at 37 GHz (a) and expressed in WAC image (b).
Remotesensing 12 00535 g009
Table 1. Statistical values of the four mare units at noon.
Frequency (GHz)Geologic UnitsTB (K)
Maximum MinimumAverageStandard Deviation
3.0Ihtm232.0 227.4 229.5 1.0
Iltm229.3 224.6 227.3 1.2
Im230.5 226.5 228.6 0.9
Ikm228.8 226.4 227.6 0.6
7.8Ihtm232.0 224.4 228.1 1.4
Iltm225.6 219.3 223.0 1.6
Im227.6 221.7 225.0 1.2
Ikm225.4 221.3 222.9 1.1
19.35Ihtm264.6 256.3 260.2 1.5
Iltm256.2 247.3 251.9 1.8
Im259.9 242.6 253.8 3.6
Ikm255.4 251.7 253.3 1.0
37Ihtm281.7 272.5 276.5 1.7
Iltm271.4 264.5 267.6 1.6
Im275.5 267.4 271.9 1.5
Ikm272.4 268.4 270.5 1.1
Table 2. Statistical values of the four mare units at midnight.
Frequency (GHz)Geologic UnitsTB (K)
Maximum MinimumAverageStandard Deviation
3.0Ihtm224.0 220.3 222.1 1.0
Iltm224.3 220.1 222.3 1.1
Im224.8 220.3 223.5 1.1
Ikm224.3 222.4 223.3 0.6
7.8Ihtm211.5 205.3 208.7 1.5
Iltm212.6 205.0 208.8 1.5
Im212.3 204.7 210.3 1.6
Ikm212.1 208.0 210.0 1.0
19.35Ihtm221.6 214.0 218.5 1.6
Iltm222.7 216.4 219.8 1.5
Im222.5 216.1 220.6 1.5
Ikm222.7 218.6 220.4 1.0
37Ihtm207.9 199.0 204.8 1.9
Iltm211.3 202.2 207.2 2.1
Im210.2 201.8 207.9 1.7
Ikm208.6 202.7 205.4 1.5
Table 3. Statistical values of the four mare units.
Frequency (GHz)Geologic UnitsdTB (K)
Maximum MinimumAverageStandard Deviation
3.0Ihtm8.4 5.7 6.9 0.5
Iltm6.5 3.8 5.0 0.5
Im7.1 3.4 5.1 0.7
Ikm5.0 3.5 4.3 0.4
7.8Ihtm22.8 16.0 19.4 1.4
Iltm18.2 12.2 14.2 0.8
Im19.6 12.0 14.7 1.4
Ikm14.0 11.9 12.9 0.6
19.35Ihtm46.9 37.3 41.7 1.9
Iltm38.8 25.3 32.1 2.3
Im42.2 21.8 33.2 4.1
Ikm34.3 32.2 33.0 0.5
37Ihtm78.8 66.7 71.7 2.4
Iltm68.1 56.1 60.4 2.0
Im72.1 60.2 64.9 2.1
Ikm66.7 61.5 62.5 1.1

