Abstract
Satellite Advanced Differential Synthetic Aperture Radar Interferometry (A-DInSAR) is becaming a key-technique for monitoring ground deformations. The potential of A-DInSAR for settlement monitoring is exploited in this paper through the investigation of a reclaimed land in Dubai (UAE). Time histories of displacements were obtained from COSMO-SkyMed satellite images over the period between 2011 to 2016, allowing to derive the long-term deformation of the entire artificial island. Special attention was paid on long-term settlement of the hydraulically-placed rockfill of the peripheral rubble-mound revetments. The A-DInSAR results have been compared with results derived from numerical analyses and with field surveys, proving the relation between observed and modeled displacements. The study has also revealed that rockfill long-term settlement (creep) rate is significantly dependent on the aging (time since placement). In the analyzed time-frame (2011–2016) it has been observed that recently placed rockfill experienced creep rate up to ten times higher than the creep rate measured for similar rockfill structures placed 30 years earlier. Furthermore, it has been demonstrated that static compression by preloading and dynamic or impact densification induced by wave forces proved to have also a significant impact on reducing the creep rate of the rockfill.
1. Introduction
Land reclamation is a common practice in all Gulf Countries, including the coastal area of Dubai (UAE). It generally includes filling with marine carbonate sand for the main reclamation land body and hydraulically-placed rockfill for seawalls containing the reclamation fill [1,2].
Long-term settlement in reclaimed lands is a critical task to be assessed; it depends primarily on the properties of the fill materials and, secondarily, on additional external factors (i.e., aging, placement methods, compaction techniques, wave forces, and temperature variation) [3]. Settlements of reclaimed bodies can lead to damage of bot foundations and underground facilities with possible economic consequences. Therefore, prediction of the spatial distribution of the settlement, especially in long-term timespan, is crucial for implementing remedial measures that minimize the potential risk associated with uncontrolled settlements [4].
The focus of this paper is the long-term settlement of rockfills, which is usually neglected or underestimated, although, it can cause large deformations of this material [5,6]. While the main part of the settlement of rockfill placed underwater typically takes place during construction, considerable settlement continues for many years after the end of the construction period at a decreasing rate [7,8]. In revetments and breakwaters with rock bunds, excessive settlement can also create weaknesses to the armor layer. However, the most severe impact of this settlement is pronounced when buildings are founded above or behind such rock structures.
Currently, the settlement behavior can be predicted using advanced numerical techniques such as finite element methods (FEM). Alternatively, settlement can also be calculated using tools based on closed-form solutions such as Settle 3D software. These tools can support the simulation and prediction of the rate of settlement through the analysis of vertical consolidation and settlement under embankments, foundations, and other surface loads [9]. Nevertheless, for all these available numerical tools and approaches, the absence of reliable rockfill constitutive models or well-defined rockfill deformational parameters concerning the external conditions, could introduce a significant systematic error in any model prediction, especially for long-term analyses involving secondary (creep) settlement [10]. Furthermore, deformational characteristics of rockfill depend on several factors including strength and composition of the rock materials, size, and gradation, particle shapes, quarrying method, etc. For these reasons, calibration and adjustment of the available models based on the actual behavior of the regionally available rockfill are essential. The best approach, in such a case, is to use the observational method [11,12] by selecting accurate monitoring techniques.
Numerous techniques are available for monitoring subsidence/settlement processes with very high accuracy and precision such as Optical Levelling, Global Navigation Satellite Systems (GNSS), Total Station, etc. [13,14,15,16]. Among these techniques, one of the most innovative and powerful techniques is satellite Synthetic Aperture Radar Interferometry (InSAR) [17,18,19,20,21,22,23,24,25].
In particular, Advanced Differential SAR Interferometry (A-DInSAR) is a multi-image approach based on the analysis of several SAR images acquired in different times over the same area with the same acquisition parameters (i.e., acquisition geometry, resolution, acquisition mode, etc.). By this technique the phase variation over time due to the different atmospheric conditions can be estimated, thus allowing to retrieve the deformational trend with millimeter accuracy and time series of displacement, for those points characterized by a coherent behavior (i.e., characterized by high phase and backscatter stability of the signal over time) [21]. Generally, structures and infrastructures, such as buildings, bridges, dams, railways, pylons, or natural elements like outcropping rocks or homogeneous terrain regions, are coherent targets.
In the last years, SAR interferometry has provided an incentive to the study of ground deformation processes in reclaimed lands. The opportunity to retrieve extensive displacement information over large areas with a spatial resolution of a few meters and a millimeter accuracy has allowed analyses at an exceptional level of precision. The availability of satellite SAR high-resolution imagery, starting from 2011, allows performing backward-analyses of existing structures and investigating the past deformation behavior of the selected target [24,25,26]. However, there are limited existing studies within the Middle East where A-DInSAR approach was deployed successfully to investigate the ground subsidence of reclaimed lands [27,28]. More, up to the authors’ knowledge, this approach has never been used to assess the creep settlement of native or fill materials, as there is no relevant publication for the entire Gulf Countries.
The work presented hereunder includes the integration of the geotechnical modeling with the A-DInSAR analyses to infer the long-term settlement behavior of the rubble-mound breakwaters. The work aims to answer the following questions: which assumptions and errors do we need to cater for the long-term numerical modeling of hydraulically placed rockfill materials? What are the advantages and limitations of remote sensing techniques such as the A-DInSAR used in marine projects in Gulf Countries? Can A-DInSAR help in the reconstruction and readjustment of existing constitutive materials models dealing with the creep behavior in a rockfill and other fill materials utilized in reclaimed grounds and artificial islands?
2. Site Description
2.1. General
The area of interest is a man-made reclaimed island located nearshore Dubai Municipality as depicted in Figure 1. The island considered in this study is a typical example of reclaimed areas in the Arabian Gulf, Red Sea, and the Arabian Sea, in terms of lithology, construction sequence, type of rock revetments, type of reclamation soils and ground improvement methodology.
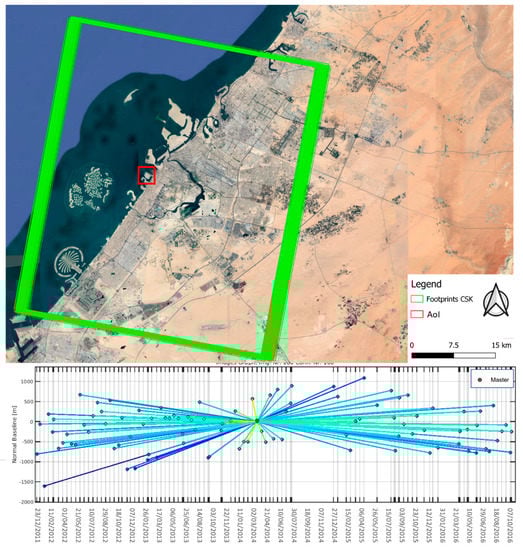
Figure 1.
(Above) Location of the study area and footprint of COSMO-SkyMed (CSK) images used in this study. (Below) Diagram of acquisitions with temporal baseline reported on the x-axis and orbital normal baseline on the y-axis. Each point corresponds to a satellite image; the Master image is reported in red. Project carried out using COSMO-SkyMed® PRODUCTS, © ASI (Italian Space Agency)—provided under license of ASI.
The area is around 0.77 km2 with a waterfront (outer) rock revetment approximately 1300 m long. At the time of this study (2019), the urbanization is ongoing, including mainly low-rise buildings and villas on top of the sand fill and in the proximity of the rockfill revetments.
The study focuses mainly on the waterfront (outer) rock revetment with different sections but the island platform and back (lee-side) revetments are also considered. The waterfront (outer) rock revetment has several sections, including the one presented in Figure 2.
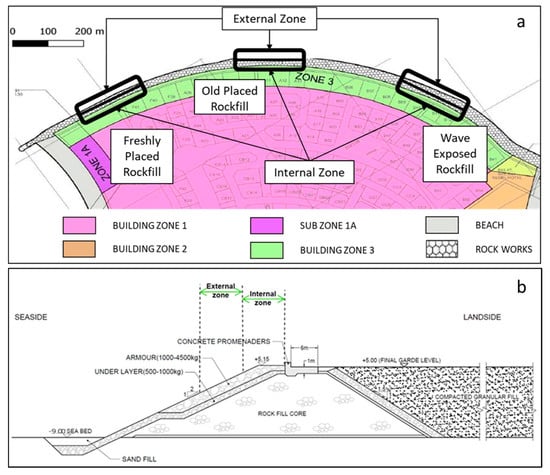
Figure 2.
Plan view of the studied areas (a) [29] and typical cross-section in the outer revetment after end of construction and removal of preloading with fill embankment (b).
Different scenarios and state conditions were considered, in this study, for the outer revetment (with rockfill core bund) based on the construction phases and exposure level to waves [3]. Three zones were identified and analyzed separately along the outer revetment. These zones, as depicted in Figure 2a are:
- freshly placed rockfill zone where a recently placed rock bund between the year 2010 and 2011 and located at the eastern edge of the revetment where it is relatively sheltered from strong waves. The height of the rock bund in this zone is slightly smaller than other zones;
- old placed rockfill zone that represents the central part of the revetment (where rock bund was placed in 2008 or slightly early) keeping the rock exposed to waves and aging for several years before completion of construction;
- wave-exposed rockfill zone is a recently placed rock bund located at the eastern edge of the revetment, where it is relatively exposed to higher and stronger waves.
Within each of these three zones, two sub-zones were identified as internal and external zones over the revetment slope, as shown in Figure 2b. The internal zone covers the uppermost portion of the slope, including the revetment crest while the external zone covers the middle third of the outer revetment slope. Naturally, the thickness of the rockfill decreases gradually moving toward the sea.
2.2. Island Construction Phases
Based on the available information, the reclamation works in the area of interest has started at the beginning of the year 2010 and were completed around the end of 2012. Specifically, the following construction work sequence has been derived by multi-temporal satellite images and technical papers [3] of the area:
- beginning of ground improvement by vibrocompaction behind the revetment for the sand fill from January 2012 to March 2012;
- placement of surcharging (preloading) fill embankment from March 2012 to May 2012, as shown in Figure 3;
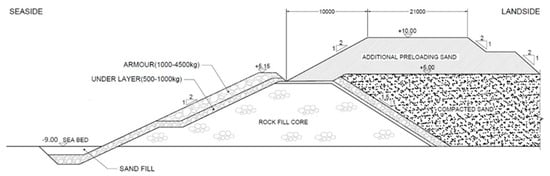 Figure 3. Typical cross-section in the outer revetment during preloading with fill embankment.
 - preloading from May 2012 to September 2012;
- removal of the preloading surcharge fill in September 2012;post-preloading stage: from September 2012 onward with typical final section is as shown in Figure 2b.
These phases induced a modification to the geotechnical parameters of the reclamation fill built on top of the native ground, including further variation in the rockfill characteristics, which is placed at the edge of the sand fill, as explained by Ali and Ancaja [3].
3. Regional Geological Setting
The Arabic Gulf is a tectonic basin of Pliocene to Pleistocene age, whose morphology has been greatly influenced by history tectonic of activities resulting in the deposition of marine sediments associated with numerous sea-level changes experienced over relatively short geological time [30].
The stratigraphic sequence exposed in northeastern Arabia, including the UAE region, consists of 200 to 600 m of Miocene and Pliocene rocks, mostly of non-marine origin. These deposits are a heterogeneous assemblage of mainly sandstone, sandy marl, and sandy limestone, deposited in relatively stable conditions on the Arabian Shield. These rocks laid down in a various deposition, principally shallow marine, intertidal, fluvial environments and sabkha [31]. These rocks have also been affected by relatively limited deformations associated with the anti-clockwise ongoing movement of the Arabian plate towards the Eurasian plate [32,33].
Above the Miocene and Pliocene rocks are unconsolidated Quaternary deposits, which comprise great sand deserts and widespread gravel sheets outcropping most in southeastern Arabia [34].
The conditions in the study region primarily consist of a linear coastline dissected by channels or creeks. The inland overburden deposits consist of desert and carbonate marine sands with shells interbedded with silts of varying thickness of 0.5 to 17 m.
In nearshore areas, a caprock is present, typically, either at seabed level or beneath a thin layer of unconsolidated soils. This comprises primarily cemented sands; the cementation process can occur when sediments are sub-aerially exposed during sea level drops and in sub-aqueous conditions when sedimentation rates are low [35,36].
The underlying rocks of Middle to Upper Tertiary were deposited in a shallow sea continental shelf/platform depositional environment, very similar to the present-day depositional environment in the Gulf. These rocks represent the bedrock and they included a sequence of calcarenite/sandstone paleo-dunes belonging to the Ghayathi Formation (Gha), overlying a unit comprised of calcisiltite/mudstone/conglomerate named Barzaman Formation [33]. Figure 4 is an extract of the onshore geology in the Dubai Municipality. However, the site area is located in a nearshore area subjected to reclamation operations, therefore it is not completely clear if the unconsolidated surficial natural ground has been partially altered during these activities.
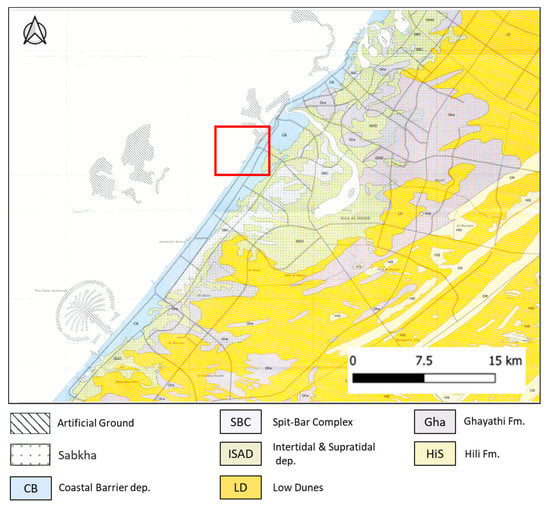
Figure 4.
Extract of the geological map of the coastal area of Dubai (UAE) [37]. the study area is enclosed in the red box.
Based on the studies carried out by Alzaylaie and Abdelaziz [29,38] and experience of the geology of the Dubai coastline, the general stratigraphy can be summarized in the following geological units:
- artificial ground such as sand fill and rockfill;
- occasional caprock;
- marine silty sand/Cemented silty sand;
- calcarenite;
- calcisiltite.
4. Materials and Methods
4.1. Study Methodology
The study workflow (methodology) is presented in Figure 5. In the present work, the geological and geotechnical data retrieved from scientific and technical literature of the area of interest were combined to obtain the key parameters to predict and analyze the ground settlement (Section 4.3 and Section 4.4). The settlement analysis was performed for three different zones over the rubble-mound outer revetment: i) freshly-placed rockfill, ii) old-placed rockfill, and iii) wave-exposed rockfill following the suggestion by Ali and Ancaja [3]. The estimation of the settlement was further performed (Section 4.4), based on the general total settlement equation given by the sum of three components: immediate or initial settlement, consolidation settlement, and secondary compression (or creep) settlement.
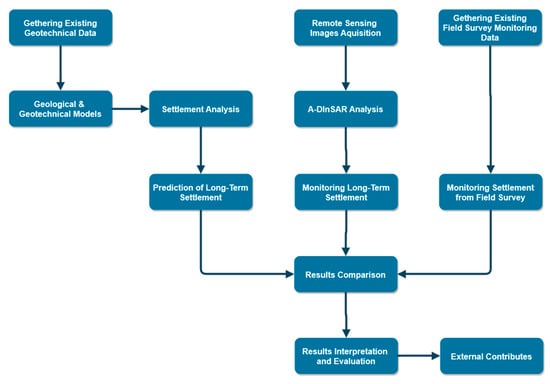
Figure 5.
Workflow of the approach adopted in the present work.
Finally, A-DInSAR analyses have been carried out in parallel, in order to estimate the actual surficial deformational pattern of the study area (Section 4.5), retrieving the deformational trend for the period between 2011 to 2016 and the time series of displacement for each measurement point (MP). Finally, the results obtained by the A-DInSAR analyses were integrated and compared (Section 5.4) with the actual field monitoring, and land survey data acquired only during the construction works. The comparison of all these results allowed to evaluate the accuracy of the A-DInSAR analysis and get deeper insight regarding the potential use of remote sensing for monitoring and predicting the deformation behavior of waterfront structures.
4.2. Filling Materials Characteristics
The sand fill, used to construct the main island platform, was dredged from offshore borrow areas. The sand contains between 70% to 95% of carbonate minerals and maximum fines content of 10%. Such carbonate sand can be characterized by very angular and weak particles that are susceptible to crushing and a high initial void ratio due to the angularity of particles and intra-particle porosity.
The rockfill material used to construct the revetment core bund was sourced from several quarries from Ras Al Khaimah area in UAE. Rock weight ranged from 0.1 to 500 kg, and the petrological analyses indicated that rockfill materials are mainly a very fine-grained and robust recrystallized limestone. The unconfined compressive strength ranged from 70 to 90 MPa and particle density was about 2.7 g/cm3.
4.3. Geological and Geotechnical Models
Based on the information derived from the geotechnical investigation carried out at the site, including, among the others, 26 boreholes, the geological profiles were proposed. The borehole data was used to build a geodatabase allowing the construction of 2D and 3D geological models including lithology, thickness, and the coordinates in 3Ds, including the levels referenced to Dubai Municipality Datum (DMD).
For each soil unit, the geotechnical parameters were defined using the results of in-situ and laboratory tests. The boreholes’ data was imported into the geodatabase and have been interpolated by using the lateral blending method, which is the most suitable for laterally heterogeneous soils. The three-dimensional geological models were built by using RockWorks17 software package [39].
Based on the above analysis on the pre-reclamation natural ground and from the general experience of the geology of the Dubai coastline and stratification reported by Alzaylaie and Abdelaziz [29,38], a ground model was identified as summarized in the Table 1 below:

Table 1.
Pre-reclamation site-specific stratigraphy [2].
The final layout of the site after reclamation and ground improvement phases consists of granular sand fill and rockfill up to a level of +5.0 m DMD. Once the models are developed, and the key geotechnical parameters are defined, a comprehensive settlement analysis has been undertaken.
The boreholes’ data have been collected and interpolated to generate representative ground models and to verify the presence of heterogeneities of thickness in the uppermost strata and in the bedrock. The geological features of the site at the pre-reclamation stage are detailed in Figure 6.
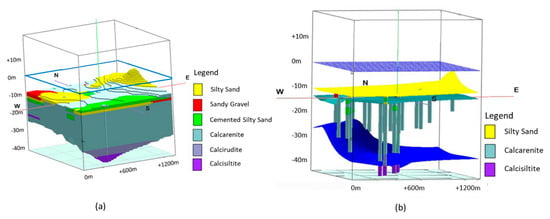
Figure 6.
3D Geological models of the pre-reclamation site area. (a) shows a 3D solid model of all the units encountered in the analyzed boreholes. (b) shows the top surface interpolated for the geological units that have been encountered three or more times in the analyzed boreholes; if the unit is encountered less than three times, this has not been shown in the interpolation results. In both images, the upper blue line and surface indicate the seawater level in m Dubai Municipality Datum (DMD).
3D ground models were interpolated from the existing boreholes at the site location before reclamation works. Based on the above, the surface geology is nearly homogeneous, except for an increase of thickness in the native silty sand layer towards the mainland. However, this area is not representative of the analyzed areas, as it is a small and localized area. The presence of sandy gravel, calcirudite, and calcisiltite layers shown in (a) have not been included in the settlement analysis since sandy gravel and calcirudite are encountered in less than three boreholes and are not considered to be representative of the site-specific conditions. The calcisiltite layer is too deep, and it has virtually no influence on the amount of the predicted settlement.
From the 3D geological model, two ground models were inferred to represent the geotechnical condition of the area after reclamation; Figure 7a represents the rockfill ground model and Figure 7b represents the sand fill ground model. Table 2 and Table 3 depict the geotechnical parameters for the rockfill and sand fill ground profile, according to Ali and Ancaja [3].
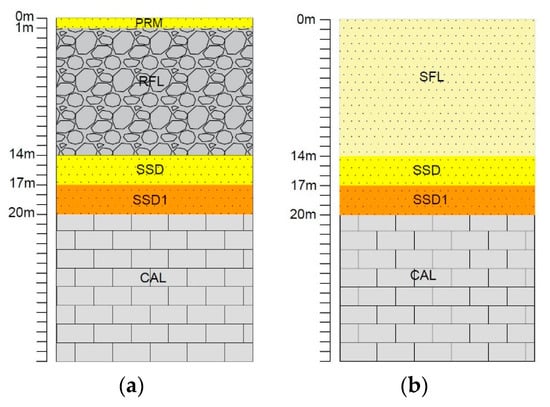
Figure 7.
Ground models at the site location after reclamation. (a) represents the revetment area in which rockfill has been placed and (b) represents the central zone of the area reclaimed with sand fill.
Table 2.
The ground model with elevations of the rockfill and the underlying natural ground profile.
Table 3.
The ground model with elevations of the sand fill and the underlying native ground profile.
In the rockfill log in Figure 7a, 1 m thick promenade was considered on top of the fill and 1 m of rockfill was removed from the total thickness during settlement modeling. Elevation and thickness of the rockfill area are presented in Table 2. Elevation and thickness of the sand fill ground profile are presented in Table 3.
The numerical modeling has been performed using Settle 3D software. The analyses were focused on the creep settlement. The software implements different methods to simulate the creep settlement. In this study, the Standard method [40] was used in which the magnitude of the creep settlement is assumed to vary linearly with the logarithm of time. The void ratio at the end of primary consolidation is used. Since a primary consolidation of 100% only occurs after infinite time, a default value of 95% primary consolidation is used as the starting point for creep [9]. The creep settlement formula used is the following:
where is the creep settlement, is the Secondary compression (creep) Index, is the void ratio at the end of primary consolidation, is the time at which 95% consolidation is achieved, and is the final time.
4.4. Ground Material Parameters
Several geotechnical parameters were required to perform the settlement analysis, such as the elastic modulus E, unit weight of each layer, creep index, etc. Main soil and rock parameters were taken from previous studies [29,38] while the creep index values needed for the estimation of the secondary compression settlement have been taken initially from Ali and Ancaja (2015). Table 4 shows the geotechnical input parameters used in the settlement analyses for the different revetment (rockfill) zones, while Table 5 lists the geotechnical input parameters used in the settlement analyses for the sand fill area.
Table 4.
Rockfill and natural geotechnical parameters in the three studied zones (freshly placed, old placed, and wave-exposed).
Table 5.
Sand fill and natural geotechnical parameters.
4.5. A-DInSAR Analysis
Satellite SAR images were analyzed in order to derive the past surficial deformational behavior over the entire study area. The analyzed period overlaps with the above-mentioned field monitoring measurement period.
A dataset of 100 high-resolution COSMO-SKyMed (Italian Space Agency—ASI) images acquired between December 2011 and October 2016 in the descending acquisition geometry were used (Figure 1). The dataset was characterized by one main temporal gap between July 2014 and December 2014 (i.e., no measurement data was recorded during that period).
The COSMO-SkyMed images used in this study were acquired in the StripMap HIMAGE mode, characterized by a spatial resolution of 3 × 3 meters and a wavelength of 3.1 cm (X-band).
The multi-temporal interferometric analyses have been carried out using Persistent Scatterers Interferometry (PSI) technique [17,18,21,41] implemented in SARPROZ software [42]. Assuming the Atmospheric Phase Screen (APS) contribution correlated in space and constant for small-scale areas, it was possible to remove the atmospheric component of the signal for the interferometric phase, estimating the non-linear displacement patterns expected in compaction processes.
The master image was selected by minimizing the temporal and perpendicular baselines of the stack, and it corresponds to the SAR image acquired on 10 March 2014. The conventional PSI approach has been carried out according to the following workflow [17,18,21]:
(1) co-registration of the Single Look Complex images;
(2) selection of the Ground Control Point (GCP), used to geo-reference satellite data;
(3) conversion of the external Digital Elevation Model (DEM) in SAR coordinates using the Shuttle Radar Topography Mission (SRTM) DEM with a resolution of 30 m;
(4) differential interferograms processing according to the so-called “star graph” (i.e., a network between all the images formed by connecting the slave images to a single master image to generate interferograms, shown in Figure 1 [21]) using a multi-temporal adaptive filter;
(5) Persistent Scatterer Candidates (PSCs) selection accounting for different parameters. PSCs were selected in order to obtain a homogeneous distribution over the study area. Specifically, 9896 PSCs has been selected accounting for the following parameters:
- Normalized reflectivity value of 1.5 was selected as threshold (i.e., the amplitude temporal average of all images in volts).
- The combination between Amplitude Stability Index (ASI) and spatial coherence (i.e., the average of the cross-correlation coefficients of the SAR image pairs estimated for each pixel using a multi-temporal adaptive filter). ASI is computed with the following formula:where σ and µ are respectively the standard deviation and the mean of amplitude for every pixel of the multi-image dataset and 0.7 was the threshold used for the PSCs selection.ASI = 1 − (σ/µ)
(6) preliminary estimation of velocity and residual height parameters for the PSC concerning a reference point located outside the studied reclaimed land;
(7) Atmospheric Phase Screen (APS) removal considering the residual error from the preliminary estimation;
(8) final estimation of the velocity trend and residual height for the Persistent Scatterers.
The non-linear displacements have been estimated using a non-parametric model with a five-sample weighted moving average filter and assuming that the APS is homogeneous at the local scale.
It is worth mentioning that, by InSAR techniques, displacements are measured along the satellite Line Of Sight (LOS), i.e., the path between the satellite sensor and the target.
Furthermore, the analyses have been performed accounting for the presence of Temporary MP (i.e., a radar target that behaves as a persistent scatterer only for a limited time) [43]. Based on the reflectivity information, the algorithm allows identifying the time interval during which a steady backscattering behavior characterizes the target. Once the stability time interval has been identified, the standard PS approach can be applied, computing the residual height and velocity parameters of temporary targets.
5. Results
5.1. Field Monitoring
Field monitoring by ground survey campaign was carried out to measure the deformations at specific locations on top and behind the outer revetment only during the preloading stage period. The field monitoring survey started on 21 November 2011 and it ended in December 2012; it included several monitoring instruments including surface and deep settlement points and inclinometers. However, in this study, only the results of nine 3D surface survey (settlement) points, noted as MS1 to MS9, were considered to be relevant to the outer revetment deformational behavior. The survey settlement points were rigid short posts fixed in heavy cubical concrete blocks and protected by special casing, placed on the top of the rockfill. A plan view and details of the locations of these survey points are depicted in Figure 8a and b. Moreover, the measurements of these nine SSPs during the preloading period, according to Ali and Ancaja (2015), are shown in Figure 8c. It can be seen that the construction phases (e.g., vibrocompaction and surcharging) influenced the ground displacement considerably in the rockfill before the end of 2012. This monitoring campaign can be considered to be relevant and comparable only to the internal sub-zones of the rockfill as measured by A-DinSAR technique.
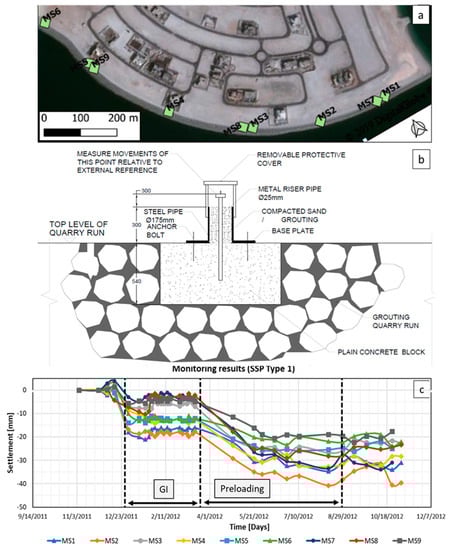
Figure 8.
Plan view (a), typical details (b), and results (c) of the existing settlement monitoring (survey) points. Dimension in (b) is in millimeters. GI stands for ground improvement. The settlement points are located on top of the revetment during the preloading stage over one year.
5.2. Settlement Analysis and Geotechnical Modeling
Based on the aforementioned soil and ground conditions and information, idealized and simplified rockfill-based and sand fill–based models were developed by Settle 3D software [9].
Rockfill model:
an applied load represents the own weight of a 6-m wide and 1m-thick promenade strip foundation was simulated on top of the rockfill, as shown in Figure 2. Since the only long-term settlement was the target of the analyses, the secondary compression (creep) settlement from the rockfill due to the viscous rearrangement of particles was only considered while immediate and consolidation settlement options were unchecked in the model input.
Sand fill model:
initially, a pre-loading surcharge consisting of a two-layers embankment of a total height of 4.0 m with a unit weight of 18 kN/m3 was applied over approximately 5 months. Later, the preloading has been removed and an applied load consisting of a typical raft foundation (30 m × 30 m) with a uniform bearing pressure of 35 kPa was adopted to simulate the net bearing pressures induced by low-rise buildings such as the villas typically existing in the area. This was considered as a typical load for such structures based on the sum of all structural loads divided by the villas’ typical footprint area.
Settle 3D analyses:
Figure 9 illustrates the prediction results of the Settle 3D analysis, for freshly placed rockfill, based on the ground profiles and characteristics discussed in Section 4.4, as well as creep parameters proposed by Ali and Ancaja (2015) [3]. Similar analyses were carried out for the other five subzones of the rockfill. The adopted 6-m wide strip foundation is considered only for the internal zone to represent the promenade slab placed at the end of construction on top of the revetment as shown in Figure 2.
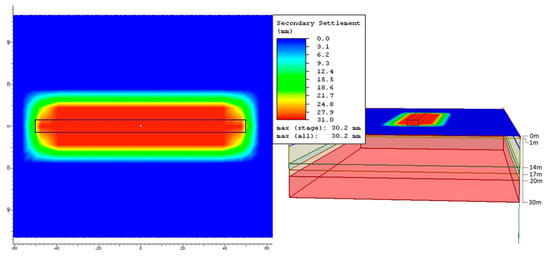
Figure 9.
Settlement analysis of the rockfill profile at the internal zone for freshly placed rockfill with a 24kPa strip foundation was simulated. The plan view is presented on the left side of the figure. The dot in the center of the plan view indicates the query point on which the settlement was calculated. The 3D model is presented on the right side of the figure. The soil layers and their depths are indicated in the 3D model.
Based on these analyses, a general trend of settlement decrease going from the freshly placed rockfill towards to wave-exposed rockfill can be noted in the summary presented in Table 6. Moreover, the total settlement decreases from the internal zone passing to the external zone. The difference between internal and external zones is clearly encountered in the freshly placed rockfill zone and becomes lesser in the wave-exposed rockfill. The largest settlement values are encountered in the internal zone of the freshly placed rockfill while the least recorded settlement is found in the external zone of the wave-exposed rockfill.
Table 6.
Summary of Settle 3D creep settlement results over a period of 50 years.
Similarly, to predict the behavior of the sand fill zones, the settlement analysis shown in Figure 10 was carried out using the geotechnical parameters of the sand fill and the natural ground profile underneath the sand fill (Figure 7). The results focus on the creep settlement computed after the removal of the preloading surcharge load.
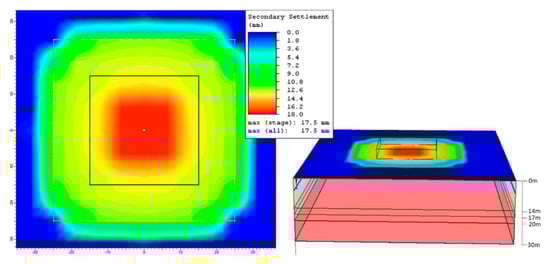
Figure 10.
Settlement analysis of sand fill. A 35kPa uniform pressure zone was adopted after removing of the preloading surcharge. The plan view is presented in the left side of the figure. The dot in the center of the plan view indicates the query point on which the settlement was calculated. The 3D model is presented in the right side of the figure. The soil layers and their depths are indicated in the 3D the model.
The range of obtained creep settlement throughout analysis equal to 50 years, which is the typical design life for low rise building structures, is summarized in Table 6.
5.3. A-DInSAR Results
As discussed above, the A-DInSAR approach allows retrieving the deformational trends of Measurement Points (MPs) with millimeter accuracy. In the A-DInSAR analyses, the Temporary PS approach was found to be fundamental in order to retrieve displacement information of the sand fill area. In fact, as shown in Figure 11b–d, major changes have been observed in the area of interest during the analyzed period, so that a temporary stable backscattering behavior characterizes the majority of MPs in the sand fill. Specifically, referring to Figure 11e, 55% of the MPs were born in 2012, then additional 36% of the MPs were born in 2013, 7% in 2014, and the remaining 1% in 2015.
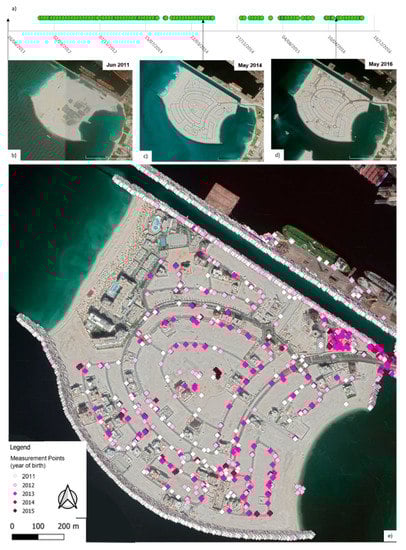
Figure 11.
Changes in the studied area over time. (a) Temporal distribution of satellite SAR images. (b) The studied area in June 2011(from Google Earth, Landsat image). (c) The studied area in May 2014 (from Google Earth, Landsat image). (d) The studied area in May 2016 (from Google Earth, Landsat image). (e) Temporary Measurement Point (MP). The colors identify the year of birth of the MPs. These results are derived using COSMO-SkyMed® PRODUCTS, © ASI (Italian Space Agency)—provided under license of ASI.
The velocity map obtained using A-DInSAR technique is presented in Figure 12. The accuracy in the displacement estimation is ±1.5 mm/year that corresponds to the stability interval (i.e., the interval where the MPs are considered stable). About 35 thousand MPs have been obtained in the study area. A high density of MPs has been obtained for the revetment, and homogeneous distribution of MPs has been retrieved for the sand fill (the central area of the island) and in correspondence of the building structures.
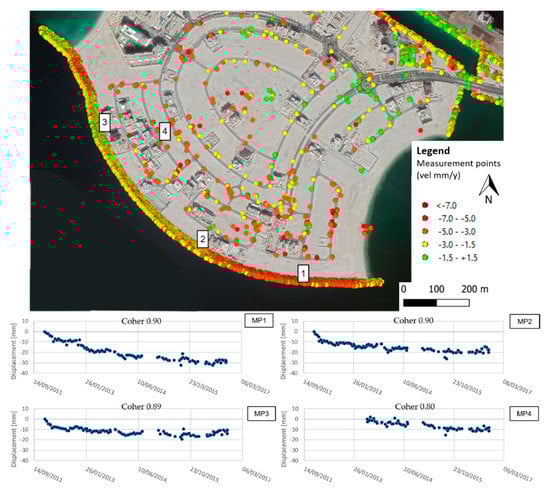
Figure 12.
Advanced Differential Synthetic Aperture Radar Interferometry (A-DInSAR) results, including the average settlement velocity map (in mm/year) and time series of displacement (in millimeters). The color of MPs shows the intensity and values of displacement. Specifically, green points are considered stable (average Line Of Sight (LOS) velocity between 1.5 and −1.5 millimeters per year); while yellow to red color is referred to a movement away from the satellite sensor (i.e., in this specific case, settlements). Time series of displacement of 4 areas located on the revetment and over a structure on the sand fill is reported. Point 4 represents a Temporary MP that became stable in February 2013. Project carried out using COSMO-SkyMed® PRODUCTS, © ASI (Italian Space Agency)—provided under license of ASI.
Four MPs were selected to represent time series in the three rockfill zones (MPs 1 to 3) and sand fill zone (MP 4).
The entire rockfill area (MPs 1 to 3) is characterized by wide spectrum of settlement rate values with an average displacement rate along the LOS of −3.9 mm/year away from the sensor; however, few MPs show displacement rates up to 13–14 mm/year (Figure 13a). MP measurements retrieved in the sand fill area (inner island platform) represented by Point 4, are characterized by an average displacement rate of −2.9 mm/year, with upper bound values reaching up to −12/−13 mm/year (Figure 13b).
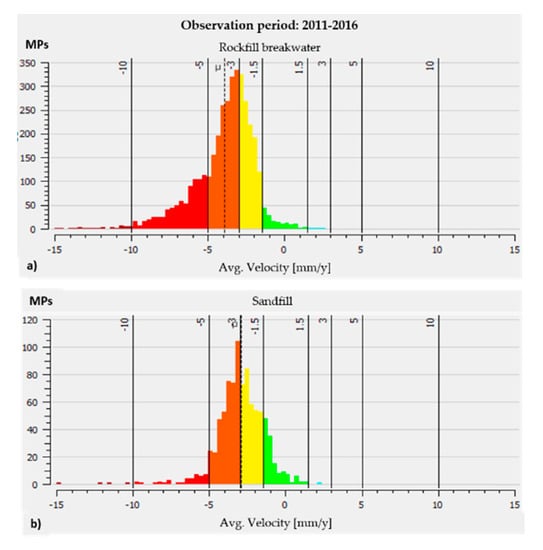
Figure 13.
Histograms representing the average LOS velocity of MPs for the entire rockfill area (a) and the sand fill area (b) over the entire observation period. The colors indicate the amount of displacement. Specifically, green points are considered stable (average LOS velocity between 1.5 and −1.5 millimeters per year), while yellow to red color are referred to as a movement away from the satellite sensor (i.e., in this specific case is associated to settlements). µ (dashed red line) is the average LOS velocity.
The settlement results against the time of the MPs depicted the settlement due to the soil compaction, preloading, structural loading, and finally, creep behavior. As can be seen in the time series shown at the bottom of Figure 12, the settlements observed in correspondence of the breakwater rockfill area (Points 1 to 3) are characterized by a nonlinear displacement behavior, featured by a progressive decrease in the displacement rate over time.
The displacement maps and histograms in Figure 13a,b highlight the settlements’ velocity decrease through time that reached very small settlement rate during the last 2 years of observation (2015–2016). The average settlement rate of the rockfill area passed from −5.0 mm/year over the period 2011–2015 (Figure 13a) to less than −1 mm/y during the period from 2015 to 2016 only (Figure 13b).
From a summary of the settlement results for the entire outer revetment length presented by the histograms in Figure 14, it can be noted that the settlement rate reached up to 5 mm/year, in average, in the first four years (2011–2015), while it decreases considerably in the last two years (2015–2016) when the breakwater is considered stable.
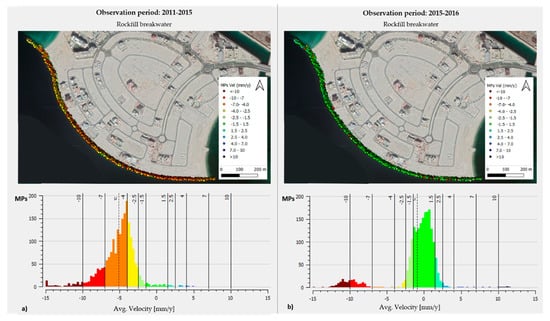
Figure 14.
A-DInSAR results represented in different observation periods. (a) Average velocity map and histogram representing the settlements occurred over the period 2011–2015. (b) The average velocity map and histogram referred to the years 2015–2016 only. The color indicates the amount of displacement. Specifically, green points are considered stable (average LOS velocity between 1.5 and −1.5 millimeters per year); while yellow to red color is referred to a movement in the opposite direction concerning the satellite sensor (i.e., in this specific case is associated to settlements). µ (dashed red line) is the average LOS velocity.
5.4. Comparative Assessment
The results of the comparison between the existing field monitoring data, the settlement numerical analysis and A-DInSAR analyses are shown in Figure 15, Figure 16 and Figure 17.
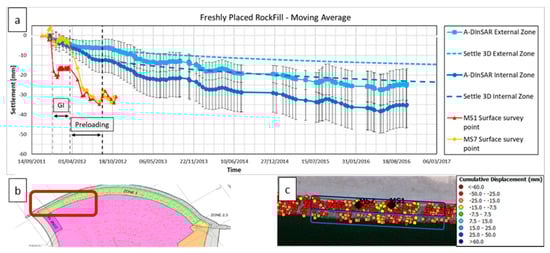
Figure 15.
(a) Diagram showing the data integration in freshly placed rockfill revetment area including the vertical component of A-DInSAR time series of displacement in dark and light blue, Settle 3D creep in dark and light blue dashed line and field monitoring data in red and yellow. Black and grey dashed vertical lines show the working phases. GI stands for ground improvement. (b) Location of the data showed in (a). (c) A-DInSAR derived MPs (red, orange and yellow dots) and field monitoring data (black dots). Light and dark blue boxes show the external and internal zone, respectively.
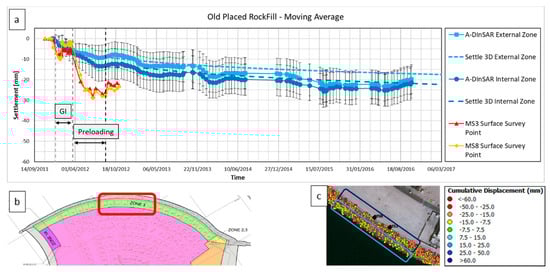
Figure 16.
(a) Diagram showing the data integration in old placed rockfill revetment area including the vertical component of A-DInSAR time series of displacement in dark and light blue, Settle 3D creep in dark and light blue dashed line and field monitoring data in red and yellow. Black and grey dashed vertical lines show the working phases. GI stands for ground improvement. (b) Location of the data showed in (a). (c) A-DInSAR derived MPs (red, orange and yellow dots) and field monitoring data (black dots). Light and dark blue boxes show the external and internal zone, respectively.
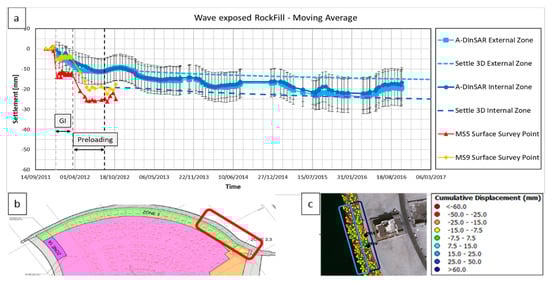
Figure 17.
(a) Diagram showing the data integration in wave-exposed rockfill revetment area including the vertical component of A-DInSAR time series of displacement in dark and light blue, Settle 3D creep in dark and light blue dashed line and field monitoring data in red and yellow. Black and grey dashed vertical lines show the working phases. GI stands for ground improvement. (b) Location of the data showed in (a). (c) A-DInSAR derived MPs (red, orange and yellow dots) and field monitoring data (black dots). Light and dark blue boxes show the external and internal zone, respectively.
The A-DInSAR analyses provide georeferenced Measurement Points (MPs) displacement values that can be easily plotted in a Geographic Information System (in our case the software QGIS). For comparison purposes, MPs located within a 50 m buffer around the field monitoring points were used. The A-DInSAR measurements were referred to the vertical component of the movement using the following formula:
where θ is the Cosmo-SkyMed incidence angle equal to 32.5°.
The moving average of 3 to 5 samples was used to the time axis to neglect the effect of short-term displacement anomalies. The sample population ranged between 50 and 200 MPs in each area. The results were averaged and an error bar equal to 1σ was adopted.
Settle 3D numerical analyses were also carried out to simulate the deformation trend by accounting for secondary settlement of the rockfill using the parameters proposed by Ali and Ancaja (2015) [3]. The secondary settlement started after the removal of the surcharge in the near vicinity of the rockfill, corresponding to the end of the construction works. Trends (creep) lines are plotted together with the A-DInSAR measurements in Figure 15, Figure 16 and Figure 17, for freshly placed rockfill, old placed rockfill and wave-exposed rockfill, respectively.
6. Discussion of the Results
6.1. General Observation
Figure 18, including the average values of the settlement of all subzones of the outer revetment of the analyzed island, shows that the maximum settlements are localized on the internal zone of the freshly placed rockfill, while the other zones experienced a much smaller settlement. During ground improvement (GI) and preloading period, non-linear settlement behavior was observed due to the gradual build-up of the preloading embankment load as shown in Figure 3 and the impact of other construction activities.
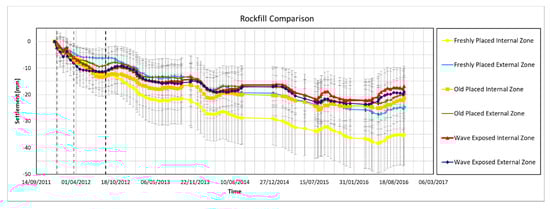
Figure 18.
Comparison of the In-SAR of the six studied subzones.
Apart from the removal of the surcharge (September 2012) period, it seems that the construction works, or the effect of the construction activities had extended up to May 2013. This behavior was unexpected and could not be captured by geotechnical modeling. However, after the removal of preloading embankment and conclusion of all construction by May 2013, mainly linear deformation trend presenting creep was observed in general.
6.2. Land Survey versus A-DInSAR Measurements
The measurements of the field monitoring points mounted on the crest of the revetment (shown by red lines with triangular markers and orange lines with diamond markers in Figure 15, Figure 16 and Figure 17) showed greater settlement during the preloading stages compared to A-DInSAR results, while the A-DInSAR average results indicated less settlements and smoother pattern during the same construction stage. This could be attributed to the difference in locations between field and satellite monitoring points. As a matter of fact, the field monitoring points were placed at the inner edge of the internal zone, on the landside of the revetment crest edge and within the footprint of the preloading embankment (Figure 19), while all selected MPs for the A-DInSAR analyses were taken, on the seaside from the revetment crest edge. MPs at the top of crest (on the same lines of the settlement survey points) were available as the crest was covered by preloading sand embankment (Figure 19) during the early stages of the survey. Therefore, the average rockfill thickness is greater under the field monitoring points compared to the average thickness of the rockfill under the internal zone considered by the satellite A-DInSAR analysis as seen in Figure 19. As such, a greater total (cumulated) settlement would be expected for land monitoring points compared to A-DInSAR MPs. However, it is worth highlighting that the upper boundary of the A-DInSAR derived cumulated settlement, particularly for the wave-exposed (Figure 17) and old-placed rockfill (Figure 16) are matching the cumulated displacement of field monitoring.
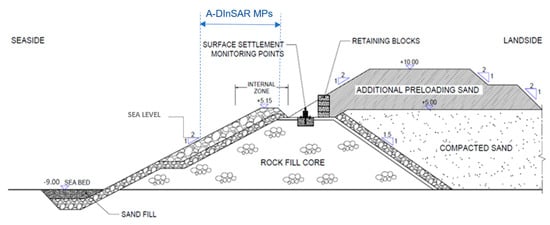
Figure 19.
Typical cross-section in the outer revetment at the location of land survey point during preloading with fill embankment.
Furthermore, we cannot neglect that the high rate of displacements observed by field monitoring during the preloading stage could have caused phase ambiguity problems in the A-DInSAR analysis. In fact, during the period between 15 March 2012 and 13 August 2012, 19.5 mm of average cumulated displacements have been observed by field monitoring. Considering the revisit time of 16 days of the used CSK data stack for the same period and the wavelength (λ) of 3.1 mm, the phase ambiguity threshold is about 15 mm. Only 3 survey points (i.e., MS5, MS6, MS9) are characterized by displacements below the ambiguity threshold during the preloading stage so that the real settlement behavior in correspondence of field monitoring points could be likely underestimated.
6.3. Creep Assessment
During the creep stage, the nonlinear trend of the A-DInSAR results is particularly visible in the internal zones. Settlement in these areas is typically larger than in the external zones; this is clearly noticeable in the freshly placed rockfill, but it slightly less evident in the old placed and wave-exposed rockfill. The range of settlements measured in the post-construction period (September 2012 to October 2016) is summarized in Table 7 with averaged values presented in brackets. The freshly placed rockfill zone was characterized by the larger settlements, with averaged measured values of displacement up to 37 millimeters, while the old placed and wave-exposed rockfill showed similar patterns.
Table 7.
Summary of creep settlement results (predicted versus measured) from September 2012 to October 2016.
It was also noted that the creep (secondary compression) index parameters ( proposed by Ali and Ancaja (2015) [3], that were exclusively based on the field monitoring data, predicted a rather similar creep rate when compared with the A-DInSAR-based settlement results. This was particularly evident for the old-placed and wave-exposed rockfill zones as summarized in Table 8. On the other hand, Ali and Ancaja (2015) [3] predicted a less creep rate for the freshly placed rockfill zone (Figure 15). The relatively shorter monitoring period and a limited number of field monitoring points, in their study, definitely contributed to the discrepancy. This confirms not only the reliability and suitability of A-DInSAR-based settlement results of capturing the creep or settlement rates for the marine environment but also demonstrates the better capability of A-DInSAR to capture long-term deformation rates with respect to field monitoring surveys.
Table 8.
Summary of creep index values based on back analyses of [3] and this study.
In order to update the creep index , a back-analyses was carried out in this study to obtain revised creep parameters only for the freshly placed rockfill. The creep index has been re-evaluated based on the trial and error approach. The previously reported value of 0.00138 by Ali and Ancaja (2015) was increased to be in a range of 0.003 and 0.004, as depicted in Figure 20, to match the A-DInSAR-based long-term settlement results.
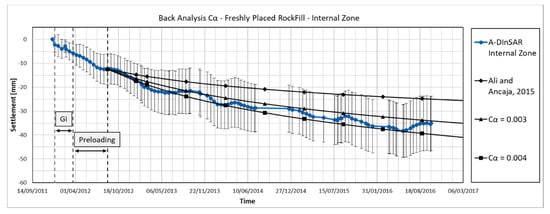
Figure 20.
Results of creep parameter (Cα) after back-analysis for the internal zone of the freshly placed rockfill.
In addition, a selected zone within the reclaimed sand-fill was analyzed. This zone is localized at the center of the island where villas and low-rise structures were being constructed during the period of the study (i.e., between 2011 and 2016). Figure 21 shows the result integration in the selected sand fill zone where the cumulated settlement after end of construction of the island platform and other major construction works, varied between 0.5 and 1.0 mm/year. This rate could represent the overall creep rate of the island platform (sand fill). This settlement rate has a sub-horizontal path indicating the satisfactory sand fill behavior related to the proper ground improvement carried out for the island platform.
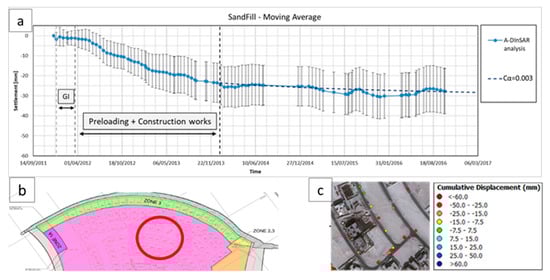
Figure 21.
Results integration in the sand fill area including the A-DInSAR time series of displacement in light blue, Settle 3D back analysis dashed line in blue, overlaying the construction stages (a). At the bottom, the location (b) and the used MPs for the A-DInSAR analyses are shown (c).
Further, the value of the sand-fill has been back-calculated based on the A-DInSAR results thus achieving a value of 0.003 that could represent the creep index of vibro-compacted sand-fill.
6.4. Statistical Evaluation
In order to analyze the statistical significance of the results, statistical F-tests comparing data variances were undertaken for all subzones where the test results of P-value were obtained. The P-value between all pairs in the internal subzones has strongly indicated that significant statistical evidence suggests that the settlement behavior of freshly placed rock bunds is different from the other two zones with (p-value < 0.001) as shown in Table 9 and Table 10. This confirms that the lower deformation in the central and western part of the revetment was significantly influenced by the aging and wave exposure for the old placed zone and extreme waves in wave-exposed rockfill. On the other hand, the behavior of a freshly placed zone is associated with a larger creep rate since the rock bund was not exposed to substantial wave-induced densification and aging.
Table 9.
F-Test two-sample for variances of old placed vs. freshly placed rockfill internal zones.
Table 10.
F-Test two-sample for variances of old placed vs. wave exposed rockfill internal zones.
6.5. Temperature Impact
Another common feature noted in the A-DInSAR results was the cyclic or seasonal fluctuation of the displacement trend. This behavior was typically repeated annually within the period between June to December, where the rate of creep reduced significantly leading, in some cases, to an upheave up to 5 mm. This rockfill behavior have been correlated with temperature variation during the year where the regional temperature can exceed 45 °C in summer. This high rise in temperature was reflected with a not-negligible impact on the rockfill, which experienced a repeated thermal dilatation annually during the extremely hot summer seasons. However, as mentioned above, there have been cases of decreasing trend of settlement that continued until December, which generally has a relatively lower ambient temperature (24–28 °C). This phenomenon can be explained by the thermal hysteresis reflecting in a delay, in the order of one to three months, of the rockfill expansion.
Figure 22 shows the temperature and displacement correlation against time. The long term average deformation of MPs in an area not affected by creep behavior allowed to better identify the thermal expansion component. It can be seen that each temperature peak is related to a seasonal depression of displacement trend but with a few weeks of lag.
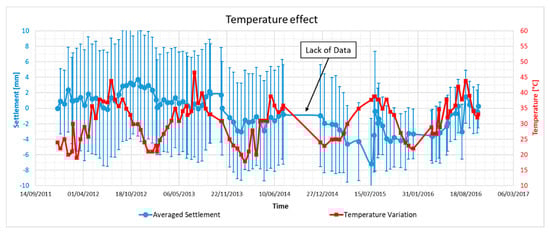
Figure 22.
Temperature variation against time compared with creep settlement fluctuation.
6.6. Aging Effect
On the opposite side of the island where flushing channel separating the island from an old existing breakwater, a more general settlement trend has been inferred from the A-DInSAR results, as shown in Figure 12. A general overview of the obtained A-DInSAR results demonstrated a higher settlement rate in the new revetments and breakwaters compared to the exiting 33-year old breakwater. Having the fact that both structures having rockfill bund with approximately the same depth of 15 m of rockfill but with different placement dates that exceed 30 years, as the nearby old breakwater was reportedly built in 1986 (i.e., 33 years ago).
As shown in Figure 12, a larger displacement rate (up to 5–10 mm/year or 0.7–0.5 mm/year/meter thickness of rockfill) can be observed in the newly constructed outer and inner revetments of the study area while much smaller displacements rates (less than 1 mm/year or 0.07 mm/year/meter thickness of rockfill) can be observed in the 33-year old breakwater area.
7. Conclusions
In this paper, the potential of Satellite Advanced Differential SAR Interferometry (A-DInSAR) for the monitoring of newly developed nearshore artificial islands, i.e. one of the most common constructions in the Middle East, has been demonstrated.
The study focused on the deformation of sand and rock armor surfaces during the early stages before the final construction and during the post-construction. Specifically, most of the measured settlement of the outer revetments had occurred during construction and preloading stages, while only limited time-depended (creep) settlement was noted afterward. The A-DInSAR results were also compared with geotechnical modeling, in order to validate the creep settlements affecting the rockfill part of the artificial island.
The long-term deformational behavior of rubble mount structures and, particularly, the creep settlement was successfully captured by the A-DInSAR analyses of Cosmo-SkyMED satellite images available from 2011 to 2016. The rate of creep settlement matched, in a general view, the values estimated by Ali and Ancaja [3] based on field monitoring of the same site. It is worth mentioning that using several tens of A-DInSAR Measurement Points (MPs) for each studied zone improved the reliability of the settlement results by reducing the disturbance caused by localized movements of large rock stones that, on the other hand, can severely affect the limited and scattered field monitoring points.
The potential of A-DInSAR data for capturing differential settlements caused by geological and geotechnical heterogeneities has been also demonstrated. For example, in Figure 15, it can be noted that the settlements are greater in the inner part of the breakwater with respect to the external part as the thickness of the rockfill core (i.e., the thickness of compressible material) is greater in the inner zone. This behavior is particularly evident for the freshly placed rockfill revetment.
However, the large magnitude and fast settlements occurring during the construction and preloading stages could affect the capability of A-DInSAR technique to obtain accurate displacement measurements due to phase ambiguity limitation. On the other hand, A-DInSAR is very effective to monitor the post-construction deformational behavior of artificial islands and reclaimed lands, bringing added-value information for the understanding and control of compaction processes.
Another important insight was the rockfill long-term creep rate that was found to be heavily dependent on the aging factor. Freshly placed rockfill subjected to preloading experienced creep rate reaching up to 0.4 mm/year per every meter height of rockfill (i.e., a yearly strain of 0.04%) during early construction stages (around three years) while, for the last two years of observation (2015–2016), the creep rate significantly diminished to 0.08 mm/year per every meter height of rockfill. Furthermore, measurements for 33-years old marine breakwater have indicated a creep rate of about 0.07 mm/year per meter of the height of the rockfill. Having rock bunds exposed to heavy waves during placement accelerates the settlement of these bunds, and later, it helped, similarly to aging, in minimizing long-term creep behavior after the end of construction.
Since all outer revetment sections had experienced static compression by preloading, all measured results and findings, presented in this study, shall be corresponding to preloaded rockfill as non-preloaded rockfill bunds may exhibit greater rates of long-term settlement. In this study, the back-analyses of the outer revetment behavior has indicated that creep index can vary between 0.0030 and 0.0040 for freshly placed and preloaded rockfill bunds.
The study also revealed that the exposed rubble mound structures might have been influenced by thermal variations during the hot regions and can experience significant thermal expansion (dilation) during the warm seasons up to 1 mm of every meter of the height of rockfill above mean sea level (or yearly strain of 0.1%). This may not affect structures located on the back slopes of revetments, but it might influence superstructures and utilities laid directly on top elevated breakwaters and revetments.
The compacted sand fill, in general, has experienced less creep rate than rockfill, which led to a limited total settlement that can be easily tolerated by light structures founded on shallow foundations. In other words, the compaction measures (ground improvement) of sand fill and preloading of rockfill have proven to create a competent platform capable of accommodating light structures without the need for costly deep foundations.
Author Contributions
Conceptualization, P.M. and H.E.A.A.; methodology, H.E.A.A.; software, M.D.L. and S.M.; validation, H.E.A.A. and P.M.; formal analysis, M.D.L. and S.M.; resources, P.M. and H.E.A.A.; data curation, M.D.L. and S.M.; writing—original draft preparation, M.D.L.; writing—review and editing, H.E.A.A., S.M., M.D.L., P.M.; visualization, M.D.L. and S.M.; supervision, P.M.; project administration, P.M. and H.E.A.A.; funding acquisition, P.M. All authors have read and agreed to the published version of the manuscript.
Funding
This research received no external funding.
Acknowledgments
The authors would like to thank Marwan Alzaylaie from DDA who supported this work by providing data related to the site-specific conditions. Moreover, special thanks to ASI (Italian Space Agency) for providing the COSMO-SkyMed® satellite images.
Conflicts of Interest
The authors declare no conflict of interest.
References
- Fakhro, E. Land Reclamation in the Arabian Gulf: Security, Environment, and Legal Issues. J. Arab. Stud. 2013, 3, 36–52. [Google Scholar] [CrossRef]
- Martín-Antón, M.; Negro, V.; Del Campo, J.M.; López-Gutiérrez, J.S.; Esteban, M.D. Review of coastal Land Reclamation situation in the World. J. Coast. Res. 2016, 75, 667–671. [Google Scholar] [CrossRef]
- Ali, H.E.A.; Ancaja, J. Time-dependent deformational characteristics of marine-placed rockfill. In Proceedings of the 14th International Conference on Structural & Geotechnical Engineering, ICSGE-14, Cairo, Egypt, 20–22 December 2015. [Google Scholar]
- Jiang, L.; Lin, H. Integrated analysis of SAR interferometric and geological data for investigating long-term reclamation settlement of Chek Lap Kok Airport, Hong Kong. Eng. Geol. 2010, 110, 77–92. [Google Scholar] [CrossRef]
- Sharp, B.N. Consolidation settlement of quay wall, quay aprons and crane rails involving rockfill. In Proceedings of the Institution of Civil Engineers-Water Maritime and Energy, 1996; pp. 118, 177–188. [Google Scholar] [CrossRef]
- Hawkswood, M.; Alsop, N.W.H. Foundations to Precast Marine Structures; Institution of Civil Engineers, Coasts, Marine Structures and Breakwaters: Edinburgh, Scotland, 2009; pp. 16–18. Available online: https://proserveltd.co.uk/pdfs/Foundations-to-Precast-Marine-Structures.pdf (accessed on 29 January 2020).
- Athanasiu, C.; Schram Simonsen, A.; Soereide, O.K.; Tistel, J. Elastic and creep settlements of rock fills. In Proceedings of the 16th International Conference on Soil Mechanics and Geotechnical Engineering; Millpress Science Publishers/IOS Press: Amsterdam, The Netherlands, 2006. [Google Scholar] [CrossRef]
- Parkin, A.K. Creep of Rockfill. In Advances in Rockfill Structures; das Neves, E.M., Ed.; Springer Science+Business Media Dordrecht, B.V.: Berlin/Heidelberg, Germany, 1991; p. 200. [Google Scholar]
- Rocscience Inc. Settle3D—Settlement and Consolidation Analysis Theory Manual; Rocscience Inc.: Toronto, ON, Canada, 2009; Available online: https://www.rocscience.com/help/settle/pdf_files/theory/Settle3D_v4_Theory.pdf (accessed on 29 January 2020).
- Plaxis, Material Models Manual, Plaxis Connect Edition 19. 2019. Available online: https://www.google.com.hk/url?sa=t&rct=j&q=&esrc=s&source=web&cd=1&ved=2ahUKEwjt1Zu0_8jnAhUm-2EKHXwsCSkQFjAAegQIBRAB&url=https%3A%2F%2Fwww.plaxis.com%2F%3Fplaxis_download%3D2D-3-Material-Models.pdf&usg=AOvVaw2gtuJGen4jEwqWk1cpGVri (accessed on 29 January 2020).
- Terzaghi, K. Settlement of structures in Europe and methods of observations. Am. Soc. Civ. Eng. 1937, 1358–1374. Available online: https://cedb.asce.org/CEDBsearch/record.jsp?dockey=0288271 (accessed on 30 January 2020).
- Peck, R.B. Advantages and Limitations of the Observational Method in Applied Soil Mechanics. Géotechnique 1969, 19, 171–187. [Google Scholar] [CrossRef]
- Dunnicliff, J. Geotechnical Instrumentation for Monitoring Field Performance; John Wiley & Sons: Hoboken, NJ, USA, 1993. [Google Scholar]
- Dunnicliff, J. ICE Manual of Geotechnical Engineering; Institution of Civil Engineers: London, UK, 2012; Chapter 95; pp. 1379–1403. [Google Scholar] [CrossRef]
- Mazzanti, P. Geotechnical instrumentation news-Remote monitoring of deformation. An overview of the seven methods described in previous GINs. Geotech. News 2012, 30, 24. [Google Scholar]
- Mazzanti, P. Toward transportation asset management: what is the role of geotechnical monitoring? J. Civ. Struct. Heal. Monit. 2017, 7, 645–656. [Google Scholar] [CrossRef]
- Ferretti, A.; Prati, C.; Rocca, F. Nonlinear subsidence rate estimation using permanent scatterers in differential SAR interferometry. IEEE Trans. Geosci. Remote Sens. 2000, 38, 2202–2212. [Google Scholar] [CrossRef]
- Ferretti, A.; Prati, C.; Rocca, F. Permanent scatterers in SAR interferometry. IEEE Trans. Geosci. Remote Sens. 2001, 39, 8–20. [Google Scholar] [CrossRef]
- Berardino, P.; Fornaro, G.; Lanari, R.; Sansosti, E. A new algorithm for surface deformation monitoring based on small baseline differential SAR interferograms. IEEE Trans. Geosci. Remote Sens. 2003, 40, 2375–2383. [Google Scholar] [CrossRef]
- Hanssen, R.F. Satellite radar interferometry for deformation monitoring: a priori assessment of feasibility and accuracy. Int. J. Appl. Earth Obs. Geoinf. 2005, 6, 253–260. [Google Scholar] [CrossRef]
- Kampes, B.M. Radar Interferometry: Persistent Scatterer Technique. In Remote Sensing and Digital Image Processing; Springer: Dordrecht, The Netherlands, 2006; Available online: https://www.springer.com/gp/book/9781402045769 (accessed on 30 January 2020).
- Ferretti, A.; Fumagalli, A.; Novali, F.; Prati, C.; Rocca, F.; Rucci, A. A New Algorithm for Processing Interferometric Data-Stacks: SqueeSAR. IEEE Trans. Geosci. Remote Sens. 2011, 49, 3460–3470. [Google Scholar] [CrossRef]
- Perissin, D.; Wang, T. Repeat-Pass SAR Interferometry with Partially Coherent Targets. IEEE Trans. Geosci. Remote Sens. 2012, 50, 271–280. [Google Scholar] [CrossRef]
- Bozzano, F.; Esposito, C.; Franchi, S.; Mazzanti, P.; Perissin, D.; Rocca, A.; Romani, E. Understanding the subsidence process of a quaternary plain by combining geological and hydrogeological modelling with satellite InSAR data: The Acque Albule Plain case study. Remote Sens. Environ. 2015, 168, 219–238. [Google Scholar] [CrossRef]
- Bozzano, F.; Esposito, C.; Mazzanti, P.; Patti, M.; Scancella, S. Imaging Multi-Age Construction Settlement Behaviour by Advanced SAR Interferometry. Remote Sens. 2018, 10, 1137. [Google Scholar] [CrossRef]
- Bürgmann, R.; Rosen, P.A.; Fielding, E.J. Synthetic Aperture Radar Interferometry to Measure Earth’s Surface Topography and Its Deformation. Annu. Rev. Earth Planet. Sci. 2000, 28, 169–209. [Google Scholar] [CrossRef]
- Onuma, T.; Berteussen, K.; Fujita, N. Surface Deformation around the Musandam Peninsula Detected by Differential SAR Interferometry, Society of Petroleoum Engineers. In Proceedings of the Abu Dhabi International Petroleoum Exhibition and Conference, Abu Dhabi, UAE, 3–6 November 2008. [Google Scholar] [CrossRef]
- Liosis, N.; Marpu, P.R.; Pavlopoulos, K.; Ouarda, T.B. Ground subsidence monitoring with SAR interferometry techniques in the rural area of Al Wagan, UAE. Remote Sens. Environ. 2018, 216, 276–288. [Google Scholar] [CrossRef]
- Alzaylaie, M.; Abdelaziz, A. Pearl Jumeira project: a case study of land reclamation in Dubai, UAE. Jpn. Geotech. Soc. Spec. Publ. 2016, 2, 1778–1783. [Google Scholar] [CrossRef]
- Kassler, P. The Structural and Geomorphic Evolution of the Persian Gulf. Persian Gulf 1973, 11–32. [Google Scholar]
- Alsharhan, A.S.; Kendall, C.G.C. Holocene coastal carbonates and evaporites of the southern Arabian Gulf and their ancient analogues. Earth Sci. Rev. 2003, 61, 191–243. [Google Scholar] [CrossRef]
- Macklin, S.; Gaba, A. Engineering in the Barzaman formation, coastal Dubai, UAE. In Proceedings of the Institution of Civil Engineers; ICE Publishing: London, UK, 2009. [Google Scholar] [CrossRef]
- Macklin, S.; Ellison, R.; Manning, J.; Farrant, A.; Lorenti, L. Engineering geological characterisation of the Barzaman Formation, with reference to coastal Dubai, UAE. Bull. Eng. Geol. Environ. 2012, 71, 1–19. [Google Scholar] [CrossRef]
- Powers, R.W.; Ramirez, L.F.; Redmond, C.D.; Elberg, E.L. Geology of the Arabian Peninsula, Sedimentary Geology of Saudi Arabia. U.S. GEOLOGICAL SURVEY PROFESSIONAL PAPER 560-D. 1966. Available online: https://pubs.usgs.gov/pp/0560d/report.pdf (accessed on 16 August 2019).
- Shinn, E.A. Submarine lithification of Holocene carbonate sediments in the Persian Gulf. Sedimentology 1969, 12, 109–144. [Google Scholar] [CrossRef]
- Riegl, B.; Poiriez, A.; Janson, X.; Bergman, K.L. The gulf: Facies belts, physical, chemical, and biological parameters of sedimentation on a carbonate ramp. In Carbonate Depositional Systems: Assessing Dimensions and Controlling Parameters; Springer: Dordrecht, The Netherlands, 2010; Available online: https://link.springer.com/chapter/10.1007/978-90-481-9364-6_4#citeas (accessed on 29 October 2019).
- Ministry of Energy-Department of Geology and Mineral Resources - United Arab Emirates, Geology of Dubai, Sharjah and Sir Bu N’Air 1:100000 Map Sheet 100-5. 2012. Available online: https://www.moei.gov.ae/en/our-services/geological-reports/geological-reports.aspx (accessed on 27 October 2019).
- Alzaylaie, M.; Abdelaziz, A. Impact of various assessment procedures on liquefaction potential in reclaimed soil in the Pearl Jumeira project in Dubai. In Proceedings of the 19th Southeast Asian Geotechnical Conference & 2nd AGSSEA Conference (19SEAGC & 2AGSSEA), Kuala Lumpur, Malaysia, 31 May–3 June 2016. [Google Scholar]
- Rockworks, Rockware Earth Science & GIS Software 2221. East St., Suite 101. Available online: https://www.rockware.com/product/rockworks/ (accessed on 29 January 2020).
- Mesri, G.; Ajlouni, M.A.; Feng, T.W.; Lo, D.O.K. Surcharging of soft ground to reduce secondary settlement. In Proceedings of the 3rd International Conference on Soft Soil Engineering, Hong Kong, China, 6–8 December 2001; pp. 55–65. [Google Scholar]
- Crosetto, M.; Monserrat, O.; Gonzales, M.; Devanthery, N.; Crippa, B. Persistent Scatterer Interferometry: A review. ISPRS J. Photogramm. Remote Sens. 2016, 115, 78–79. [Google Scholar] [CrossRef]
- Perissin, D.; Wang, Z.; Wang, T. The SARPROZ InSAR tool for urban subsidence/manmade structure stability. In Proceedings of the 34th ISRSE 2011, Sidney, Australia, 10–15 April 2011. [Google Scholar]
- Ferretti, A.; Colesanti, C.; Perissin, D.; Prati, C.; Rocca, F. Evaluating the Effect of the Observation Time on the Distribution of SAR Permanent Scatterers. In Proceedings of the FRINGE Workshop, Frascati, Italy, 1–5 December 2003. [Google Scholar]
© 2020 by the authors. Licensee MDPI, Basel, Switzerland. This article is an open access article distributed under the terms and conditions of the Creative Commons Attribution (CC BY) license (http://creativecommons.org/licenses/by/4.0/).