UNVI-Based Time Series for Vegetation Discrimination Using Separability Analysis and Random Forest Classification


Abstract
:
1. Introduction
2. Study Area and Data
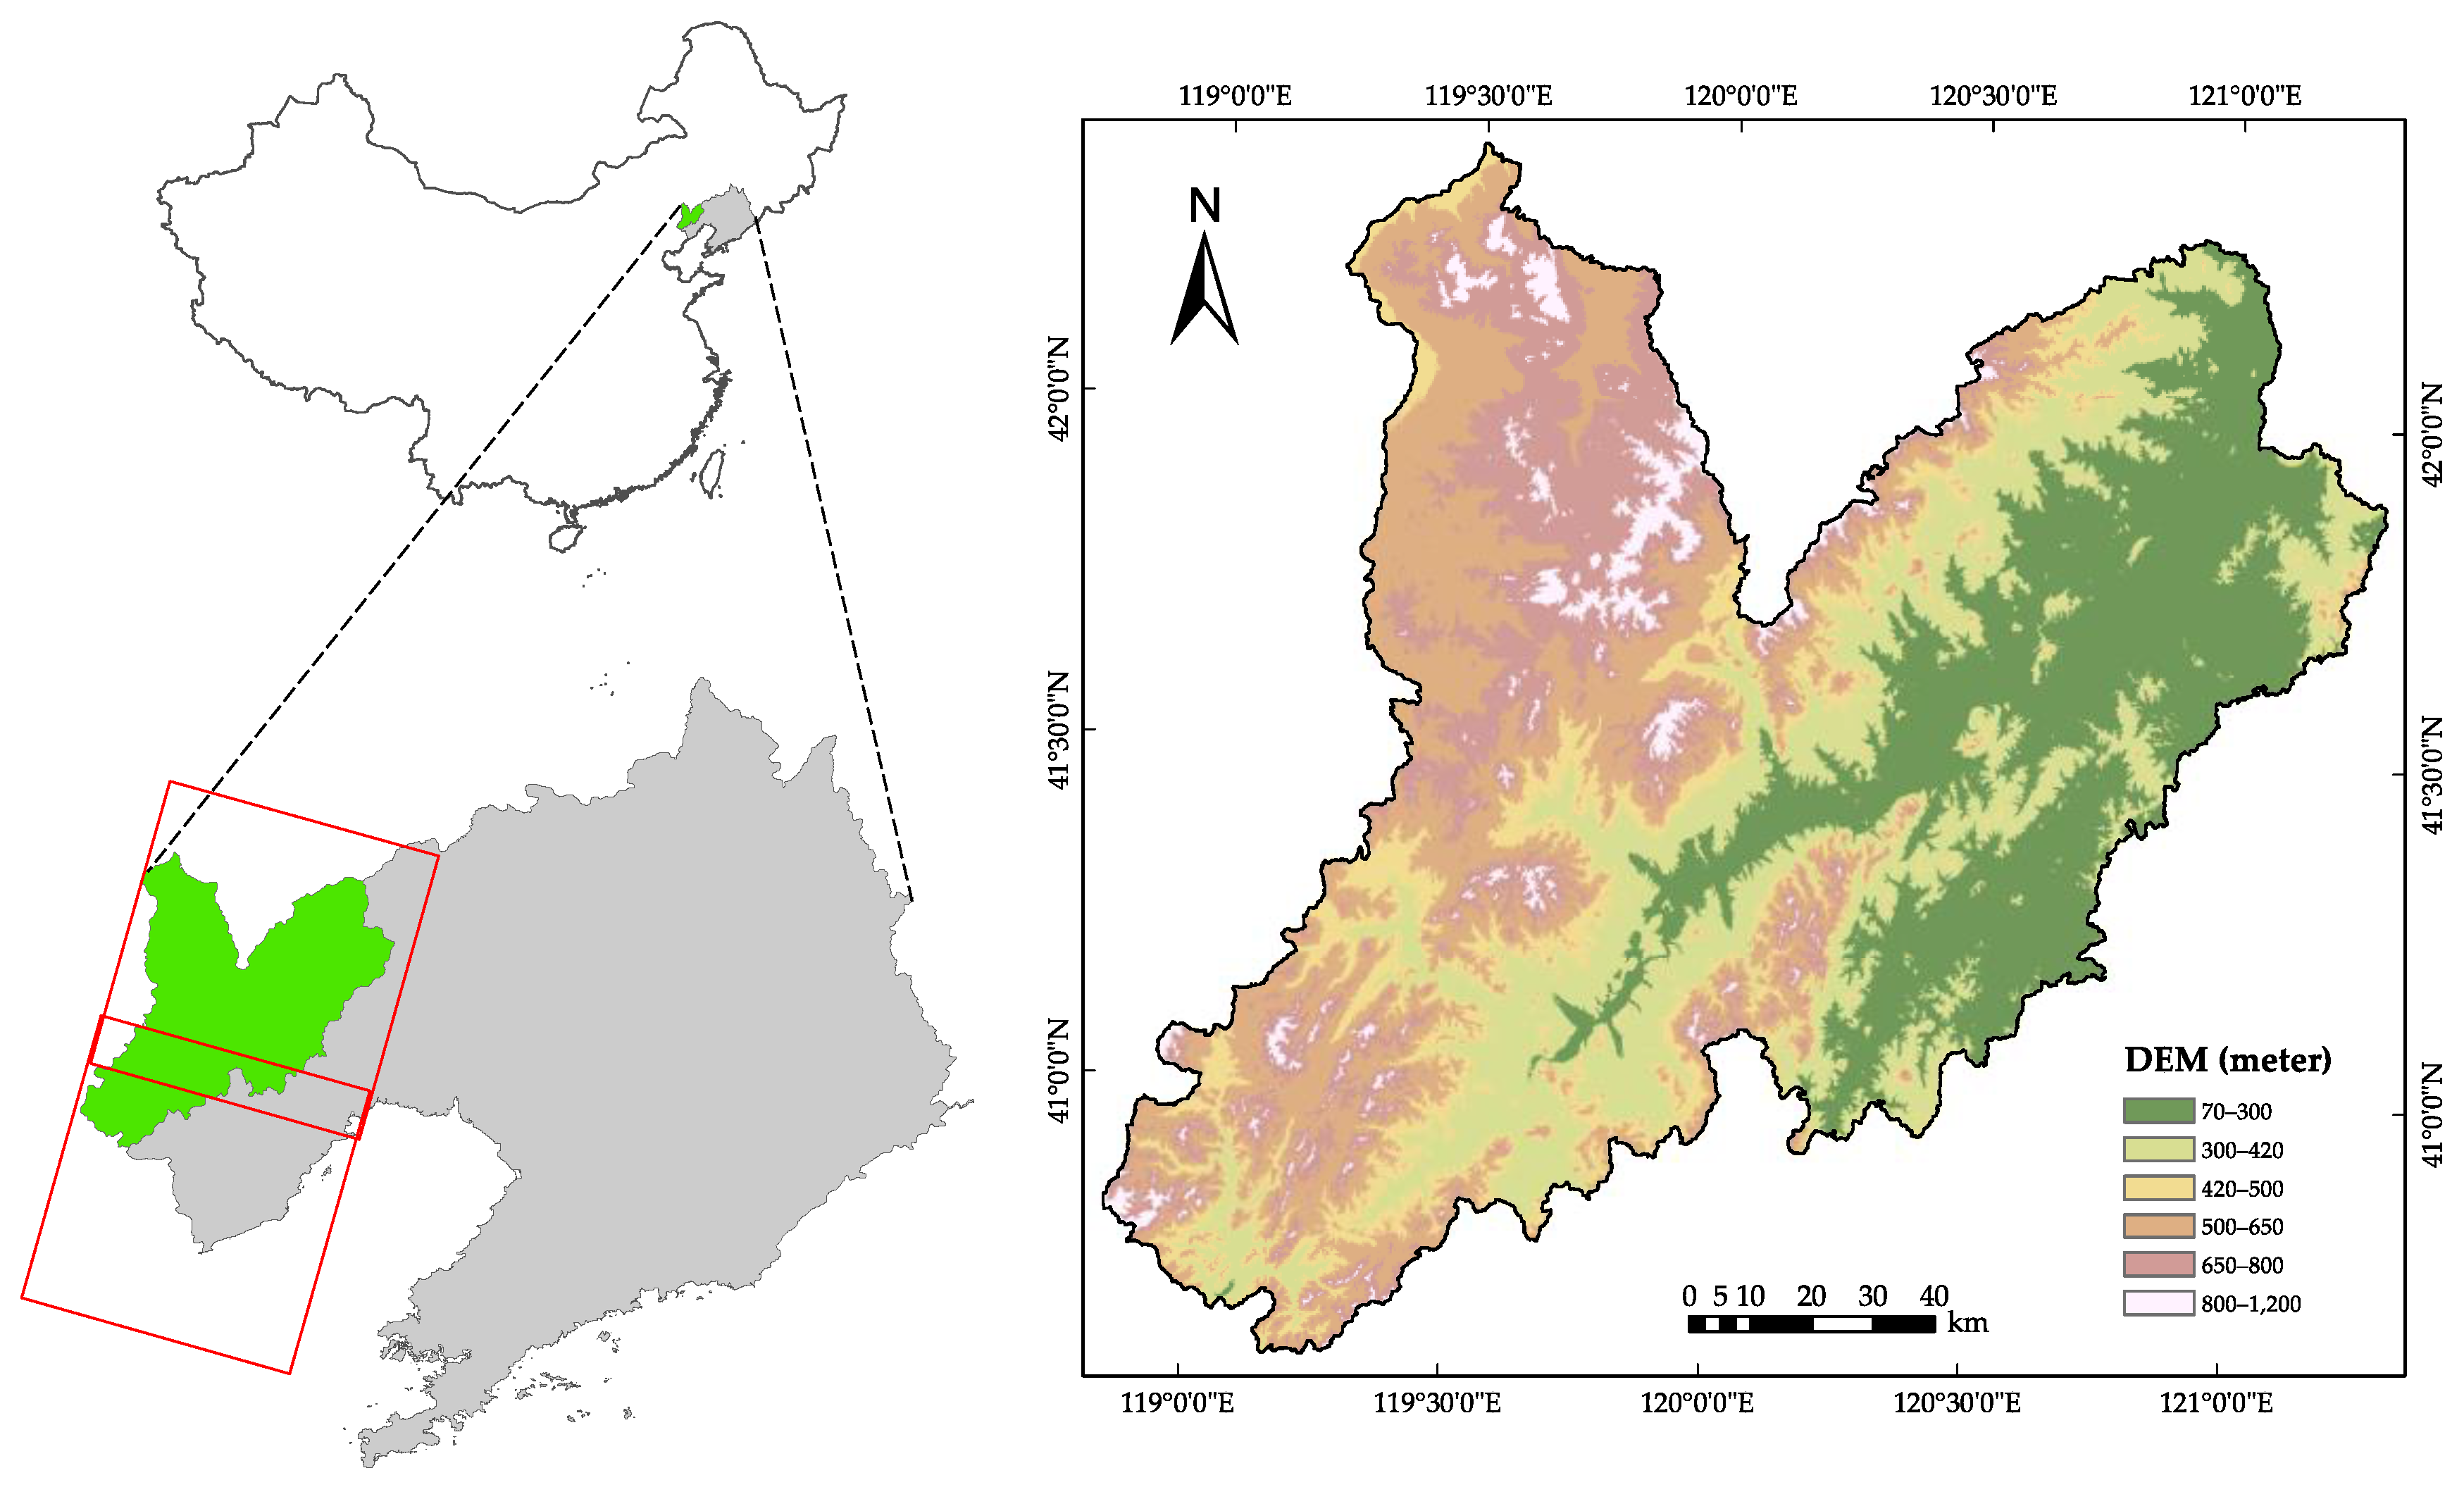
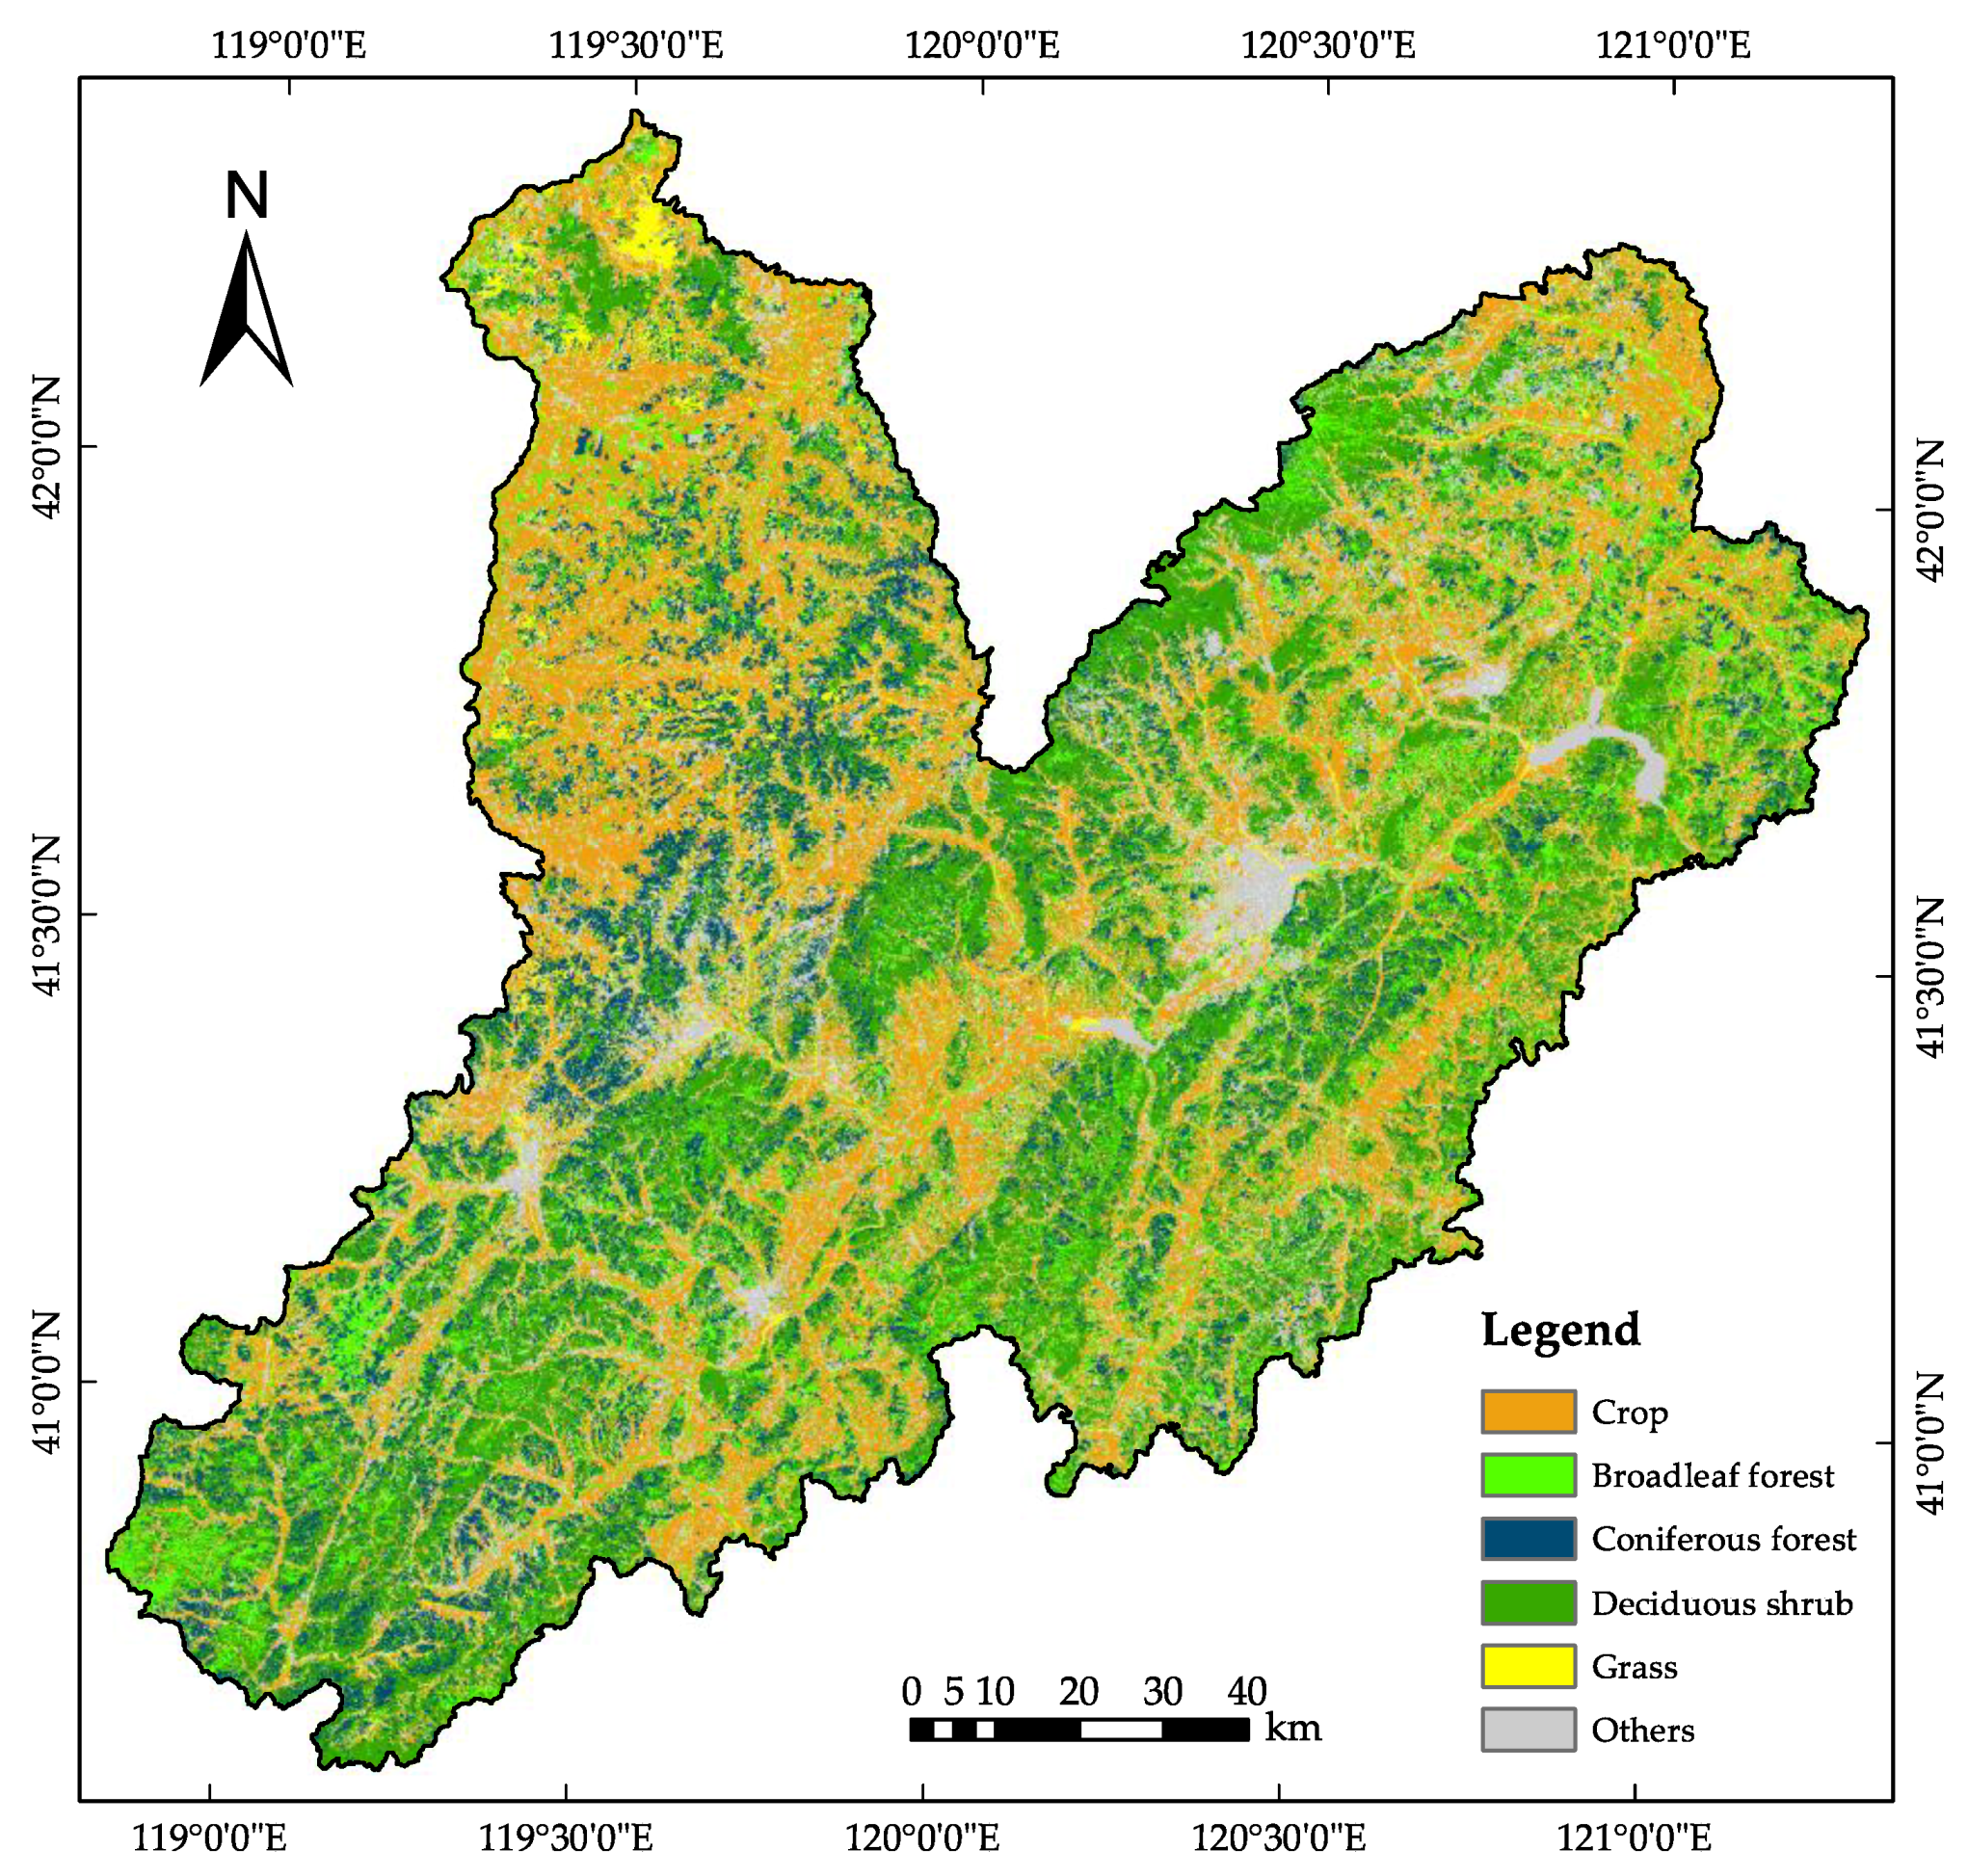
2.1. Study Area
2.2. Geographic Conditions Census Data
2.3. Time-Series Remote Sensing Data
2.4. Vegetation Indices
3. Methods
3.1. Separability Analysis
3.2. Vegetation Classification
3.2.1. Features Used for Classification
3.2.2. Training and Validation
4. Results
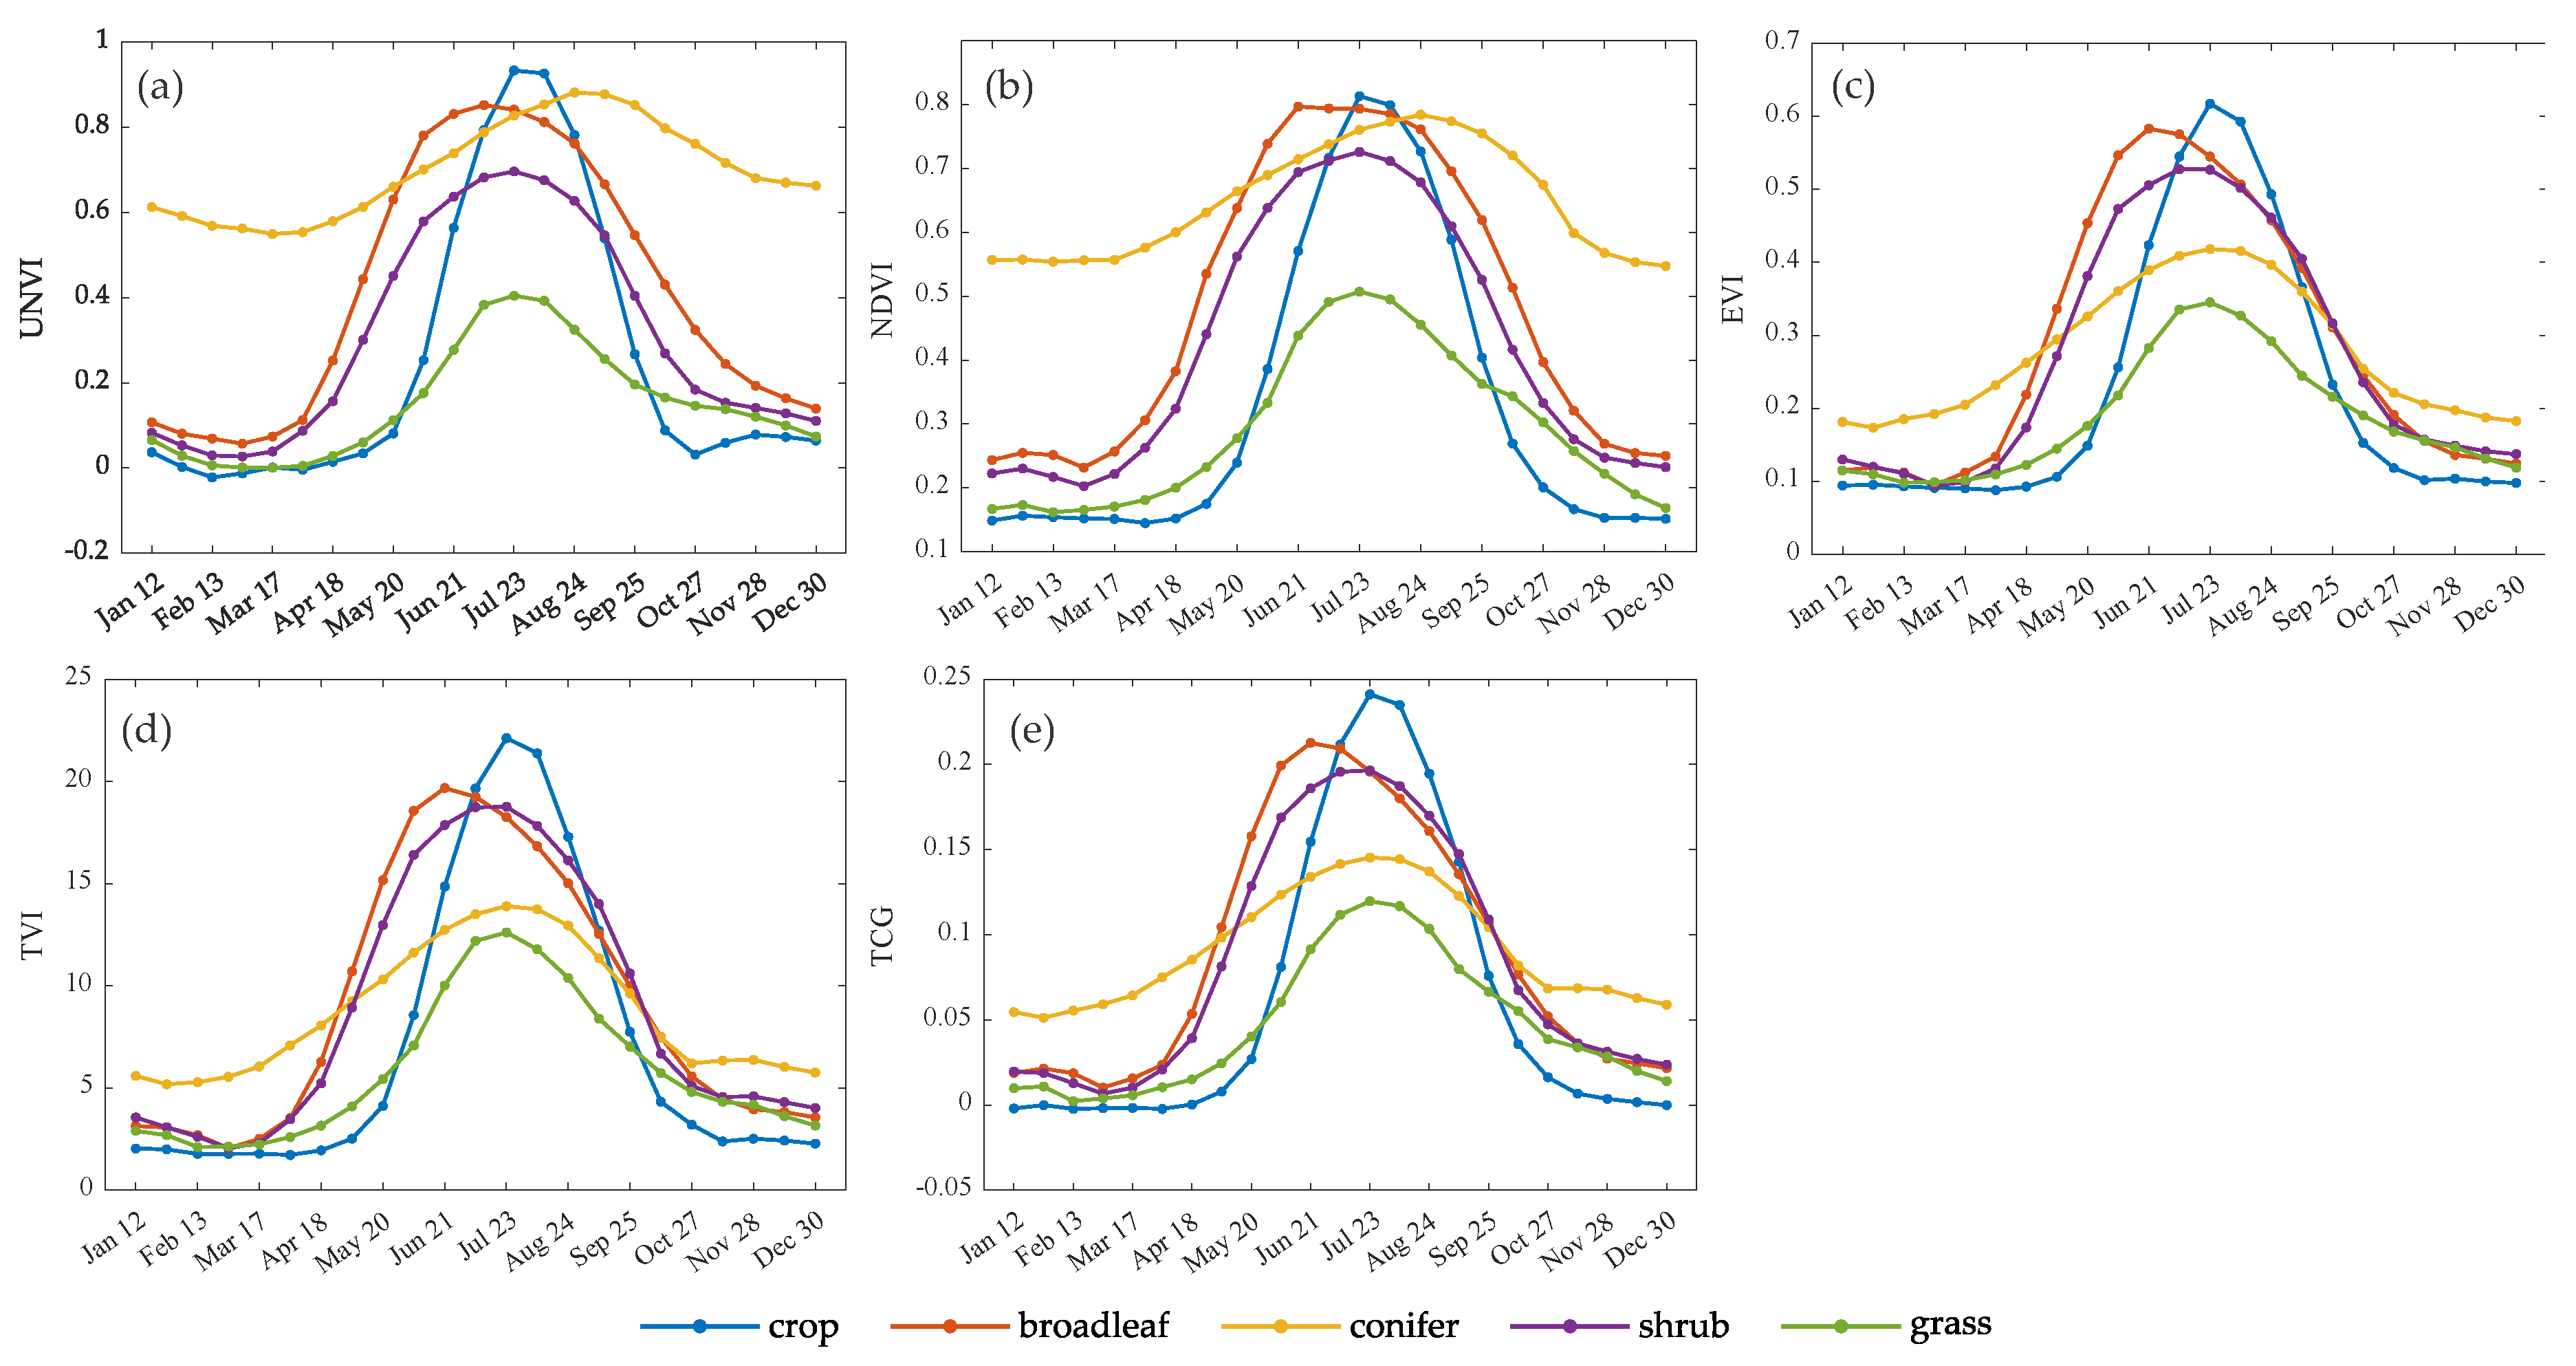
4.1. VI Temporal Profiles
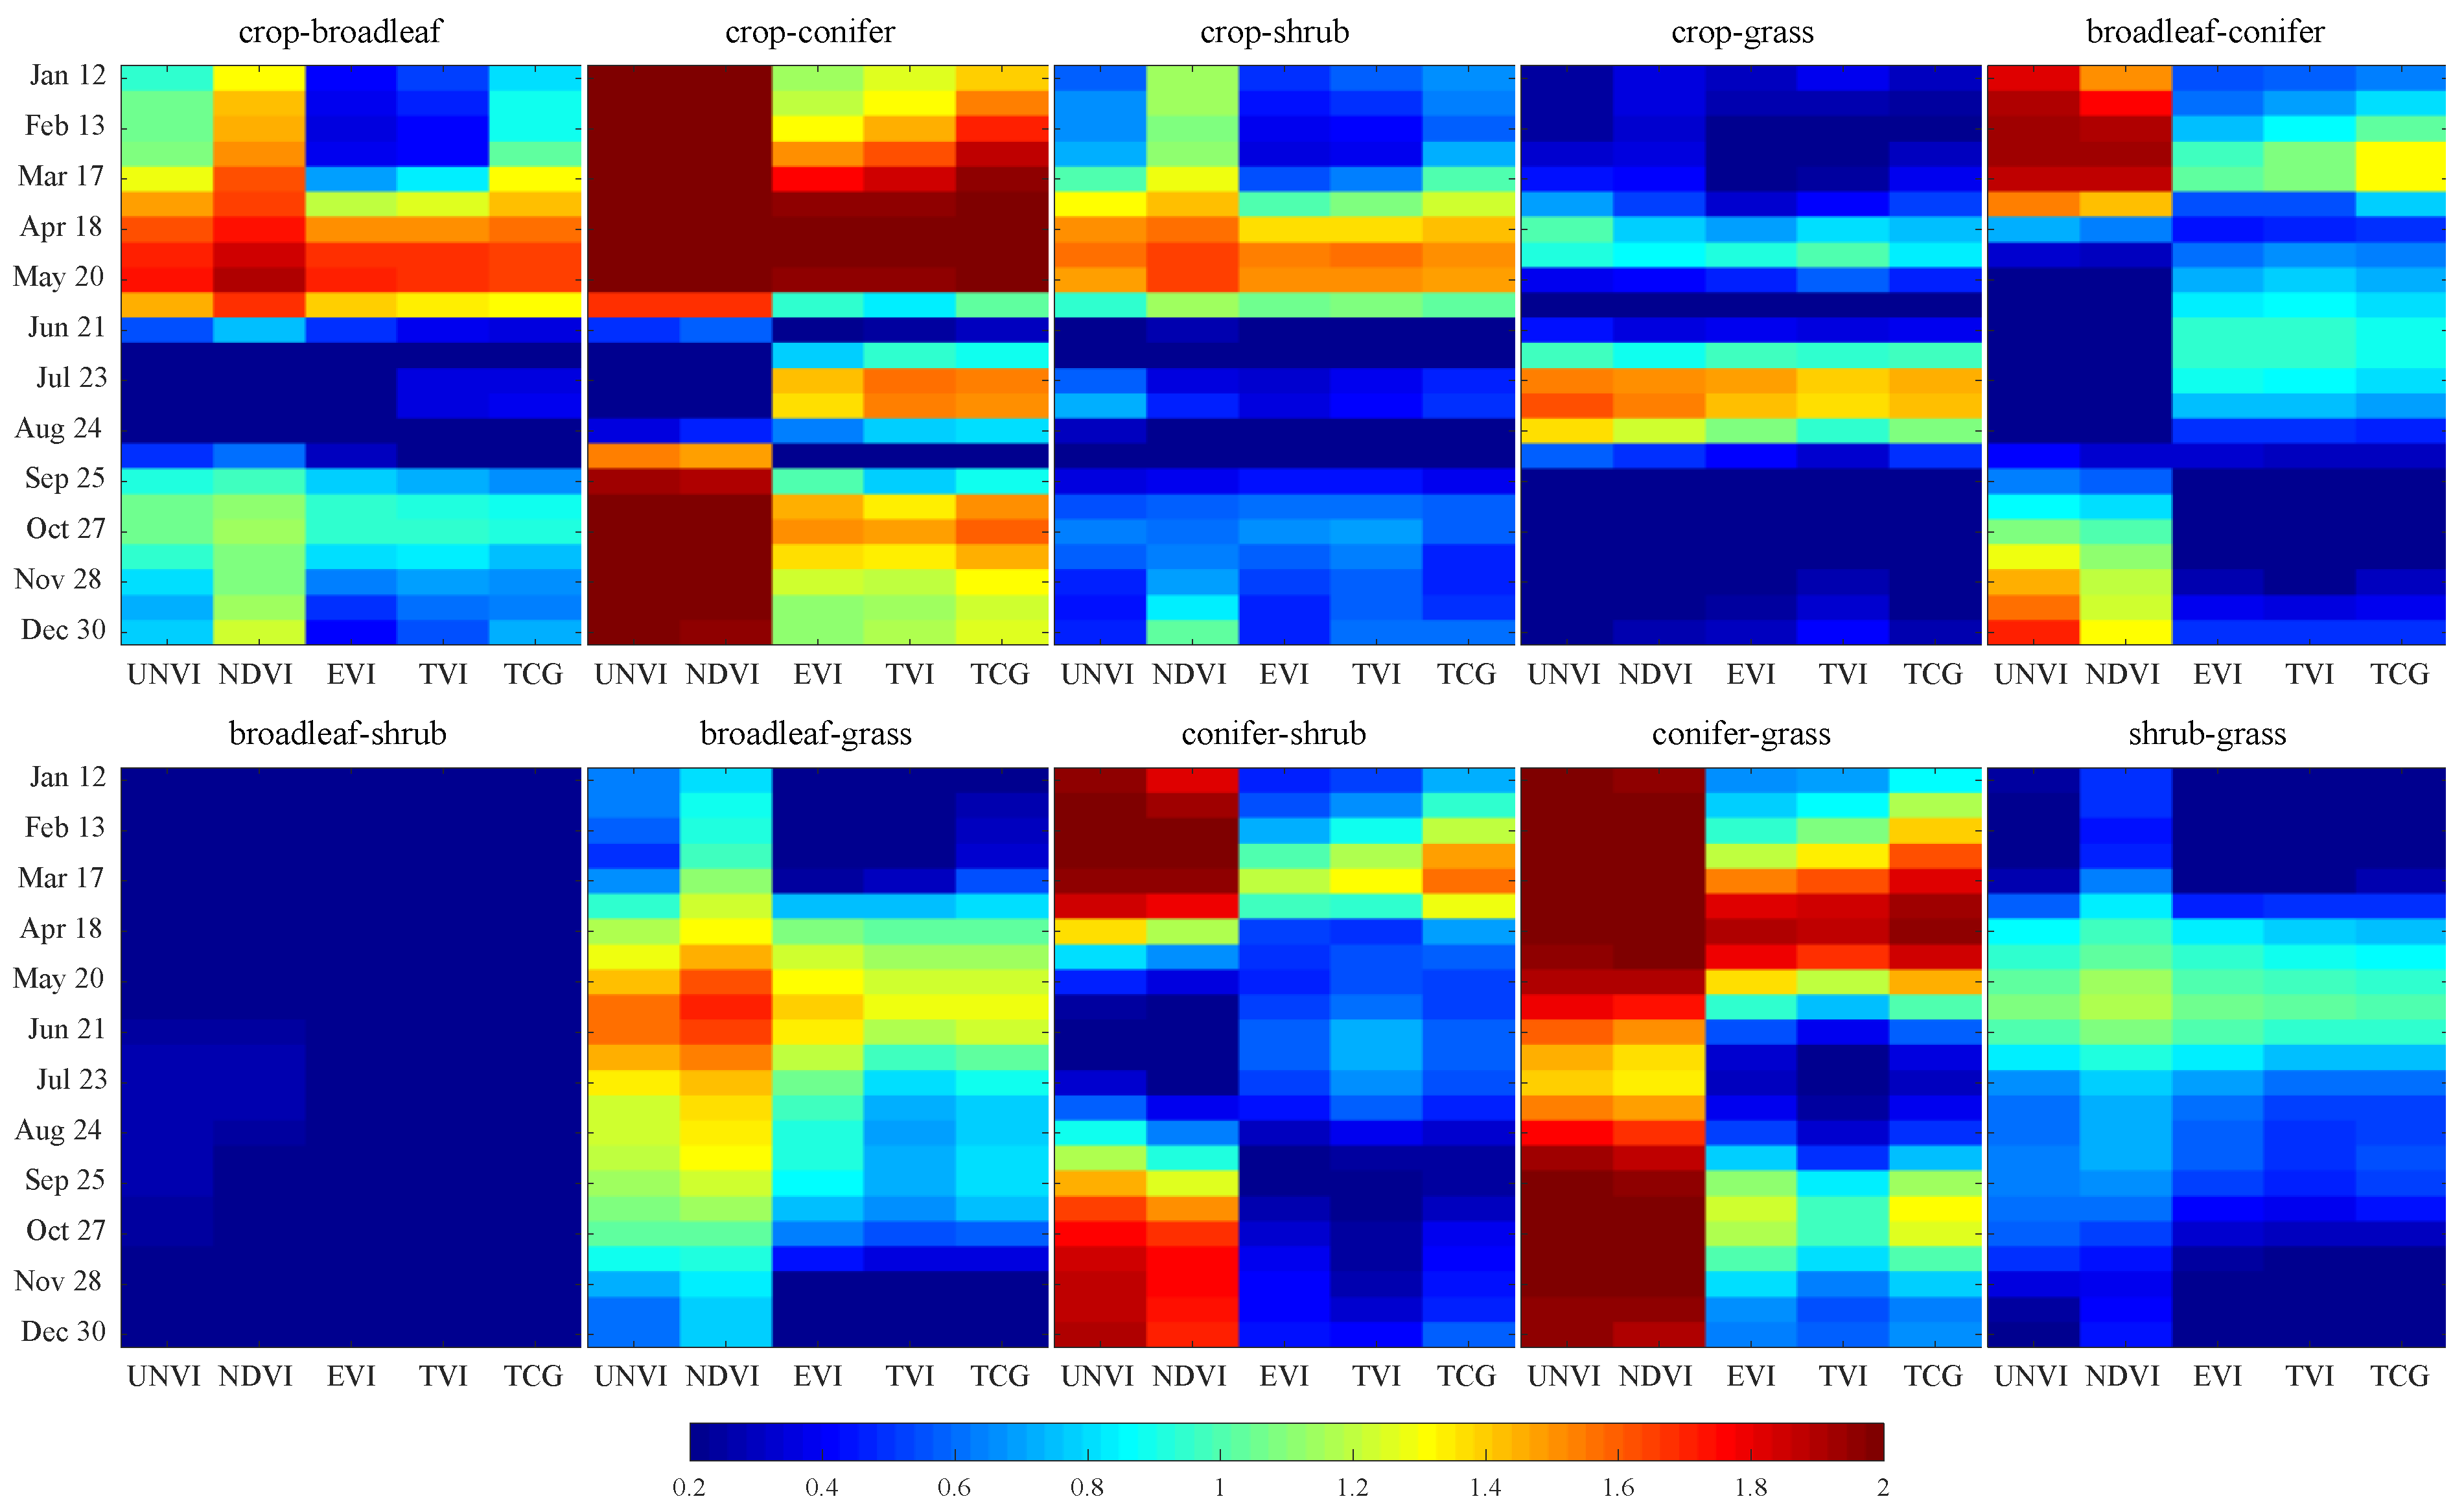
4.2. Pairwise Vegetation Separabilities
4.3. Classification Results and Accuracy Assessment
5. Discussion
6. Conclusions
- For the overall separability of different types of vegetation, the UNVI is superior to EVI, TVI, and TCG, and almost equivalent to NDVI. During the dormant periods, NDVI performs better than UNVI due to the uncertain contribution of soils and yellow leaves to UNVI. However, during the peak of vegetation growing season, UNVI outperforms NDVI, EVI, TVI, and TCG, mainly because of its sensitivity to vegetation dynamics and high saturation point with respect to LAI.
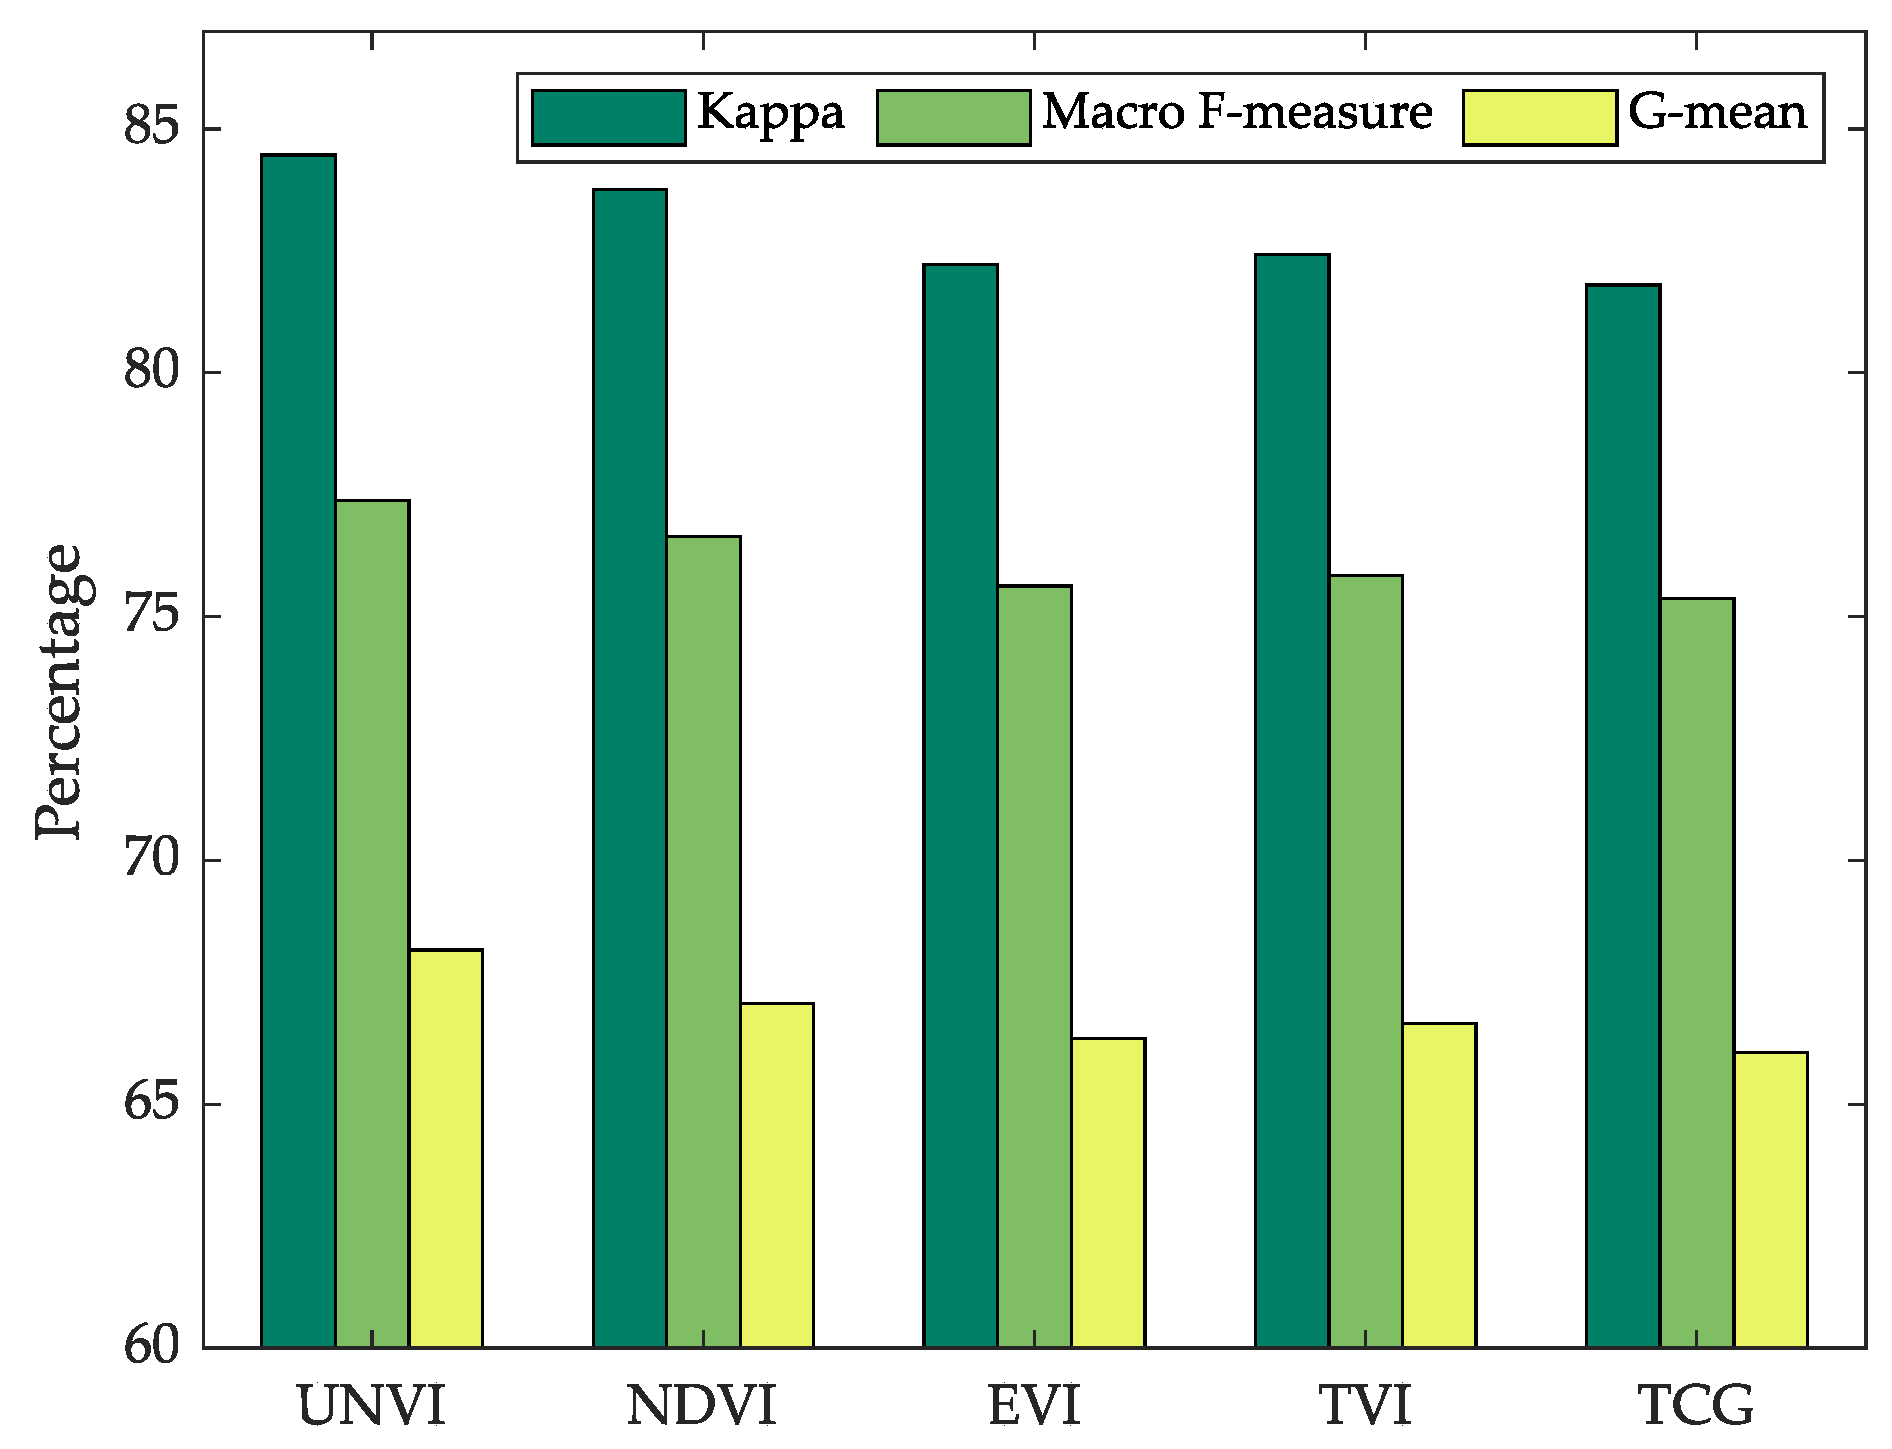
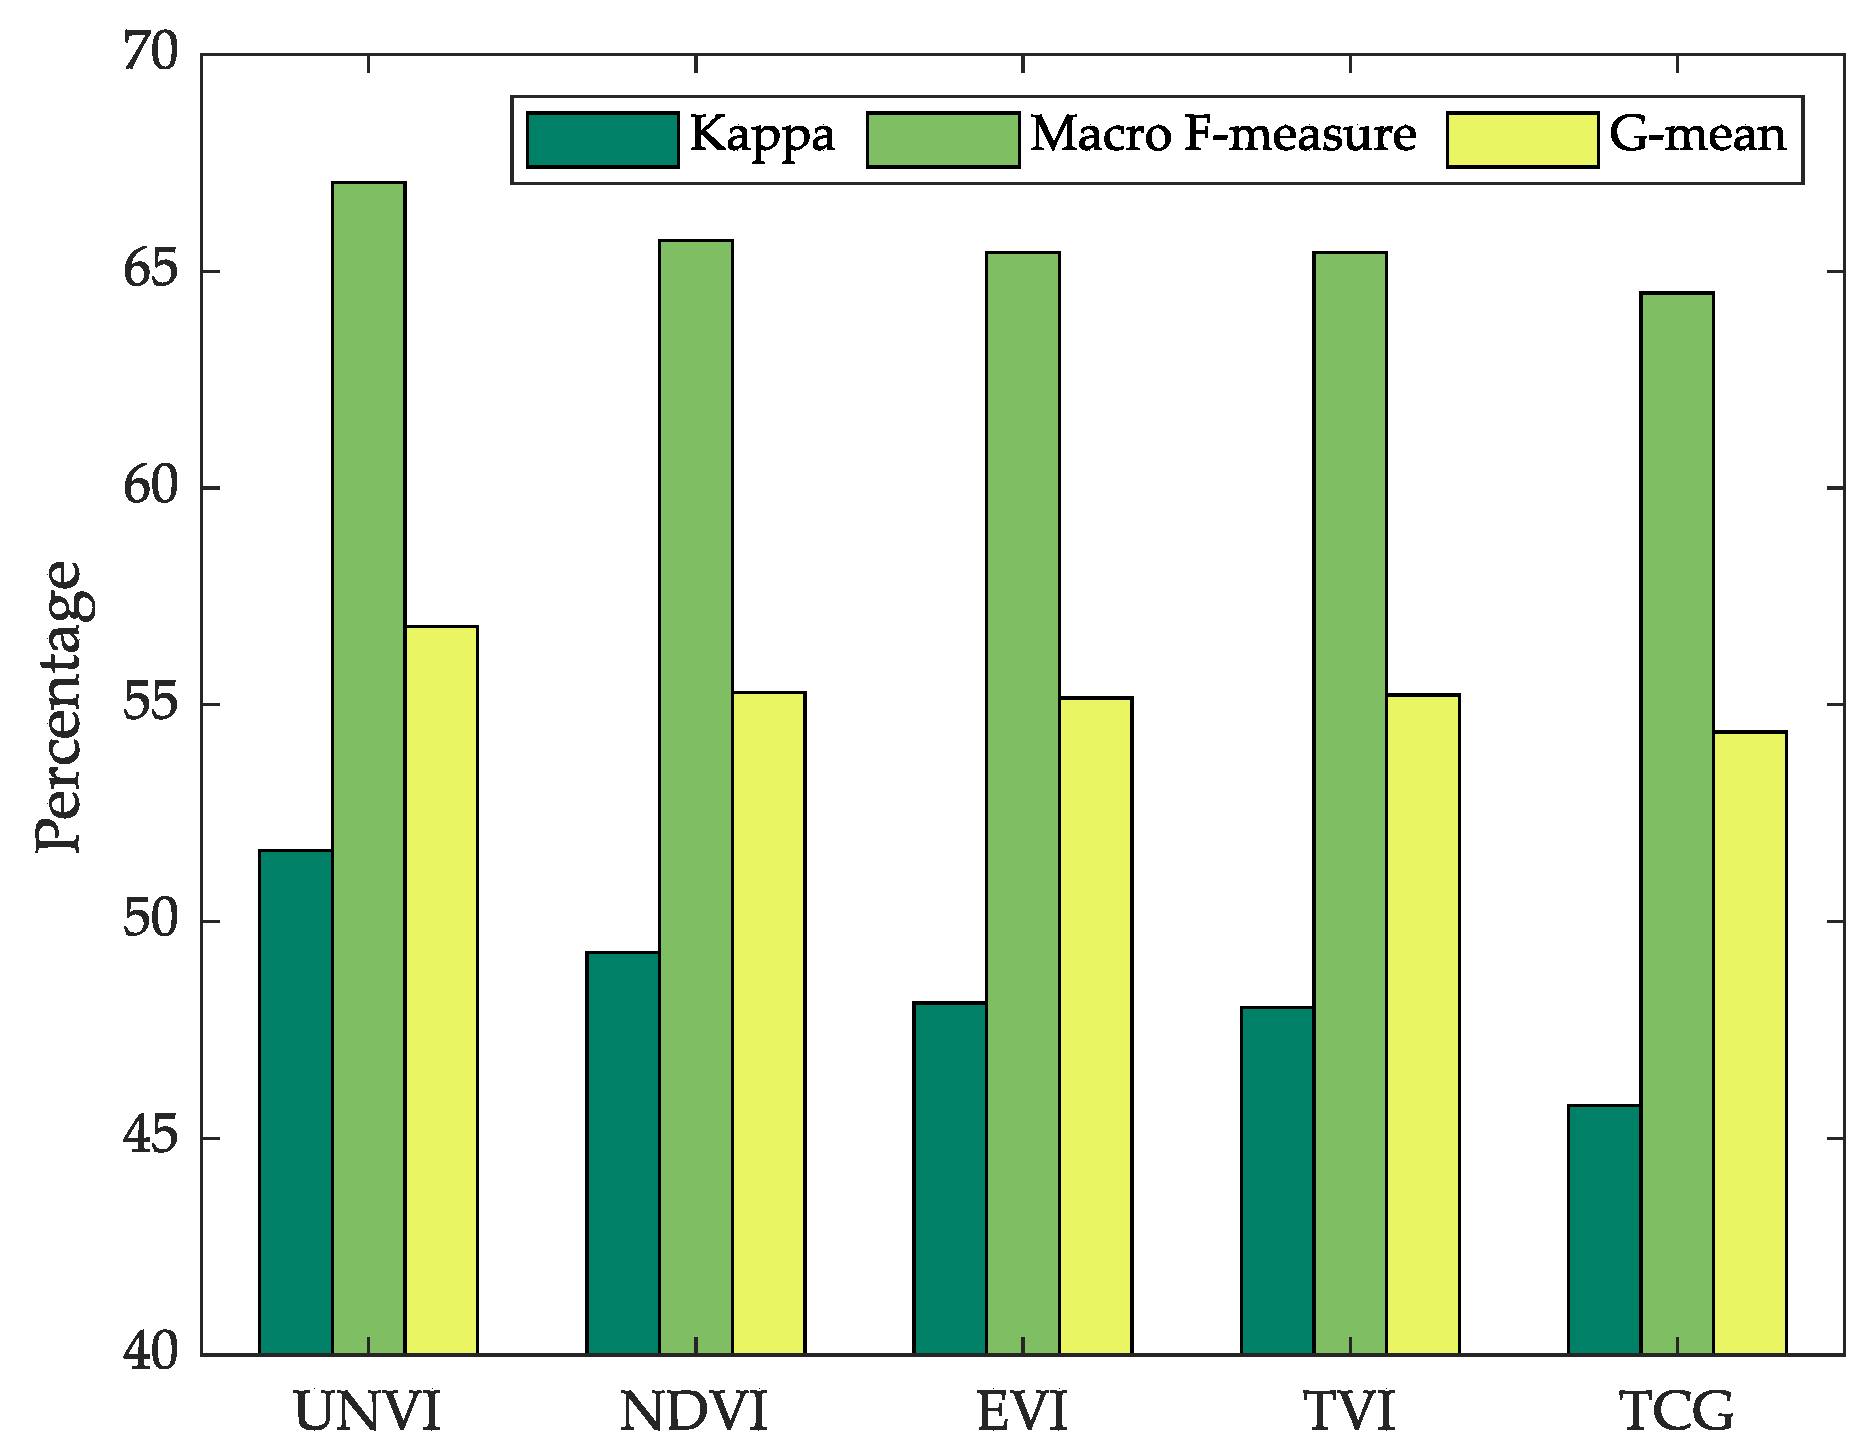
- UNVI times-series and its derived phenological parameters can better classify the five major vegetation classes than NDVI, EVI, TVI, and TCG, indicated by the comparisons of Kappa coefficients, Macro F-measures, and G-means.
- For the most indistinguishable vegetation pair broadleaf and shrub, which differ only in the height of trees, UNVI achieves relatively larger JM distance and higher classification accuracy.
Author Contributions
Funding
Acknowledgments
Conflicts of Interest
References
- Lambin, E.F.; Turner, B.L.; Geist, H.J.; Agbola, S.B.; Angelsen, A.; Bruce, J.W.; Coomes, O.T.; Dirzo, R.; Fischer, G.; Folke, C. The causes of land-use and land-cover change: moving beyond the myths. Glob. Environ. Chang. 2001, 11, 261–269. [Google Scholar] [CrossRef]
- Sellers, P.; Dickinson, R.E.; Randall, D.; Betts, A.; Hall, F.; Berry, J.; Collatz, G.; Denning, A.; Mooney, H.; Nobre, C. Modeling the exchanges of energy, water, and carbon between continents and the atmosphere. Science 1997, 275, 502–509. [Google Scholar] [CrossRef] [PubMed] [Green Version]
- Foody, G.M. Status of land cover classification accuracy assessment. Remote Sens. Environ. 2002, 80, 185–201. [Google Scholar] [CrossRef]
- Franklin, S.; Wulder, M. Remote sensing methods in medium spatial resolution satellite data land cover classification of large areas. Prog. Phys. Geogr. 2002, 26, 173–205. [Google Scholar] [CrossRef]
- Sohl, T.; Sleeter, B. Role of remote sensing for land-use and land-cover change modeling. In Remote sensing of land use and land cover: Principles and applications, 1st ed.; Chandra, P.G., Ed.; CRC Press: Boca Raton, FL, USA, 2012; pp. 225–239. [Google Scholar]
- Zhu, Z.; Woodcock, C.E. Object-based cloud and cloud shadow detection in Landsat imagery. Remote Sens. Environ. 2012, 118, 83–94. [Google Scholar] [CrossRef]
- Gorelick, N.; Hancher, M.; Dixon, M.; Ilyushchenko, S.; Thau, D.; Moore, R. Google Earth Engine: Planetary-scale geospatial analysis for everyone. Remote Sens. Environ. 2017, 202, 18–27. [Google Scholar] [CrossRef]
- Wolter, P.T.; Mladenoff, D.J.; Host, G.E.; Crow, T.R. Improved Forest Classification in the Northern Lake States Using Multi-Temporal Landsat Imagery. Photogramm. Eng. Remote Sens. 1995, 61, 1129–1143. [Google Scholar]
- Conese, C.; Maselli, F. Use of multitemporal information to improve classification performance of TM scenes in complex terrain. Isprs J. Photogramm. Remote Sens. 1991, 46, 187–197. [Google Scholar] [CrossRef]
- Wardlow, B.D.; Egbert, S.L.; Kastens, J.H. Analysis of time-series MODIS 250m vegetation index data for crop classification in the U.S. Central Great Plains. Remote Sens. Environ. 2007, 108, 290–310. [Google Scholar] [CrossRef] [Green Version]
- Carrasco, L.; O’Neil, A.W.; Morton, R.D.; Rowland, C.S. Evaluating Combinations of Temporally Aggregated Sentinel-1, Sentinel-2 and Landsat 8 for Land Cover Mapping with Google Earth Engine. Remote Sens. 2019, 11, 288. [Google Scholar] [CrossRef] [Green Version]
- Kong, F.; Li, X.; Wang, H.; Xie, D.; Li, X.; Bai, Y. Land Cover Classification Based on Fused Data from GF-1 and MODIS NDVI Time Series. Remote Sens. 2016, 8, 741. [Google Scholar] [CrossRef] [Green Version]
- Knight, J.F.; Lunetta, R.S.; Ediriwickrema, J.; Khorram, S. Regional scale land cover characterization using MODIS-NDVI 250 m multi-temporal imagery: A phenology-based approach. Giscience Remote Sens. 2006, 43, 1–23. [Google Scholar] [CrossRef]
- Brown, J.C.; Kastens, J.H.; Coutinho, A.C.; Victoria, D.D.C.; Bishop, C.R. Classifying multiyear agricultural land use data from Mato Grosso using time-series MODIS vegetation index data. Remote Sens. Environ. 2013, 130, 39–50. [Google Scholar] [CrossRef] [Green Version]
- Clark, M.L.; Aide, T.M.; Grau, H.R.; Riner, G. A scalable approach to mapping annual land cover at 250 m using MODIS time series data: A case study in the Dry Chaco ecoregion of South America. Remote Sens. Environ. 2010, 114, 2816–2832. [Google Scholar] [CrossRef]
- Senf, C.; Pflugmacher, D.; Van Der Linden, S.; Hostert, P. Mapping rubber plantations and natural forests in Xishuangbanna (Southwest China) using multi-spectral phenological metrics from MODIS time series. Remote Sens. 2013, 5, 2795–2812. [Google Scholar] [CrossRef] [Green Version]
- Arvor, D.; Jonathan, M.; Meirelles, M.S.P.; Dubreuil, V.; Durieux, L. Classification of MODIS EVI time series for crop mapping in the state of Mato Grosso, Brazil. Int. J. Remote Sens. 2011, 32, 7847–7871. [Google Scholar] [CrossRef]
- Gong, P.; Wang, J.; Yu, L.; Zhao, Y.; Zhao, Y.; Liang, L.; Niu, Z.; Huang, X.; Fu, H.; Liu, S. Finer resolution observation and monitoring of global land cover: First mapping results with Landsat TM and ETM+ data. Int. J. Remote Sens. 2013, 34, 2607–2654. [Google Scholar] [CrossRef] [Green Version]
- do Nascimento Bendini, H.; Garcia Fonseca, L.M.; Schwieder, M.; Sehn Körting, T.; Rufin, P.; Del Arco Sanches, I.; Leitão, P.J.; Hostert, P. Detailed agricultural land classification in the Brazilian cerrado based on phenological information from dense satellite image time series. Int. J. Appl. Earth Obs. Geoinf. 2019, 82, 101872. [Google Scholar] [CrossRef]
- Verbesselt, J.; Hyndman, R.; Newnham, G.; Culvenor, D. Detecting trend and seasonal changes in satellite image time series. Remote Sens. Environ. 2010, 114, 106–115. [Google Scholar] [CrossRef]
- Hu, Q.; Wu, W.; Song, Q.; Lu, M.; Chen, D.; Yu, Q.; Tang, H. How do temporal and spectral features matter in crop classification in Heilongjiang Province, China? J. Integr. Agric. 2017, 16, 324–336. [Google Scholar] [CrossRef]
- Broge, N.H.; Leblanc, E. Comparing prediction power and stability of broadband and hyperspectral vegetation indices for estimation of green leaf area index and canopy chlorophyll density. Remote Sens. Environ. 2001, 76, 156–172. [Google Scholar] [CrossRef]
- Zhang, L.; Qiao, N.; Baig, M.H.A.; Huang, C.; Lv, X.; Sun, X.; Zhang, Z. Monitoring vegetation dynamics using the universal normalized vegetation index (UNVI): An optimized vegetation index-VIUPD. Remote Sens. Lett. 2019, 10, 629–638. [Google Scholar] [CrossRef]
- Zhang, L.; Furumi, S.; Muramatsu, K.; Fujiwara, N.; Daigo, M.; Zhang, L. A new vegetation index based on the universal pattern decomposition method. Int. J. Remote Sens. 2007, 28, 107–124. [Google Scholar] [CrossRef]
- Liu, K.; Su, H.; Zhang, L.; Yang, H.; Zhang, R.; Li, X. Analysis of the Urban Heat Island Effect in Shijiazhuang, China Using Satellite and Airborne Data. Remote Sens. 2015, 7, 4804–4833. [Google Scholar] [CrossRef] [Green Version]
- Jiao, W.; Zhang, L.; Chang, Q.; Fu, D.; Cen, Y.; Tong, Q. Evaluating an enhanced vegetation condition index (VCI) based on VIUPD for drought monitoring in the continental United States. Remote Sens. 2016, 8, 224. [Google Scholar] [CrossRef] [Green Version]
- Jiang, H.L.; Yang, H.; Chen, X.P.; Wang, S.D.; Li, X.K.; Liu, K.; Cen, Y. Research on Accuracy and Stability of Inversing Vegetation Chlorophyll Content by Spectral Index Method. Spectrosc. Spectr. Anal. 2015, 35, 975. [Google Scholar]
- Zhang, J.; Li, W.; Zhai, L. Understanding geographical conditions monitoring: a perspective from China. Int. J. Digit. Earth 2015, 8, 38–57. [Google Scholar] [CrossRef]
- The National Survey of Geographical Conditions Leading Group Office, S.C., P.R.C. General Situation and Index of Geographical Conditions (Chinese Manual, GDPJ 01-2013); The National Survey of Geographical Conditions Leading Group Office, Sate Council, P.R.C: Beijing, China, 2013. [Google Scholar]
- Zhang, T.; Lei, B.; Gan, Y.; Hu, Y.; Liu, K. National satellite image coverage using overall planning technique. In Proceedings of the 2016 IEEE International Geoscience and Remote Sensing Symposium (IGARSS), Beijng, China, 10–15 July 2016; pp. 5488–5491. [Google Scholar]
- Zhang, L.; Furumi, S.; Muramatsu, K.; Fujiwara, N.; Daigo, M.; Zhang, L. Sensor-independent analysis method for hyperspectral data based on the pattern decomposition method. Int. J. Remote Sens. 2006, 27, 4899–4910. [Google Scholar] [CrossRef]
- Rouse, J.W.; Haas, R.H.; Deering, D.W.; Schell, J.A.; Harlan, J.C. Monitoring the vernal advancement and retrogradation (green wave effect) of natural vegetation; E73-10693; NASA: Greenbelt, MD, USA, 1973; p. 112. [Google Scholar]
- Liu, H.Q.; Huete, A. A feedback based modification of the NDVI to minimize canopy background and atmospheric noise. IEEE Trans. Geosci. Remote Sens. 1995, 33, 457–465. [Google Scholar] [CrossRef]
- Baig, M.H.A.; Zhang, L.; Tong, S.; Tong, Q. Derivation of a tasselled cap transformation based on Landsat 8 at-satellite reflectance. Remote Sens. Lett. 2014, 5, 423–431. [Google Scholar] [CrossRef]
- Huete, A.; Liu, H.; Batchily, K.; Van Leeuwen, W. A comparison of vegetation indices over a global set of TM images for EOS-MODIS. Remote Sens. Environ. 1997, 59, 440–451. [Google Scholar] [CrossRef]
- Yeom, J.; Han, Y.; Kim, Y. Separability analysis and classification of rice fields using KOMPSAT-2 High Resolution Satellite Imagery. Res. J. Chem. Env. 2013, 17, 136–144. [Google Scholar]
- Su, T.; Liu, Q.; Su, X. Study on crop remote sensing classification based on multiple vegetation index time series and machine learning. Jiangsu Agric. Sci. 2017, 45, 219–224. [Google Scholar]
- Jonsson, P.; Eklundh, L. Seasonality extraction by function fitting to time-series of satellite sensor data. Ieee Trans. Geosci. Remote Sens. 2002, 40, 1824–1832. [Google Scholar] [CrossRef]
- Shao, Y.; Lunetta, R.S.; Wheeler, B.; Iiames, J.S.; Campbell, J.B. An evaluation of time-series smoothing algorithms for land-cover classifications using MODIS-NDVI multi-temporal data. Remote Sens. Environ. 2017, 174, 258–265. [Google Scholar] [CrossRef]
- Cai, Z.; Jönsson, P.; Jin, H.; Eklundh, L. Performance of smoothing methods for reconstructing NDVI time-series and estimating vegetation phenology from MODIS data. Remote Sens. 2017, 9, 1271. [Google Scholar] [CrossRef] [Green Version]
- Thomas, I.L.; Ching, N.P.; Benning, V.M.; D’aguanno, J.A. A review of multi-channel indices of class separability. Int. J. Remote Sens. 1987, 8, 331–350. [Google Scholar] [CrossRef]
- Kaufman, Y.J.; Remer, L.A. Detection of forests using mid-IR reflectance: an application for aerosol studies. Geosci. Remote Sens. Ieee Trans. 1994, 32, 672–683. [Google Scholar] [CrossRef]
- Deng, C.; Wu, C. BCI: A biophysical composition index for remote sensing of urban environments. Remote Sens. Environ. 2012, 127, 247–259. [Google Scholar] [CrossRef]
- Somers, B.; Asner, G.P. Multi-temporal hyperspectral mixture analysis and feature selection for invasive species mapping in rainforests. Remote Sens. Environ. 2013, 136, 14–27. [Google Scholar] [CrossRef]
- Hu, Q.; Sulla-Menashe, D.; Xu, B.; Yin, H.; Tang, H.; Yang, P.; Wu, W. A phenology-based spectral and temporal feature selection method for crop mapping from satellite time series. Int. J. Appl. Earth Obs. Geoinf. 2019, 80, 218–229. [Google Scholar] [CrossRef]
- Swain, P.H.; Davis, S.M. Remote sensing: The quantitative approach. Ieee Trans. Pattern Anal. Mach. Intell. 1981, 713–714. [Google Scholar] [CrossRef]
- Chen, L.; Jin, Z.; Michishita, R.; Cai, J.; Yue, T.; Chen, B.; Bing, X. Dynamic monitoring of wetland cover changes using time-series remote sensing imagery. Ecol. Inform. 2014, 24, 17–26. [Google Scholar] [CrossRef]
- Liu, J.; Zhao, Y. Methods on Optimal Bands Selection in Hyperspectral Remote Sensing Data Interpretation. J. Grad. Sch. Acad. Sin. 1999, 12, 153–161. [Google Scholar]
- Swain, P.; Robertson, T.; Wacker, A. Comparison of the divergence and B-distance in feature selection. Lars Inf. Note 1971, 20871, 47906-41399. [Google Scholar]
- Richards, J.A.; Jia, X. Feature Reduction. In Remote Sensing Digital Image Analysis: An Introduction, 4th ed.; Springer Berlin Heidelberg: Berlin, Heidelberg, 2006; pp. 267–294. [Google Scholar]
- Breiman, L. Random forests. Mach. Learn. 2001, 45, 5–32. [Google Scholar] [CrossRef] [Green Version]
- Belgiu, M.; Drăguţ, L. Random forest in remote sensing: A review of applications and future directions. Isprs J. Photogramm. Remote Sens. 2016, 114, 24–31. [Google Scholar] [CrossRef]
- Hao, P.; Zhan, Y.; Wang, L.; Niu, Z.; Shakir, M. Feature selection of time series MODIS data for early crop classification using random forest: A case study in Kansas, USA. Remote Sens. 2015, 7, 5347–5369. [Google Scholar] [CrossRef] [Green Version]
- Nitze, I.; Barrett, B.; Cawkwell, F. Temporal optimisation of image acquisition for land cover classification with Random Forest and MODIS time-series. Int. J. Appl. Earth Obs. Geoinf. 2015, 34, 136–146. [Google Scholar] [CrossRef] [Green Version]
- Guan, H.; Li, J.; Chapman, M.; Deng, F.; Ji, Z.; Yang, X. Integration of orthoimagery and lidar data for object-based urban thematic mapping using random forests. Int. J. Remote Sens. 2013, 34, 5166–5186. [Google Scholar] [CrossRef]
- Zhou, F.; Zhang, A.; Townley-Smith, L. A data mining approach for evaluation of optimal time-series of MODIS data for land cover mapping at a regional level. Isprs J. Photogramm. Remote Sens. 2013, 84, 114–129. [Google Scholar] [CrossRef]
- Chen, Y.; Song, X.; Wang, S.; Huang, J.; Mansaray, L.R. Impacts of spatial heterogeneity on crop area mapping in Canada using MODIS data. Isprs J. Photogramm. Remote Sens. 2016, 119, 451–461. [Google Scholar] [CrossRef]
- Jönsson, P.; Eklundh, L. TIMESAT—a program for analyzing time-series of satellite sensor data. Comput. Geosci. 2004, 30, 833–845. [Google Scholar] [CrossRef] [Green Version]
- Eklundh, L.; Jönsson, P. TIMESAT 3.3 software manual; Lund and Malmö University: Sweden, 2017; p. 82. [Google Scholar]
- de Beurs, K.M.; Henebry, G.M. Spatio-temporal statistical methods for modelling land surface phenology. In Phenological Research; Springer: New York, NY, USA, 2010; pp. 177–208. [Google Scholar]
- Ghosh, S.; Mishra, D. Analyzing the Long-Term Phenological Trends of Salt Marsh Ecosystem across Coastal LOUISIANA. Remote Sens. 2017, 9, 1340. [Google Scholar] [CrossRef] [Green Version]
- Ren, J.; Campbell, J.; Shao, Y. Estimation of SOS and EOS for Midwestern US corn and soybean crops. Remote Sens. 2017, 9, 722. [Google Scholar] [CrossRef] [Green Version]
- Karlsen, S.R.; Solheim, I.; Beck, P.S.; Høgda, K.A.; Wielgolaski, F.E.; Tømmervik, H. Variability of the start of the growing season in Fennoscandia, 1982–2002. Int. J. Biometeorol. 2007, 51, 513–524. [Google Scholar] [CrossRef] [PubMed]
- Chen, C.; Liaw, A.; Breiman, L. Using random forest to learn imbalanced data. Univ. Calif. Berkeley 2004, 110, 24. [Google Scholar]
- Manning, C.D.; Raghavan, P.; Schütze, H. Introduction to information retrieval; Online ed.; Cambridge University Press: Cambridge, UK, 2008; pp. 253–287. [Google Scholar]
- Zarinabad, N.; Wilson, M.P.; Gill, S.K.; Manias, K.A.; Davies, N.P.; Peet, A.C. Multiclass imbalance learning: Improving classification of pediatric brain tumors from magnetic resonance spectroscopy. Magn. Reson. Med. 2017, 77, 2114–2124. [Google Scholar] [CrossRef] [PubMed]
- Liu, X.; Li, Q.; Zhou, Z. Learning Imbalanced Multi-class Data with Optimal Dichotomy Weights. In Proceedings of the 2013 IEEE 13th International Conference on Data Mining, Washington, DC, USA, 7–10 December 2013; pp. 478–487. [Google Scholar]
- Fiori, M.; Martino, M.D.; Fernández, A. An optimal multiclass classifier design. In Proceedings of the 2016 23rd International Conference on Pattern Recognition (ICPR), Cancue, Mexico, 4–8 December 2016; pp. 480–485. [Google Scholar]
- Cohen, J. A coefficient of agreement for nominal scales. Educ. Psychol. Meas. 1960, 20, 37–46. [Google Scholar] [CrossRef]
- de Leeuw, J.; Jia, H.; Yang, L.; Liu, X.; Schmidt, K.; Skidmore, A.K. Comparing accuracy assessments to infer superiority of image classification methods. Int. J. Remote Sens. 2006, 27, 223–232. [Google Scholar] [CrossRef]
- Foody, G.M. Classification accuracy comparison: Hypothesis tests and the use of confidence intervals in evaluations of difference, equivalence and non-inferiority. Remote Sens. Environ. 2009, 113, 1658–1663. [Google Scholar] [CrossRef] [Green Version]
- Fleiss, J.L.; Cohen, J.; Everitt, B.S. Large sample standard errors of kappa and weighted kappa. Psychol. Bull. 1969, 72, 323–327. [Google Scholar] [CrossRef] [Green Version]
- Knyazikhin, Y.; Schull, M.A.; Stenberg, P.; Mõttus, M.; Rautiainen, M.; Yang, Y.; Marshak, A.; Carmona, P.L.; Kaufmann, R.K.; Lewis, P. Hyperspectral remote sensing of foliar nitrogen content. Proc. Natl. Acad. Sci. 2013, 110, E185–E192. [Google Scholar] [CrossRef] [PubMed] [Green Version]
- Zhao, Y.; Feng, D.; Yu, L.; Wang, X.; Chen, Y.; Bai, Y.; Hernández, H.J.; Galleguillos, M.; Estades, C.; Biging, G.S.; et al. Detailed dynamic land cover mapping of Chile: Accuracy improvement by integrating multi-temporal data. Remote Sens. Environ. 2016, 183, 170–185. [Google Scholar] [CrossRef]


| Class Code | Land Cover Type | Area Percentage | Descriptions |
|---|---|---|---|
| 0120 | Cropland | 30.5% | Cultivated lands for dry crops such as wheat, corn, bean, potatoes, and vegetables, excluding greenhouses |
| 0211 | Orchard | 4.4% | Orchards that comprise fruit- or nut-producing trees and shrubs |
| 0311 | Broadleaf deciduous forest | 12.8% | Forests mainly comprised by dicotyledonous trees (accounting for at least 65%) with height over 5 m. |
| 0312 | Evergreen coniferous forest | 11.5% | Forests mainly comprised of gymnospermous trees (accounting for at least 65%) with height over 5 m, e.g., pine, cypress, and fir |
| 3021 | Deciduous shrub | 28.9% | Composed of broad-leaved shrubs, and small trees, with height lower than 5 m |
| 0411 | Grass | 4.1% | Grasslands with good water condition and grass coverage greater than 50% |
| - | Other classes | 7.8% | Mainly buildings, greenhouses, roads, waters, mining fields, etc. |
| Vegetation Index | Formula for OLI | Source |
|---|---|---|
| UNVI | [24] | |
| NDVI | [32] | |
| EVI | [33] | |
| TVI | [22] | |
| TCG | [34] |
| Vegetation Type | Crop | Broadleaf Forest | Coniferous Forest | Shrub | Grass |
|---|---|---|---|---|---|
| Number of pixels in Chaoyang | 2,599,371 | 488,218 | 694,601 | 2,568,218 | 72,824 |
| Coverage percentage | 40.5% | 7.6% | 10.8% | 40.0% | 1.1% |
| Number of typical pixels selected | 1821 | 1902 | 1134 | 2374 | 849 |
| Proportion for training | 5% | 20% | 20% | 5% | 30% |
| Phenological Parameters | Definitions |
|---|---|
| Time for the start of season (SOS) | Time for which the left edge has increased to 20% of the seasonal amplitude measured from the left minimum level |
| Time for the end of season (EOS) | Time for which the right edge has decreased to 20% of the seasonal amplitude measured from the right minimum level |
| Length of season (LOS) | Time from the start to the end of the season |
| Base level | Average of the left and right minimum values |
| Time for the mid of season | Mean value of the times for which, respectively, the left edge has increased to the 80% level and the right edge has decreased to the 80% level |
| Maximum VI | The largest VI value for the fitted function during the season |
| Seasonal amplitude | Difference between the maximum value and the base level |
| Increase rate | The ratio of the difference between the left 20% and 80% levels and the corresponding time difference |
| Decrease rate | The absolute value of the ratio of the difference between the right 20% and 80% levels and the corresponding time difference |
| Large seasonal integral | Integral of the function describing the season from the season start to the season end |
| Small seasonal integral | Integral of the difference between the function describing the season and the base level from season start to season end |
| Value for the start of season | Value of the function at the time of the start of the season |
| Value for the end of season | Value of the function at the time of the end of the season |
| Vegetation Type | UNVI | NDVI | EVI | TVI | TCG | |||||
|---|---|---|---|---|---|---|---|---|---|---|
| PA(%) | UA(%) | PA(%) | UA(%) | PA(%) | UA(%) | PA(%) | UA(%) | PA(%) | UA(%) | |
| Crop | 98.39 | 99.01 | 98.52 | 99.06 | 98.24 | 98.84 | 98.14 | 98.77 | 98.21 | 98.75 |
| Broadleaf | 72.71 | 49.40 | 71.61 | 47.71 | 71.99 | 45.52 | 71.14 | 45.81 | 69.16 | 44.03 |
| Conifer | 95.39 | 93.82 | 95.54 | 93.58 | 92.22 | 91.01 | 92.96 | 91.76 | 93.47 | 91.77 |
| Shrub | 82.49 | 93.96 | 81.30 | 93.62 | 79.77 | 92.92 | 80.21 | 92.70 | 79.30 | 92.28 |
| Grass | 75.16 | 34.12 | 74.71 | 32.78 | 73.88 | 33.81 | 73.47 | 34.20 | 73.59 | 34.20 |
| Classification 1 | Classification 2 | Z-test Value | p-Value |
|---|---|---|---|
| UNVI | NDVI | 17.71 | <0.0001 |
| UNVI | EVI | 60.40 | <0.0001 |
| UNVI | TVI | 54.99 | <0.0001 |
| UNVI | TCG | 74.82 | <0.0001 |
© 2020 by the authors. Licensee MDPI, Basel, Switzerland. This article is an open access article distributed under the terms and conditions of the Creative Commons Attribution (CC BY) license (http://creativecommons.org/licenses/by/4.0/).
Share and Cite
Liu, H.; Zhang, F.; Zhang, L.; Lin, Y.; Wang, S.; Xie, Y. UNVI-Based Time Series for Vegetation Discrimination Using Separability Analysis and Random Forest Classification. Remote Sens. 2020, 12, 529. https://doi.org/10.3390/rs12030529
Liu H, Zhang F, Zhang L, Lin Y, Wang S, Xie Y. UNVI-Based Time Series for Vegetation Discrimination Using Separability Analysis and Random Forest Classification. Remote Sensing. 2020; 12(3):529. https://doi.org/10.3390/rs12030529
Chicago/Turabian StyleLiu, Hualiang, Feizhou Zhang, Lifu Zhang, Yukun Lin, Siheng Wang, and Yefeng Xie. 2020. "UNVI-Based Time Series for Vegetation Discrimination Using Separability Analysis and Random Forest Classification" Remote Sensing 12, no. 3: 529. https://doi.org/10.3390/rs12030529
APA StyleLiu, H., Zhang, F., Zhang, L., Lin, Y., Wang, S., & Xie, Y. (2020). UNVI-Based Time Series for Vegetation Discrimination Using Separability Analysis and Random Forest Classification. Remote Sensing, 12(3), 529. https://doi.org/10.3390/rs12030529