Article

A Self-Adaptive Mean Shift Tree-Segmentation Method Using UAV LiDAR Data

1
School of Geographical Science, Nanjing University of Information Science & Technology, Nanjing 210044, Jiangsu, China
2
School of Remote Sensing & Geomatics Engineering, Nanjing University of Information Science & Technology, Nanjing 210044, Jiangsu, China
3
Co-Innovation Center for Sustainable Forestry in Southern China, Nanjing Forestry University, 159 Longpan road, Nanjing 210037, Jiangsu, China
4
Faculty of Computer and Software Engineering, Huaiyin Institute of Technology, Huaian 223003, Jiangsu, China
5
China Transport Telecommunications & Information Center, Beijing 100011, China
6
Institute of Space Weather, School of Math & Statistics, Nanjing University of Information Science & Technology, Nanjing 210044, Jiangsu, China
*
Author to whom correspondence should be addressed.
Remote Sens. 2020, 12(3), 515; https://doi.org/10.3390/rs12030515
Submission received: 18 December 2019 / Revised: 25 January 2020 / Accepted: 4 February 2020 / Published: 5 February 2020
(This article belongs to the Special Issue Individual Tree Detection and Characterisation from UAV Data)

Abstract

:
Unmanned aerial vehicles using light detection and ranging (UAV LiDAR) with high spatial resolution have shown great potential in forest applications because they can capture vertical structures of forests. Individual tree segmentation is the foundation of many forest research works and applications. The tradition fixed bandwidth mean shift has been applied to individual tree segmentation and proved to be robust in tree segmentation. However, the fixed bandwidth-based segmentation methods are not suitable for various crown sizes, resulting in omission or commission errors. Therefore, to increase tree-segmentation accuracy, we propose a self-adaptive bandwidth estimation method to estimate the optimal kernel bandwidth automatically without any prior knowledge of crown size. First, from the global maximum point, we divide the three-dimensional (3D) space into a set of angular sectors, for each of which a canopy surface is simulated and the potential tree crown boundaries are identified to estimate average crown width as the kernel bandwidth. Afterwards, we use a mean shift with the automatically estimated kernel bandwidth to extract individual tree points. The method is iteratively implemented within a given area until all trees are segmented. The proposed method was tested on the 7 plots acquired by a Velodyne 16E LiDAR system, including 3 simple plots and 4 complex plots, and 95% and 80% of trees were correctly segmented, respectively. Comparative experiments show that our method contributes to the improvement of both segmentation accuracy and computational efficiency.

Graphical Abstract

1. Introduction

Conventionally, forest inventory has been implemented by field survey which is time-consuming and labor-intensive [1,2]. Moreover, because forest attribute information is affected by topography and the environment, the parameters that can be measured manually are very limited [3]. Over the poast three decades, airborne light detection and ranging (LiDAR) technology has been increasingly used to estimate forest structural attributes [4,5,6]. Airborne LiDAR data provide detailed three-dimensional (3D) information of vertical forest structures to estimate forestry parameters at both individual and stand tree levels [7]. With the technology development, compared to airborne LiDAR, unmanned aerial vehicles (UAV LiDAR) have gained a reputation in forest inventory surveying because of their increased data resolution, lower costs, flight flexibility, and simple operation [6,8,9,10].
Forest inventory requires accurate individual tree structures to directly obtain forest structural attributes (i.e., crown width and tree height) or estimate height-related attributes by establishing regression models (such as diameter at breast height (DBH), volume, and aboveground biomass (AGB)) [11,12,13,14]. Thus, the segmentation of individual trees becomes the key step to highly accurate forestry parameter estimation. However, the existing problems of individual tree segmentation using LiDAR data are mainly caused by: (1) adjacent, overlapped tree crowns, and various tree sizes, which result in serious omission errors in multi-layered forest stands [15]; (2) irregular tree shapes (such as a branch of a tree extending outward widely and resembling a small tree), which lead to commission errors [7]; (3) suppressed or small trees located below tall trees, which are difficult detected because LiDAR systems are less likely to penetrate the dense forest canopy and have less information of suppressed trees.
To solve the aforementioned issues, many methods have been developed. Some studies make use of height variation of canopy height model (CHM) to find treetops by local maxima (LM) filtering [16] or moving variable window [17,18]. Then, tree crowns are mainly delineated by image-processing algorithms designed for edge detection and feature extraction, such as region growing [19], watershed analysis [17,20], spatial wavelet analysis [21], and template matching [22,23]. The CHM-based tree detection algorithms are fast and efficient but easy to produce omission and commission errors [24]. The tree detection accuracy is sensitive to the resolution of CHM and the noise caused by irregular tree shapes and overlapped trees. In addition, because of a variety of canopy sizes, it is difficult to select the optimal resolution and smoothing factor suitable for the whole scene [7,25,26]. To improve the detection rate, the vertical and horizontal structures of point clouds are analyzed. Liu et al. [7] integrated a multiscale CHM-based algorithm and a point-based vertical profile analysis algorithm to improve individual tree segmentation accuracy. Paris et al. [24] improved the segmentation accuracies of dominant trees by combining CHM data and horizontal profiles of point clouds and extracted subdominant trees by analyzing vertical profiles. By using a marker-controlled watershed segmentation method, Harikumar et al. [27] first segmented a point cloud into a set of segments, each of which was projected onto a novel 3D space to separate subdominant from dominant trees.
Because of the increased spatial resolution of UAV LiDAR data, some studies, to improve segmentation accuracy, segmented individual trees directly from point clouds. The existing point-based clustering methods (such as region growing [17], k-means clustering [26], normalized cut [28], and mean shift [29,30]) have been widely used for individual tree segmentation in terms of 3D data characteristics, geometric structures, and height variation of trees [31,32,33]. Compared with other clustering methods, mean shift does not require seed points or number of clusters before clustering. It proves to be robust to segment various kinds of trees [34,35]. Mean shift aims to move each data point to the densest area within a certain neighborhood by iteratively performing shift operations based on a kernel density function. The kernel function determines the weights of neighboring points for re-estimating the local maximum. Eventually, the points will converge to the local maxima of density [29]. Ferraz et al. [30] developed a fixed bandwidth mean shift method, in which a horizontal and a vertical kernel functions were designed to shift data points to a denser and higher region until it converged to the treetop. Ferraz et al. [36] further improved it by establishing a self-calibrated bandwidth model, which relates tree heights to crown widths and depths by extracting easily recognized individual trees. The method required complicated pre-processing and the established allometric model might not be suitable for all tree species [29]. Hu et al. [29] proposed an adaptive mean shift-based clustering approach, in which the key parameter—kernel size—was automatically changed to reduce over- and under-segmentations according to the estimated crown diameters of distinct trees, and nearly 30% more suppressed trees are identified compared to the fixed bandwidth-based methods. However, point-based methods are generally highly computational when having been directly applied to the whole scene [7,33]. Hamraz et al. [35], to improve computational efficiency, generated vertical profiles of point clouds in different directions within a local region, then detected crown boundary for each profile. This method greatly improved computational efficiency and required no prior knowledge of the shapes and sizes of tree crowns [35].
In summary, in mean shift methods, the kernel bandwidth is a major factor, which has a strong impact on the segmentation accuracy and clustering speed. The fixed kernel bandwidth was widely used in segmentation, but it cannot adapt to heterogeneous crown sizes, and thereby might result in omission errors or commission errors. For example, if a small kernel bandwidth is applied to large objects, commission errors will occur (that is, a single tree might be segmented into several clusters); whereas if a large kernel bandwidth is applied to small objects, omission errors will greatly appear (that is, more than two trees are clustered into one segment). Our previous research in [37] used fixed bandwidth mean shift method to segment individual trees and reduced omission errors by normalized Cut algorithm (NCut). The method improved tree segmentation accuracy and also increased computational complexity.
Therefore, in this paper, to reduce omission and commission errors, we propose a self-adaptive mean shift method, where an adaptive kernel bandwidth is used according to local tree structure information for individual tree segmentation. Moreover, because mean shift methods are generally highly computational when directly applied to LiDAR data, a 3D space division strategy is used to improve tree segmentation efficiency. In addition, point density is another important factor affecting individual tree detection, we also evaluate the effects of point density on individual tree detection. The remainder of the paper is organized as follows: Section 2 details the proposed self-adaptive mean shift segmentation method. Section 3 describes the study area and the test data including UAV LiDAR data and field survey data, and then analyzes the segmentation results. Concluding remarks are given in Section 4.

2. Methodology

In this paper, the proposed method segments individual trees by the following steps. Ground points are separated from non-ground points, and then non-ground points are normalized for the data pre-processing. Then, the optimal kernel bandwidth for mean shift is automatically estimated without any prior knowledge of crown size to extract individual tree points. The proposed self-adaptive mean shift method is iteratively implemented within a given area until all trees are segmented.
In the pre-processing process, because ground points affect segmentation results, we remove them by a cloth simulation (CSF) algorithm [38]. Afterward, to reduce the influence of topography on the following tree segmentation, we normalize non-ground points according to the produced digital terrain model (DTM) interpolated by the filtered ground points. The details can be seen in [37].

2.1. Self-Adaptive Kernel Bandwidth Determination

The kernel bandwidth is a critical parameter of the mean shift method. In this study, it represents the region where the local maximum exists, thereby we adaptively determine it according to the related tree crown size. The kernel bandwidth is determined by the following steps.
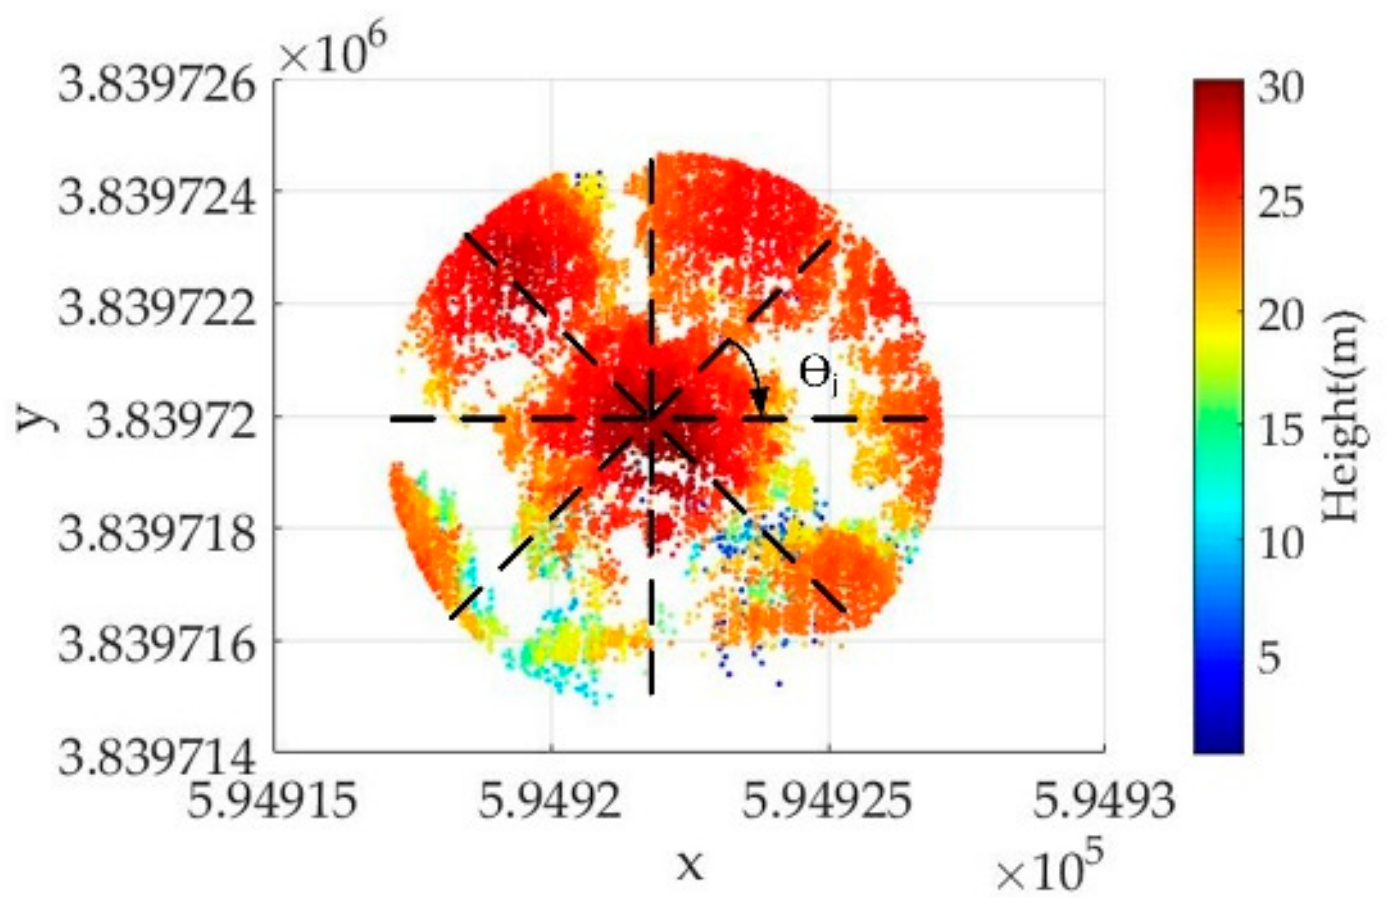
  • 3D space division, which locates the global maximum point in a point cloud as the center point to divide the point cloud into a set of angular sectors at multiple directions.
  • Crown surface generation, which generates a vertical profile for each sector and extracts LiDAR canopy surface points to simulate a crown surface.
  • Kernel bandwidth determination, which, from the generated crown surface, a crown boundary is delineated to automatically determine the kernel bandwidth according to the between-tree gap and height variation.
The rest of this section details the delineation of the kernel bandwidth.

2.1.1. 3D Space Division

We first locate the highest point in a point cloud as the center point, Xc = (xc, yc, zc), which is defined as the apex of the highest tree. With the center point, Xc, we divide the 3D space into n angular sectors within a given search radius R (R must be larger than the largest trees in the scene to be processed) (see Figure 1). For each angular sector θj Є [2πj/n, 2π(j + 1)/n] (j = 0,1…n-1), we search for the points Xi = (xi, yi, zi) (i = 1, 2….n, n is the number of the points) belonging to. The set Xi belonging to angular sector θj is defined as:
X i = tan y i y c x i x c tan θ j , θ j + 1

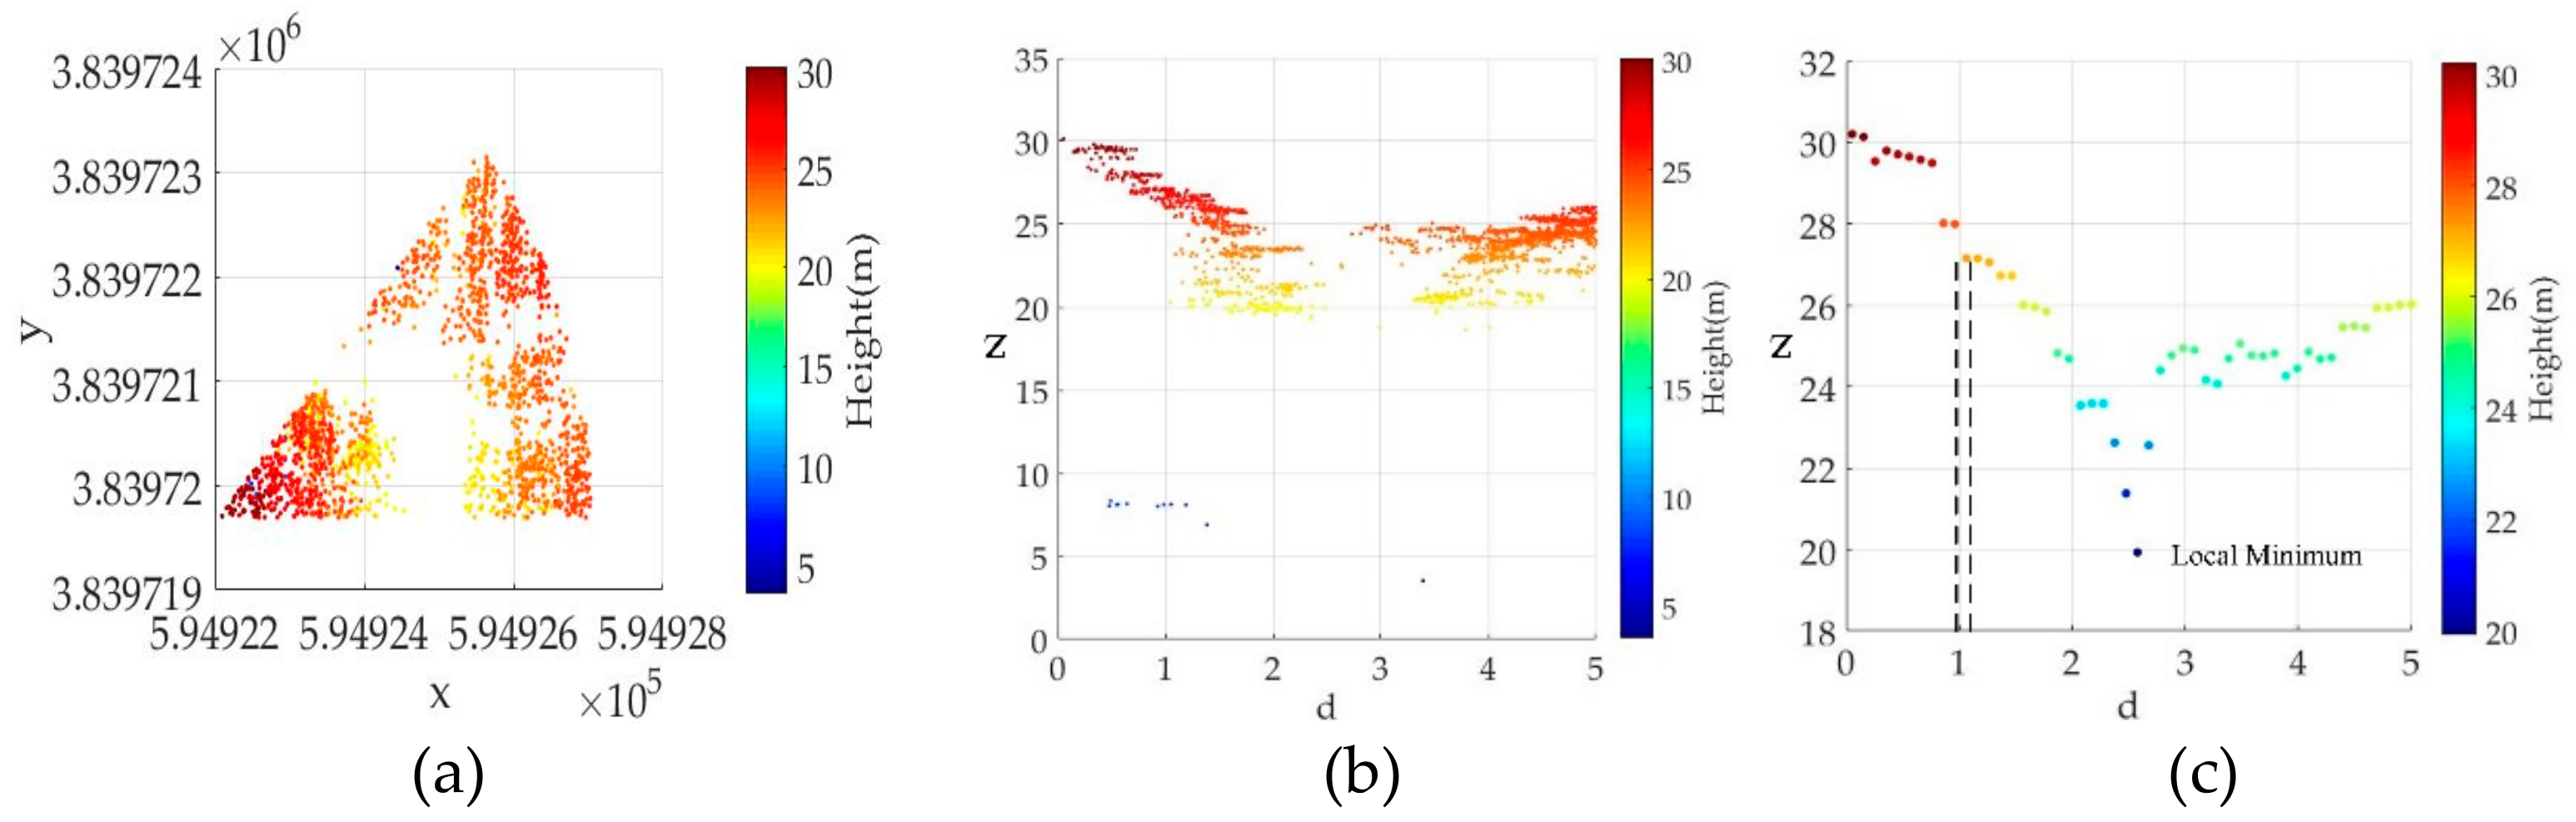
2.1.2. Crown Surface Simulation

For each angular sector (see Figure 2a), we generate a vertical profile of LiDAR points and extract potential canopy surface points. We first calculate the distance Di (i = 1, 2….n), D i = x i x c 2 + y i y c 2 between Xc and Xi. Then, a vertical profile is generated in terms of coordinates z and d (see Figure 2b). In this study, only LiDAR canopy surface points are kept to simulate the crown surface. As seen in Figure 2c, in doz plane, points are divided into a set of grids with a given grid size ɛ, each of which the maximum height is kept to simulate the crown surface.

2.1.3. Kernel Bandwidth Determination

After the crown surface simulation, the crown boundary can be delineated according to between-tree gaps and height variations. In the canopy surface points, the local minimum points always exist between adjacent tree crowns. Starting from Xc, only the first local minimum point is remained for further analysis. The distance between center point Xc and the local minimum point is identified as a crown radius. To smooth extended branches and reduce false local minimum points, a Gaussian filtering is first applied to the simulated crown surface points. After estimating all crown radii at multiple directions, the average crown radius is calculated as the kernel bandwidth.
The determination of kernel bandwidth is completely based on the coordinate information of LiDAR points without any prior knowledge. Moreover, the division of the 3D space decreases the complexity of 3D forest structure and improves the computational efficiency.

2.2. Mean Shift-Based Individual Tree Segmentation

With the determined kernel bandwidth, the individual tree points are extracted by mean shift, which gains its reputations for great performance in individual tree segmentation. In this study, a horizontal and a vertical kernel functions (gs and gr) are designed to shift data points Xi to treetop Xc. The offset vector is defined by:
m h s , h r ( X c ) = i = 1 n X i g s ( | | x c s x i s h s | | 2 ) g r ( | | x c r x i r h r | | 2 ) i = 1 n g s ( | | x c s x i s h s | | 2 ) g r ( | | x c r x i r h r | | 2 ) X c
where the superscripts s and r refer to the horizontal and vertical directions, respectively. hs and hr represent the horizontal and vertical bandwidths. gs is the horizontal kernel function that follows Gaussian function:
g s ( | | x c s x i s h s | | 2 ) = exp ( 1 2 | | x c s x i s h s | | 2 ) i f | | x c s x i s h s | | 1 0 o t h e r w i s e
gr is specially-designed for assigning a larger weight to the highest voxel:
g r ( | | x c r x i r h r | | 2 ) = 1 | | 1 d i s t ( x c r , x i r ) | | 2 i f   m a s k ( x c r , x i r ) = 1 0 o t h e r w i s e
where mask (xcr,xir) represents a mask of foreground object; dist(xcr,xir) is the distance between Xi and the boundary of the mask. They are defined by,
m a s k ( x c r , x i r ) = 1 i f   x c r h r 4 x i r x c r + h r 2 0 o t h e r w i s e
d i s t ( x c r , x i r ) = min ( | | ( x c r h r 4 ) x i r 3 h r 8 | | , | | ( x c r + h r 2 ) x i r 3 h r 8 | | ) i f   m a s k ( x c r , x i r ) = 1 0 o t h e r w i s e
More details can be found in literature [31].
After detecting and extracting the tallest tree points, the method will automatically search the tallest point in the remaining points. The method was iteratively implemented within a given area until all individual tree points were segmented, and eliminate clusters containing less than 50 points to reduce interference from branches.

3. Experimental Results and Discussion

3.1. Datasets

The individual tree segmentation method was applied within the forest stands in Dongtai forest farm, located in Yancheng City, Jiangsu, China. A field survey was conducted within 7 square plots with two main tree species (Metasequoia in plots 1–3, and Poplar in plots 4–7), and each plot was 30 m × 30 m in size. The numbers of the reference trees for Plots 1~7 were 29, 54, 54, 18, 20, 21, and 42, respectively. Accordingly, their forest densities were 0.032, 0.060, 0.060, 0.020, 0.022, 0.023, and 0.047 trees/m2, respectively. Each reference tree was located by a backpack laser scanning system, and its DBH was manually measured using a diameter tape and recorded in July 2017. The full specifications of the Backpack laser-scanning system are listed in Table 1.
The UAV LiDAR data were collected by a Velodyne 16E (VLP16) laser-scanner system placed on a GV1300 multi-rotor UAV platform in July 2017. Overall, the LiDAR data have an average point density of 40.57 points/m2. According to the complexity of forest structure, we divided 7 plots into 3 simple plots (Plots 1–3 with regular and coned shape, see Figure 3a) and 4 complex plots (Plots 4–7 with extended and irregular branches and varied tree size, see Figure 3b). The details of UAV LiDAR system can be seen in [37].

3.2. Individual Tree Segmentation

The proposed method was performed using matlab 2016a on an HP Z820 eight-core-16-thread workstation. To evaluate the performance of the proposed individual tree segmentation method, we tested it on the UAV LiDAR data. In this study, the highest point of the detected tree is located as the tree, and we compared it with the reference tree locations in 7 plots. The LiDAR-derived tree is paired with a closest reference tree. If the difference between the derived tree height and the height of the reference tree is smaller than 0.5 m and more than 80% points are extracted according to visual inspection, we consider that the tree is correctly segmented. The results were evaluated by the following metrics: segmentation accuracy (DET = de/ref, de is the number of trees correctly detected and ref is the number of reference trees), omission error (OM = om/ref, om is the number of undetected trees), and commission error (COM = com/ref, com is the number of trees falsely detected).

3.2.1. Parameter Analysis

There are several parameters in our self-adaptive mean shift tree segmentation. The parameter involved in the pre-processing can be found in the literature [37]. Our self-adaptive mean shift individual tree segmentation method involves five parameters: hs, hr, R, n, and ɛ. Among the five parameters, horizontal kernel bandwidth, hs influences the accuracy and efficiency of individual tree segmentation. The value of hs was determined automatically according to tree structure. Vertical kernel bandwidth, hr, controls the canopy depth to determine the presentence of treetops. According to literature [30], hr was set to 5 m. Search radius, R controls a neighboring size to include the largest tree in the study area. According to our test data, R was set to 5 m. The number of angular sector, n controls the details of a tree canopy in different directions. In each direction, the possible crown width was analyzed along the vertical profiles of point clouds. ɛ, the grid size of the distance between point set Xi and center point Xc, controls the details of a tree canopy surface.
Parameters n and ɛ play a significant role in the adaption of kernel bandwidths, leading to strongly impacting on tree segmentation accuracy. Therefore, we designed two groups of experiments to investigate the sensitivity of the proposed self-adaptive mean shift tree segmentation method to the selection of the parameters n and ɛ.
In the first group, we held n = 8. To guarantee at least one LiDAR point per interval in terms of point density, we set the maximum value of ɛ to 0.5 m and varied ɛ from 0.1 to 0.5 at intervals of 0.1. The test results are presented in Table 2. As shown in Table 2, the DET values of the segmented trees decrease as the grid size increases from 0.1 m to 0.5 m, correspondingly, the OM values increase from 0.13 to 0.28. Whereas, the COM values tend to be stable as parameter ɛ changes from 0.3 m to 0.5 m. The reason behind this phenomenon might be that the tree details are gradually missing as the grid size increases, leading to the increase of the OM value and finally the decrease of the overall segmentation accuracies. As such, in our study, the best tree segmentations were obtained at interval ɛ = 0.2.
In the second group, we held ɛ = 0.2 m and varied n = 2, 4, 6, 8, and 12. As Table 2 shown, the DET values increase and the omission errors decrease with the increase of divided 3D space sectors, which means the smaller the angular sector, the more accurate the crown width estimates. When n = 12, the DET value changes slightly and the commission error increases. The reason is that the more extended branches might be included because of the smaller angular sector. In this paper, the n = 8 obtained the best tree segmentation performance.

3.2.2. Sensitivity Analysis of Point Density on Individual Tree Segmentation

To evaluate the effects of point densities on individual tree detection, we decimated original UAV LiDAR data to lower density of 50% (20 points/m2), 25% (10 points/m2), and 10% (4 points/m2), using BACL LiDAR Tools [39,40]. Table 3 shows the individual tree detection accuracy under different point densities. The 100% point density achieved the highest individual tree detection accuracy, 0.87, and as the point density decreased from 100% (40 points/m2) to 10% (4 points/m2), the accuracy decreased from 0.87 to 0.32. Although the tree segmentation accuracy of our method decreased with a decrease of point density, the UAV LiDAR data guarantee the satisfactory tree segmentation results due to its high data resolution.

3.2.3. Overall Performance

After parameter sensitivity analysis, we set hr = 5 m, R = 5 m, ɛ = 0.2 m, and n = 8. hs was automatically determined. Figure 4a–f shows the visualized segmentation results of our method. Table 4 lists the tree segmentation results for seven plots (three plots for Metasequoia with simple tree structure, and four plots for Poplar with relatively complex tree structure). As seen in Table 4, for the simple plots, the DET, OM, and COM values obtained 0.95, 0.05 and 0.08, respectively; while for the complex plots, the DET, OM, and COM values achieved 0.80, 0.20, and 0.10, respectively. The segmentation accuracy of the complex plots was much lower than that of the simple plots; 20% of trees were undetected in complex plots. That was caused by the irregular tree structure of Poplar tree and the overlapped branches which made the treetop not distinct. The clusters containing less than 50 points were removed to reduce interference from branches, therefore, some small trees or branches were not included; 10% trees were falsely detected. That could be explained by the extended branches of the object trees being misclassified to neighboring trees. Due to the irregular tree structure and extended branches of complex plots, some individual trees failed to be detected and some branches were misclassified, resulting in the decrease of the segmentation accuracies. It was observed that most canopy shapes tend to be round in this study, a round search radius was defined to determine the segmented trees.

3.3. Comparative Tests

To evaluate the effectiveness of the proposed individual tree segmentation method, we designed a group of experiments and compared it with other three methods, including marker-controlled watershed segmentation [17], fixed bandwidth mean shift [30], and our previous tree segmentation method, Yan’s method [37]. The parameters used in those comparative methods are listed in Table 5. The visualized results of all methods are shown in Figure 5, respectively. The average segmentation results of all sample plots are listed in Table 6. The marker-controlled watershed segmentation method achieved a better tree detection performance with the DET, OM, and COM values of 0.87, 0.13, and 0.13, respectively. In Figure 5, the results of the marker-controlled watershed segmentation was performed using LiDAR360 produced by Green Valley International (https://www.lidar360.com/archives/5135.html), green dots and black circles represent tree locations and canopy radii derived from watershed segmentation, respectively, and black crosses represent reference tree locations. The method performed better in the sample plots because of the prominent treetops and the circular crown shape of Metasequoia, which made the height variation of the raster surface model—CHM distinct. However, the crown boundaries were not delineated correctly, especially in Plots 4–7 (sample plots of Poplar). This is because the watershed segmentation algorithm considers only height variation of interpolated data, thereby it is incapable of dealing with extended and irregular tree shapes. The fixed bandwidth mean shift method, which uses a single bandwidth for a whole scene, achieved a worse segmentation accuracies with the DET, OM, and COM values of 0.84, 0.16, and 0.11, respectively. Note that the fixed kernel bandwidth method is incapable of dealing with the existence of various canopy sizes and overlapped canopy, which results in obvious omission errors and further decreases the DET value. Although Yan’s method was mainly based on the fixed bandwidth mean shift, the segmentation accuracy was improved by using NCut, which gained its reputation for segmenting multiple overlapped objects. Yan’s method achieved the DET, OM, and COM values of 0.90, 0.10, and 0.11, respectively, whose segmentation performance was slightly better than our method (the DET, OM, and COM values of 0.87, 0.13, and 0.09, respectively). Our method lost some small branches or trees compared to Yan’s method because we eliminated clusters containing less than 50 poinSpecifications of the backpack laser scanninghin a sample plot with 248,219 points. The marker-controlled watershed segmentation method presented that the time required was less than 1 second, outperformed the other three methods. This is because, compared to the other three methods, the marker-controlled watershed segmentation method was performed on the two-dimensional data. For the mean shift-based methods, the time required was at the same level (i.e., two minutes for our self-adaptive bandwidth method and nine minutes for the fixed bandwidth method). Among these methods, Yan’s method presented the time required was 20 minutes. The reason behind this is that Yan’s method iteratively used NCut to segment overlapping trees, leading to an increase of time consumption. Comparatively, our self-adaptive bandwidth method improved the computing performance by using the strategy of 3D space division.
In summary, Yan’s method and our proposed method outperformed the other two methods in tree segmentation accuracies, but our method is much more effective than Yan’s method in computational efficiency. Although the marker-controlled watershed segmentation method required less time than our proposed method for segmenting trees from the UAV LiDAR data, the tree crowns are not delineated correctly. Comparatively, in terms of segmentation accuracies and computational complexity, our proposed method is feasible for the individual tree segmentation from the UAV LiDAR data.

4. Conclusions

In this paper, we proposed a self-adaptive mean shift tree-segmentation method which improved tree segmentation accuracy and computational efficiency using UAV LiDAR point clouds. The key parameter in mean shift—the horizontal kernel bandwidth—was automatically estimated by analyzing canopy vertical structures at multiple directions. The estimation of the kernel bandwidth was without any prior knowledge of crown sizes or seed points. The performance was evaluated on three simple plots and four complex plots, and achieved the overall tree segmentation accuracies of 0.95 and 0.80, respectively. Comparative tests demonstrated that our proposed method can achieve both a better tree segmentation performance and a higher computational efficiency. Therefore, the self-adaptive mean shift method shows the applicability and feasibility for tree segmentation.
In this study, our method shows its superior to the severely overlapping and irregular trees in the UAV LiDAR data. However, due to a few understory trees in this study area, in the future we will work on the algorithm or integrate terrestrial LiDAR data to further deal with that. The tree species in our LiDAR data are mainly planted forests, and natural mixed-species forests from tropical regions will be considered in future studies.

Author Contributions

W.Y. conceived of and designed the experiments and performed the experiments; H.G., Y.Y., and C.L. analyzed the data; H.G., L.C., and J.L. revised the paper. L.C. collected the UAV data and did the field works. All authors have read and agreed to the published version of the manuscript.

Funding

This work was supported in part by the National Natural Science Foundation of China under Grant 41671454, Grant 41971414 and Grant 61603146, in part by the Natural Science Foundation of Jiangsu Province under Grant BK20160427, in part by the Natural Science Research in Colleges and Universities of Jiangsu Province under Grant 16KJB520006, in part by the Science and Technology Project of Huaian City under Grant HAG201602, and in part by the Graduate research innovation program of Jiangsu Province under Grant SJKY19_0971. Contact the corresponding author via [email protected] for more information about the software tools used in this study.

Acknowledgments

The authors would like to acknowledge the anonymous reviewers for their valuable comments.

Conflicts of Interest

The authors declare no conflict of interest.

Abbreviations

The following abbreviations are used in this manuscript:
UAVunmanned aerial vehicle
LiDARlight detection and ranging
3Dthree-dimensional
CHMcanopy height model
CSFcloth simulation
DTMdigital terrain model
DBHdiameter at breast height
AGBaboveground biomass
LMlocal maxima
GPSglobal positioning system
IMUinertial measurement unit
RTKreal-time kinematic
DETsegmentation accuracy
OMomission error
COMcommission error
dethe number of trees correctly detected
refthe number of reference trees
omthe number of undetected trees
comthe number of trees falsely detected

References

  1. Zhang, C.; Zhou, Y.; Qiu, F. Individual Tree Segmentation from LiDAR Point Clouds for Urban Forest Inventory. Remote Sens. 2015, 7, 7892–7913. [Google Scholar] [CrossRef] [Green Version]
  2. Yu, X.; Hyyppä, J.; Litkey, P.; Kaartinen, H.; Vastaranta, M.; Holopainen, M. Single-Sensor Solution to Tree Species Classification Using Multispectral Airborne Laser Scanning. Remote Sens. 2017, 9, 108. [Google Scholar] [CrossRef] [Green Version]
  3. Hamraz, H.; Contreras, M.A.; Zhang, J. A robust approach for tree segmentation in deciduous forests using small-footprint airborne LiDAR data. Int. J. Appl. Earth Obs. Geoinf. 2016, 52, 532–541. [Google Scholar] [CrossRef] [Green Version]
  4. Liu, K.; Shen, X.; Cao, L.; Wang, G.; Cao, F. Estimating forest structural attributes using UAV-LiDAR data in Ginkgo plantations. ISPRS J. Photogramm. Remote Sens. 2018, 146, 465–482. [Google Scholar] [CrossRef]
  5. Wallace, L.; Lucieer, A.; Watson, C.; Turner, D. Development of a UAV-LiDAR System with Application to Forest Inventory. Remote Sens. 2012, 4, 1519–1543. [Google Scholar] [CrossRef] [Green Version]
  6. Wallace, L.; Lucieer, A.; Watson, C.S. Evaluating Tree Detection and Segmentation Routines on Very High Resolution UAV LiDAR Data. IEEE Trans. Geosci. Remote Sens. 2014, 52, 7619–7628. [Google Scholar] [CrossRef]
  7. Liu, L.; Lim, S.; Shen, X.; Yebra, M. A hybrid method for segmenting individual trees from airborne lidar data. Comput. Electron. Agric. 2019, 163. [Google Scholar] [CrossRef]
  8. Sankey, T.; Donager, J.; McVay, J.; Sankey, J.B. UAV lidar and hyperspectral fusion for forest monitoring in the southwestern USA. Remote Sens. Environ. 2017, 195, 30–43. [Google Scholar] [CrossRef]
  9. Tian, J.; Wang, L.; Li, X.; Gong, H.; Shi, C.; Zhong, R.; Liu, X. Comparison of UAV and WorldView-2 imagery for mapping leaf area index of mangrove forest. Int. J. Appl. Earth Obs. Geoinf. 2017, 61, 22–31. [Google Scholar] [CrossRef]
  10. Torresan, C.; Berton, A.; Carotenuto, F.; Gennaro, S.F.D.; Gioli, B.; Matese, A.; Miglietta, F.; Vagnoli, C.; Zaldei, A.; Wallace, L. Forestry applications of UAVs in Europe: A review. Int. J. Remote Sens. 2017, 38, 2427–2447. [Google Scholar] [CrossRef]
  11. Cao, L.; Coops, N.C.; Innes, J.L.; Sheppard, S.R.J.; Fu, L.; Ruan, H.; She, G. Estimation of forest biomass dynamics in subtropical forests using multi-temporal airborne LiDAR data. Remote Sens. Environ. 2016, 178, 158–171. [Google Scholar] [CrossRef]
  12. Matasci, G.; Hermosilla, T.; Wulder, M.A.; White, J.C.; Coops, N.C.; Hobart, G.W.; Zald, H.S.J. Large-area mapping of Canadian boreal forest cover, height, biomass and other structural attributes using Landsat composites and lidar plots. Remote Sens. Environ. 2018, 209, 90–106. [Google Scholar] [CrossRef]
  13. Allouis, T.; Durrieu, S.; Vega, C.; Couteron, P. Stem Volume and Above-Ground Biomass Estimation of Individual Pine Trees From LiDAR Data: Contribution of Full-Waveform Signals. IEEE J. Sel. Top. Appl. Earth Observ. Remote Sens. 2013, 6, 924–934. [Google Scholar] [CrossRef]
  14. Wang, D.; Xin, X.; Shao, Q.; Brolly, M.; Zhu, Z.; Chen, J. Modeling Aboveground Biomass in Hulunber Grassland Ecosystem by Using Unmanned Aerial Vehicle Discrete Lidar. Sensors 2017, 17, 180. [Google Scholar] [CrossRef] [Green Version]
  15. Zhen, Z.; Quackenbush, L.J.; Zhang, L. Trends in Automatic Individual Tree Crown Detection and Delineation—Evolution of LiDAR Data. Remote Sens. 2016, 8, 333. [Google Scholar] [CrossRef] [Green Version]
  16. Hyyppä, J.; Yu, X.; Hyyppä, H.; Vastaranta, M.; Holopainen, M.; Kukko, A.; Kaartinen, H.; Jaakkola, A.; Vaaja, M.; Koskinen, J.; et al. Advances in Forest Inventory Using Airborne Laser Scanning. Remote Sens. 2012, 4, 1190–1207. [Google Scholar] [CrossRef] [Green Version]
  17. Chen, Q.; Baldocchi, D.; Gong, P.; Kelly, M. Isolating Individual Trees in a Savanna Woodland Using Small Footprint Lidar Data. Photogramm. Eng. Remote Sens. 2006, 72, 923–932. [Google Scholar] [CrossRef] [Green Version]
  18. Lee, H.; Slatton, K.C.; Roth, B.E.; Cropper, W.P. Adaptive clustering of airborne LiDAR data to segment individual tree crowns in managed pine forests. Int. J. Remote Sens. 2010, 31, 117–139. [Google Scholar] [CrossRef]
  19. Solberg, S.; Naesset, E.; Bollandsas, O.M. Single Tree Segmentation Using Airborne Laser Scanner Data in a Structurally Heterogeneous Spruce Forest. Photogramm. Eng. Remote Sens. 2006, 72, 1369–1378. [Google Scholar] [CrossRef]
  20. Popescu, S.C. Estimating biomass of individual pine trees using airborne lidar. Biomass Bioenergy 2007, 31, 646–655. [Google Scholar] [CrossRef]
  21. Falkowski, M.J.; Smith, A.M.S.; Gessler, P.E.; Hudak, A.T.; Vierling, L.A.; Evans, J.S. The influence of conifer forest canopy cover on the accuracy of two individual tree measurement algorithms using lidar data. Can. J. Remote Sens. 2008, 34, S338–S350. [Google Scholar] [CrossRef]
  22. Korpela, I.; Tuomola, T.; Välimäki, E. Mapping Forest Plots: An Efficient Method Combining Photogrammetry and Field Triangulation. Silva. Fenn. 2007, 41, 457–469. [Google Scholar] [CrossRef] [Green Version]
  23. Lähivaara, T.; Seppänen, A.; Kaipio, J.P.; Vauhkonen, J.; Korhonen, L.; Tokola, T.; Maltamo, M. Bayesian Approach to Tree Detection Based on Airborne Laser Scanning Data. IEEE Trans. Geosci. Remote Sens. 2014, 52, 2690–2699. [Google Scholar] [CrossRef]
  24. Paris, C.; Valduga, D.; Bruzzone, L. A Hierarchical Approach to Three-Dimensional Segmentation of LiDAR Data at Single-Tree Level in a Multilayered Forest. IEEE Trans. Geosci. Remote Sens. 2016, 54, 4190–4203. [Google Scholar] [CrossRef]
  25. Hengl, T. Finding the right pixel size. Comput. Geosci. 2006, 32, 1283–1298. [Google Scholar] [CrossRef]
  26. Vauhkonen, J.; Ene, L.; Gupta, S.; Heinzel, J.; Holmgren, J.; Pitkanen, J.; Solberg, S.; Wang, Y.; Weinacker, H.; Hauglin, K.M.; et al. Comparative testing of single-tree detection algorithms under different types of forest. Forestry 2011, 85, 27–40. [Google Scholar] [CrossRef] [Green Version]
  27. Harikumar, A.; Bovolo, F.; Bruzzone, L. Subdominant Tree Detection in Multi-Layered Forests by a Local Projection of Airborne LiDAR Data; IGARSS: Fortworth, TX, USA, 2017. [Google Scholar]
  28. Polewski, P.; Yao, W.; Heurich, M.; Krzystek, P.; Stilla, U. Detection of fallen trees in ALS point clouds using a Normalized Cut approach trained by simulation. ISPRS J. Photogramm. Remote Sens. 2015, 105, 252–271. [Google Scholar] [CrossRef]
  29. Hu, X.; Wei, C.; Xu, W. Adaptive Mean Shift-Based Identification of Individual Trees Using Airborne LiDAR Data. Remote Sens. 2017, 9, 148. [Google Scholar] [CrossRef] [Green Version]
  30. Ferraz, A.; Bretar, F.; Jacquemoud, S.; Gonçalves, G.; Pereira, L.; Tomé, M.; Soares, P. 3-D mapping of a multi-layer ed Mediterranean forest using ALS data. Remote Sens. Environ. 2012, 121, 210–223. [Google Scholar] [CrossRef]
  31. Vega, C.; Hamrouni, A.; El Mokhtari, S.; Morel, J.; Bock, J.; Renaud, J.P.; Bouvier, M.; Durrieu, S. PTrees: A point-based approach to forest tree extraction from lidar data. Int. J. Appl. Earth Obs. Geoinf. 2014, 33, 98–108. [Google Scholar] [CrossRef]
  32. Sačkov, I.; Hlásny, T.; Bucha, T.; Juriš, M. Integration of tree allometry rules to treetops detection and tree crowns delineation using airborne lidar data. iForest 2017, 10, 459–467. [Google Scholar] [CrossRef] [Green Version]
  33. Dai, W.; Yang, B.; Dong, Z.; Shaker, A. A new method for 3D individual tree extraction using multispectral airborne LiDAR point clouds. ISPRS J. Photogramm. Remote Sens. 2018, 144, 400–411. [Google Scholar] [CrossRef]
  34. Chen, W.; Hu, X.; Chen, W.; Hong, Y.; Yang, M. Airborne LiDAR Remote Sensing for Individual Tree Forest Inventory Using Trunk Detection-Aided Mean Shift Clustering Techniques. Remote Sens. 2018, 10, 1078. [Google Scholar] [CrossRef] [Green Version]
  35. Hamraz, H.; Contreras, M.A.; Zhang, J. Vertical stratification of forest canopy for segmentation of understory trees within small-footprint airborne LiDAR point clouds. ISPRS J. Photogramm. Remote Sens. 2017, 130, 385–392. [Google Scholar] [CrossRef] [Green Version]
  36. Ferraz, A.; Saatchi, S.; Mallet, C.; Meyer, V. Lidar detection of individual tree size in tropical forests. Remote Sens. Environ. 2016, 183, 318–333. [Google Scholar] [CrossRef]
  37. Yan, W.; Guan, H.; Cao, L.; Yu, Y.; Gao, S.; Lu, J. An Automated Hierarchical Approach for Three-Dimensional Segmentation of Single Trees Using UAV LiDAR Data. Remote Sens. 2018, 10, 1999. [Google Scholar] [CrossRef] [Green Version]
  38. Zhang, W.; Qi, J.; Wan, P.; Wang, H.; Xie, D.; Wang, X.; Yan, G. An Easy-to-Use Airborne LiDAR Data Filtering Method Based on Cloth Simulation. Remote Sens. 2016, 8, 501. [Google Scholar] [CrossRef]
  39. BCAL LiDAR Tools; Version bcal_lidar_tools_envi5X for ENVI 5.x, ed; Idaho State University, Department of Geosciences: Pocatello, ID, USA; Boise Center Aerospace Laboratory (BCAL): Boise, ID, USA, 2016.
  40. Singh, K.; Chen, G.; Mccarter, J.; Meentemeyer, R. Effects of LiDAR point density and landscape context on estimates of urban forest biomass. ISPRS J. Photogramm. Remote Sens. 2015, 101, 310–322. [Google Scholar] [CrossRef] [Green Version]
Figure 1. An example of 8 angular sectors.
Remotesensing 12 00515 g001
Figure 2. (a) Points belong to sector θj; (b) a vertical profile; (c) light detection and ranging (LiDAR) surface points.
Remotesensing 12 00515 g002
Figure 3. Sample plots: (a) simple plot; (b) complex plot.
Remotesensing 12 00515 g003
Figure 4. Results of the self-adaptive mean shift tree segmentation for seven plots: (a) Plot 1, (b) Plot 2, (c) Plot 3, (d) Plot 4, (e) Plot 5, (f) Plot 6, and (g) Plot 7.
Remotesensing 12 00515 g004aRemotesensing 12 00515 g004b
Figure 5. Results of different tree segmentation methods for seven plots: (1) marker-controlled watershed segmentation, (2) Fixed bandwidth mean shift, (3) Yan’s in [37], and (4) Self-adaptive bandwidth mean shift.
Remotesensing 12 00515 g005aRemotesensing 12 00515 g005b
Table 1. Specifications of the backpack laser scanning system.
ParametersValue
Weight5.8 kg
Working time2.5 h each battery
Laser scanning systemVelodyne 16E
Measurement distance range100 m
Vertical field angle−15 ~+15 degrees
Data accuracy<5 cm
Table 2. Parameter sensitivity of grid size ɛ and number of angular sector n.
ParameterValueDETOMCOM
ɛ0.1 m0.870.130.13
0.2 m0.870.130.09
0.3 m0.800.200.08
0.4 m0.770.230.08
0.5 m0.720.280.07
n20.840.160.04
40.850.150.05
60.850.150.06
80.870.130.09
120.870.130.13
DET is the rate of trees correctly detected; OM is the rate of undetected trees, and COM is the rate of falsely detected trees.
Table 3. Individual tree detection accuracy under different point densities.
DensityDETOMCOM
100% (40 points/m2)0.870.130.09
50% (20 points/m2)0.720.280.07
25% (10 points/m2)0.550.450.07
10% (4 points/m2) 0.320.680.05
DET is the rate of trees correctly detected; OM is the rate of undetected trees, and COM is the rate of falsely detected trees.
Table 4. Individual tree segmentation results of the simple and complex plots using our self-adaptive mean shift method.
PlotsNumberRefDETOMCOM
Simple plotsPlot 1-31540.950.050.08
Complex plotsPlot 4-71240.800.200.10
DET is the rate of trees correctly detected; OM is the rate of undetected trees, and COM is the rate of falsely detected trees.
Table 5. Parameters used in different methods.
MethodParametersValue
Marker-controlled watershed segmentationSpatial resolution of canopy height model0.5 m
Fixed bandwidth mean shiftSearch radius2.0 m
Horizontal bandwidth1.5 m
Vertical bandwidth5.0 m
Yan’s in [37]Voxel size0.2 m
Height compression4
Search radius2.0 m
Horizontal bandwidth1.5 m
Vertical bandwidth5.0 m
Minimum distance between clusters2.0 m
Profile size in x- and y- direction0.5 m
Maximum horizontal distance4.5 m
Table 6. Comparison of tree segmentation performance among different approaches.
MethodDETOMCOM
Self-adaptive bandwidth mean shift0.870.130.09
Marker-controlled watershed segmentation0.870.130.13
Fixed bandwidth mean shift0.840.160.11
Yan’s in [37]0.900.100.11
DET is the rate of trees correctly detected; OM is the rate of undetected trees, and COM is the rate of falsely detected trees.

