Next Article in Journal
Performance Evaluation of Troposphere Estimated from Galileo-Only Multi-Frequency Observations
Next Article in Special Issue
Knowledge and Data-Driven Mapping of Environmental Status Indicators from Remote Sensing and VGI
Previous Article in Journal
Cloud Detection Based on High Resolution Stereo Pairs of the Geostationary Meteosat Images
Previous Article in Special Issue
Integrating Activity-Based Geographic Information and Long-Term Remote Sensing to Characterize Urban Land Use Change
 
 
Retraction published on 13 October 2020, see Remote Sens. 2020, 12(20), 3346.
Article

The Exploration of Urban Material Anabolism Based on RS and GIS Methods: Case Study in Jinchang, China

1
Key Laboratory of Western China’s Environmental Systems (Ministry of Education), College of Earth and Environmental Sciences, Lanzhou University, Lanzhou 730000, China
2
Institute for Circular Economy in Western China, Lanzhou University, Lanzhou 730000, China
3
Institute of Green Development for the Yellow River Drainage Basin, Lanzhou University, Lanzhou 730000, China
4
School of Geography, Nanjing Normal University, Nanjing 210000, China
*
Author to whom correspondence should be addressed.
Remote Sens. 2020, 12(3), 370; https://doi.org/10.3390/rs12030370
Submission received: 31 December 2019 / Revised: 15 January 2020 / Accepted: 21 January 2020 / Published: 23 January 2020
(This article belongs to the Special Issue Integrating Remote Sensing and Social Sensing)

Abstract

:
As an open artificial ecosystem, the development of a city requires the continuous input and output of material and energy, which is called urban metabolism, and includes catabolic (material-flow) and anabolic (material-accumulation) processes. Previous studies have focused on the catabolic and ignored the anabolic process due to data and technology problems. The combination of remote-sensing technology and high-resolution satellite images facilitates the estimation of cumulative material amounts in urban systems. This study focused on persistent accumulation, which is the metabolic response of urban land use/urban land expansion, building stock, and road stock to land-use changes. Building stock is an extremely cost-intensive and long-lived component of cumulative metabolism. The study measured building stocks of Jinchang, China’s nickel capital by using remote-sensing images and field-research data. The development of the built environment could be analyzed by comparing the stock of buildings on maps representing different time periods. The results indicated that material anabolism in Jinchang is a distance-dependent function, where the amounts and rates of material anabolism decrease with changes in distance to the central business district (CBD) and city administration center (CAC). The cumulative metabolic rate and cumulative total metabolism were observed to be increasing, however, the growth rate has decreased.

Graphical Abstract

1. Introduction

Cities are geographical units with the most concentrated human activities and the most intensive human–environment interactions. Population concentration, economic production, resource consumption, and waste discharge are concentrated in these areas [1]. As an open artificial ecosystem, like living organisms, cities also need continuous material- and energy-metabolism processes (input–conversion–output) for normal operation [2,3,4]. China is at a stage of rapid urbanization. According to the China Statistical Yearbook, the urbanization rate of permanent residents in 2015 was 56.10%. At the end of 2017, the total population of mainland China was 1390.008 million, of which the urban resident population was 813.47 million, and the urbanization rate of permanent residents reached 58.52% [5]. However, in the past extensive development mode [6], there were many increasingly serious problems in urban areas such as resource and energy shortages, degradation of environmental quality, and decline in the quality of human life [7]. This was especially true for resource-based cities, which are an important type of city in China and have contributed much to Chinese economic growth [8,9]. For a long time, due to an overemphasis on resource output, neglect of ecological environment protection, lack of overall planning, and resource decay, resource-based cities were confronted with severe problems such as an unbalanced economic structure, lack of development of replacement industries, and a sensitive and fragile ecological environment [10,11,12]. According to the National Planning for the Sustainable Development of Resource-Based Cities, released in 2013, the number of resource-based cities was 262, which accounts for more than half of the cities in China. Thus, the sustainable development of resource-based cities is an important component and prerequisite for the sustained and healthy development of the Chinese economy [13]. Therefore, it is very urgent to conduct in-depth research on resource-based urban environmental problems and their essential causes.
Like body organs, a city needs continuous material, energy, and information flow (input and output), called urban metabolism, to maintain normal operation [14,15,16]. From a metabolic point of view, the environmental problems faced by cities can be attributed to structural disorder and imbalance of urban material- and energy-metabolism systems [3,4,17]. Therefore, the relationship between urban metabolic structure and process, and urban environmental problems is crucial for systematically analyzing the crux of urban environmental problems, promoting resource conservation and environmental protection, and achieving sustainable development [18]. Urban metabolism, which was first proposed by Wolman in 1965, supposes that urban operation is a metabolic process that includes the input of energy, water, and mineral resources, the supply of products and services, and waste discharge [19]. The metabolic process includes two major phases (subaccounts): catabolism (flow account) and anabolism (accumulation account). Urban catabolism is the process of material- and energy-flow input, processing, and output, which refers to the metabolic structure and process; urban anabolism is the accumulation of material in the urban system (materials left in the urban system in the metabolic process) that refers to the expansion of substantial space and material stock in an urban system, and lags the resource and environmental impact of catabolism. For example, the accumulation of infrastructure (e.g., roads, buildings, and public facilities), production facilities, and durable household goods in cities [20].
Current studies focus on the flux, efficiency, and effect of urban metabolism to identify the structure and function of urban ecosystems [21,22,23]. Empirical studies were mostly concentrated on the metabolism of water, energy, and other typical substances (e.g., carbon, nitrogen, and phosphorus) in the United States [14], Canada [24], Ireland [25], Vienna [26], Hong Kong [23], Taipei [27,28], Sydney [29], Beijing [30], and Shenzhen [31,32,33,34,35,36,37,38,39] by using methods of material-/substance-flow, energy, and input–output analysis [40,41]. However, most empirical studies conducted black-box analysis, and ignored the internal structure of the metabolic system and the interaction between metabolic units/agents, which can be used to interpret the mechanism of urban metabolism. In order to resolve the flaws of current studies, the approaches of ecological-/social-network and input–output analysis were used to deepen the understanding of the structure and process of urban metabolism [4,30,42,43,44,45,46]. The current approaches of urban metabolism are mostly concentrated on accounting for material and energy flow in a city (i.e., the core is given to flows rather than stocks), which is the result of material accumulation and is also crucial to understand fluxes in urban ecological systems [38]. Nonetheless, some studies have emphasized the importance of stock analysis and attempted to measure carbon, nitrogen, and metal-element stocks [47,48,49]. Nevertheless, urban metabolic stocks such as buildings and other matters accumulated in urban tissue have not received much attention. In brief, current studies are only concerned with the catabolism process (input–output flow) that helps to understand the increment of an urban ecosystem, and few studies have focused on the anabolic process, which helps to understand the stock. At present, urban planning in China is experiencing a transformation stage from incremental planning to stock planning [50,51,52,53]. Therefore, urban anabolism is crucial to understand internal metabolism processes and advance new policies and strategies.
Urban anabolic processes [54], which are in contrast with the catabolic and refer to the material accumulation in an urban ecosystem, are also important in understanding urban growth in terms of physical size and the urban internal-metabolism process [55]. Luis proposed a new indicator, Technomass, to measure urban anabolic processes in terms of volume and rates of matter accumulation [20]. This paper applied this novel indicator to investigate the rates and dynamics of the anabolic process (material accumulation) in the urban tissue of resource-based cities located in northwest China, both in spatial terms from the center to the periphery and in temporal terms.
In summary, on the basis of existing research, the urban material-accumulation system was used as a black box to study anabolism. Jinchang, a typical resource-based city in northwest China, was selected as the research object, and its anabolic time–space evolution was studied. Regular analysis was carried out to analyze the intrinsic link between metabolic structure and urban environmental issues and urban sustainability, and to explore ways to achieve resource conservation, reduce environmental pollution, and enhance urban sustainability by changing metabolic structures. The sustainable development of cities provides theoretical and practical support. Research on resource-based urban metabolism can provide ideas and methods for systematically analyzing the crux of urban environmental problems, supplement the research system of urban metabolism in theory and with evidence, and enrich the research content of the human–land relationship.

2. Materials and Methods

2.1. Research Area

This study selected the built-up area of the city of Jinchang as the specific research area. Jinchang is located in the eastern section of the Hexi corridor in the province of Gansu, north of Qilian mountain and at the southern edge of the Alxa terrace. As a heavy industrial city with nonferrous metals and heavy chemicals as the mainstay, Jinchang is China’s largest nickel–cobalt production base and platinum-group-metal refining center, known as the “nickel capital”. Due to its location in the deep northwestern inland areas, the climate is cold and precipitation is scarce, resulting in water-resource scarcity. It is listed as a national key water-deficient city. Economic structure led by resource processing while promoting the rapid development of the local economy has brought about serious environmental-pollution problems, especially air pollution caused by heavy industry with a high energy consumption and a short industrial chain (the most prominent pollutant is SO2). In order to alleviate resource constraints and improve environmental quality, the city has developed an industrial symbiosis system around wastewater, waste gas, and waste residue in recent years through the development of a circular economy. Therefore, Jinchang’s material- and energy-metabolism network is more complex and diverse than that of other industrial cities, with typicality and representativeness. It can represent the development level of northern resource-based cities to a certain extent, thus indirectly depicting regional differences in urban metabolic efficiency. It is of great significance to improve the temporal evolution and spatial distribution of biomass accumulation in urban ecosystems. At the same time, a comparative analysis of Jinchang with other typical cities helps to promote the in-depth study of urban metabolic systems in China. It is of great significance to play a more effective role in improving the metabolic function of urban ecosystems, and also provides a decision-making reference for improving urban ecological quality.
China’s cities do not refer to geographically urbanized areas, but to administrative divisions. Such urban boundaries, defined by administrative means, often decouple sustainability research from the city’s own land-use attributes. Urban areas and nonurbanized agricultural areas are usually included in the defined urban areas. Therefore, in the study of sustainability in Chinese cities, this paper selected urbanized (built-up) areas in the city as research objects, which makes the research more targeted and comparable with that in other cities [56].

2.2. Methods and Data Sources

Cumulative urban mass distribution in urban spaces has a certain regularity and, in a short period of time, does not occur between the flow of different subjects [57]. The process of anabolic metabolism in a city can be analyzed by material evolution over time. Cumulative metabolic capacity can be used as a measure of the amount of material accumulated in urban tissue [58,59]. To achieve a measurement of cumulative metabolic flux, urban metabolism is separated according to the process to which the material belongs (Figure 1) [20]. According to the relative durability and mobility of various materials, accumulation can generally be divided into two categories: flowable material accumulation (buildings and roads) and mobile material accumulation (vehicles, household durable goods, machines and tools, technological assets). The cumulative metabolic amount corresponds to the concept of accumulated stock. In this regard, the cumulative amount of metabolism quantifies what was accumulated [60,61,62]. This study focused on persistent accumulation, which is the metabolic response of urban land use to land-use changes, the metabolic responses of urban land expansions (parts I and II, i.e., buildings and roads); and the subsequent sections are for further investigation.
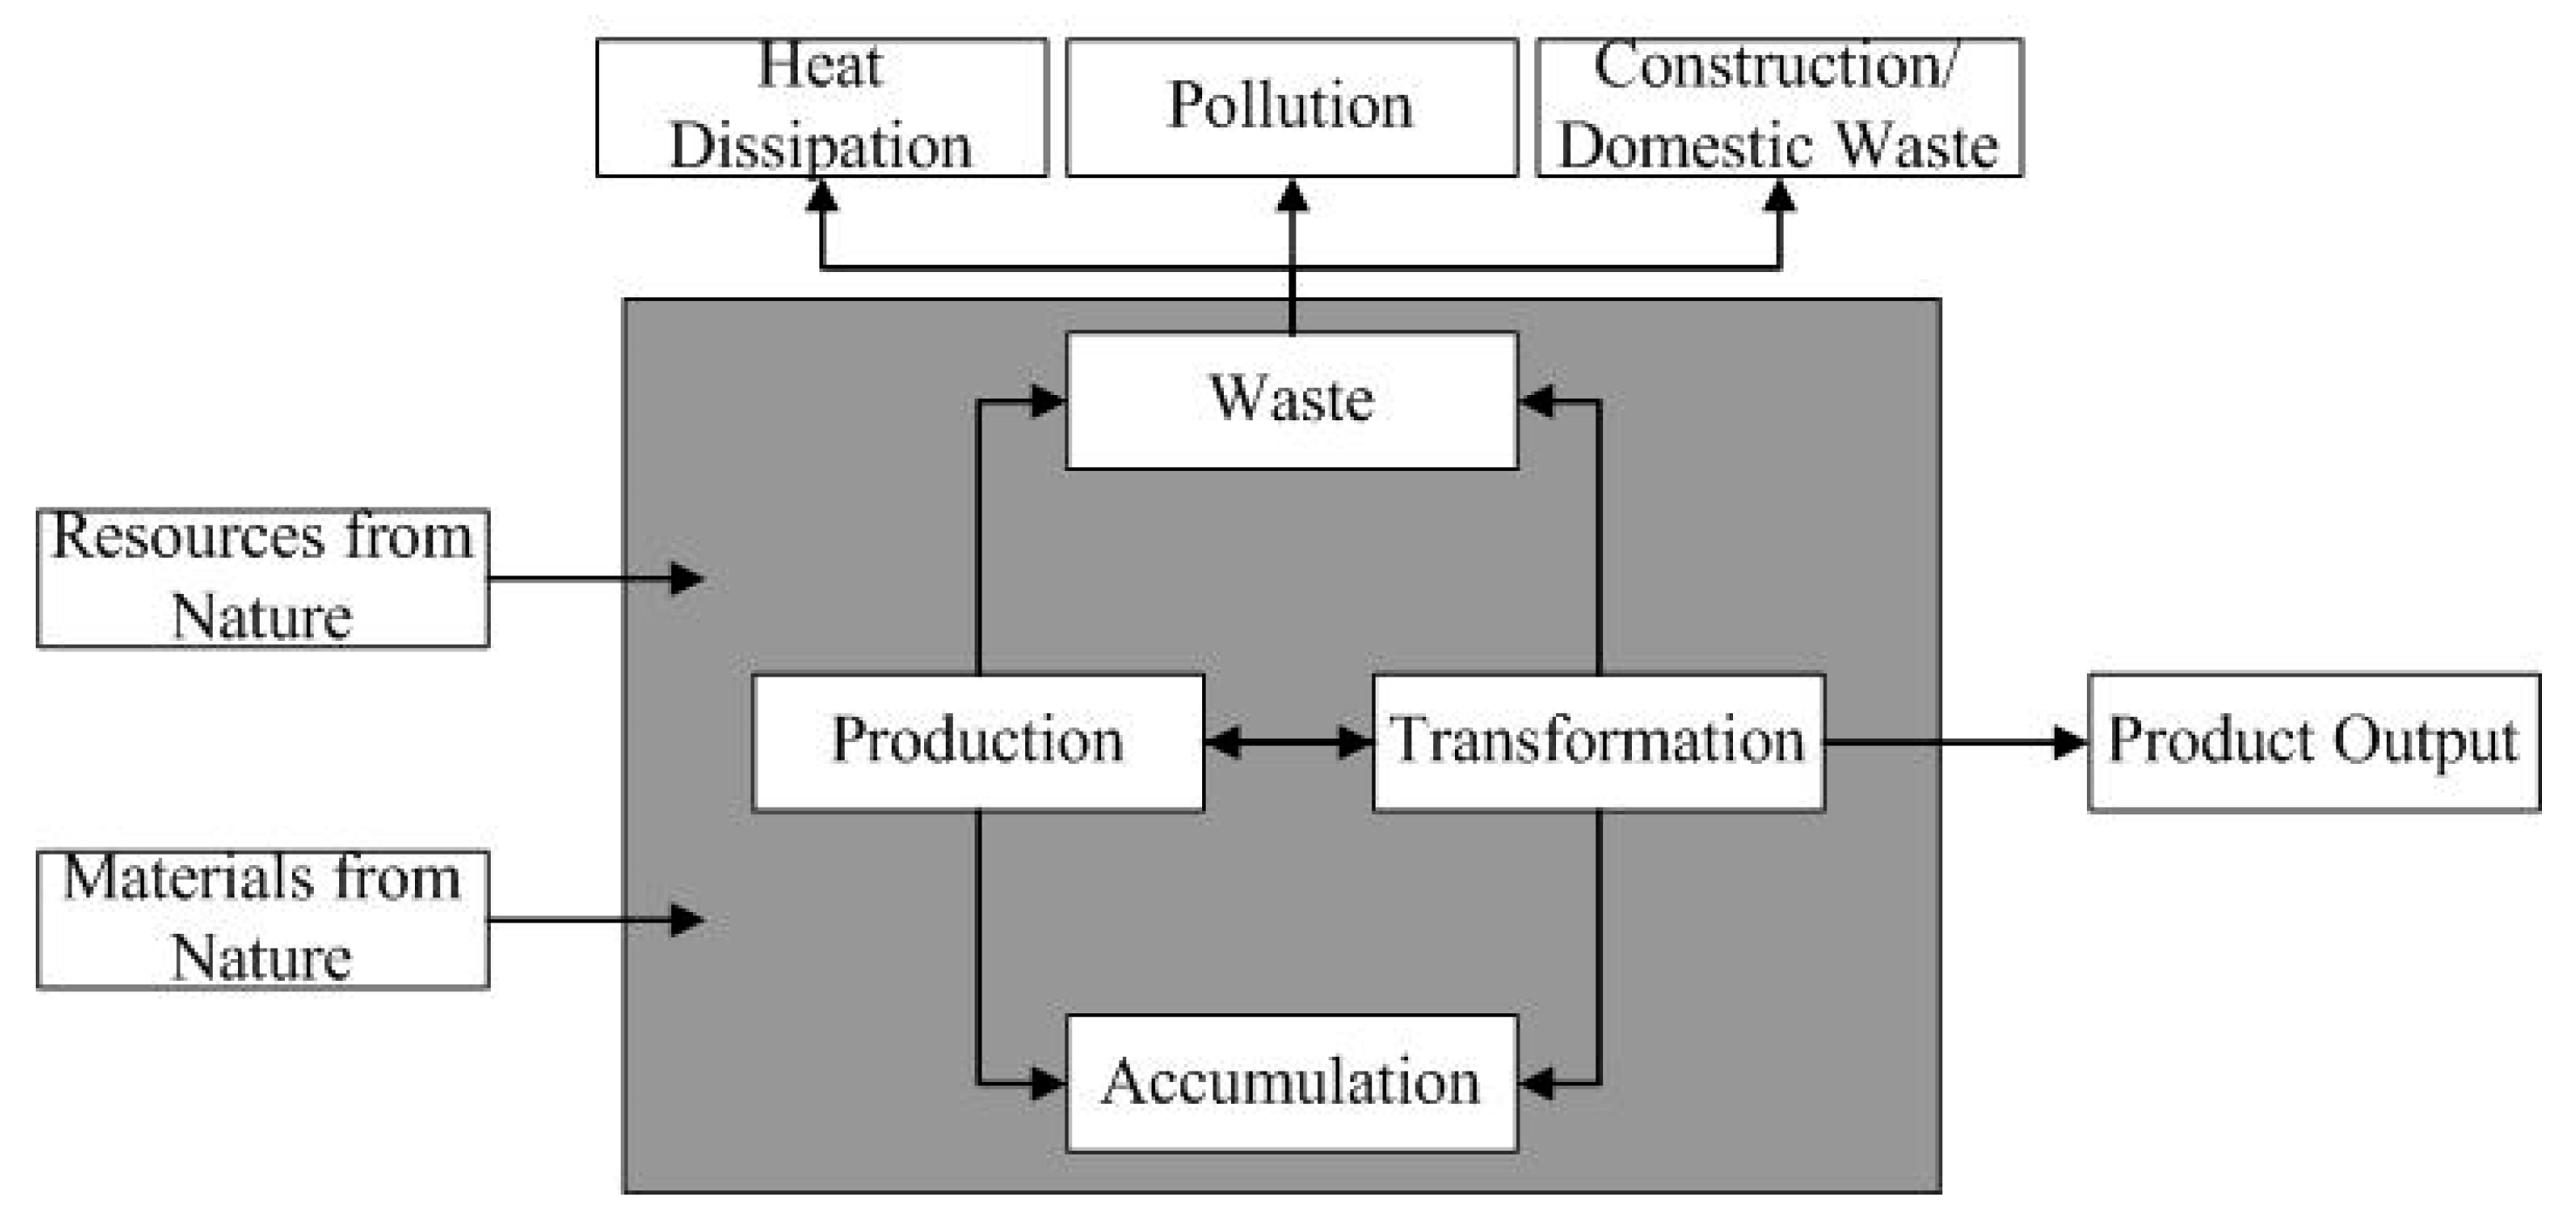
As a complex artificial ecosystem, a city is formed by flows (processes of extraction, transformation, utilization, and waste) and stocks of materials and energy. Stocks are formed by material accumulation in the production and transformation process (black box in Figure 2) [20]. Understanding the process and amount of material accumulation is essential to figure out stocks in an urban ecosystem. Cumulative metabolism is an important way to achieve this goal.
The cumulative metabolic rate is calculated by the following formula:
φ = [   i = 1 n ( b h ) i + 1 / 2 j = 1 n ( r j   ) ] A
where φ is the building and road accumulation; b is the building surface area; h is the building height; r is the roads and other hardened surfaces; and A is the sample-point sum.
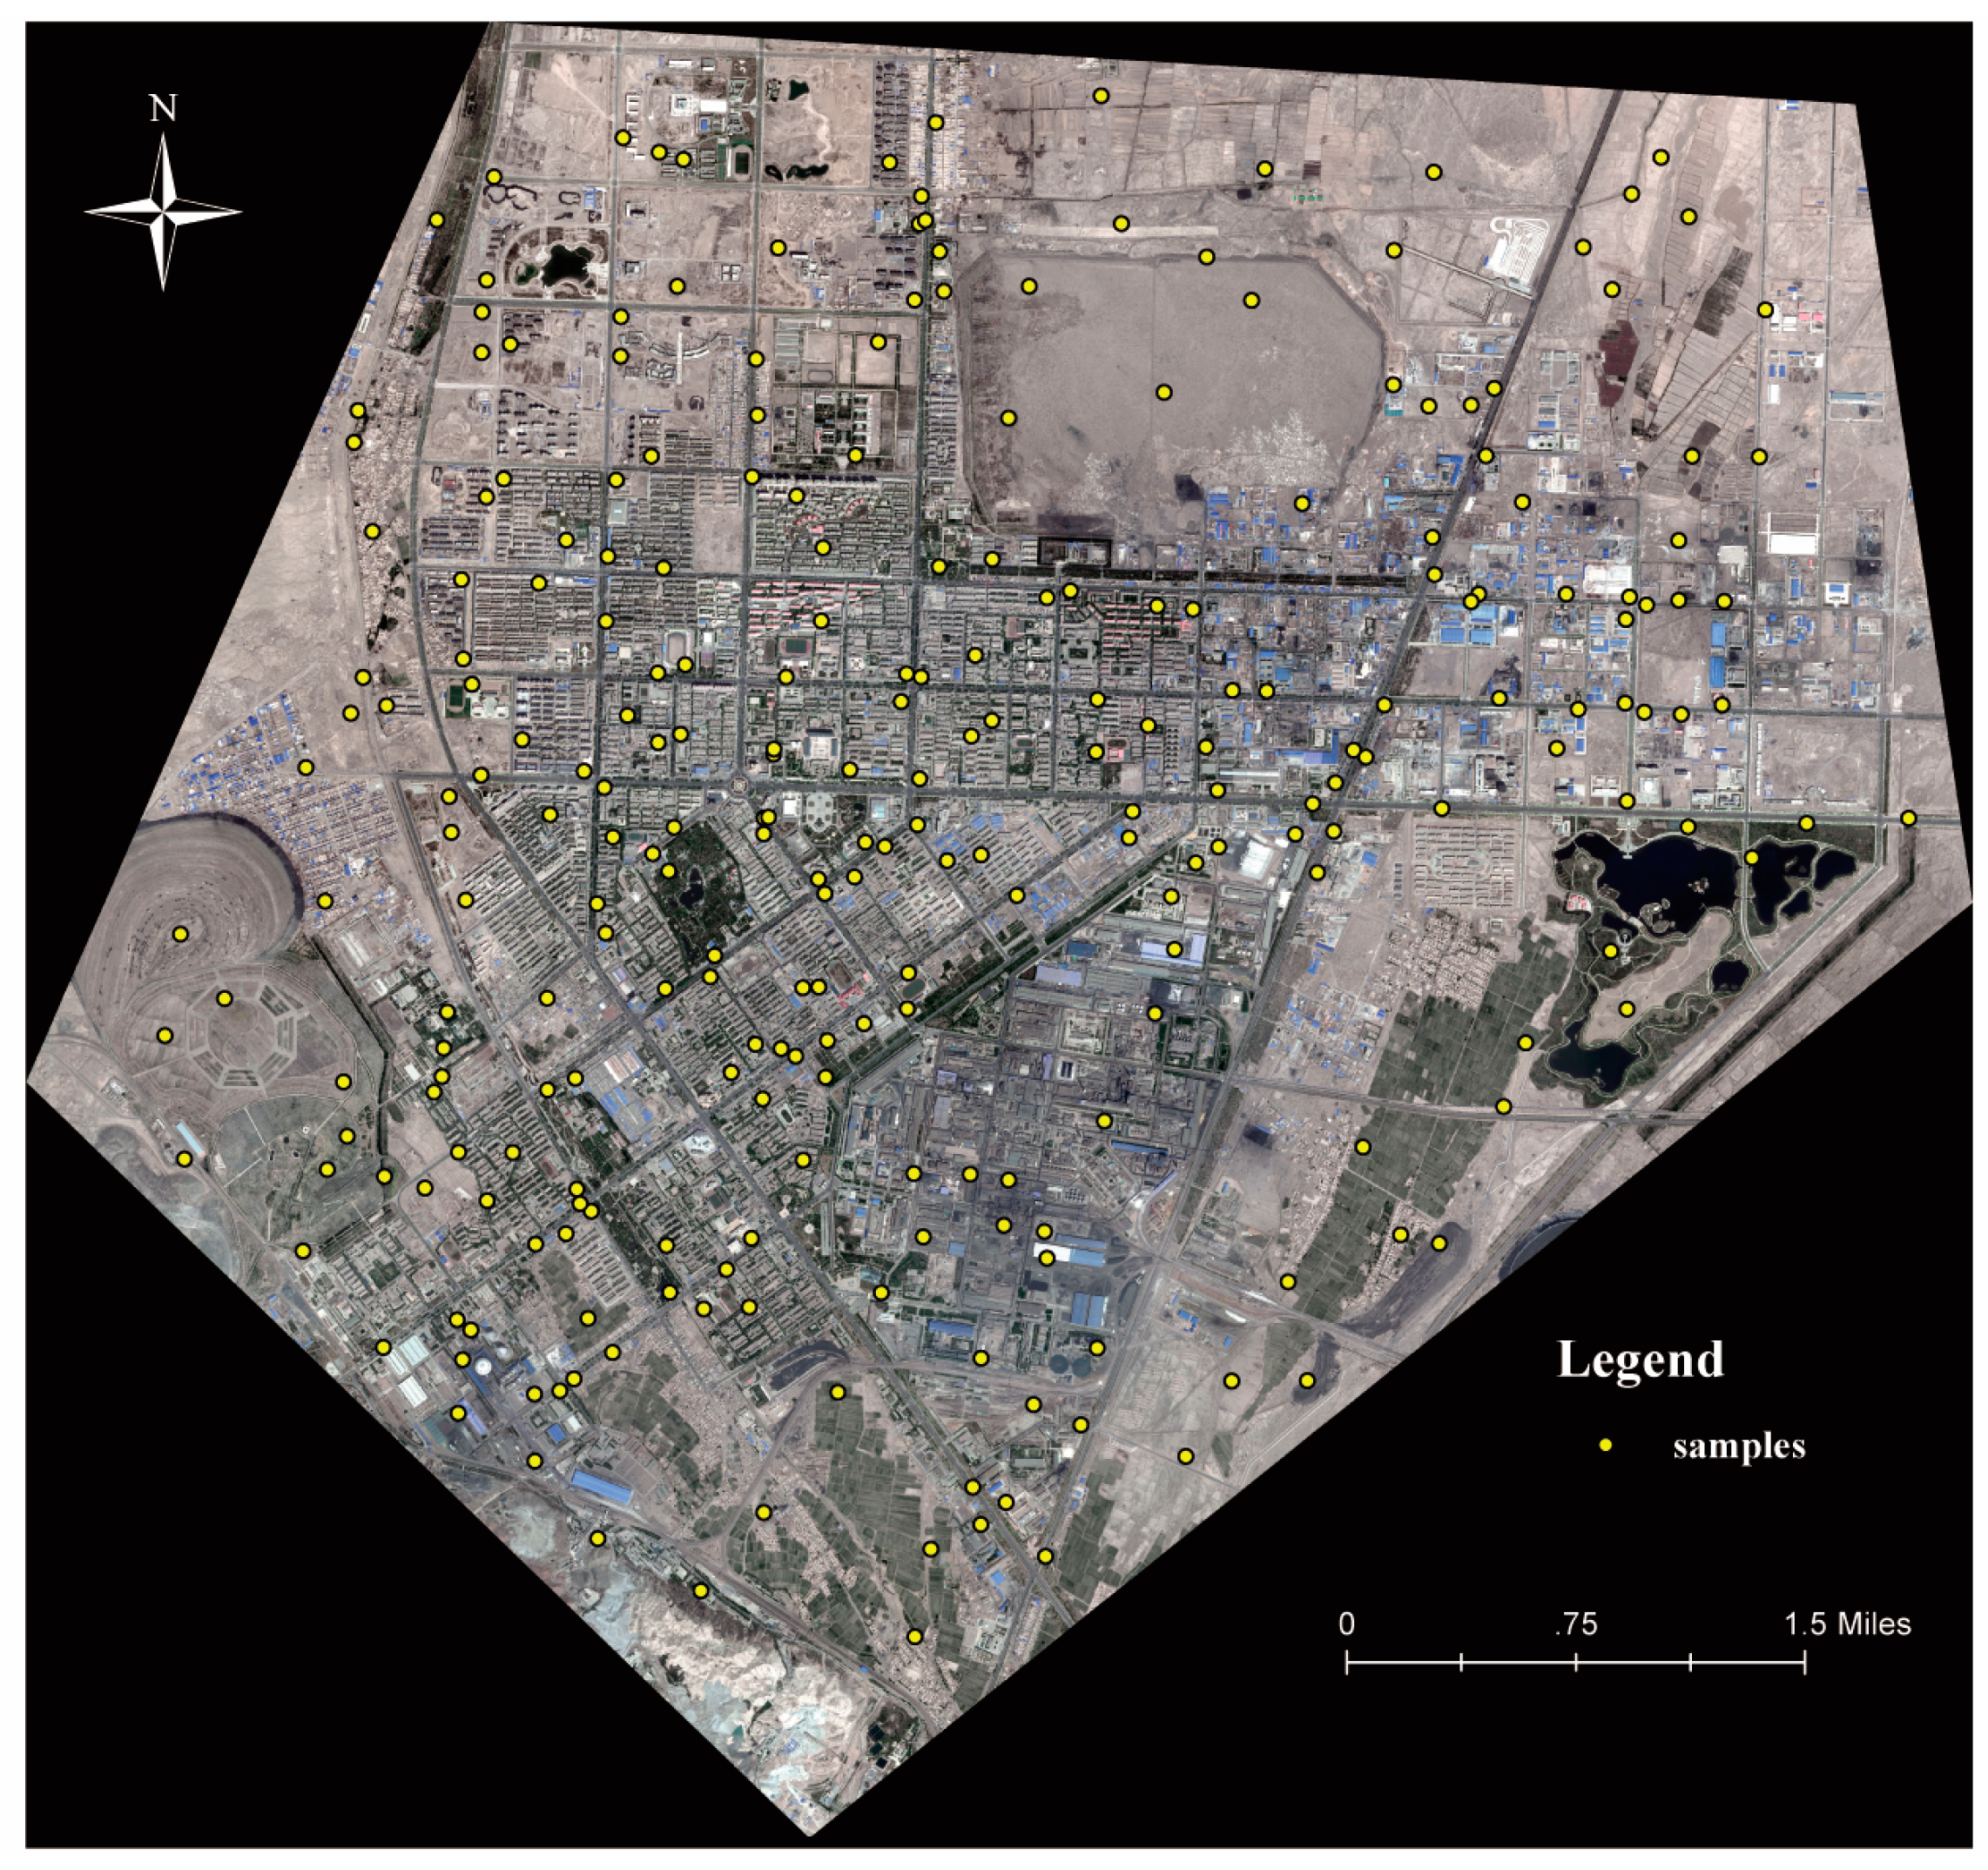
In order to obtain the key parameters in Equation (1), we chose WV-2 and QB four-band fusion/WV-1 panchromatic remote-sensing images (0.5 m resolution) of the built-up area of Jinchang in 2003, 2011, and 2015 as the basic data. Due to the large number of existing buildings and samples in Jinchang’s built-up area, a sample survey was conducted by using ArcGIS to select 260 sample points from a 65 km2 study area by means of an automatic random-sampling function. Samples were randomly distributed in consecutive urban-tissue samples covering the scope of distribution in all parts of the city, with a certain degree of randomness and representation. The geographical location of the distribution of each sample is shown in Figure 3. On the basis of the 260 selected sample points, a buffer zone was established at a radius of 50 meters as a circular sample. Sampling could be a trend to explore space in more detail.
On the basis of remote-sensing data, urban statistics, and field-survey data, we used methods of spatial and buffer analysis on the ArcGIS platform. Geographic Information System (GIS) technology in urban-metabolism research can better display the spatial- and temporal-distribution patterns of urban metabolism, and spatial analysis provides a new method to estimate the amount of material accumulation within an urban area [63].
Data were acquired from the Jinchang Statistical Yearbook, Urban Statistical Yearbook, and field-survey data. For the definition of the spatial extent of the study area, the border of the district of Jinchang, built in 2016, was taken as the boundary of the urban metabolic system. Building surface area, roads, and other hardened and surface areas could be obtained through the ArcGIS platform. Building-height data were obtained in three ways: (1) Conducted field survey (from July to October 2017); (2) the height data of some buildings were provided by the Jinchang Bureau of Urban Planning; and (3) combining the ArcGIS measurements of shadow length, sun angle, azimuth angle, satellite altitude angle, azimuth angle, shadow length, and the relationship between building height and building-height data was obtained [64,65,66,67].
When the sun and satellite were at the same side of a building, that is, the actual length of the building shadow at the same side of the building, S = H/tanβ, and the shadow length visible on the remote-sensing image is M = S−L = H/tanβ − H/tanα.
The formula between building height H and visible shadow length is:
H = M t a n α t a n β t a n α t a n β
where L is the shadow length of an object that is not visible in satellite image; α is the satellite elevation angle; and β is the solar elevation angle.
In the buffer zone of each 50 meter radius, building height, which was estimated on the basis of shadow length, was corrected by the measured data.
The data consisted of 260 samples, and there were two outliers in the data. SPSS software was used to check the data, and we found that the data obeyed a normal distribution. There were no missing values and no invalid data when fetching them. The description of the data structure is shown in Table 1.
The outliers were because two sample points were distributed in the higher floors near the central business district during random sampling. The city center is an area with intensive socioeconomic activities, with high-density and high-rise buildings. As more materials and resources were occupied, two outliers appeared near the central business district. We used spatial random sampling to determine the sample points, and conducted detailed investigations in the sample-point buffer to obtain the cumulative metabolic amount in the sample points. Therefore, the two high-value data had less error. Their existence more fully describes the data structure of cumulative metabolism and shows the distribution law. Random sampling had a chance to draw these areas. Although they were statistical outliers, they could not be ignored or discarded.
Locally weighted scatter plot smoothing (LOWESS) is a powerful tool that combines much of the simplicity of linear least-squares regression with the flexibility of nonlinear regression to explore the relationship between two variables [68,69,70]. LOWESS does this by fitting simple models to localized data subsets to build up a function that describes the deterministic part of data variation, point by point [71]. The main advantage of LOWESS is that a data analyst is not required to specify a global function of any form to fit a model to the data, and only to fit data segments [72]. The main idea of LOWESS is to take a certain percentage of local data as localized data subsets, and a low-degree polynomial is fitted to a data subset, with explanatory variable values near the point whose response is estimated at each point in the range of the dataset [73]. The polynomial is fitted using weighted least squares, giving more weight to points near the point whose response is being estimated, and less weight to points farther away [74]. The value of the point’s regression function is then obtained by evaluating the local polynomial using the explanatory variable values for that data point. The bandwidth determines how much of the data are used to fit each local polynomial, and thus controls the flexibility of the LOWESS regression function [75]. The smaller the bandwidth, the more local properties are valued, so that the fit is less smooth; otherwise, the fit is smoother. When analyzing the variation of different variables with independent variables, we considered fitting with different bandwidths to find the most suitable to keep the results as accurate as possible, and to keep the curve stable and smooth. In this way, the law could be better objectively reflected without losing much information, and the fitted value would not be too far from the actual value, so that we could truly obtain the law and avoid noise caused by information redundancy.

3. Results

3.1. Cumulative Case-City Metabolic Rate

Figure 4 and Table 2 show the estimated results of the material-accumulation amounts of 260 sample points. The average amount of the material accumulation in the circular-sample gradient was 28,366.83 m3/ha, the maximal amount was 171,244.28 m3/ha, and the minimal amount was 1000 m3/ ha.

3.2. Spatial Urban-Anabolism Pattern

The kernel-density method was used to analyze the cumulative metabolism of the sample points and explore the spatial pattern of urban anabolic metabolism (Figure 5). Results showed “[that cumulative metabolism was mainly concentrated around the central business district (CBD), city administration center (CAC), and the nearby city industrial center (CIC), which are areas with intensive economic activities and high-density building blocks. There were also several high-value cumulative-metabolism clusters that were located around residential areas and city parks. As the height and density of building blocks in residential and public areas are always lower than those in the CBD and CAC, the kernel-density value of cumulative metabolism was lower than that of the central areas. Briefly, material anabolism was highly concentrated around CBD and CAC, and presented a circular-structure spatial distribution in the districts of Jinchang.
In order to deeply explore the spatial pattern of cumulative metabolic volume, we analyzed the relationship between cumulative metabolic volume and distance from CBD, CAC, and CIC.
There was negative correlation between the cumulative-metabolism volume and distance to the CBD (Figure 6). The cumulative metabolism volume, measured as a logarithmic function of the distance to the CBD (i.e., with the increase of distance), displayed a slight decrease. The CBD may not be the city’s oldest urban tissue, but it is usually the most concentrated spatial unit of materials and economic activities in the urban ecosystem.
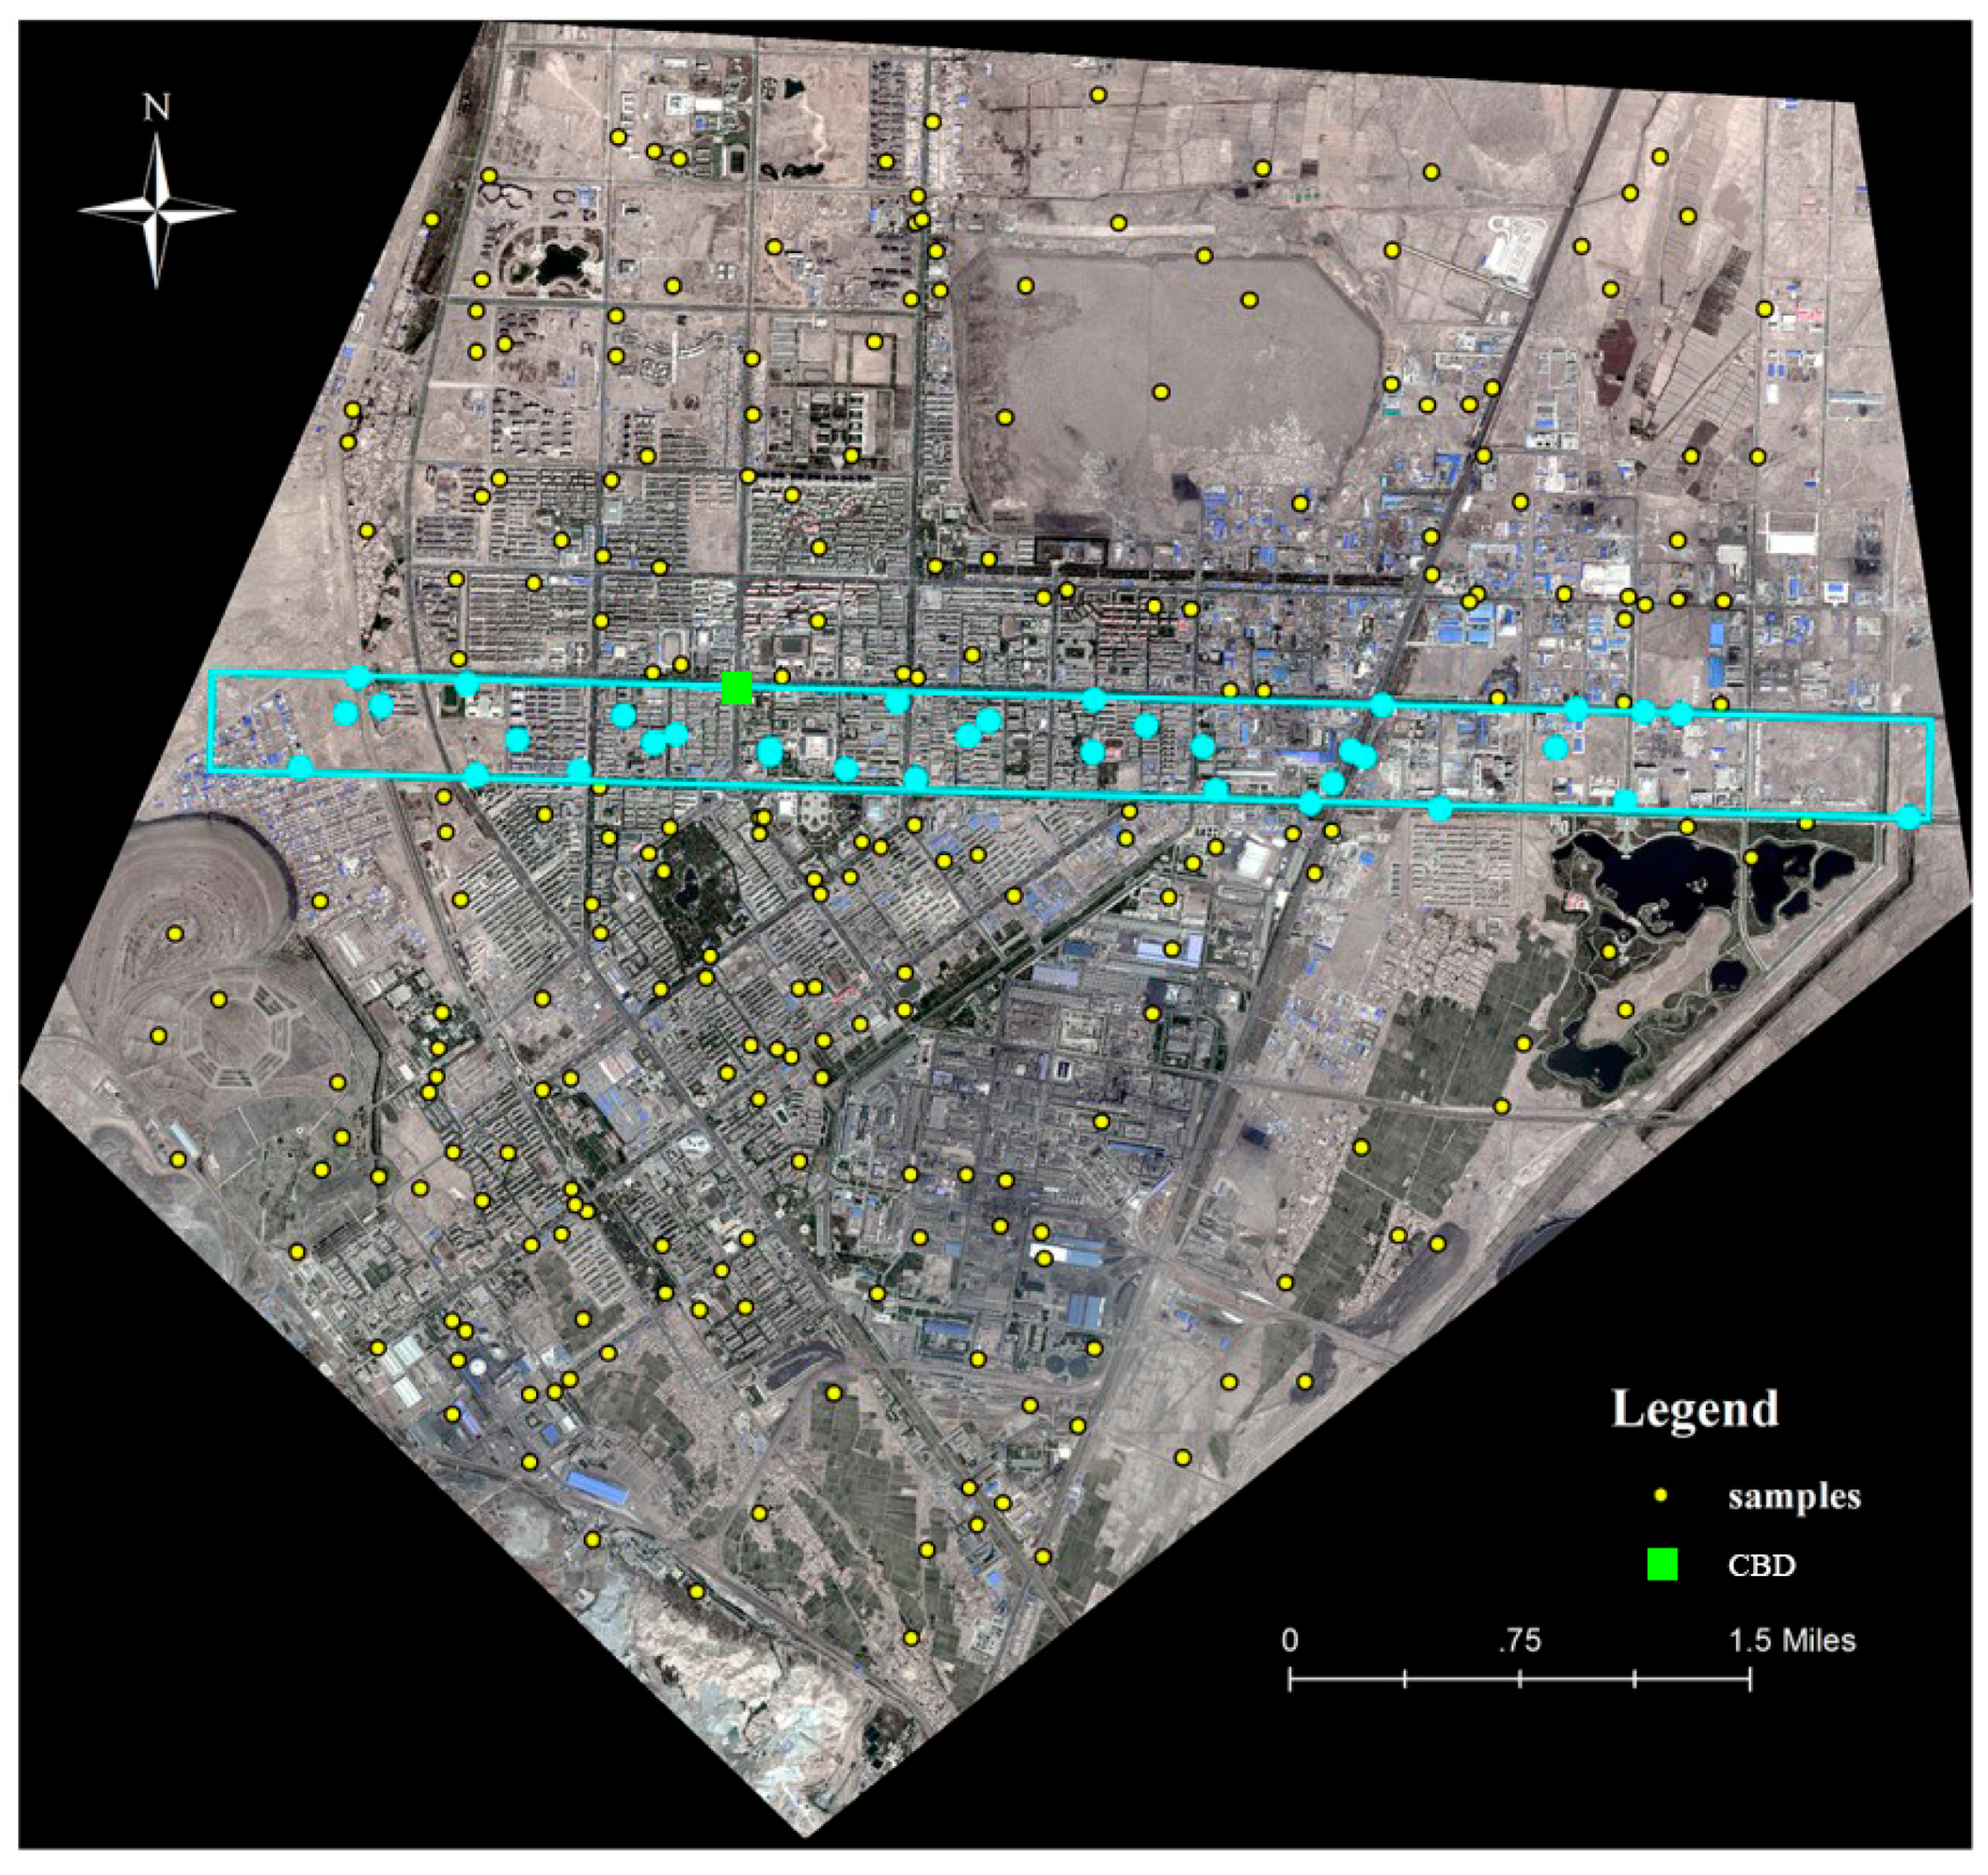
To verify the result in Figure 6, we randomly selected multiple transect circular samples (blue rectangle in Figure 7) and analyzed the relationship between cumulative metabolic volume and distance to CBD in each rectangular area (Figure 8). We also found that the cumulative material metabolic volume showed a slight decrease as a function of distance. Therefore, for the built-up area, we found that the volume of material anabolism decreased from the CBD (the economic center) to the periphery.
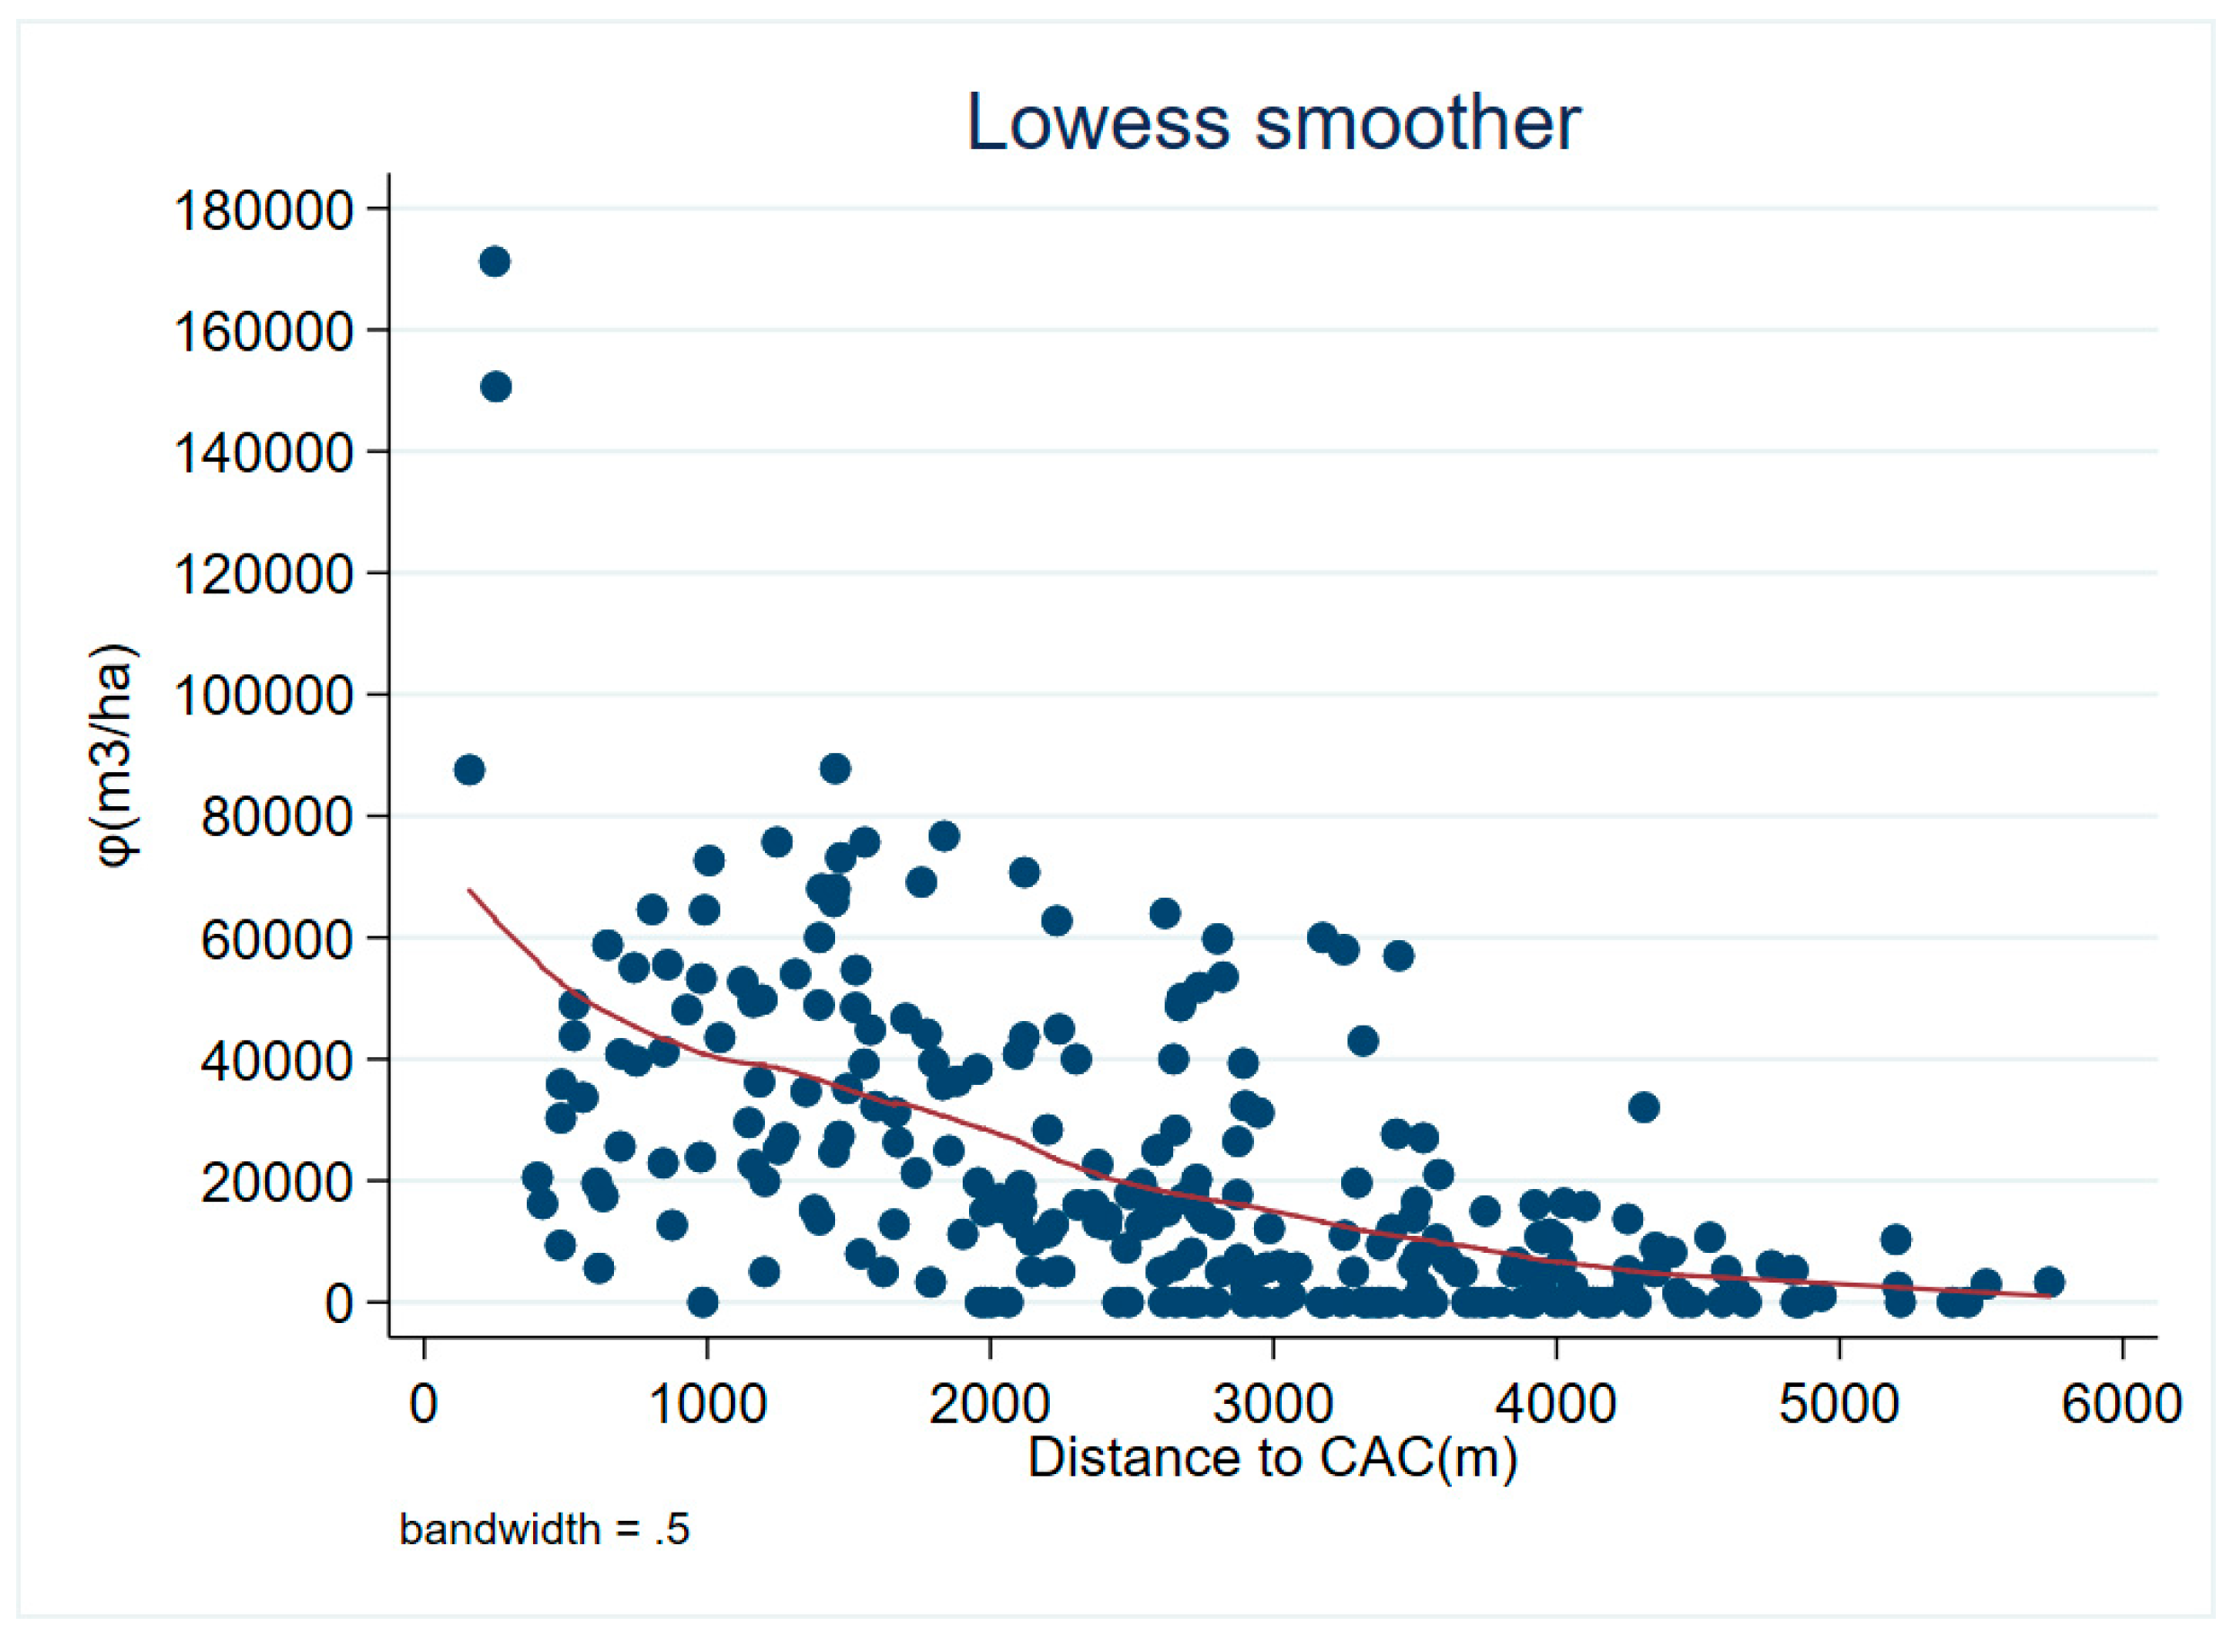
We also analyzed the relationship between cumulative metabolic volume and distance to the CIC (industrial park of nonferrous metals) and CAC (location of Jinchang municipal government) to explore if material anabolic volume was also the distance function of the CIC and CAC (Figure 9 and Figure 10). The decreasing amount of material anabolism from CIC toward the nonindustrial area of the city was not expected (Figure 9). However, the amount of material anabolism showed a decrease as a function of logarithmic function of the distance to the CAC, which was more obvious than in the CBD situation (Figure 10).
As for Chinese cities, the distance between the CBD and CAC is often short. In this case, the distance was 500 meters. Thus, we expected to find the same relationship between cumulative metabolic volume and distance to the CBD and CAC. In other words, the CBD-centric spatial pattern of material anabolism is the same as the CAC-centric pattern. Our findings proved the attenuation law of urban material anabolism with distance to the economic and administrative centers. However, with regard to the CIC, the attenuation law was not proven. Therefore, for a resource-based city, the spatial pattern of material anabolism is highly related to economic or political centers, but not the industrial center.

3.3. Temporal Changes in Urban Anabolism

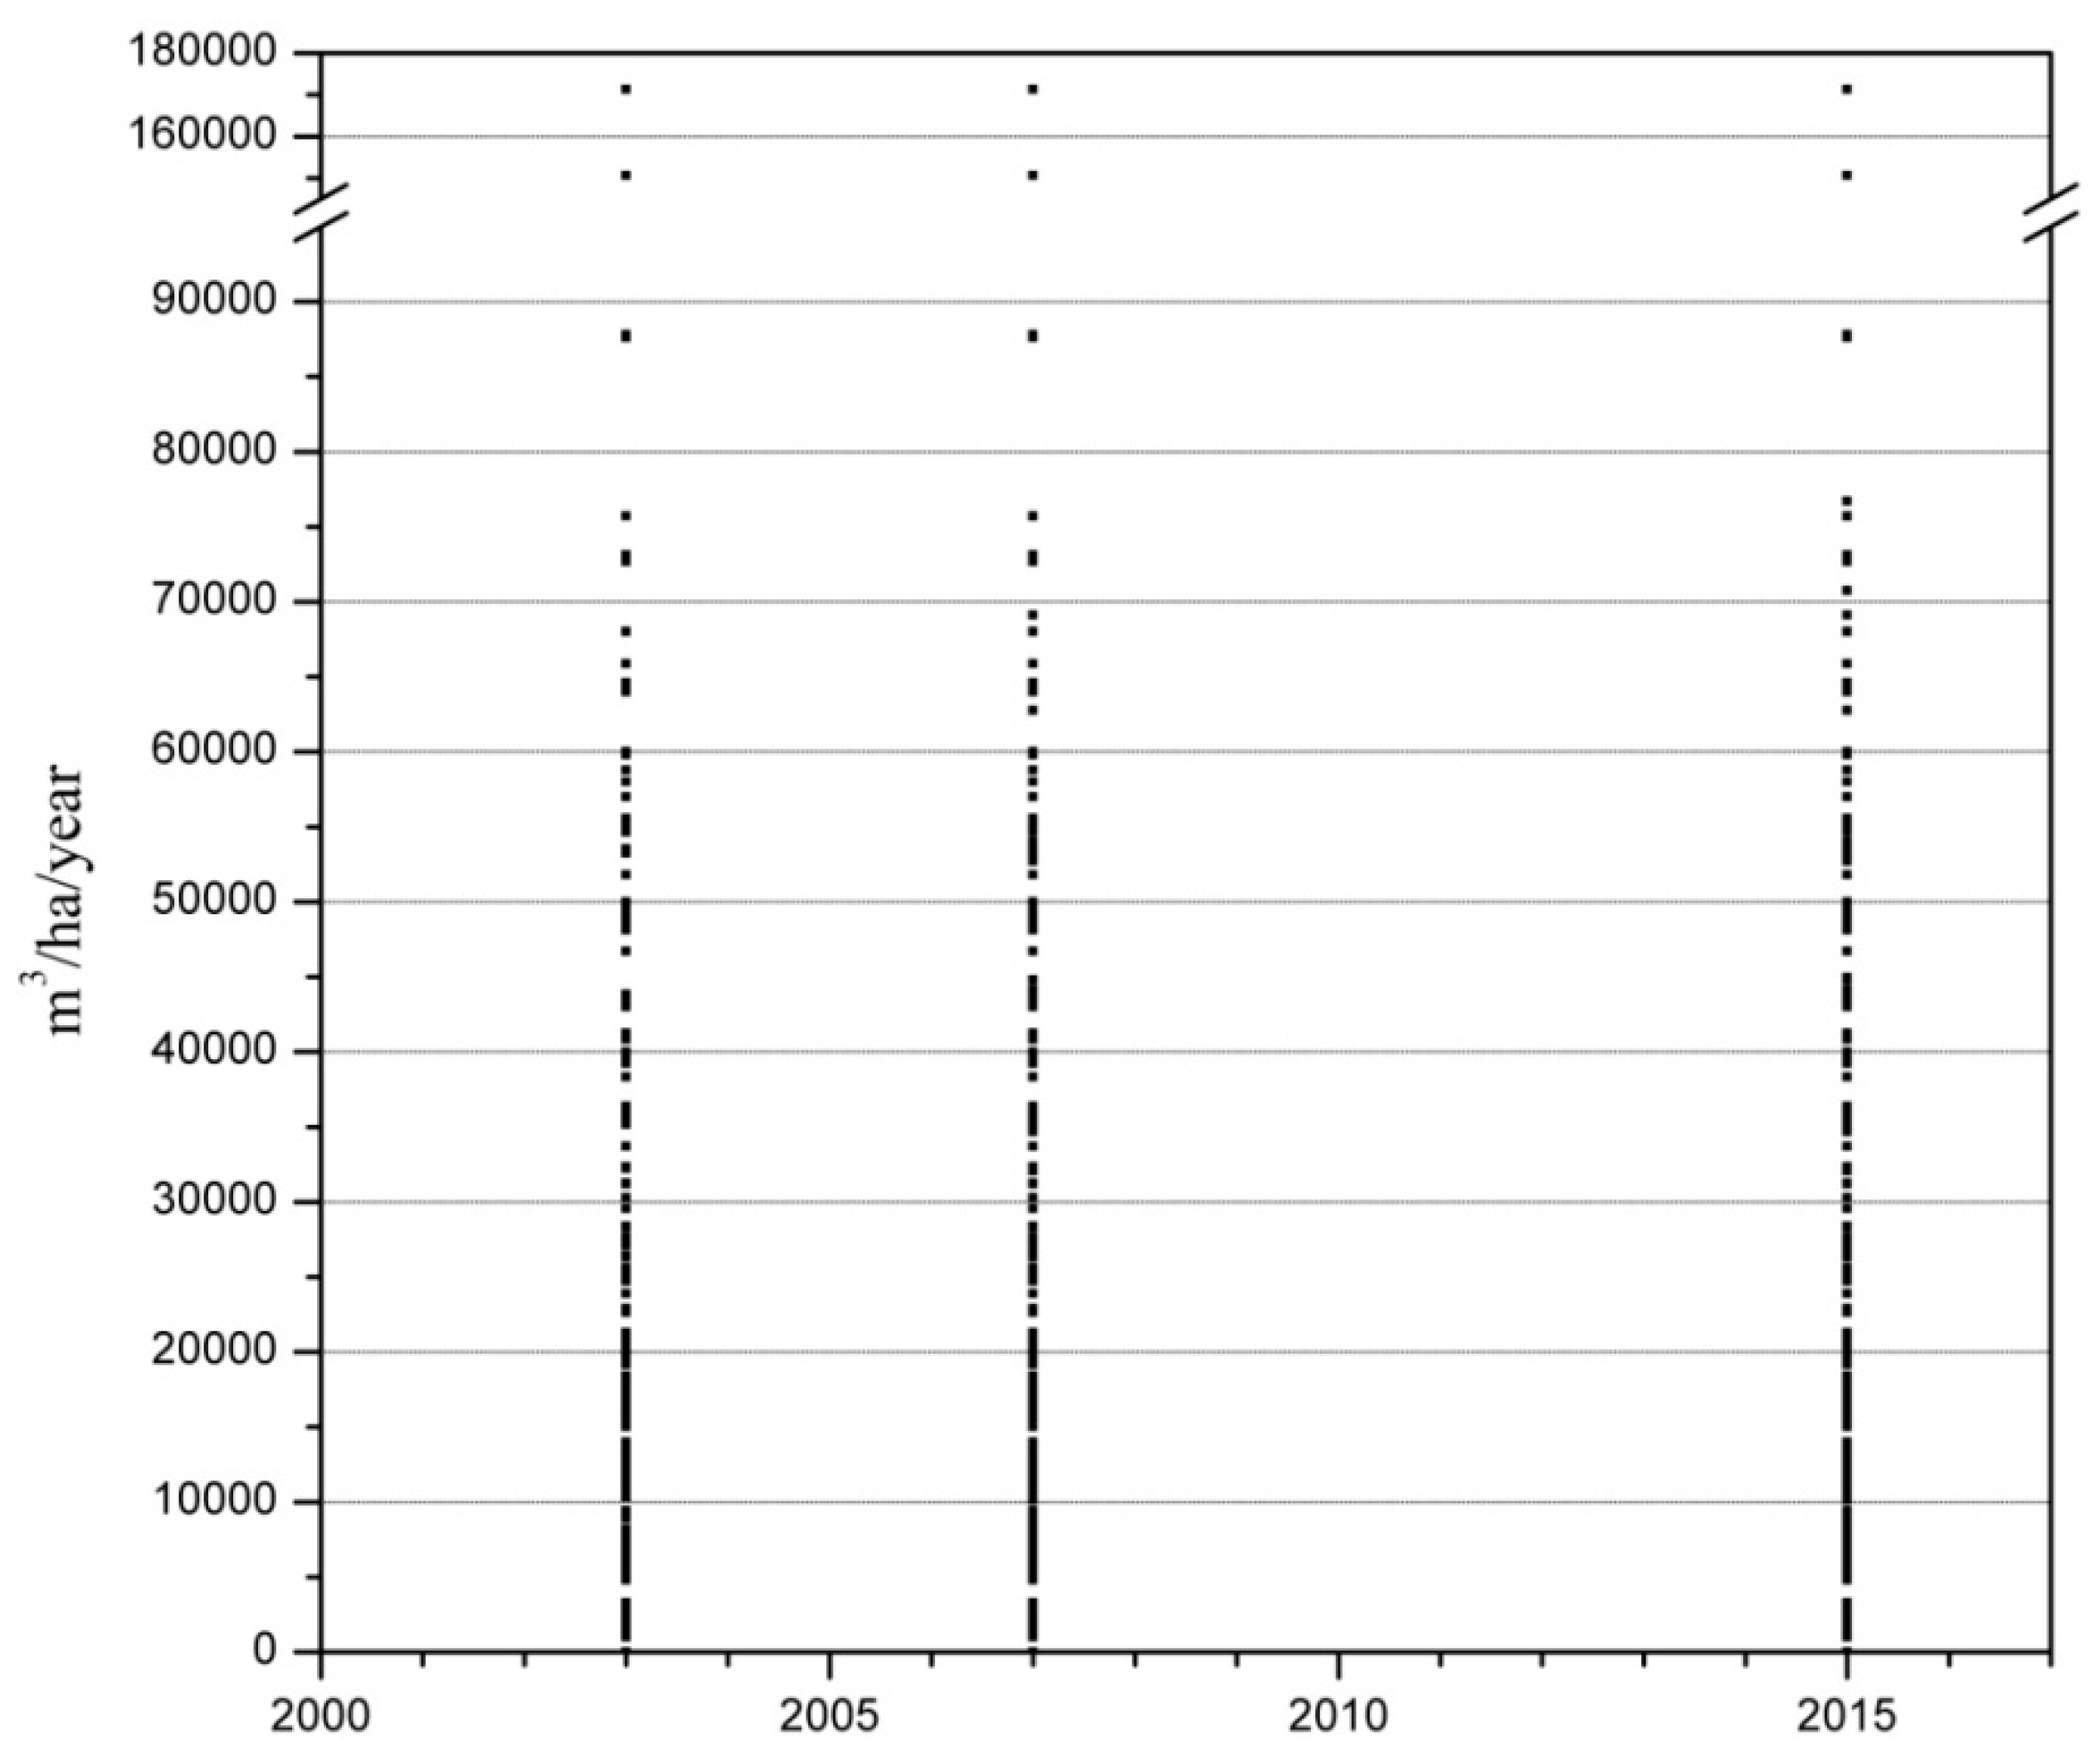
The study found that the material cumulative metabolic rate (φ/t) continued to grow within the 2003–2015 period for all circular samples. Cumulative metabolic rate and cumulative total metabolism were observed to continue to increase (Figure 11). Growth may be due to the advancement of construction technologies that resulted in urban compacting or the increasing use of urban space, which led to urban sprawling. Cumulative metabolic rate and total cumulative metabolism of materials from 2003 to 2015 are shown in Table 3.
However, the growth rate decreased for both the cumulative metabolic rate and total amount of cumulative metabolism. Specifically, the growth rate of the cumulative metabolic rate decreased from 141,757.5653 m3/ha/year during 2003–2007 to 27,632.45296 m3/ha/year during 2007–2015.

4. Discussion and Conclusions

The main purpose of using material anabolism is to derive a simple and convenient spatial indicator of total material accumulation in urban organizations, and to facilitate the understanding of urban systems as ecosystems from a metabolic perspective. The study explored the material anabolism and its temporal–spatial pattern in Jinchang, which is a resource-based industrial city in the province of Gansu, China. Results showed that material anabolism in Jinchang is a distance-dependent function, where the amounts and rates of material anabolism decrease with changes in distance to the CBD and CAC. However, material anabolism did not show a similar spatial pattern with changes in the distance to the industrial center (CIC), even though Jinchang is a resource-based industrial city. Thus, the spatial pattern of material anabolism is highly related to economic and administrative factors in Jinchang. These results also suggest that material anabolism could provide useful indicators for urban planning from a material metabolic point of view.
Analyzing material accumulation in urban systems is essential for understanding the human–environment interaction within urban spaces. Urban anabolism could provide interesting insights into the accumulative resource and environmental effects of urban metabolism. The application of remote-sensing methods and the usage of high-resolution satellite images facilitate the estimation of material cumulative amount in urban systems. Cumulative metabolic fluxes, in conjunction with urban morphology, can provide a new way to improve the calculation of smaller-scale densities, thereby facilitating studies that span regional rather than physical boundaries. On the basis of these results, promoting the use of urban anabolism in urban-ecology studies and the assessment of all processes can help to understand the relevance of energy supply as an alternative such as carbon emissions from fossil fuels. Therefore, there is a direct relationship between metabolic size (i.e., the size of the city area, overall technology) and the rate of metabolic output (i.e., emissions).
Analysis of urban material anabolism requires high-quality data including the age and structure of buildings, the number of dwelling units, and underground buildings (such as basements, underground parking lots, underground water sanitation, sewage treatment, and electricity, gas, and transportation) that cannot directly be obtained from satellite images. Moreover, we only focused on the material anabolism of urban building processes, and ignored the process of anabolism driven by durable-goods consumption and metal accumulation due to problems of data availability. Future research could conduct more comprehensive and precise analysis of material anabolism by improving the data quality, which includes the temporal resolution, spatial resolution, and integrity of data related to material accumulation. Then, the two most important issues should be studied: the impact of urban anabolism (amount, process, and structure) on urban ecology, especially the urban ecological carrying capacity; and the identification of drivers of temporal changes in urban material anabolism.

Author Contributions

Conceptualization, Z.Z. and X.C.; Methodology, S.H.; Software, S.H.; Investigation, S.H., Z.W., and M.H.; Resources, Z.Z. and X.C.; Data curation, S.H. and Z.W.; Writing—original-draft preparation, S.H. and Z.Z.; Writing—review and editing, Z.Z. and S.H. All authors have read and agree to the published version of the manuscript.

Funding

This research was funded by the National Key R&D Program of China (Grant No. 2018YFC0704702), the National Natural Science Foundation of China (Grant Nos. 41301652 and 41471462), and the Hui-Chun Chin and Tsung-Dao Lee Chinese Undergraduate Research Endowment, CURE (Grant No. LZU-JZH0029).

Acknowledgments

We would like to thank all the anonymous reviewers for their constructive comments.

Conflicts of Interest

The authors declare no conflicts of interest.

References

  1. Lu, D.; Yao, S.; Li, G.; Liu, H.; Gao, X. Comprehensive analysis of the urbanization process based on china’ s conditions. Econ. Geogr. 2007, 27, 883–887. [Google Scholar]
  2. Kennedy, C.; Hoornweg, D. Mainstreaming urban metabolism. J. Ind. Ecol. 2012, 16, 780–782. [Google Scholar] [CrossRef]
  3. Zhang, L.; Hu, Q. A critical review on material and energetic metabolism for urban ecosystem: Resource metabolism and its contents. J. Nat. Resour. 2011, 26, 1801–1810. [Google Scholar]
  4. Zhang, Y.; Yang, Z.; Yu, X. Ecological network and emergy analysis of urban metabolic systems: Model development, and a case study of four Chinese cities. Ecol. Model. 2009, 220, 1431–1442. [Google Scholar] [CrossRef]
  5. Commission, N.D.A.R. National New Urbanization Report (2016); China Planning Press: Beijing, China, 2017; Volume 1, pp. 3–23. [Google Scholar]
  6. Fang, C. The urbanization and urban development in China after the reform and opening-up. Econ. Geogr. 2009, 29, 19–25. [Google Scholar]
  7. Song, T.; Cai, J.; Ni, P.; Du, S.; Ding, Y. Review and prospects of urban metabolism research. Prog. Geogr. 2013, 32, 1650–1661. [Google Scholar]
  8. Sun, W.; Dong, G. The efficiencies and their changes of China’s resources-based cities employing dea and malmquist index models. Geogr. Res. 2010, 29, 2155–2165. [Google Scholar] [CrossRef]
  9. Qiao, B.; Fang, C.; Huang, J. The coupling law and its validation of the interaction between urbanization and ecoenvironment in arid area. Acta Ecol. Sin. 2006, 26, 2183–2190. [Google Scholar]
  10. Liu, J. Research on Resource-Based Cities’ Transition and Sustainable Development in China. Ph.D. Thesis, Central South University, Changsha, China, 6 January 2007. [Google Scholar]
  11. Qin, D. Research on the Sustainable Development of Resource-Dependent Cities Based on Ecological Cities’ Construction—A Case Study of Zhaoyuan City. Ph.D. Thesis, Ocean University of China, Qingdao, China, 9 June 2011. [Google Scholar]
  12. Xu, J.; Li, G.; Wang, Y. Review and prospect of resource-based city vulnerability in China and abroad. Resour. Sci. 2015, 37, 1266–1278. [Google Scholar]
  13. Guo, C.; Luo, L.; Ye, M. Empirical analysis of factors influencing the sustainable development of resource-based cities. China Popul. Resour. Environ. 2014, 24, 81–89. [Google Scholar]
  14. Wolman, A. The metabolism of cities. Sci. Am. 1965, 213, 179. [Google Scholar] [CrossRef] [PubMed]
  15. Broto, V.C.; Allen, A.; Rapoport, E. Interdisciplinary perspectives on urban metabolism. J. Ind. Ecol. 2012, 16, 851–861. [Google Scholar] [CrossRef]
  16. Bristow, D.N.; Kennedy, C.A. The energy for growing and maintaining cities. Ambio 2013, 42, 41–51. [Google Scholar] [CrossRef] [PubMed]
  17. Duan, N. Urban material metabolism and its control. Res. Environ. Sci. 2004, 17, 75–77. [Google Scholar]
  18. Ma, Q.; Huang, X.; Yu, S.; Chen, Y. Review on the resear ch of metabolism. J. Nat. Resour. 2007, 1, 141–152. [Google Scholar]
  19. Kennedy, C.; Pincetl, S.; Bunje, P. The study of urban metabolism and its applications to urban planning and design. Environ. Pollut. 2011, 159, 1965–1973. [Google Scholar] [CrossRef]
  20. Inostroza, L. Measuring urban ecosystem functions through ‘technomass’—A novel indicator to assess urban metabolism. Ecol. Indic. 2014, 42, 10–19. [Google Scholar] [CrossRef]
  21. Palmer, G. The flow of energy in an agricultural society. Sci. Am. 1971, 225, 116–133. [Google Scholar]
  22. Hanya, T.; Ambe, Y. A study on the metabolism of cities. In Science for Better Environment Proceedings of the International Congress on the Human Environment (HESC) Kyoto (1975); HESC: Tokyo, Japan, 1977; pp. 228–233. [Google Scholar]
  23. Kalma, J.D. The metabolism of a city: The case of Hong Kong. Ambio 1978, 7, 3–15. [Google Scholar]
  24. Sahely, H.R.; Dudding, S.; Kennedy, C.A. Estimating the urban metabolism of Canadian cities: Greater toronto area case study. Rev. Can. De Génie Civ. 2003, 30, 468–483. [Google Scholar] [CrossRef]
  25. Browne, D.; O’Regan, B.; Moles, R. Assessment of total urban metabolism and metabolic inefficiency in an irish city-region. Waste Manag. 2009, 29, 2765–2771. [Google Scholar] [CrossRef] [PubMed]
  26. Chen, S.; Chen, B. Network environ perspective for urban metabolism and carbon emissions: A case study of vienna, austria. Environ. Sci. Technol. 2012, 46, 4498–4506. [Google Scholar] [CrossRef] [PubMed]
  27. Huang, S.L.; Hsu, W.L. Materials flow analysis and emergy evaluation of Taipei’s urban construction. Landsc. Urban Plan. 2003, 63, 61–74. [Google Scholar] [CrossRef]
  28. Lee, C.L.; Huang, S.L.; Chan, S.L. Synthesis and spatial dynamics of socio-economic metabolism and land use change of Taipei metropolitan region. Ecol. Model. 2009, 220, 2940–2959. [Google Scholar] [CrossRef]
  29. Li, L. Reviews on the developmental progress of urban m etabolism research. J. Fujian For. Sci. Technol. 2011, 38, 161–167. [Google Scholar]
  30. Zhang, Y.; Yang, Z.; Yu, X. Evaluation of urban metabolism based on emergy synthesis: A case study for Beijing (China). Ecol. Model. 2009, 220, 1690–1696. [Google Scholar] [CrossRef]
  31. Zhang, Y.; Yang, Z. Eco-efficency of urban material metabolism: A case study of shenzhen. Acta Ecol. Sin. 2007, 27, 3124–3131. [Google Scholar] [CrossRef]
  32. Mehmood, A. On the history and potentials of evolutionary metaphors in urban planning. Plan. Theory 2010, 9, 63–87. [Google Scholar] [CrossRef]
  33. Kenway, S.; Gregory, A.; Mcmahon, J. Urban water mass balance analysis. J. Ind. Ecol. 2011, 15, 693–706. [Google Scholar] [CrossRef]
  34. Huang, S.L. Urban ecosystems, energetic hierarchies, and ecological economics of taipei metropolis. J. Environ. Manag. 1998, 52, 39–51. [Google Scholar] [CrossRef]
  35. Niza, S.; Rosado, L.; Ferrão, P. Urban metabolism: Methodological advances in urban material flow accounting based on the lisbon case study. J. Ind. Ecol. 2010, 13, 384–405. [Google Scholar] [CrossRef]
  36. Barles, S. Urban metabolism of paris and its region. J. Ind. Ecol. 2010, 13, 898–913. [Google Scholar] [CrossRef]
  37. Li, D.; Wang, R. Hybrid emergy-lca (heml) based metabolic evaluation of urban residential areas: The case of Beijing, China. Ecol. Complex. 2009, 6, 484–493. [Google Scholar] [CrossRef]
  38. Kibert, C.J.; Sendzimir, J.; Guy, B. Construction ecology and metabolism: Natural system analogues for a sustainable built environment. Constr. Manag. Econ. 2000, 18, 903–916. [Google Scholar] [CrossRef]
  39. Liu, J.; Wang, R.; Wang, Z.; Yang, J. Metabolism and driving forces analysis of chinese urban households. Acta Ecol. Sin. 2003, 23, 2672–2676. [Google Scholar]
  40. Jin, W.; Xu, L.; Yang, Z. Modeling a policy making framework for urban sustainability: Incorporating system dynamics into the ecological footprint. Ecol. Econ. 2009, 68, 2938–2949. [Google Scholar] [CrossRef]
  41. Li, F.; Zhang, Y.; Liu, G. Assessment of energy-based urban material metabolism. Environ. Sci. Technol. 2009, 32, 108–112. [Google Scholar]
  42. Liu, H.; Zhang, Y. Ecological network analysis of urban metabolism based on input-output table. Procedia Environ. Sci. 2012, 13, 1616–1623. [Google Scholar] [CrossRef] [Green Version]
  43. Li, Y.; Zhang, Y.; Yang, N. Ecological network model analysis of China’s endosomatic and exosomatic societal metabolism. Procedia Environ. Sci. 2010, 2, 1400–1406. [Google Scholar] [CrossRef] [Green Version]
  44. Zhang, Y.; Yang, Z.; Fath, B.D. Ecological network analysis of an urban water metabolic system: Model development, and a case study for Beijing. Sci. Total Environ. 2010, 408, 4702. [Google Scholar] [CrossRef]
  45. Bodini, A. Building a systemic environmental monitoring and indicators for sustainability: What has the ecological network approach to offer? Ecol. Indic. 2012, 15, 140–148. [Google Scholar] [CrossRef]
  46. Bodini, A.; Bondavalli, C.; Allesina, S. Cities as ecosystems: Growth, development and implications for sustainability. Ecol. Model. 2012, 245, 185–198. [Google Scholar] [CrossRef]
  47. Alberti, M.; Hutyra, L. Detecting carbon signatures of development patterns across a gradient of urbanization: Linking observations, models, and scenarios. In 5th Urban Research Symposium on Cities and Climate Change: Responding to An Urgent Agenda; World Bank: Marseille, France, 2009; pp. 125–126. [Google Scholar]
  48. Kleijn, R.; Huele, R.; Voet, E.V.D. Dynamic substance flow analysis: The delaying mechanism of stocks, with the case of pvc in sweden. Ecol. Econ. 2000, 32, 241–254. [Google Scholar] [CrossRef]
  49. Baker, L.A.; Hope, D.; Xu, Y.; Edmonds, J.; Lauver, L. Nitrogen balance for the central arizona–phoenix (cap) ecosystem. Ecosystems 2001, 4, 582–602. [Google Scholar] [CrossRef]
  50. Chen, J.L.; Wu, Y.Z.; Xu, B.G. Smart Growth and Regulation Mode of Land Use Planning; The Hong Kong Polytechnic University: Hong Kong, China, 2005; pp. 388–393. [Google Scholar]
  51. Chen, H.; Wang, X.; Guo, Z. Transformation of urban planning: Thoughts on incremental planning, stock-based planning, and reduction planning. China City Plan. Rev. 2016, 25, 26–31. [Google Scholar]
  52. Jin, Z.; Chen, L.; Jing, D. Green space system planning practices of multidimensional network construction in high-density areas under the coexistence trend of incremental planning and existing stock planning. In Green City Planning and Practices in Asian Cities; Springer: Berlin/Heidelberg, Germany, 2018. [Google Scholar]
  53. Guocheng, H. Stock urban planning and management in the perspective of institution design. Shanghai Urban Plan. Rev. 2015, 3, 16–19. [Google Scholar]
  54. Han, J.; Chen, W.-Q.; Zhang, L.; Liu, G. Uncovering the spatiotemporal dynamics of urban infrastructure development: A high spatial resolution material stock and flow analysis. Environ. Sci. Technol. 2018, 52, 12122–12132. [Google Scholar] [CrossRef]
  55. Charpentier, J. The changing metabolism of cities. J. Ind. Ecol. 2017, 11, 43–59. [Google Scholar]
  56. Li, Y.; Deng, H.; Shi, L. The connotation and study methods of urban sustainability. Ecol. Econ. 2015, 31, 20–26. [Google Scholar]
  57. Ma, Q.; Huang, X. Responses of metabolism during the process of land use change. Trans. CSAE 2008, 24, 6–11. [Google Scholar]
  58. Newman, P.W.G. Sustainability and cities: Extending the metabolism model. Landsc. Urban Plan. 1999, 44, 219–226. [Google Scholar] [CrossRef]
  59. Wang, H.; Chen, D.; Duan, H.; Yin, F.; Niu, Y. Characterizing urban building metabolism with a 4d-gis model: A case study in China. J. Clean. Prod. 2019, 228, 1446–1454. [Google Scholar] [CrossRef]
  60. Codoban, N.; Kennedy, C.A. Metabolism of neighborhoods. J. Urban Plan. Dev. 2008, 134, 21–31. [Google Scholar] [CrossRef]
  61. Cui, S.; Zhang, Y.; Zhou, J.; Lin, J.; Liu, Y. Research methods and outlook in the study of urban building metabolism. Ecol. Sci. 2011, 30, 359–367. [Google Scholar]
  62. Huo, T.F.; Cai, W.G.; Ren, H.; Feng, W.; Zhu, M.L.; Lang, N.N.; Gao, J.X. China’s building stock estimation and energy intensity analysis. J. Clean. Prod. 2019, 207, 801–813. [Google Scholar] [CrossRef]
  63. Kleemann, F.; Lederer, J.; Rechberger, H.; Fellner, J. Gis-based analysis of vienna’s material stock in buildings. J. Ind. Ecol. 2017, 21, 368–380. [Google Scholar] [CrossRef]
  64. Zhao, Z.; Zhou, X.; Fu, Q.; Wang, X. Method for extraction of building height information based on ZY-3 image. Remote. Sens. Land Resour. 2015, 27, 19–24. [Google Scholar]
  65. Zhang, B.; Wang, C.; Zhang, H.; Wu, F. A review on building extraction and reconstruction from sar image. Remote. Sens. Technol. Appl. 2012, 27, 496–503. [Google Scholar]
  66. Wang, J.; Guo, Q.; Zheng, G. Research on urban building height extraction from single satellite image. Bull. Surv. Mapp. 2012, 4, 15–17. [Google Scholar]
  67. Fu, Q.; Wu, B.; Wang, X.; Sun, Z. Building extraction and its height estimation over urban areas based on morphological building index. Remote. Sens. Technol. Appl. 2015, 30, 148–154. [Google Scholar]
  68. Trexler, J.C.; Travis, J. Nontraditional regression analyses. Ecology 1993, 74, 1629. [Google Scholar] [CrossRef]
  69. Howarth, R.J. A history of regression and related model-fitting in the earth sciences (1636?-2000). Nat. Resour. Res. 2001, 10, 241–286. [Google Scholar] [CrossRef]
  70. Sharma, S.; Swayne, D.A.; Obimbo, C. Trend analysis and change point techniques: A survey. Energy Ecol. Environ. 2016, 1, 123–130. [Google Scholar] [CrossRef] [Green Version]
  71. Jacoby, W.G. Loess: A nonparametric, graphical tool for depicting relationships between variables. Elect. Stud. 2000, 19, 577–613. [Google Scholar] [CrossRef]
  72. Min, A.J.; Young, J.K.; Seok, Y.D.; Dong-seok, S. Verification of water environment monitoring network representativeness under estuary backwater effects. Environ. Monit. Assess. 2018, 190, 463. [Google Scholar]
  73. Borkowf, C.B.; Albert, P.S.; Abnet, C.C. Using lowess to remove systematic trends over time in predictor variables prior to logistic regression with quantile categories. Stat. Med. 2003, 22, 1477–1493. [Google Scholar] [CrossRef] [PubMed]
  74. Ruckstuhl, A.F.; Jacobson, M.P.; Field, R.W.; Dodd, J.A. Baseline subtraction using robust local regression estimation. J. Quant. Spectrosc. Radiat. Transf. 2001, 68, 179–193. [Google Scholar] [CrossRef]
  75. Lee, J.W.; Jhun, M.; Kim, J.Y.; Lee, J. An optimal choice of window width for lowess normalization of microarray data. OR Spectr. 2008, 30, 235–248. [Google Scholar] [CrossRef]
Figure 1. Structure of an urban metabolic account.
Remotesensing 12 00370 g001
Figure 2. Material-accumulation and -flow system in urban ecosystems.
Remotesensing 12 00370 g002
Figure 3. Sample-point location.
Remotesensing 12 00370 g003
Figure 4. Sample cumulative metabolic rate schematic diagram.
Remotesensing 12 00370 g004
Figure 5. Kernel-density distribution map of sample cumulative metabolism.
Remotesensing 12 00370 g005
Figure 6. Relationship between cumulative metabolism and distance from the central business district (CBD). The dark dot represents the material accumulation of the sample point, and the red line is the fitting line.
Remotesensing 12 00370 g006
Figure 7. Cross-section sample of the study area.
Remotesensing 12 00370 g007
Figure 8. Relationship between cumulative metabolic rate and distance from the CBD found in cross-sectional sample. The dark dot represents the material accumulation of the sample point, and the red line is the fitting line.
Remotesensing 12 00370 g008
Figure 9. Relationship between the cumulative metabolic rate and distance from the city industrial center (CIC). The dark dot represents the material accumulation of the sample point, and the red line is the fitting line.
Remotesensing 12 00370 g009
Figure 10. Relationship between cumulative metabolic volume and distance from the city administration center (CAC). The dark dot represents the material accumulation of the sample point, and the red line is the fitting line.
Remotesensing 12 00370 g010
Figure 11. Material cumulative metabolic rate of all circular samples during 2003–2015.
Remotesensing 12 00370 g011
Table 1. Data-structure description.
NMinMaxAVGStdSkewnessKurtosis
StatisticsStatisticsStatisticsStatisticsStatisticsStatisticsSE *StatisticsSE
φ (m3/ha)2600171,244.2821,204.5024,583.752.080.157.260.30
Effective N260
* SE: Standard error.
Table 2. Maximal, minimal, and average values for all samples.
SamplesAverageMinMax
Circular (all)21,204.50461000171,244.28
Circular transect35,529.155012500171,244.28
Total average28,366.831750171,244.28
Table 3. Material cumulative metabolic rate and total accumulated metabolism from 2003 to 2015.
Samples200320072015
Cumulative metabolic rate
(m3/ha/year)
393,756.776441,009.298459,430.933
Accumulated metabolism
(m3/ha)
4,725,081.3135,292,111.5745,513,171.197