Article

H-YOLO: A Single-Shot Ship Detection Approach Based on Region of Interest Preselected Network

1
Logistics Engineering College, Shanghai Maritime University, Shanghai 201306, China
2
School of Information and Telecommunication Engineering, Tokai University, Tokyo 1088619, Japan
3
Naval Academy Research Institute, F-29240 Lanvéoc, France
4
Institut d’Électronique et des Technologies du numérique (IETR), UMR CNTS 6164, Polytech Nantes-Site de la Chantrerie, 44306 Nantes, France
5
School of Medical Information Engineering, Guangzhou University of Chinese Medicine, Guangzhou 510006, China
*
Author to whom correspondence should be addressed.
Remote Sens. 2020, 12(24), 4192; https://doi.org/10.3390/rs12244192
Submission received: 14 November 2020 / Revised: 16 December 2020 / Accepted: 16 December 2020 / Published: 21 December 2020

Abstract

:
Ship detection from high-resolution optical satellite images is still an important task that deserves optimal solutions. This paper introduces a novel high-resolution image network-based approach based on the preselection of a region of interest (RoI). This pre-selected network first identifies and extracts a region of interest from input images. In order to efficiently match ship candidates, the principle of our approach is to distinguish suspected areas from the images based on hue, saturation, value (HSV) differences between ships and the background. The whole approach is the basis of an experiment with a large ship dataset, consisting of Google Earth images and HRSC2016 datasets. The experiment shows that the H-YOLO network, which uses the same weight training from a set of remote sensing images, has a 19.01% higher recognition rate and a 16.19% higher accuracy than applying the you only look once (YOLO) network alone. After image preprocessing, the value of the intersection over union (IoU) is also greatly improved.

1. Introduction

Over the past few years, the object detection domain has rapidly improved, opening many valuable opportunities to detect ships in maritime environments. Applying remote detection to ships can be of value for many applications such as harbor surveillance, traffic monitoring, fishery management and pollution monitoring to mention a few examples. The extent of primary image materials to be detected ranges from optical remote sensing images [1,2,3,4,5,6] to synthetic aperture radar (SAR) images [7,8,9,10,11,12,13,14]. In [2], a novel spaceborne optical images (SDSOI) approach is adopted to remove most false alarms. In addition to eliminating interferences, attention has also been given to multi-target detection [6]. With early low resolution remote sensing images, previous studies considered ships as mostly a point target and then applied a series of methods such as false alarm rates (CFAR) [15], generalized likelihood ratio test (GLRT), template matching [16] and other methods [17,18,19,20], but overall ships were mostly approximated. With the recent development of high-resolution remote sensing images, additional target details and background information are now available. In particular, deep learning methods [21,22,23,24,25,26,27,28,29,30,31] bring new opportunities for target detection of high-resolution remote sensing images and are likely to produce much more robust ship target identification.
Due to variation in size, appearance, and disturbances, unsupervised methods [4,16,20] are severely limited. Therefore, it is more common to use supervised methods, which can be roughly divided into one-stage and two-stage algorithms. The YOLO algorithm is a typical one-stage network [21,22,23,24] that is widely used due to its high real-time performance and high accuracy. For two-stage algorithms, a Faster R-CNN introduced by Ren [25] is a two-stage network and has been since widely applied in many domains [25,26,27,28,29,30,31]. The main drawback of a two-stage algorithm is that it first generates a series of candidate boxes and secondly applies a convolutional neural network (CNN) to classify candidate boxes. The R-CNN proposed by Girshick [31] generates about 2k regions of interest (RoI) for recognition. Due to the massive amount of generated RoIs, computational efficiency is not as good as standard one-stage networks. The fast R-CNN extended by Girshick [30] uses selective search and other preprocessing operations to derive a potential bounding box as an input, thereby significantly reducing the total number of RoIs and greatly increasing computational efficiency. Compared with the one-stage algorithm, and overall, the two-stage algorithm can provide better accuracy since it has to compute all the RoIs extracted by the region proposal network. Li et al. [6] introduced a deep feature-based method to detect ships in very high-resolution optical remote sensing images and to improve the faster R-CNN thanks to a multi-scale approach. A common issue all the above methods still need to address appropriately is the extraction and processing of RoIs. In particular, in order to detect the strip-like rotated assembled object, which is a common issue when processing remote sensing images, a few related works introduced some novel methods to tackle the target’s recognition issue [32,33].
Extracting high-quality RoIs can achieve better detection outcomes since this might suppress one of the main drawbacks of two-stage algorithms, as well as being potentially computationally more efficient. High-quality RoIs can be extracted using the hue, saturation, value (HSV) color space. As HSV values of the oceans’ pixels surrounding the ship are similar to each other, they are all within a specific range and can be then removed as a background. This kind of approach is identical to saliency-based approaches [4]. Cucchiara [34] introduced a method for detecting shadows, using the HSV color space to identify and suppress the dynamic objects’ shadows. Skin color segmentation proposed by Shaik [35] also used the HSV color space. Overall, the above papers used HSV color spaces to suppress the surrounding background to locate the targets.
The approach developed in this paper introduced an HSV operation module. The proposed method uses the you only look once (YOLO) algorithm as a core to build a new network, which combines the advantage of one-stage and two-stage algorithms to achieve the best balance between accuracy and efficiency. The main principle is to apply the difference of HSV color space among vessels’ remote sensing pictures to extract the RoI and then to send them into the YOLOv3 network. In order to prevent falling into meaningless calculation, we designed three paths to deal with different cases when processing the input image. The main contributions of our paper are threefold, which are given as follows.
  • We introduce a novel vessel remote sensing image classification network, the so-called HSV-YOLO network, consisting of two essential components: an HSV-operation module and a one-stage detection module. To the best of our knowledge, it is the first time that the difference of HSV color space is used as a filter to extract the useful RoIs to reduce detection calculation time.
  • We designed an HSV-module, which consists of four crucial cores: a background removal operation, a noise removal operation, a box-finding operation, and a noise deletion operation. After these four steps, one can obtain valuable RoIs instead of noisy RoIs, and this in reasonable computing time.
  • We designed a pipeline to deal with the outcomes of the HSV-operation module, containing three common situations when processing the images.
The rest of the paper is organized as follows. Section 2 describes the component of our proposed network. The network setup, experimental result, and the analysis of the results are provided in Section 3. Finally, Section 4 concludes the paper and draws a few perspectives for further work.

2. Material and Method

2.1. HSV-YOLOv3

Object detection algorithms can be divided into one-stage and two-stage algorithms. One-stage algorithms are computationally more efficient than two-stage algorithms, while two-stage algorithms can achieve higher accuracy. Two-stage algorithms first get feature maps through a CNN, then send them into the region proposal network to select appropriate RoIs. The selected RoIs are next resized into the same output and classified by the one-stage detection module.
Compared with the two-stage target detection algorithms represented by faster RCNNs, one-stage algorithms directly provide category and location information through the backbone network instead of using a region proposal network (RPN). Therefore, the speed of recognition is much improved. Simultaneously, the accuracy can still reach an acceptable rate compared to the two-stage algorithm, which satisfies high real-time performance on mounted and unmanned devices. Taking you only look once version 3 (YOLOv3) as an example, it abandons the use of the RPN, extracts features through a backbone network, and then directly performs regional regression and target classification. In this way, the total detection time is much more efficient compared to the two-stage network.
Figure 1 shows the whole architecture of the HSV-YOLO model, which includes an HSV operation module, a YOLO network, and a pipeline. The main role of the HSV operation module is to extract the regions of interest from the input images. The HSV operation module consists of four steps: background removal, noise removal, target selection, and noise contrast deletion. The YOLO network in Figure 1 is a one-stage object detection network that can be used to detect ships from the images delivered by the pipeline. The red, green, and blue lines in Figure 1 represent the processing paths of three output experiences, and the case switching algorithm is shown in Algorithm 1. The whole workflow of the proposed method illustrated in Figure 1 is described as follows. First, the input images are sent towards the HSV operation module in order to generate the regions of interest and obtain S, the total number of regions of interest. The workflow then switches towards case 1, which is denoted by the red line in Figure 1. Secondly, the RoIs generated by the HSV operation module are sent towards the detection network to obtain the number of unidentified RoIs N. Thirdly, we set the parameter of the unrecognized rate k and compare the value of N divided by S with k. If N divided by S is larger than k, the workflow will switch towards case 2. Otherwise, it will switch towards case 3. The respective detection workflows of case 1, 2, and 3 are further described in Section 2.4.
Algorithm 1 Case Switching Procedure in H-YOLO
Initialize Set total number of identified region of interest S > 0, upper limit T, number of unidentified regions of interest N, and switching value of k;
Input: Testing Image Itest;
Output: Coordinatei (xi, yi, wi, hi), Labeli;
1: SoR = HSV_Operation(Itest);
2: if SoR > T then
3:  Coordinatei, Labeli = Case3(Itest)
4: else
5:  if N/S < k then
6:   Coordinatei, Labeli = Case1(Itest)
7:  else
8:   Coordinatei, Labeli = Case2(Itest)
9:  end
10: end
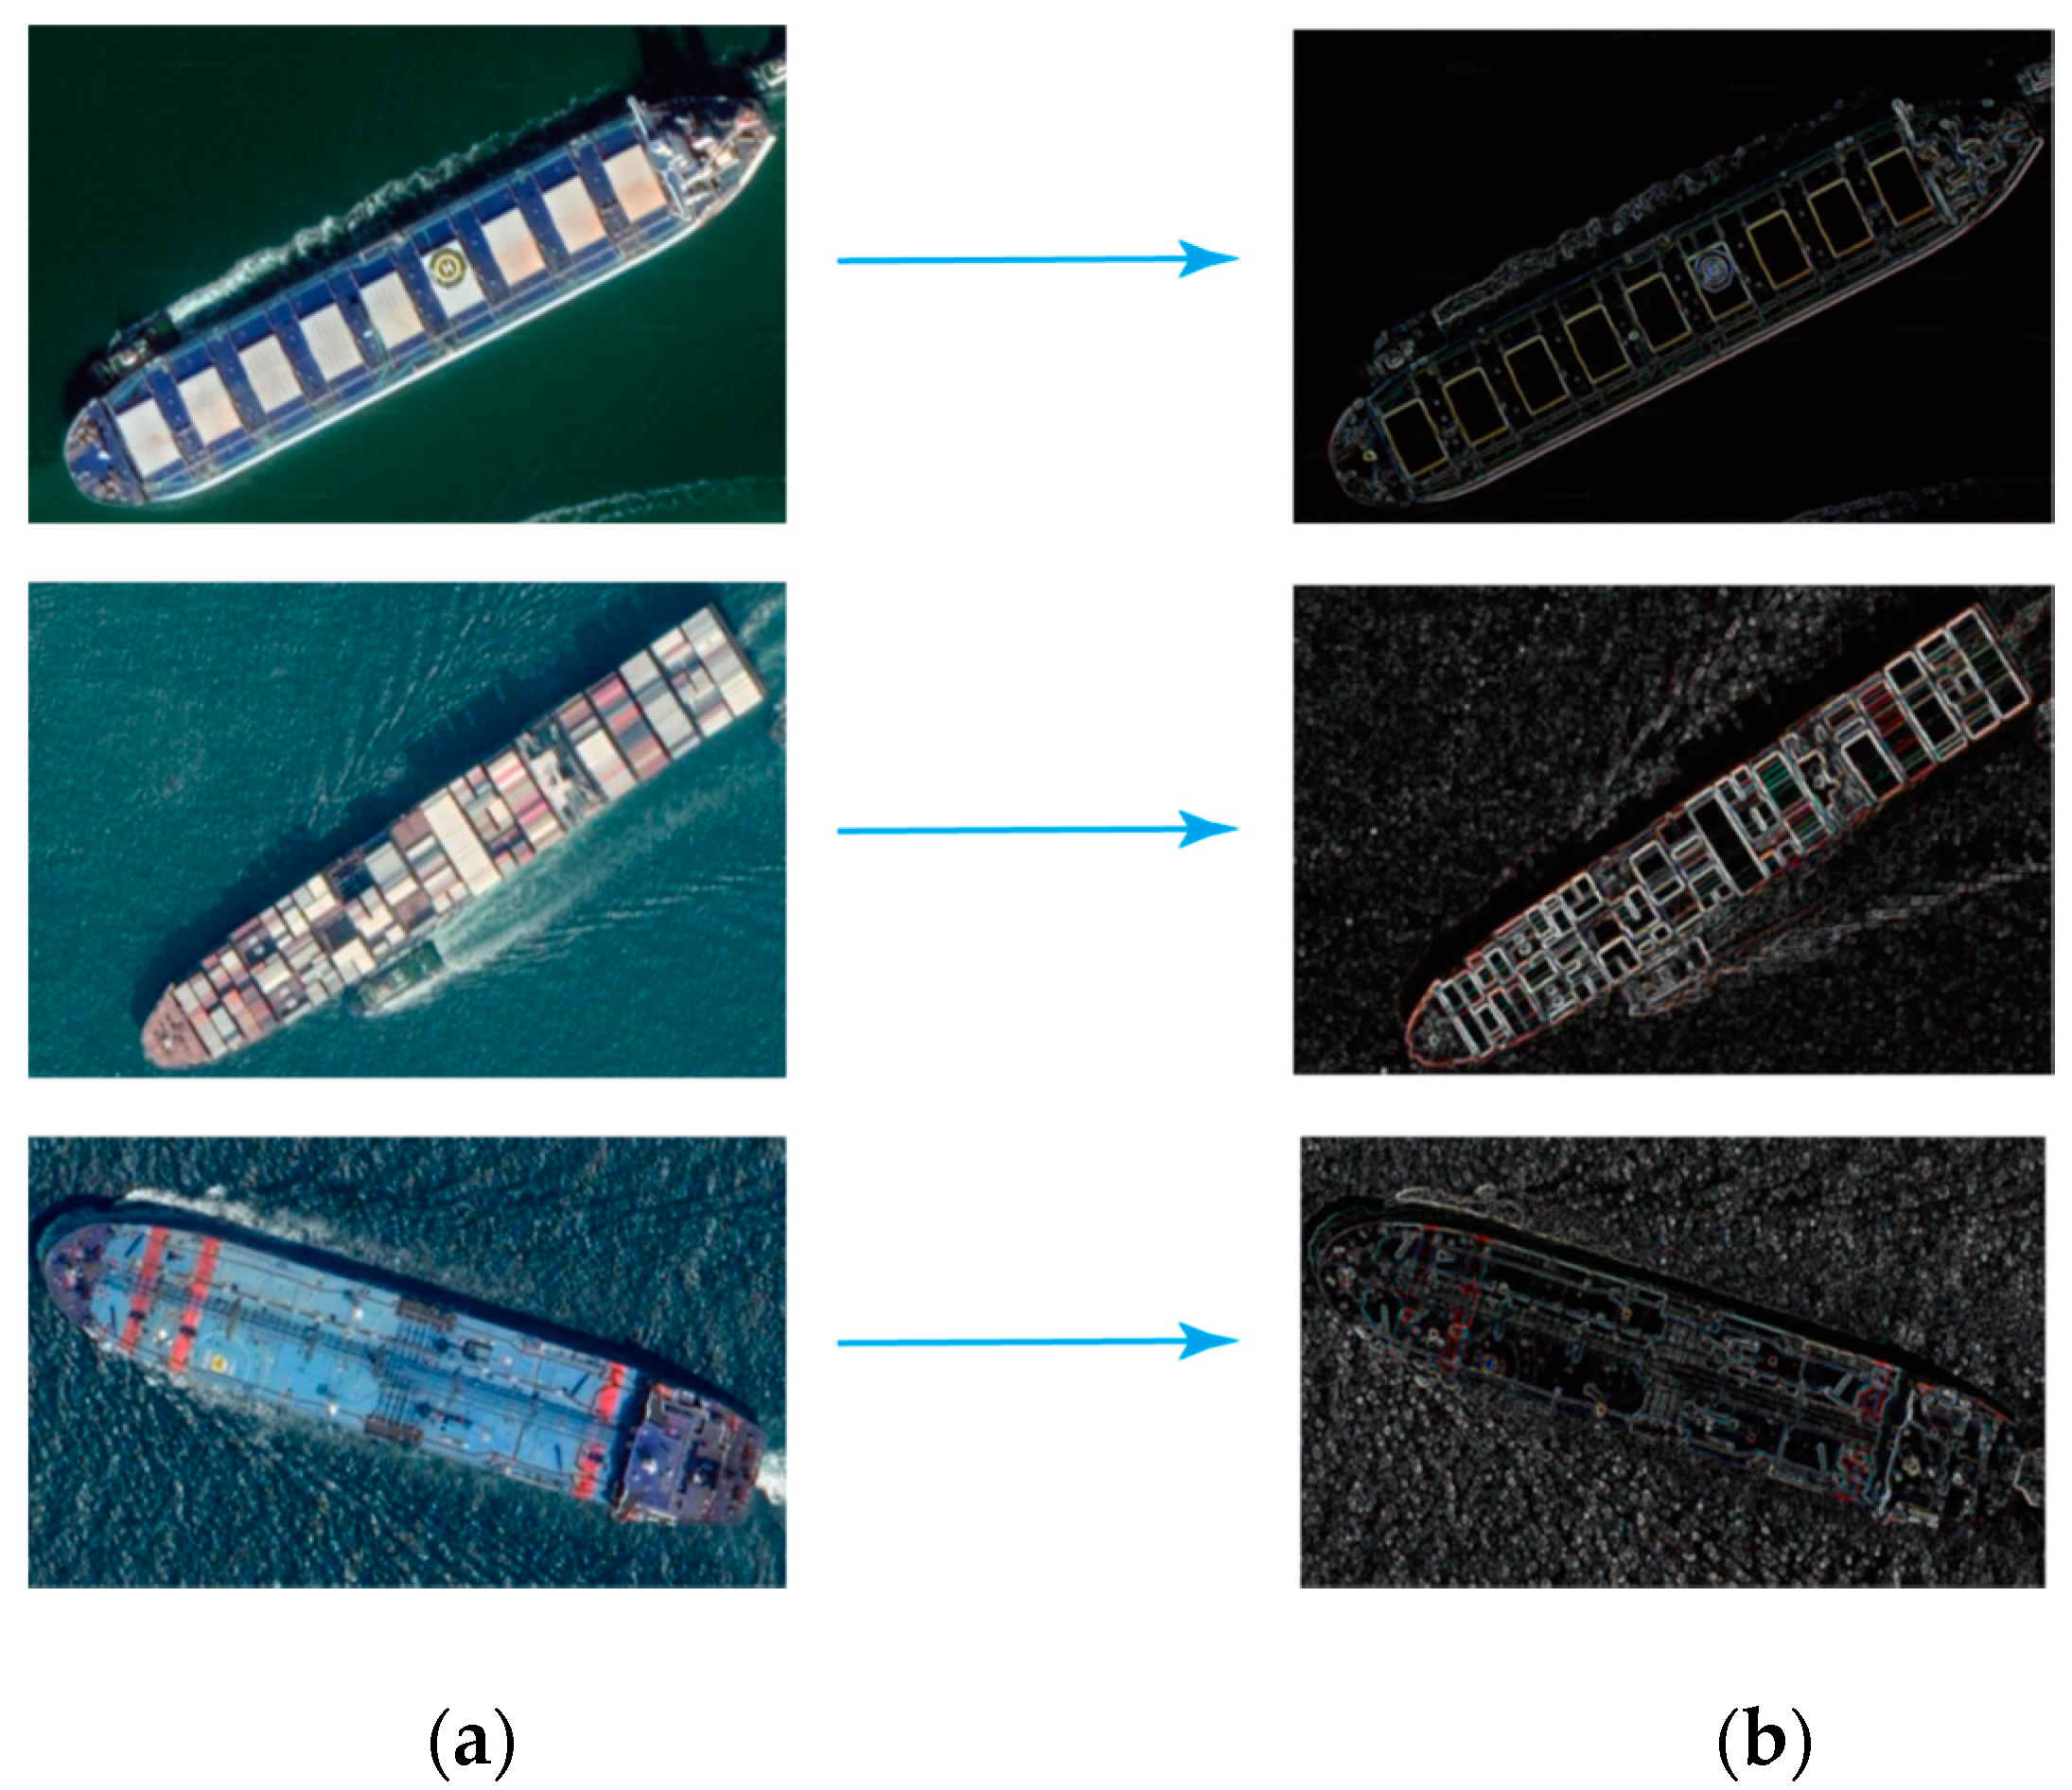
For these three types of ships, the apparent characteristics can also be seen through the edge detection diagram. For bulk carriers, rectangular boxes can be seen arranged regularly in the middle of the ship. The size of rectangular boxes in the container ship’s body is different from each other, and the position regularity is worse than the dry bulk carrier. The sum of rectangular boxes extracted from the tankers’ remote sensing image is lower than the bulk carrier and container. As mentioned above, the features make it possible for each neuron to fit each feature better when training the network. The edge detection diagram based on the difference of each vessel feature is shown in Figure 2.

2.2. HSV Processing

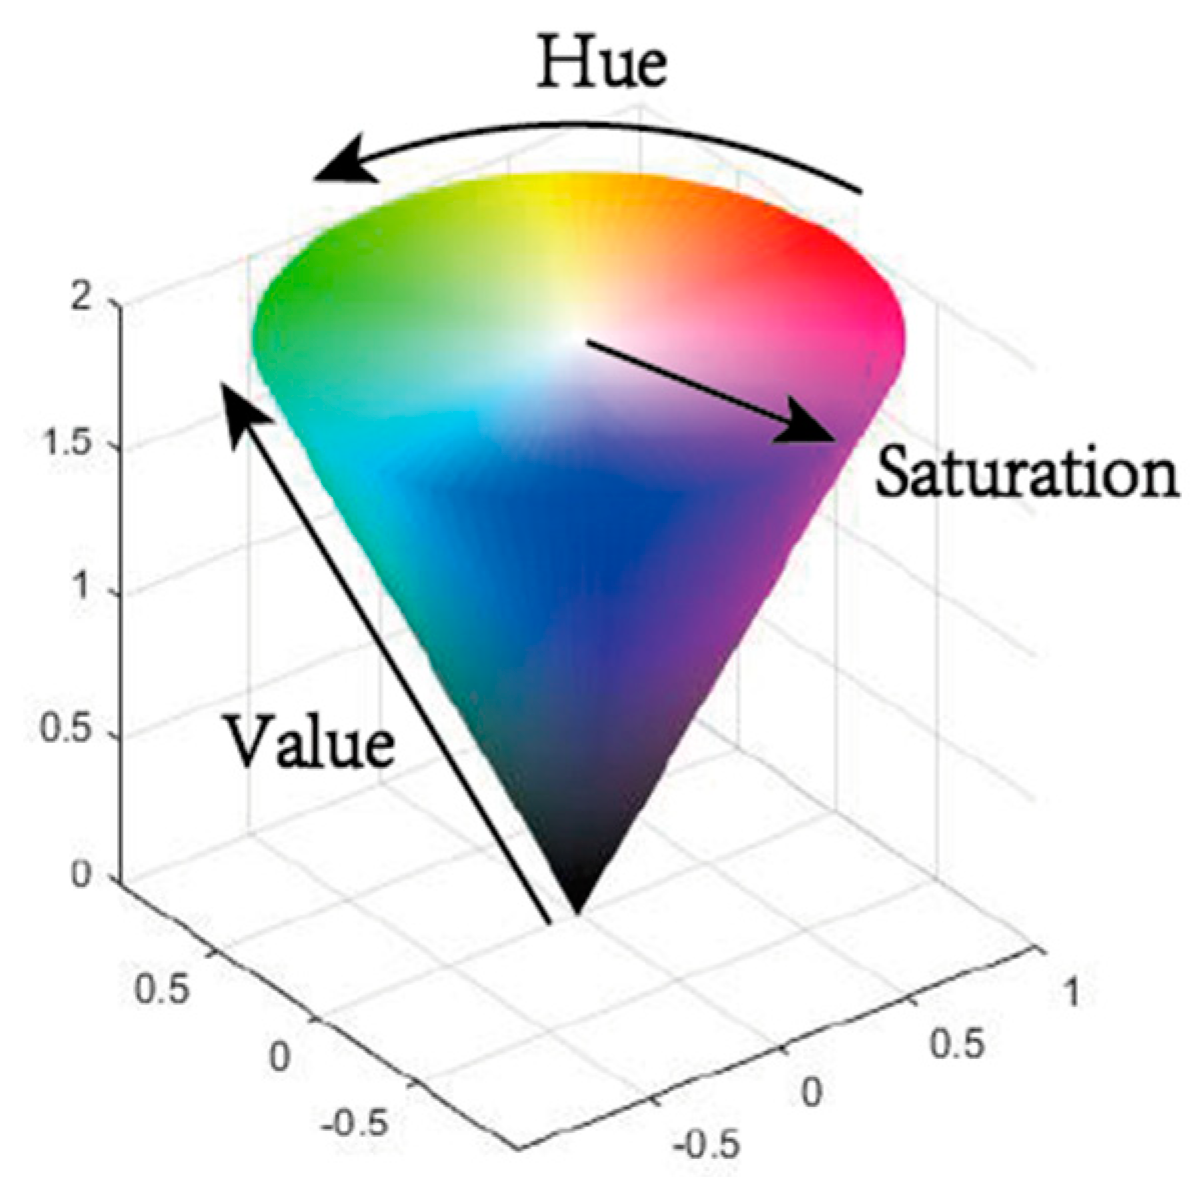
There are two common color spaces to describe an object. The first one is the RGB color space, which is widely used as a standard display system. Despite the convenience for a computer to display such images, RGB color spaces have a series of drawbacks. The images captured in naturally occurring conditions or environments are prone to be affected by natural lighting intensity. For instance, it is hard for an RGB color space to describe continuous colors in this kind of situation. However, the hue, saturation, value (HSV) color space is more suitable to describe such configurations. HSV provides a color space based on the color’s intuitive characteristics, also known as the hexcone model, as shown in Figure 3. In fact, the HSV color space is often more appropriate to describe the color distribution of most remote sensing images.
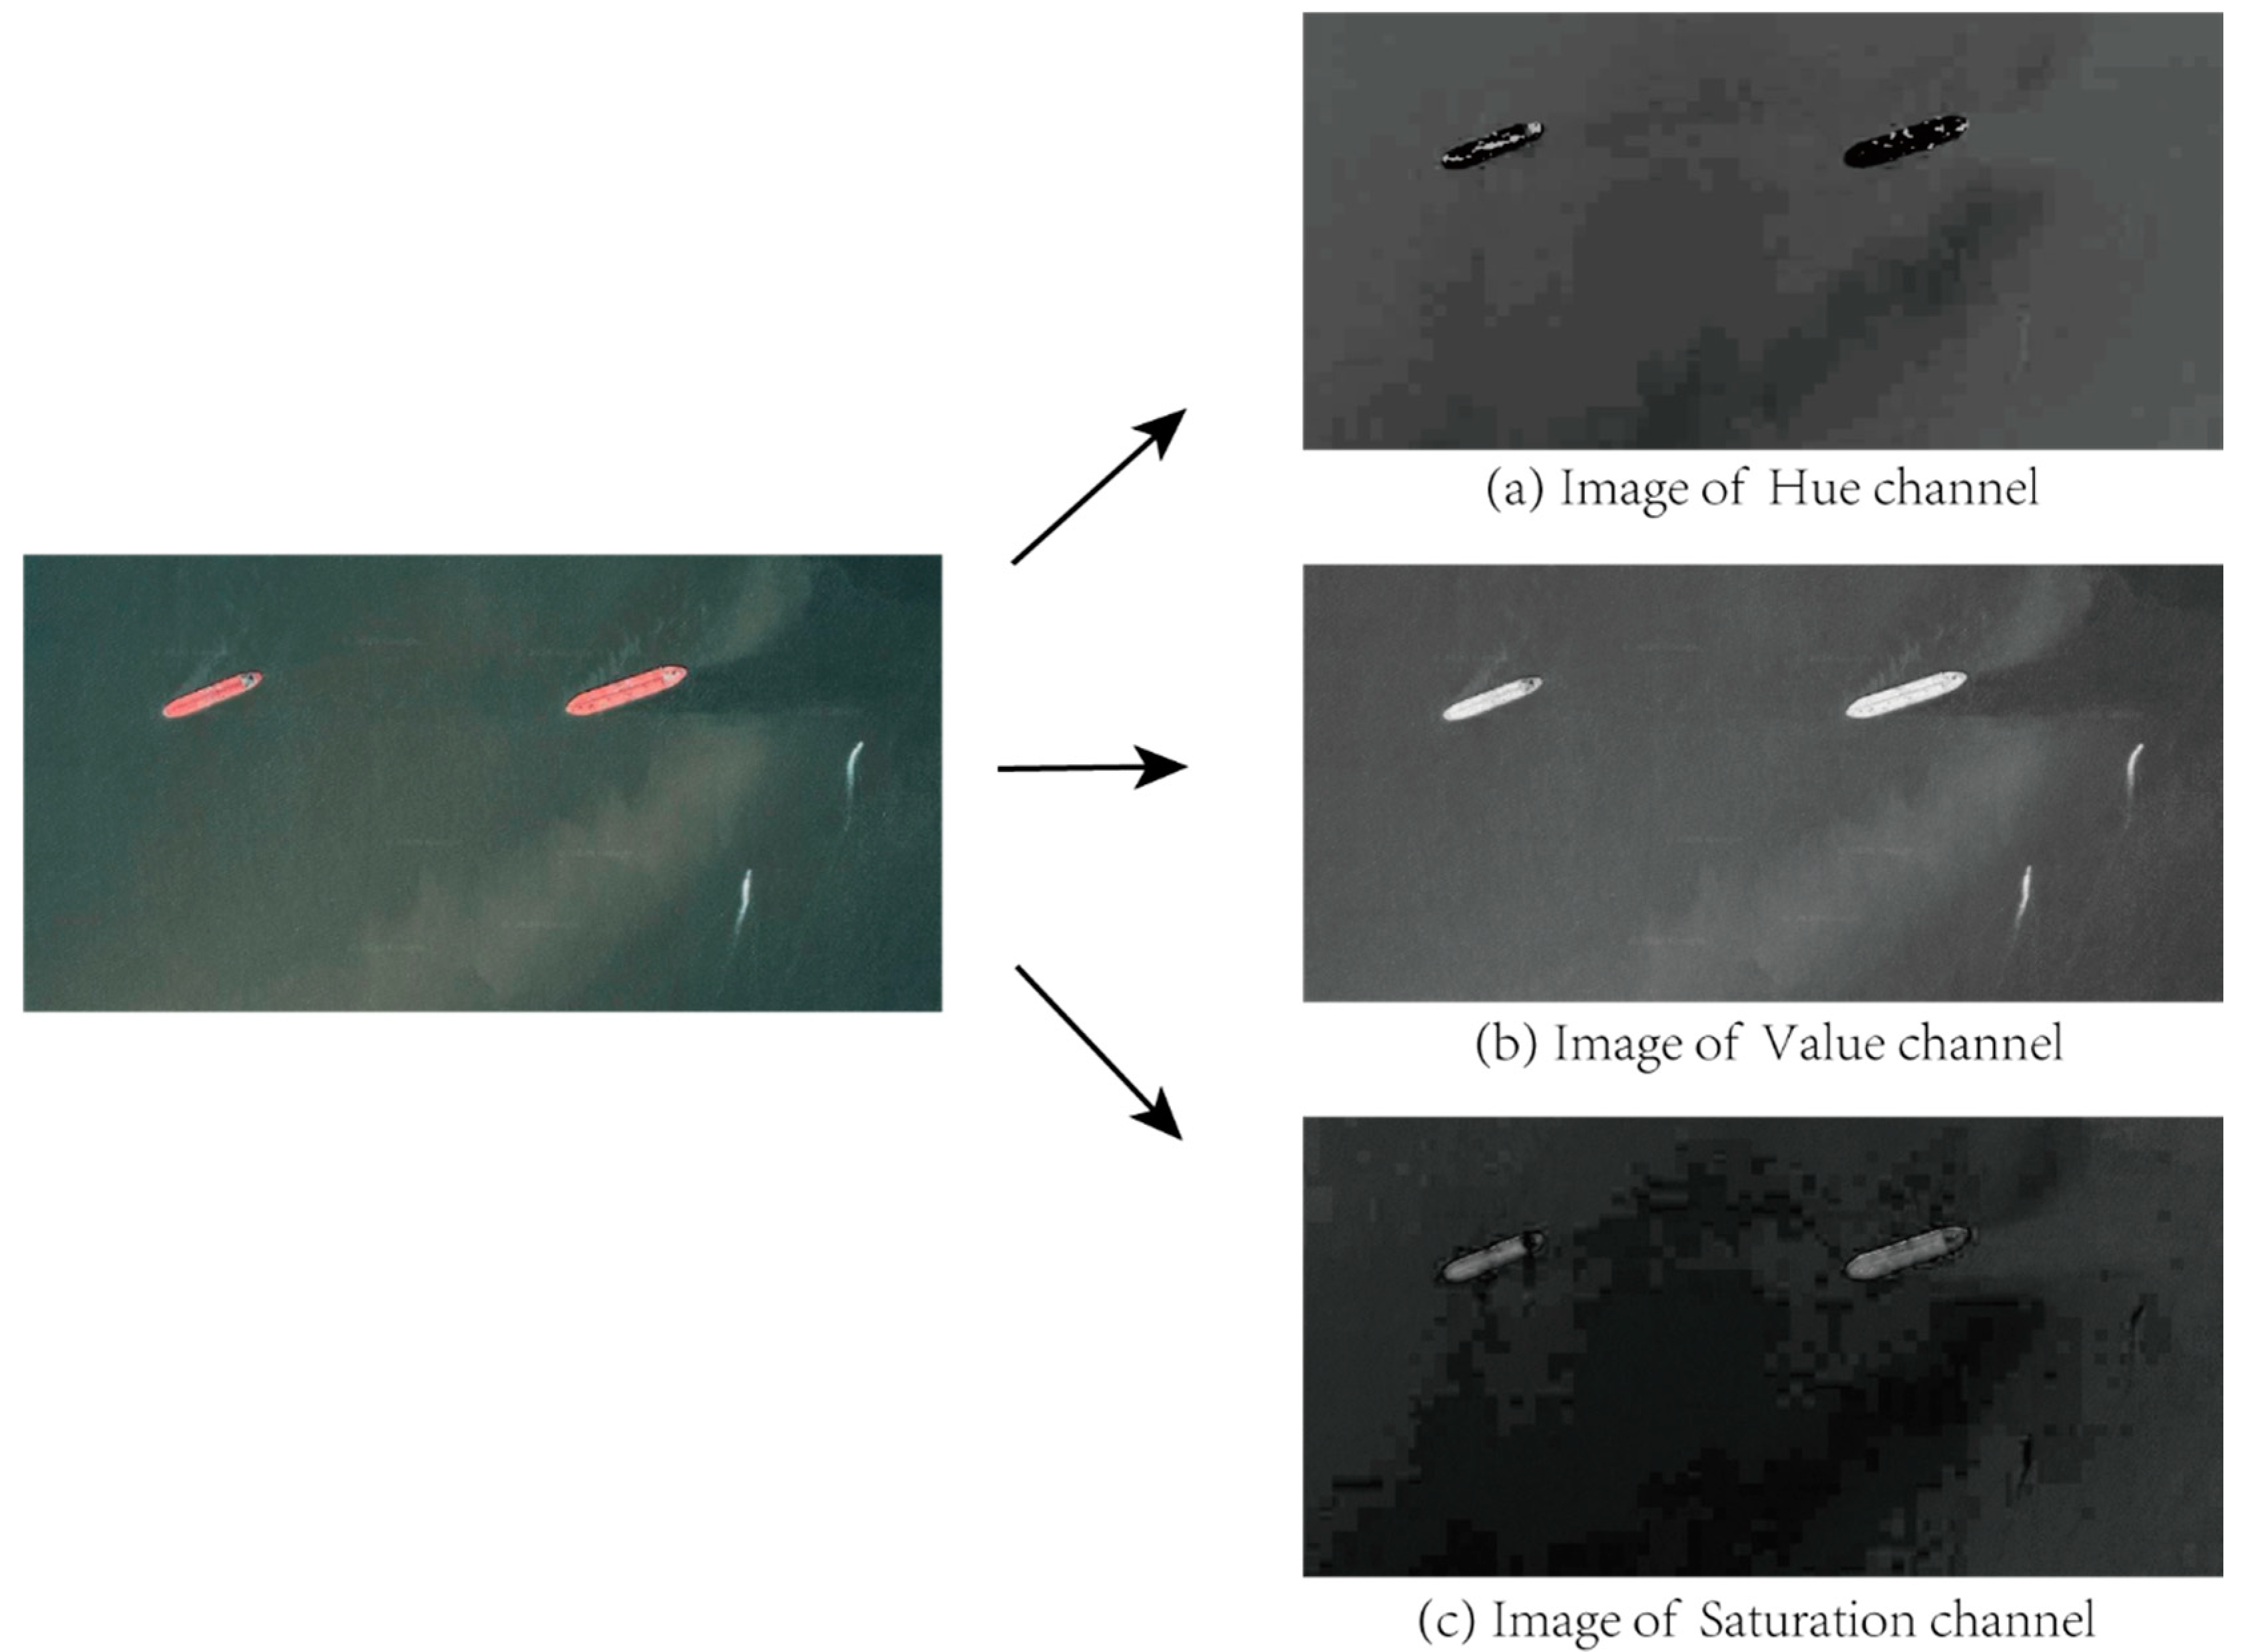
The vessel’s hue and value channels are quite different from the background value of a remote sensing picture in the ocean. Figure 4 shows an example of the different HVS channel images of some ships in the ocean. Figure 4 shows that the targets in the image of the value channel are relatively notable, while the initial noisy image information in the original image is removed in the hue and saturation channels.

2.3. HSV Operation Module

2.3.1. Modeling Approach

According to the real-time requirement of our application scenario, we selected the YOLO framework to be optimized. The objective is to combine the characteristics of the detection target with an improved YOLO algorithm to obtain a new H-YOLO algorithm. The HSV operation module difference extracts the detected pictures from the remote sensing image before being sent to the detection step. Firstly, the network algorithm suppresses the background area using HSV’s characteristics, as shown in Figure 5. Secondly, the noise removal module eliminates the interferences and applies thresholds to enhance the picture’s contrast. At the last step, the frame is recognized to extract the processing object.
Using the objects extracted from the last step significantly reduces the input image scale, which also improves the convolution fitting operation. After the data prediction is obtained, the label is transmitted back to identify the extraction area.

2.3.2. Adoptive RoI Extraction

The extraction of RoIs based on HSV differences requires a background HSV value in order for the denoising algorithms to remove the background. To suppress the background, it is necessary to get the HSV value of the background. As shown in Figure 6, each ship’s background in the remote sensing image is related to its surrounding sea depth, location, and weather conditions.
As shown in the Figure 6, the average HSV of the background in Figure 6a is H: 101, S: 136, V: 80, while the average HSV of the background in Figure 6b is H: 79, S: 84, V: 109, respectively. Although the background is different in each figure, it still can be observed that almost all values of HSV in the background around the ship are similar. In order to achieve adaptive region of interest (RoI) extraction based on HSV differences, a certain number of pixels Np are randomly extracted from the identified image in order to derive the average value of these pixels to estimate background HSV values. Pixels are captured in the upper and lower adjacent intervals of the value to remove, and this interval contains the HSV value of the background. The pixel is set to black if the HSV value of the image is in the interval. Conversely, we set the pixel to white, as shown in the middle column of Figure 7.
Figure 7 shows the background suppression performance using different backgrounds affected by the weather conditions and sea depth. It can be observed that different backgrounds have been removed from the results of background suppression in the middle column of Figure 7. The left column in Figure 7 is the original picture. One can get the middle column of images after removing the image backgrounds. It is easier to locate the targets when using the images without backgrounds than finding the targets in the images that contain a background. When the image contained massive ships, harbor information, or other inference caused by the wind or waves, it became difficult to withdraw the image background so the number of possible regions of interest was relatively high. Case 1 and case 3 described in Section 2.4 were developed for this situation. When the total number of RoIs and the unrecognition ratio N/S increases, this triggers the process of sending original images into the detection network.

2.3.3. Reference Correction

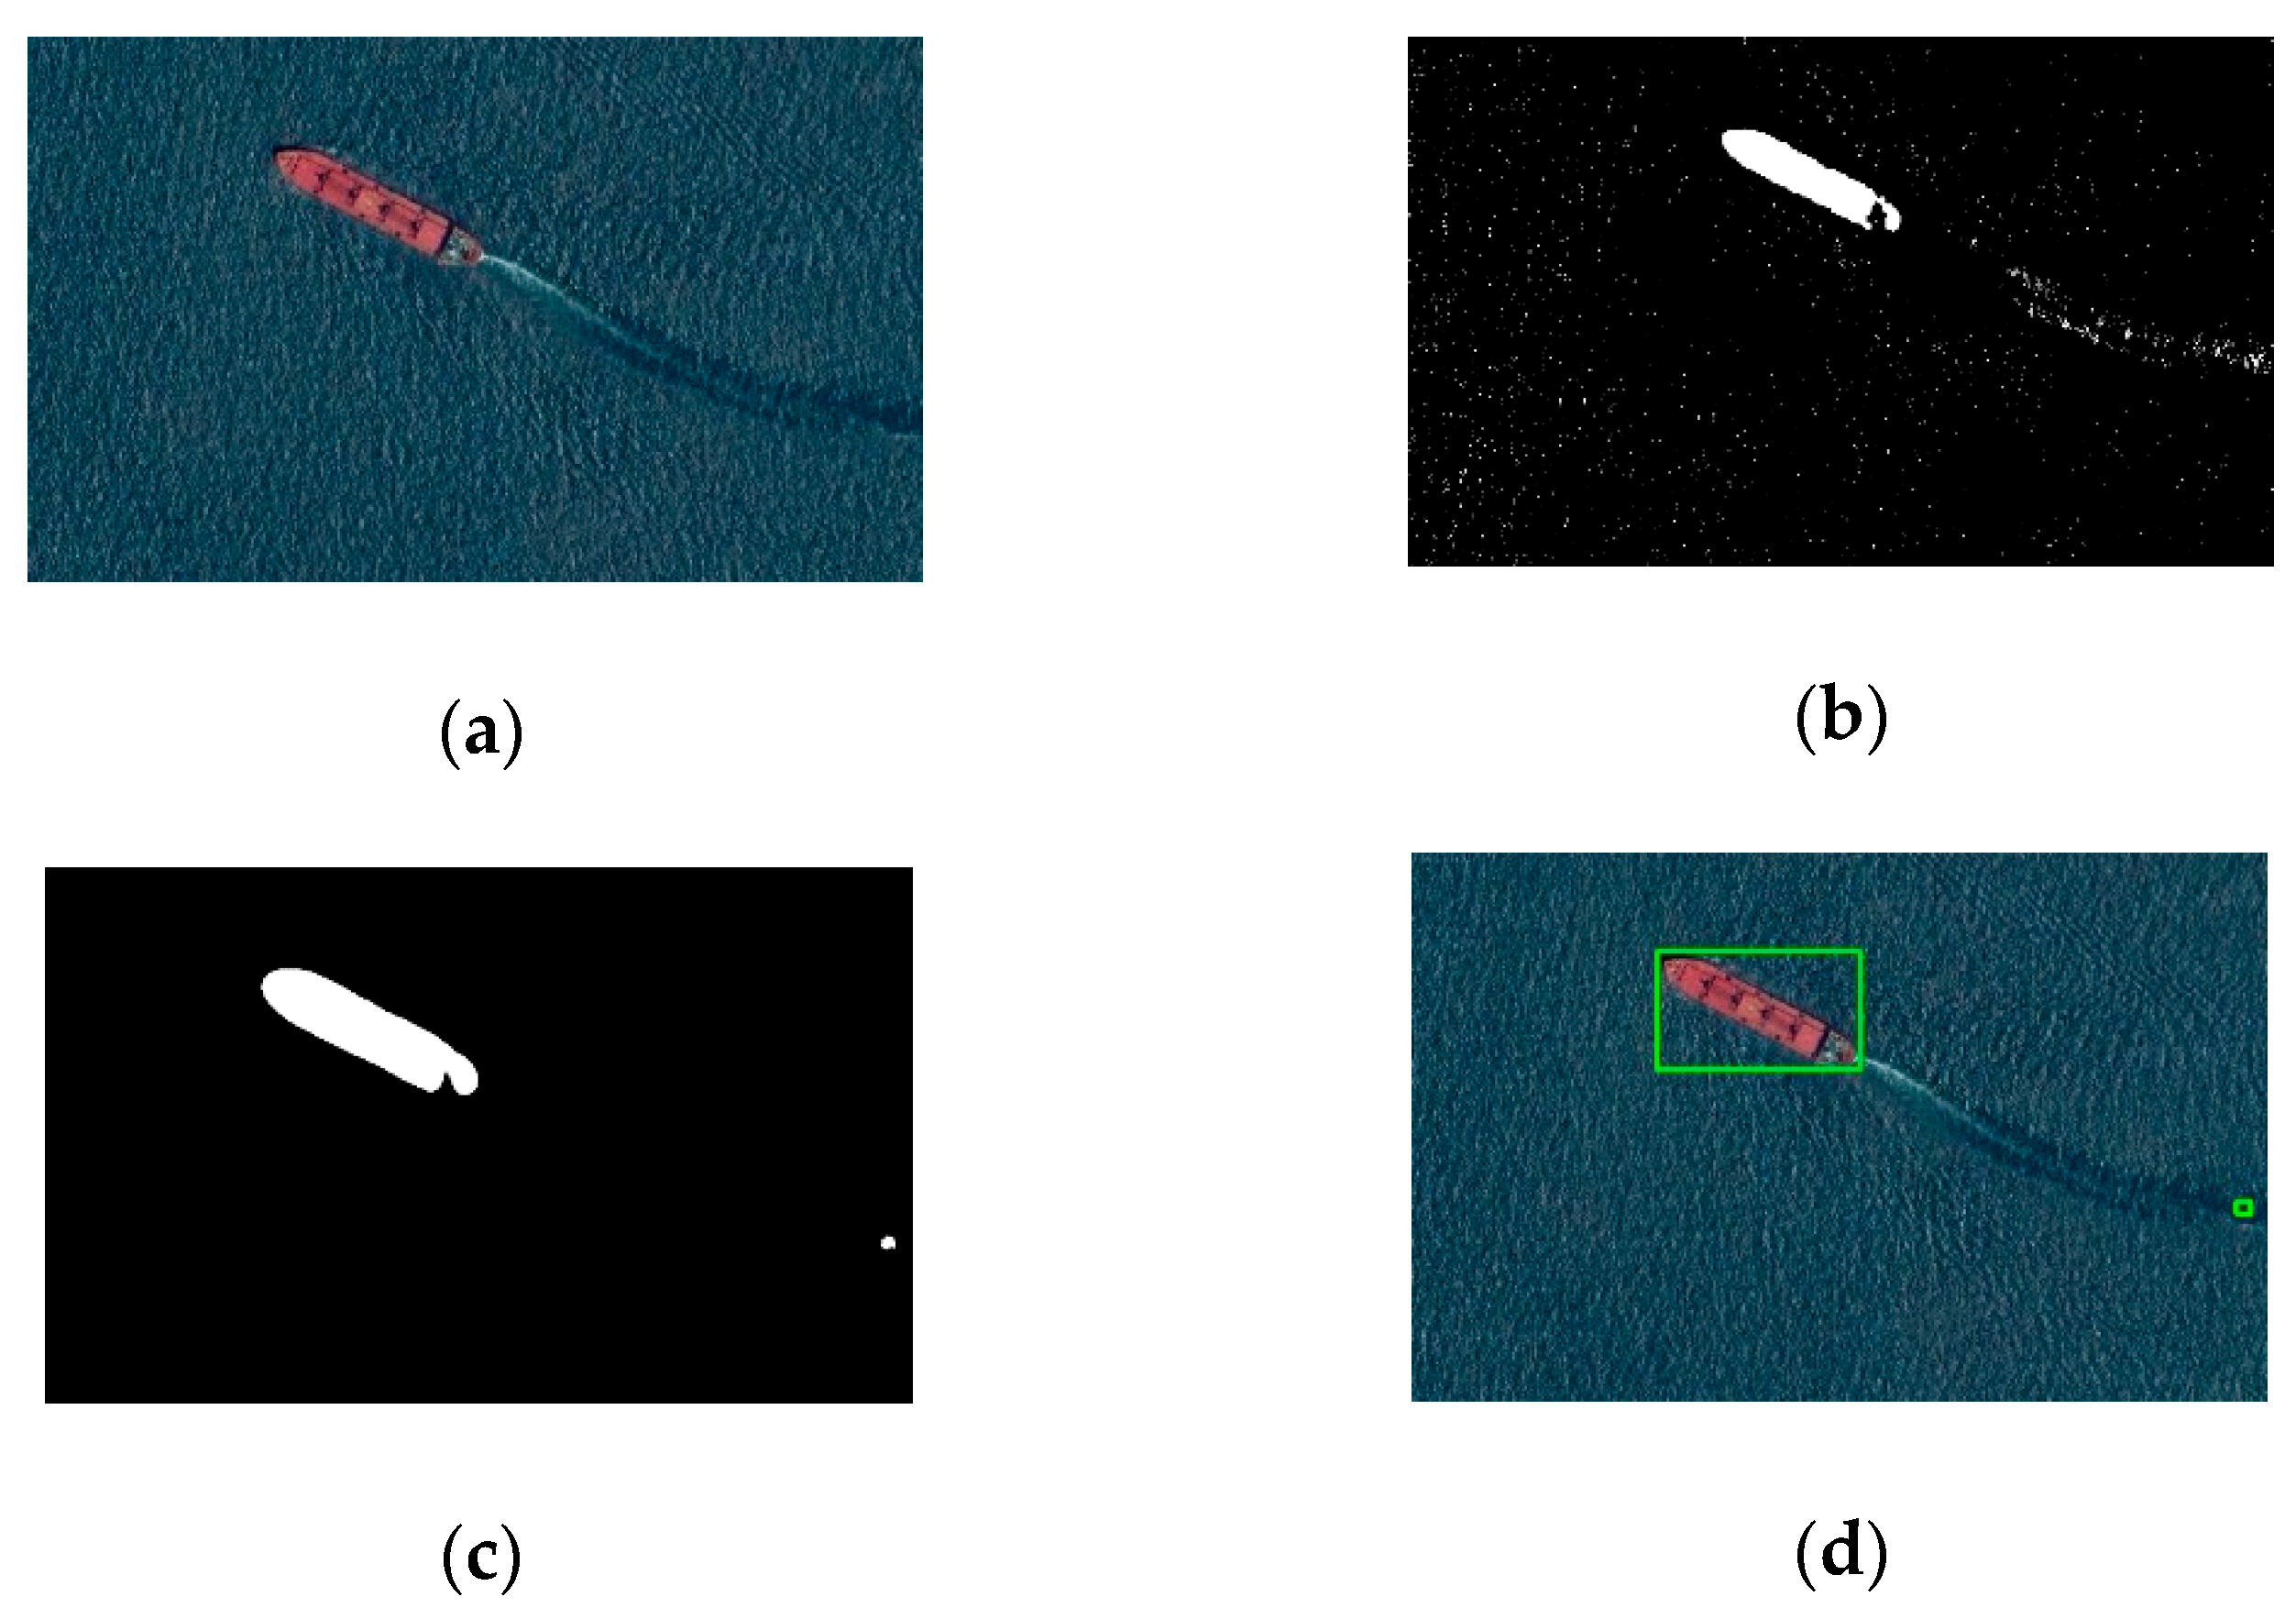
The above method can suppress and eliminate the salt and pepper noise points. However, it is still a tricky problem for the noise removal module to deal with relatively large noise areas like the noise area caused by the waves sailing boats left behind (as shown in the box (2) in the following Figure 8d). In addition, in the case of large winds and waves in the sea area where the hull is located, the amplitude of HSV fluctuations in the sea area around the hull will be large, thus causing the output image of noise removal to be unacceptable.
To solve this issue, additional statistical analysis of residual noise and ship boxes was performed. Figure 9 is created according to Table A1 and Table A2 in Appendix A, and it shows the comparison of the distribution between noise and ship boxes. The two box characteristics can then be analyzed from the joint distribution map. It appears that the noise boxes are mainly distributed between 0 and 70 pixels. The joint distribution map of the noise box is flat at 45°, thus indicating that the residual noise frame is more likely to appear in the form of a rectangular frame. However, the dimension of the ships is mainly distributed above 70 pixels, and the orientation of the targets causes the triangle shape. From the above analysis, the residual noise boxes’ characteristics are summarized as a square frame with dimension distributed between 0 and 70 pixels; the characteristics of the ships’ boxes are summarized as a rectangular frame with dimension distributed above 70 pixels.
After analyzing the characteristics of residual noise frames, such frames are removed. It can be observed from Figure 10 that a few noise frames generated by the wind and waves are accurately removed, leaving only the special boxes of the vessel. For example, the noise frames in Figure 10a,b are totally removed. The total number of removed noise boxes in these two figures are 1 box and 54 boxes, respectively. As shown in Figure 10c, 79 noise frames were removed, and only one noise frame is left. For this kind of noise frame containing objects different from ships, case 1 and case 3 in Section 2.4 were developed to solve this issue.

2.3.4. Anti-Distortion Operation

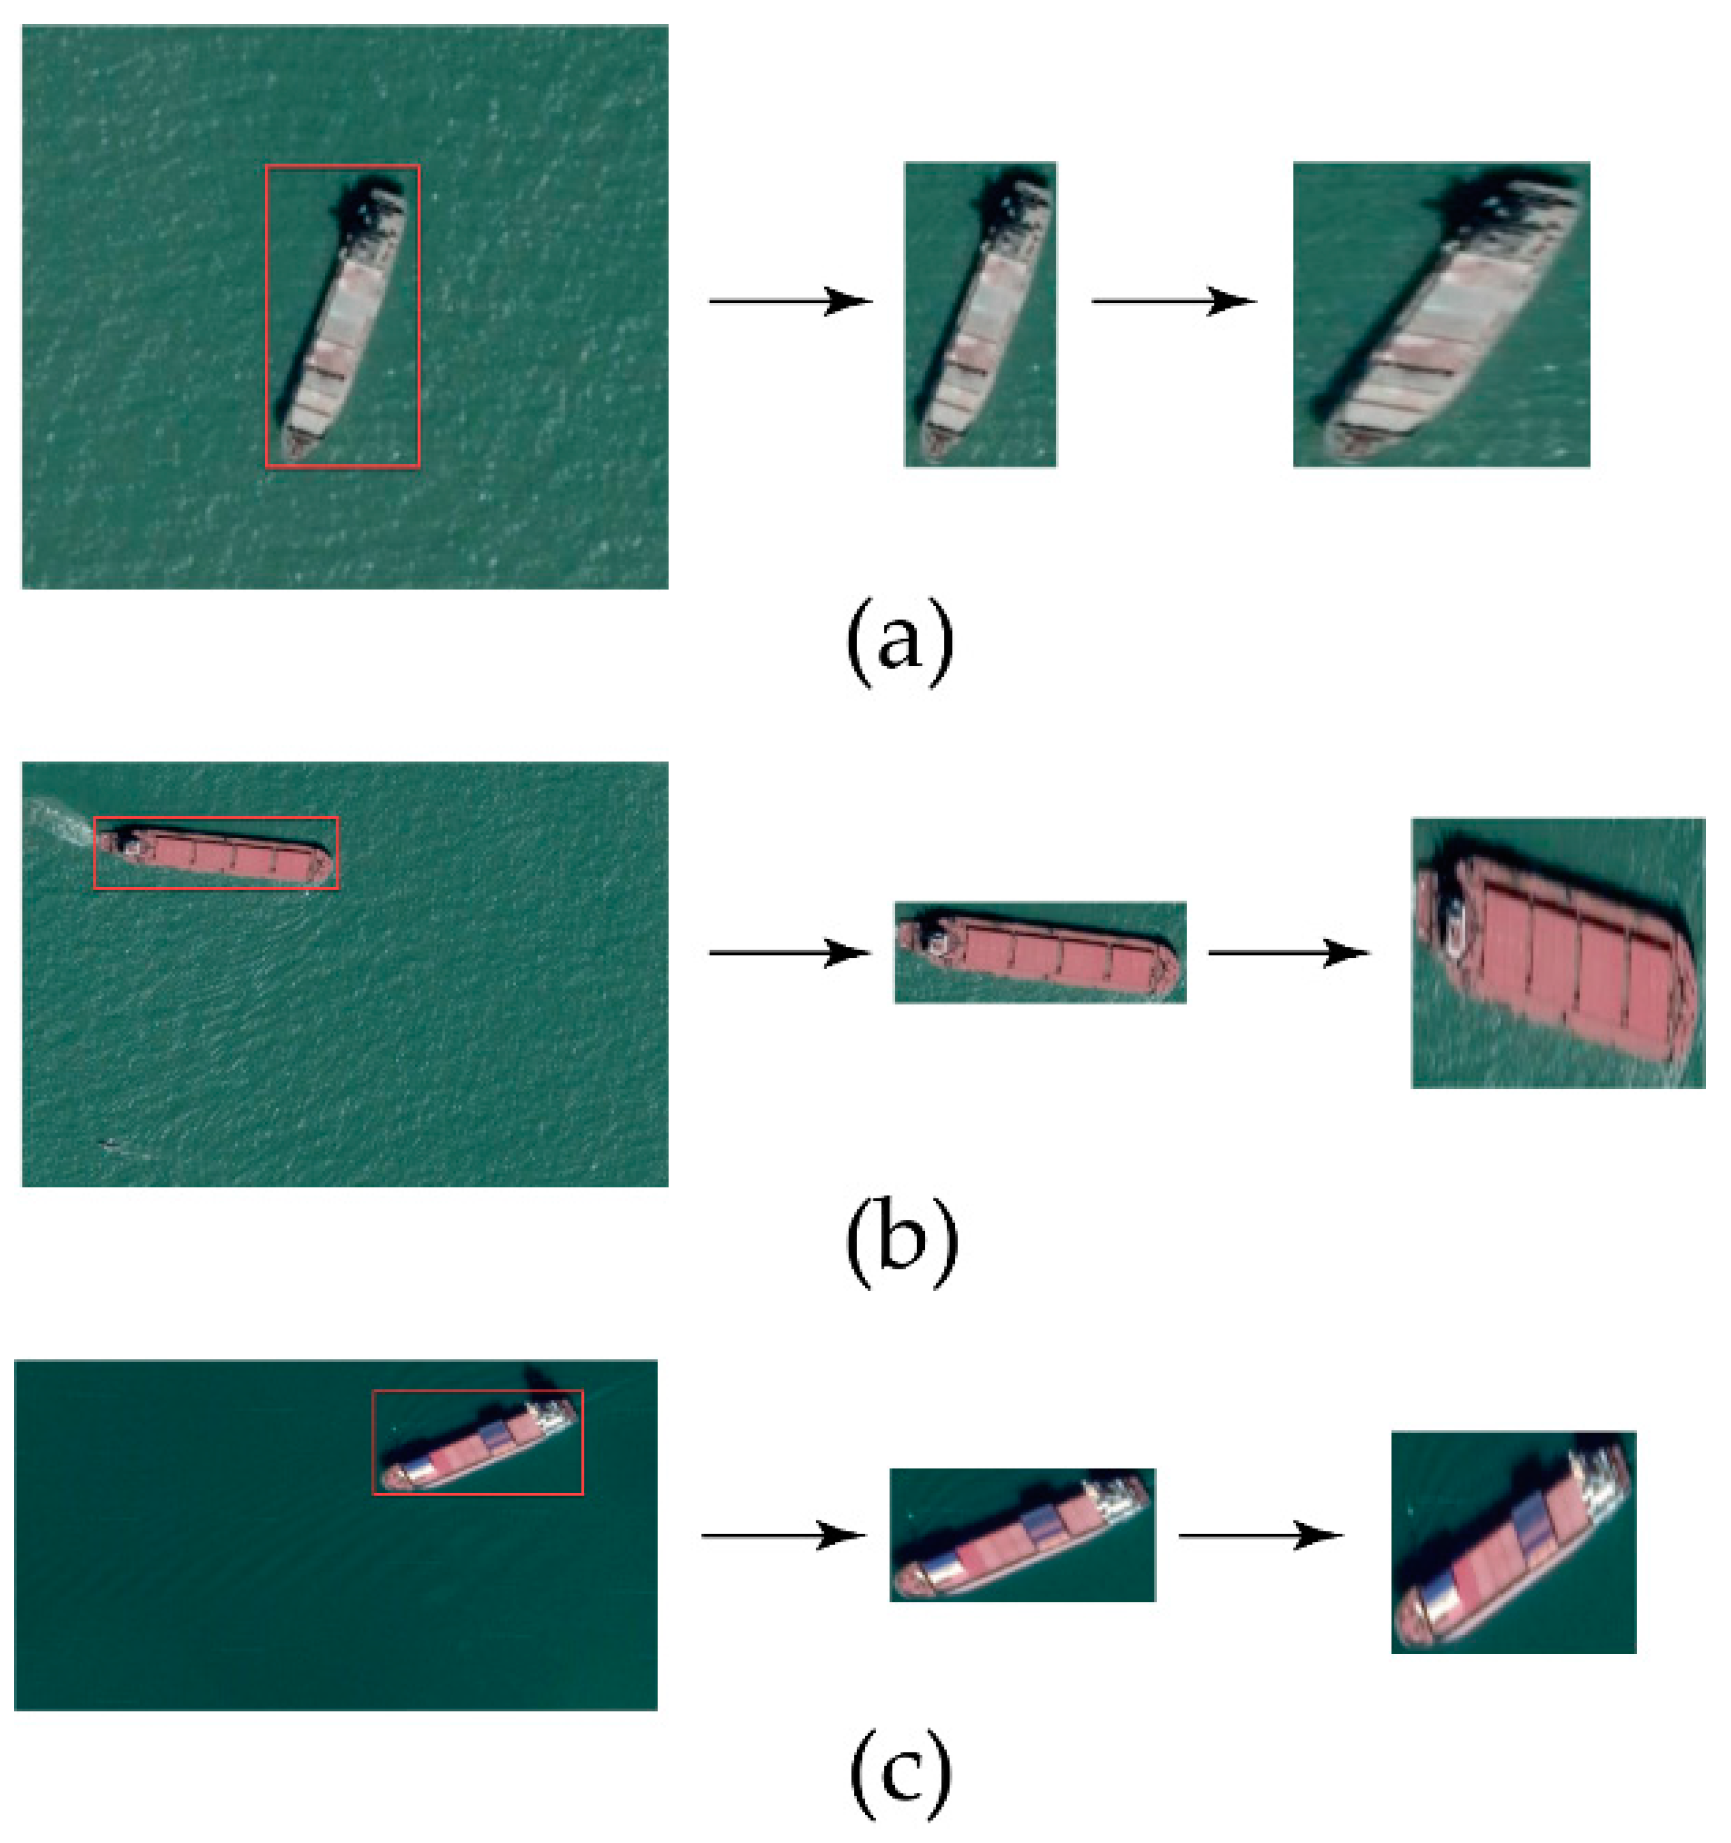
Since vessel positions as they appear in the remote sensing images are different from each other, as shown in Figure 11, this situation will cause the length of the sides selected by the RoI extraction network based on the difference of HSV to be different from each other. When the vessel’s angle is far from 45°, the aspect ratio is far from 1.
Before sending the selected box into the YOLOv3 network without processing it, it must be modified to an input image of rectangular size 416 × 416. This operation causes features squeezing and makes it harder for the network to recognize and classify the features. The orientation of ships determines the width and height of the region of interest extracted by the HSV operation module. When the image information in the region of interest is squeezed, the pixel information containing ships is different from the training data’s pixel information. Thus, the squeezing of the region of interest surely has an impact on ship detection. Intuitively, this can be explained as shown in Figure 12; the picture features with an aspect ratio close to 1 are less likely to be squeezed.
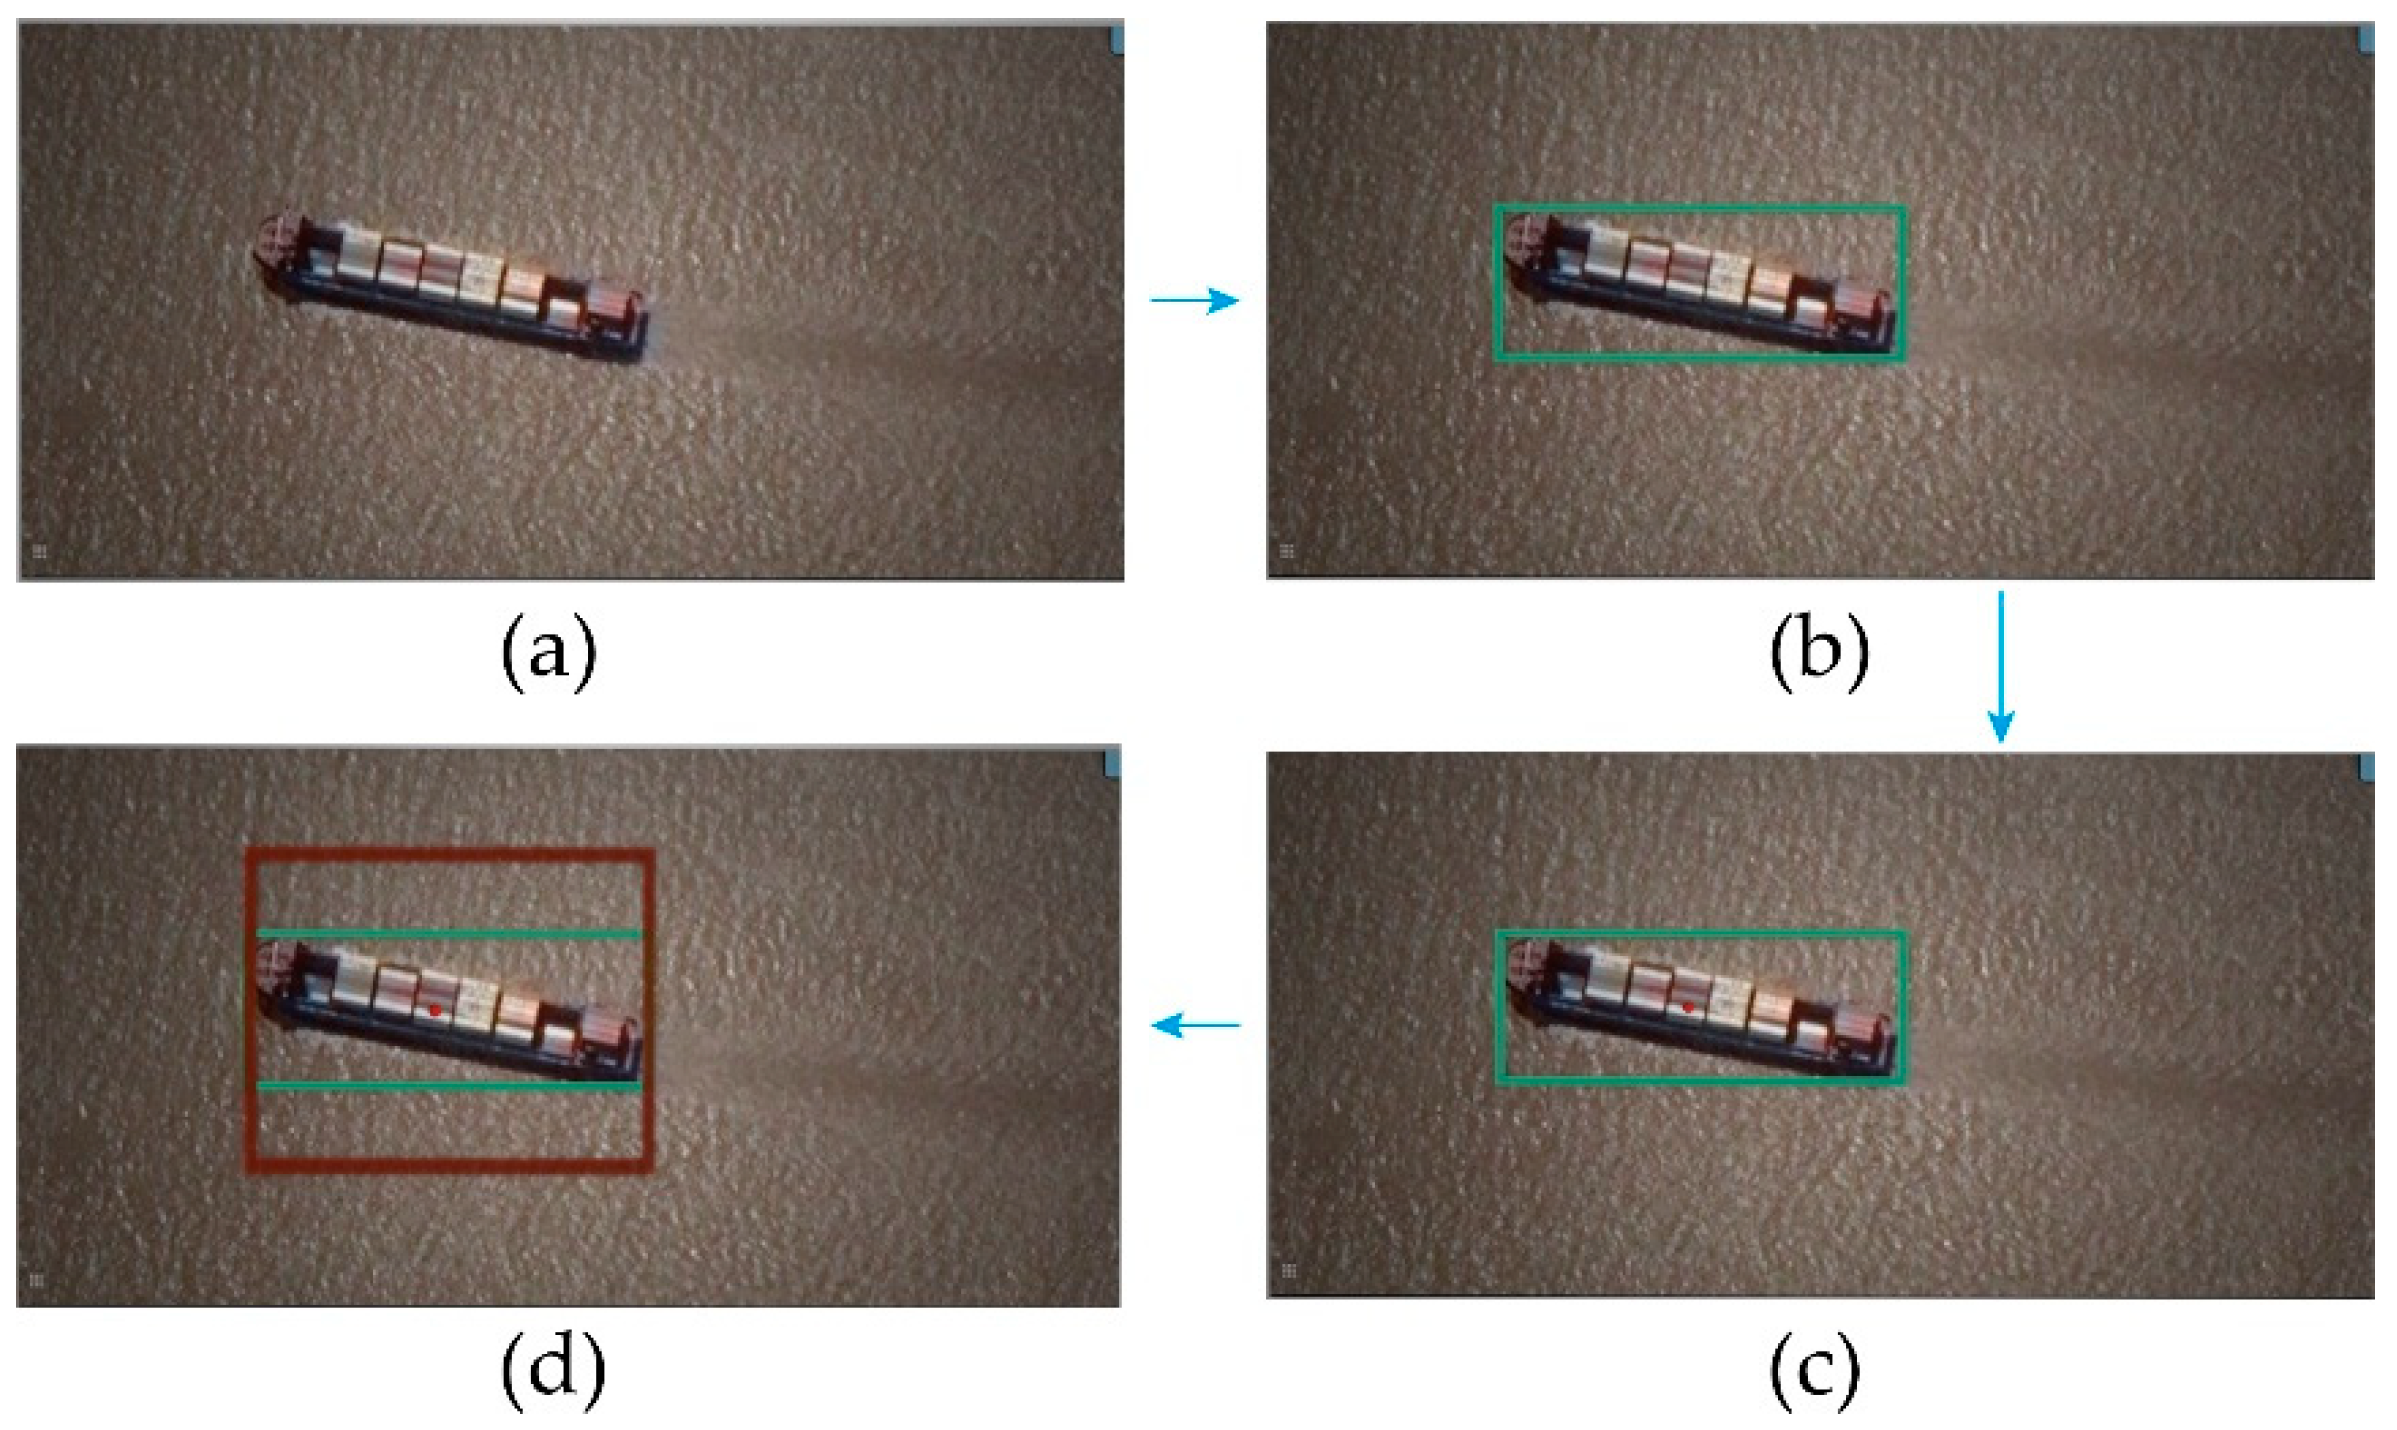
A solution can be obtained from the above analysis: performing an anti-extrusion treatment on the detection frame before sending it into detection, thereby making the characteristics better retained. Firstly, get the coordinates of the upper left corner (x, y) and the height and width values (h, w) by the processes of RoI extraction based on HSV difference.
Then compare the h and w values, and take the larger value as the final side length values. Finally, the last upper left corner coordinates are calculated according to the following Equation (1).
{ a = x + 1 2 ( w s ) b = y + 1 2 ( h s )
After calculating the coordinates of the upper left corner of the anti-compression frame, the necessary information of the extracted area, namely (a, b) and the side length s, can be obtained. The process is shown in Figure 13.

2.4. Switch Network Conditions

The processing pipeline of RoI extraction based on the HSV difference will change when the following two situations occur:
  • Switching condition 1: Record the total number of RoIs extracted, based on the HSV difference as S and set an upper limit value as T. When S is more massive than T, it directly jumps out of the extraction process.
  • Switching condition 2: Record the unknown number of the input image as N. Set a proportional value as k, and when the N/S ratio exceeds k, the network will be automatically switched to the yolov-3 network.
{ i s _ u s e _ y o l o = 1 N S     k i s _ u s e _ y o l o = 0 N S   >   k  
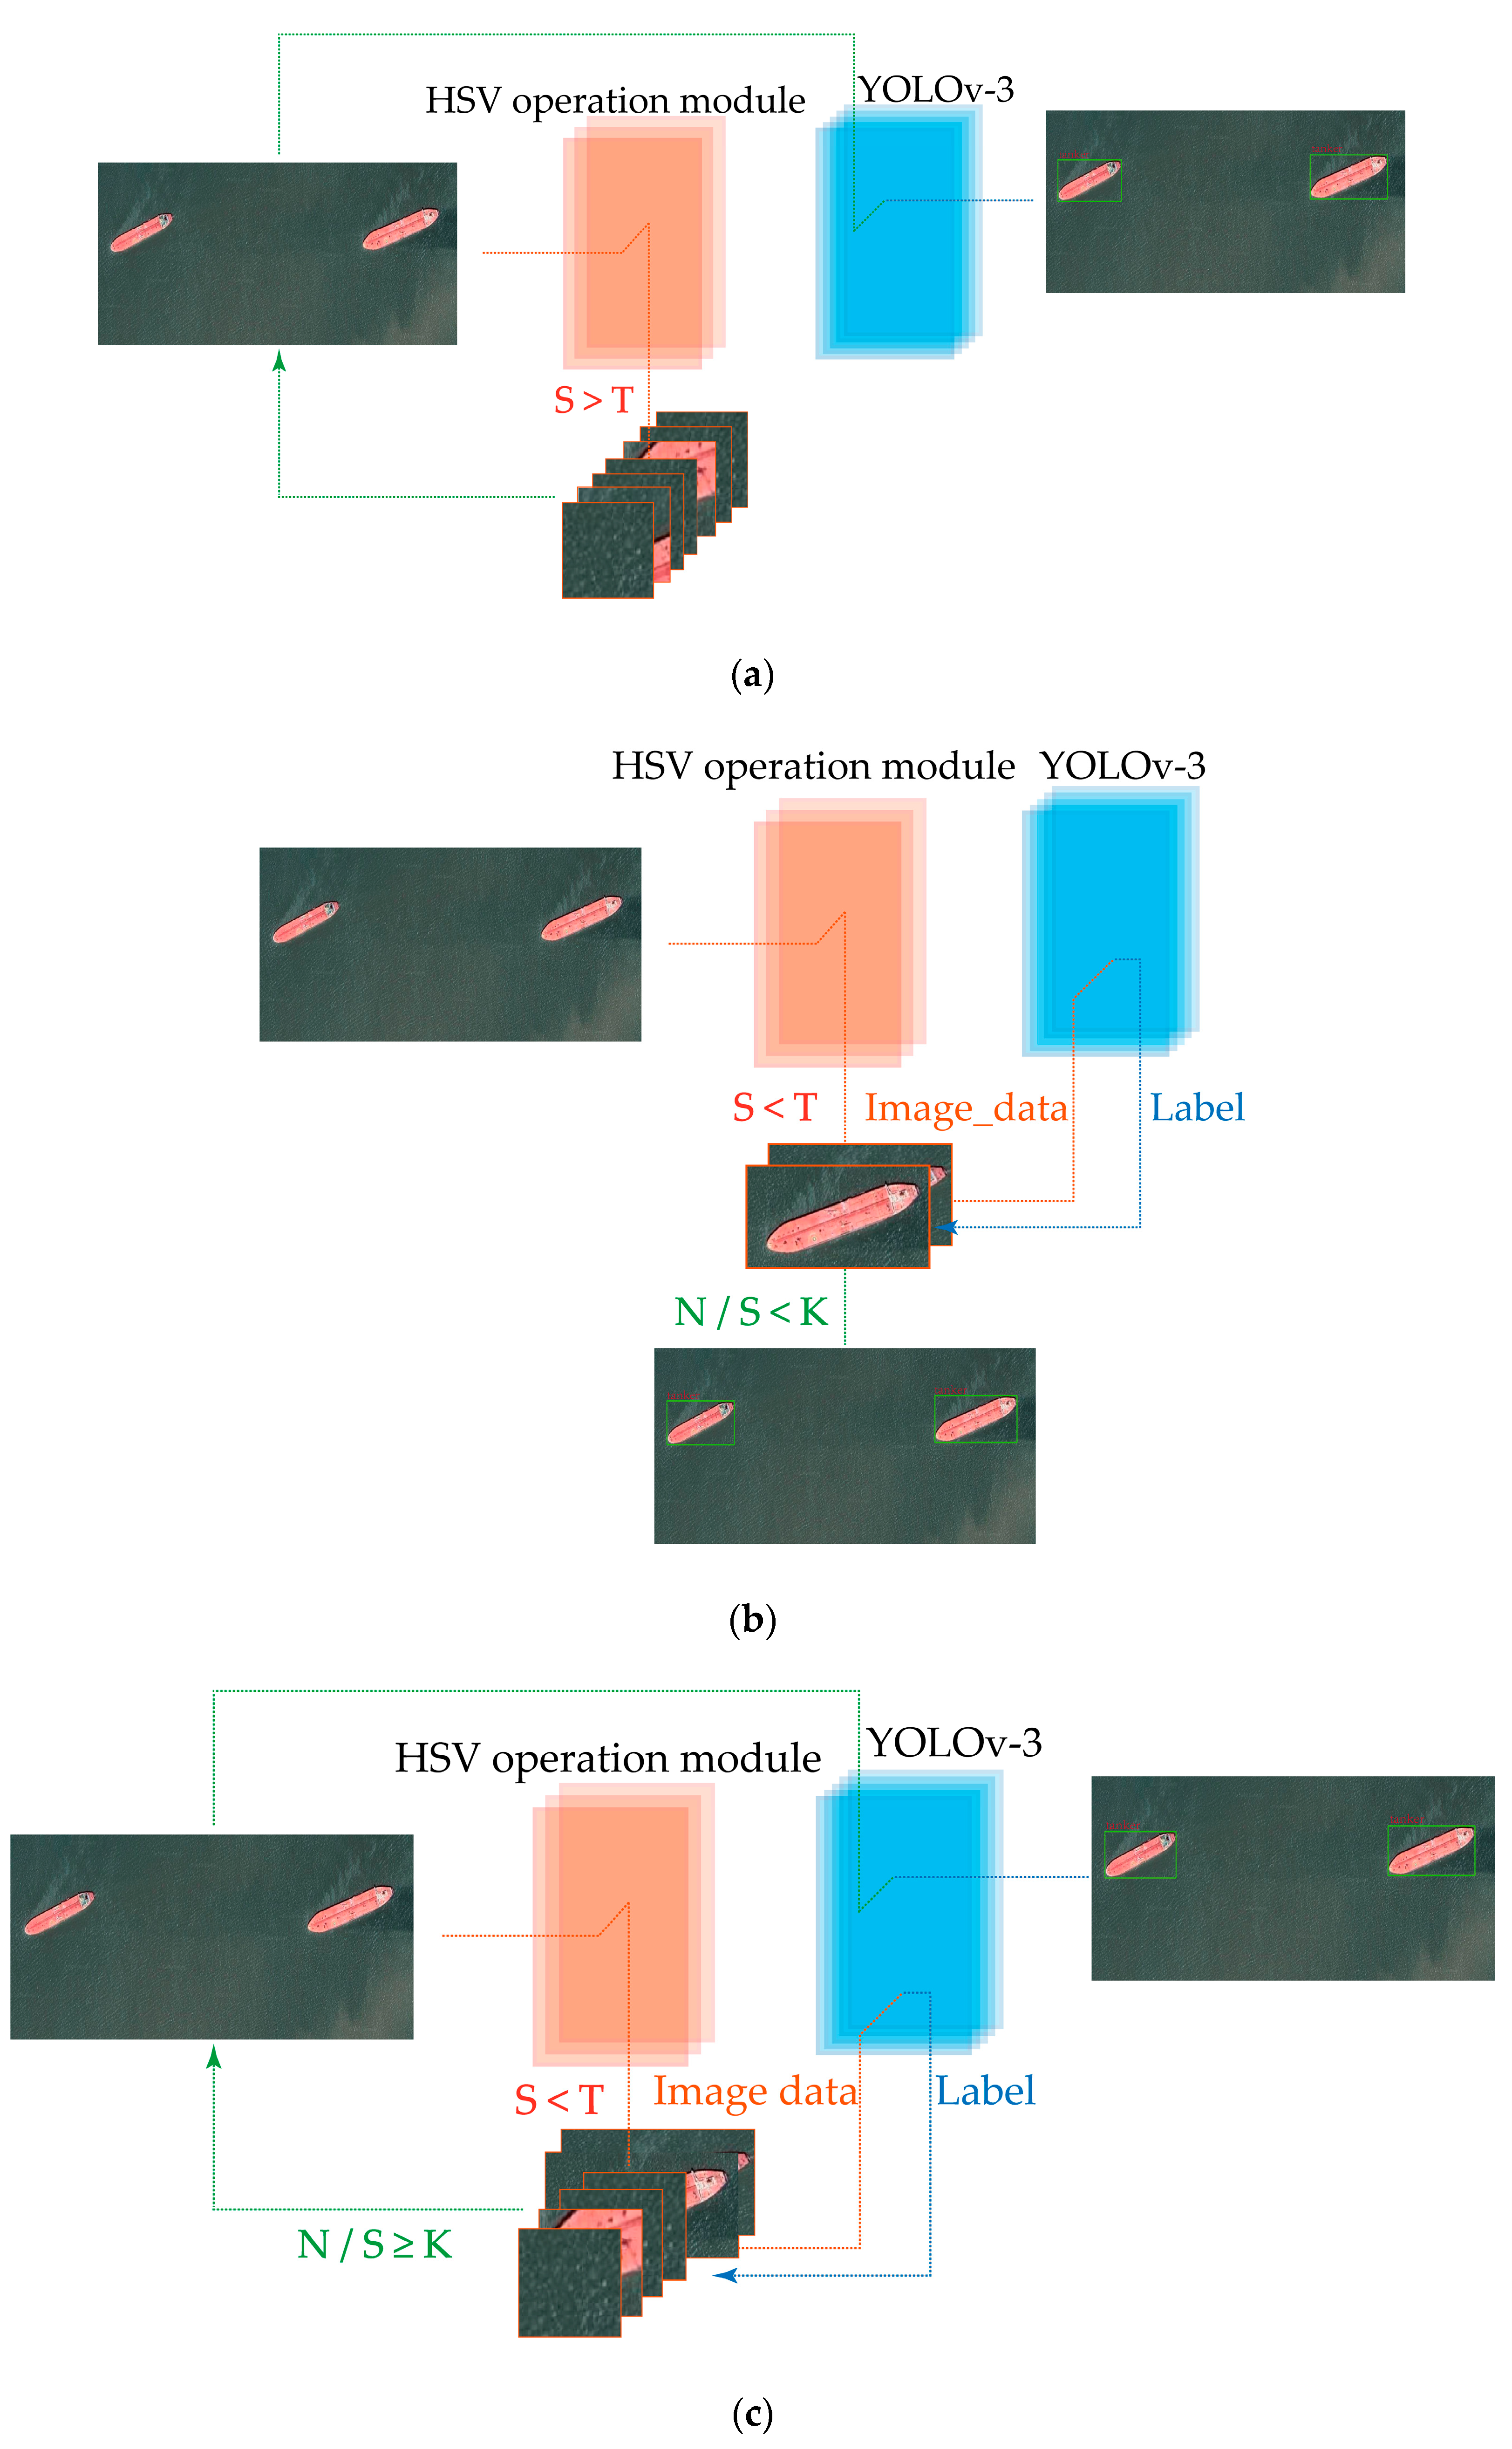
Figure 14 shows the flowchart of the proposed network, that includes cases 1, 2, and 3. The input images were sent into the HSV operation module to extract the RoIs and obtain the total number S. If S is larger than the upper limit T, it means that there is massive noise so the inputs are not suitable to detect all of the RoIs. The original input images will be sent into the detection network as shown in Figure 14a. However, if S is smaller than the upper limit T, the RoI extracted will be sent into the detection network in order to obtain the label and N, the total number of unrecognized RoI. The processing flow will be chosen according to the proportion of N and S. If the N/S ratio is smaller than k, the label will be attached to the RoI extracted from original images as shown in Figure 14b. In contrast, if the N/S ratio is larger than k, which means the recognition rate is still not high enough, the original image will be sent into the detection network, as shown in Figure 14c.

3. Results and Discussion

3.1. Ablation Experiment

Aiming at the vessel classification, the YOLOv3 algorithm is considered as a core to building a novel network. The main idea is first to classify the vessels use the YOLO-tiny algorithm, then use YOLO-tiny as the core of the HSV-based method to detect the ship and analyze the results. The main principles are as follows:
  • The training and testing sets are collected from Google Earth, with 560 samples containing categories of tanks, bulk carriers, and containers. Use this small training set to train and test the YOLO-tiny and HSV-base-YOLO-tiny algorithm.
  • Use a small sample (including 500 training samples) training set to train the network on the YOLO-tiny framework to get a weight file. YOLOv3-tiny and the improved SV-based-YOLOv3-tiny use the same weight file for testing.
  • To evaluate our proposed method’s performance on a lightweight data set that only provides limited samples, we use the HRSC2016 dataset [36]. It is a public high-resolution ship dataset that covers bounding-box labeling and three-level classes, including ship, ship category, and ship types. The HRSC2016 dataset contains images from two scenarios including ships on sea and ships close inshore. The dataset is derived from Google Earth images and associated annotations. The properties of the HRSC2016 dataset are shown in Table 1.
The YOLOv3 of the RoI network based on the HSV difference and the separate YOLOv3 network use the same trained weights described above, and the remaining variables are precisely the same except for the RoI extraction network. We use the same picture as the input of the two networks to get the test results. With respect to a given number Np for the remove background step, values have been tested from 30 to 120 and finally we set Np = 100, which provided the best performance. The proportion of pixel captured as ships is higher when Np is smaller than 100, this denoting that the calculated average value cannot represent the average value of the background. However, when Np is higher than 100, the results of the background removal are similar. For the parameter in the noise removal step, we set the value of the Gaussian blur kernel at (9 × 9).

3.2. Data Analysis

Through experiments, under the condition of small samples, the missed detection rate of YOLOv3 is 35.54%, the missed detection rate of HSV-YOLOv3 is 16.53%, and the missed detection rate of the improved method drops by 19.01%. In comparison, the accuracy rate of YOLOv3 is 70.25%, and the accuracy rate of HSV-YOLOv3 is 86.44%, an increase of 16.19%. Figure 15 and Figure 16 show an evaluation of our method as compared to YOLO, using similar weights on tiny objects, multiple objects, and large objects. The left column is the ground truth, the middle column is the test result of the original YOLO network, and the last column is the test result of H-YOLO. The proposed method solves the problem of not identifying a ship and not being able to obtain its location.
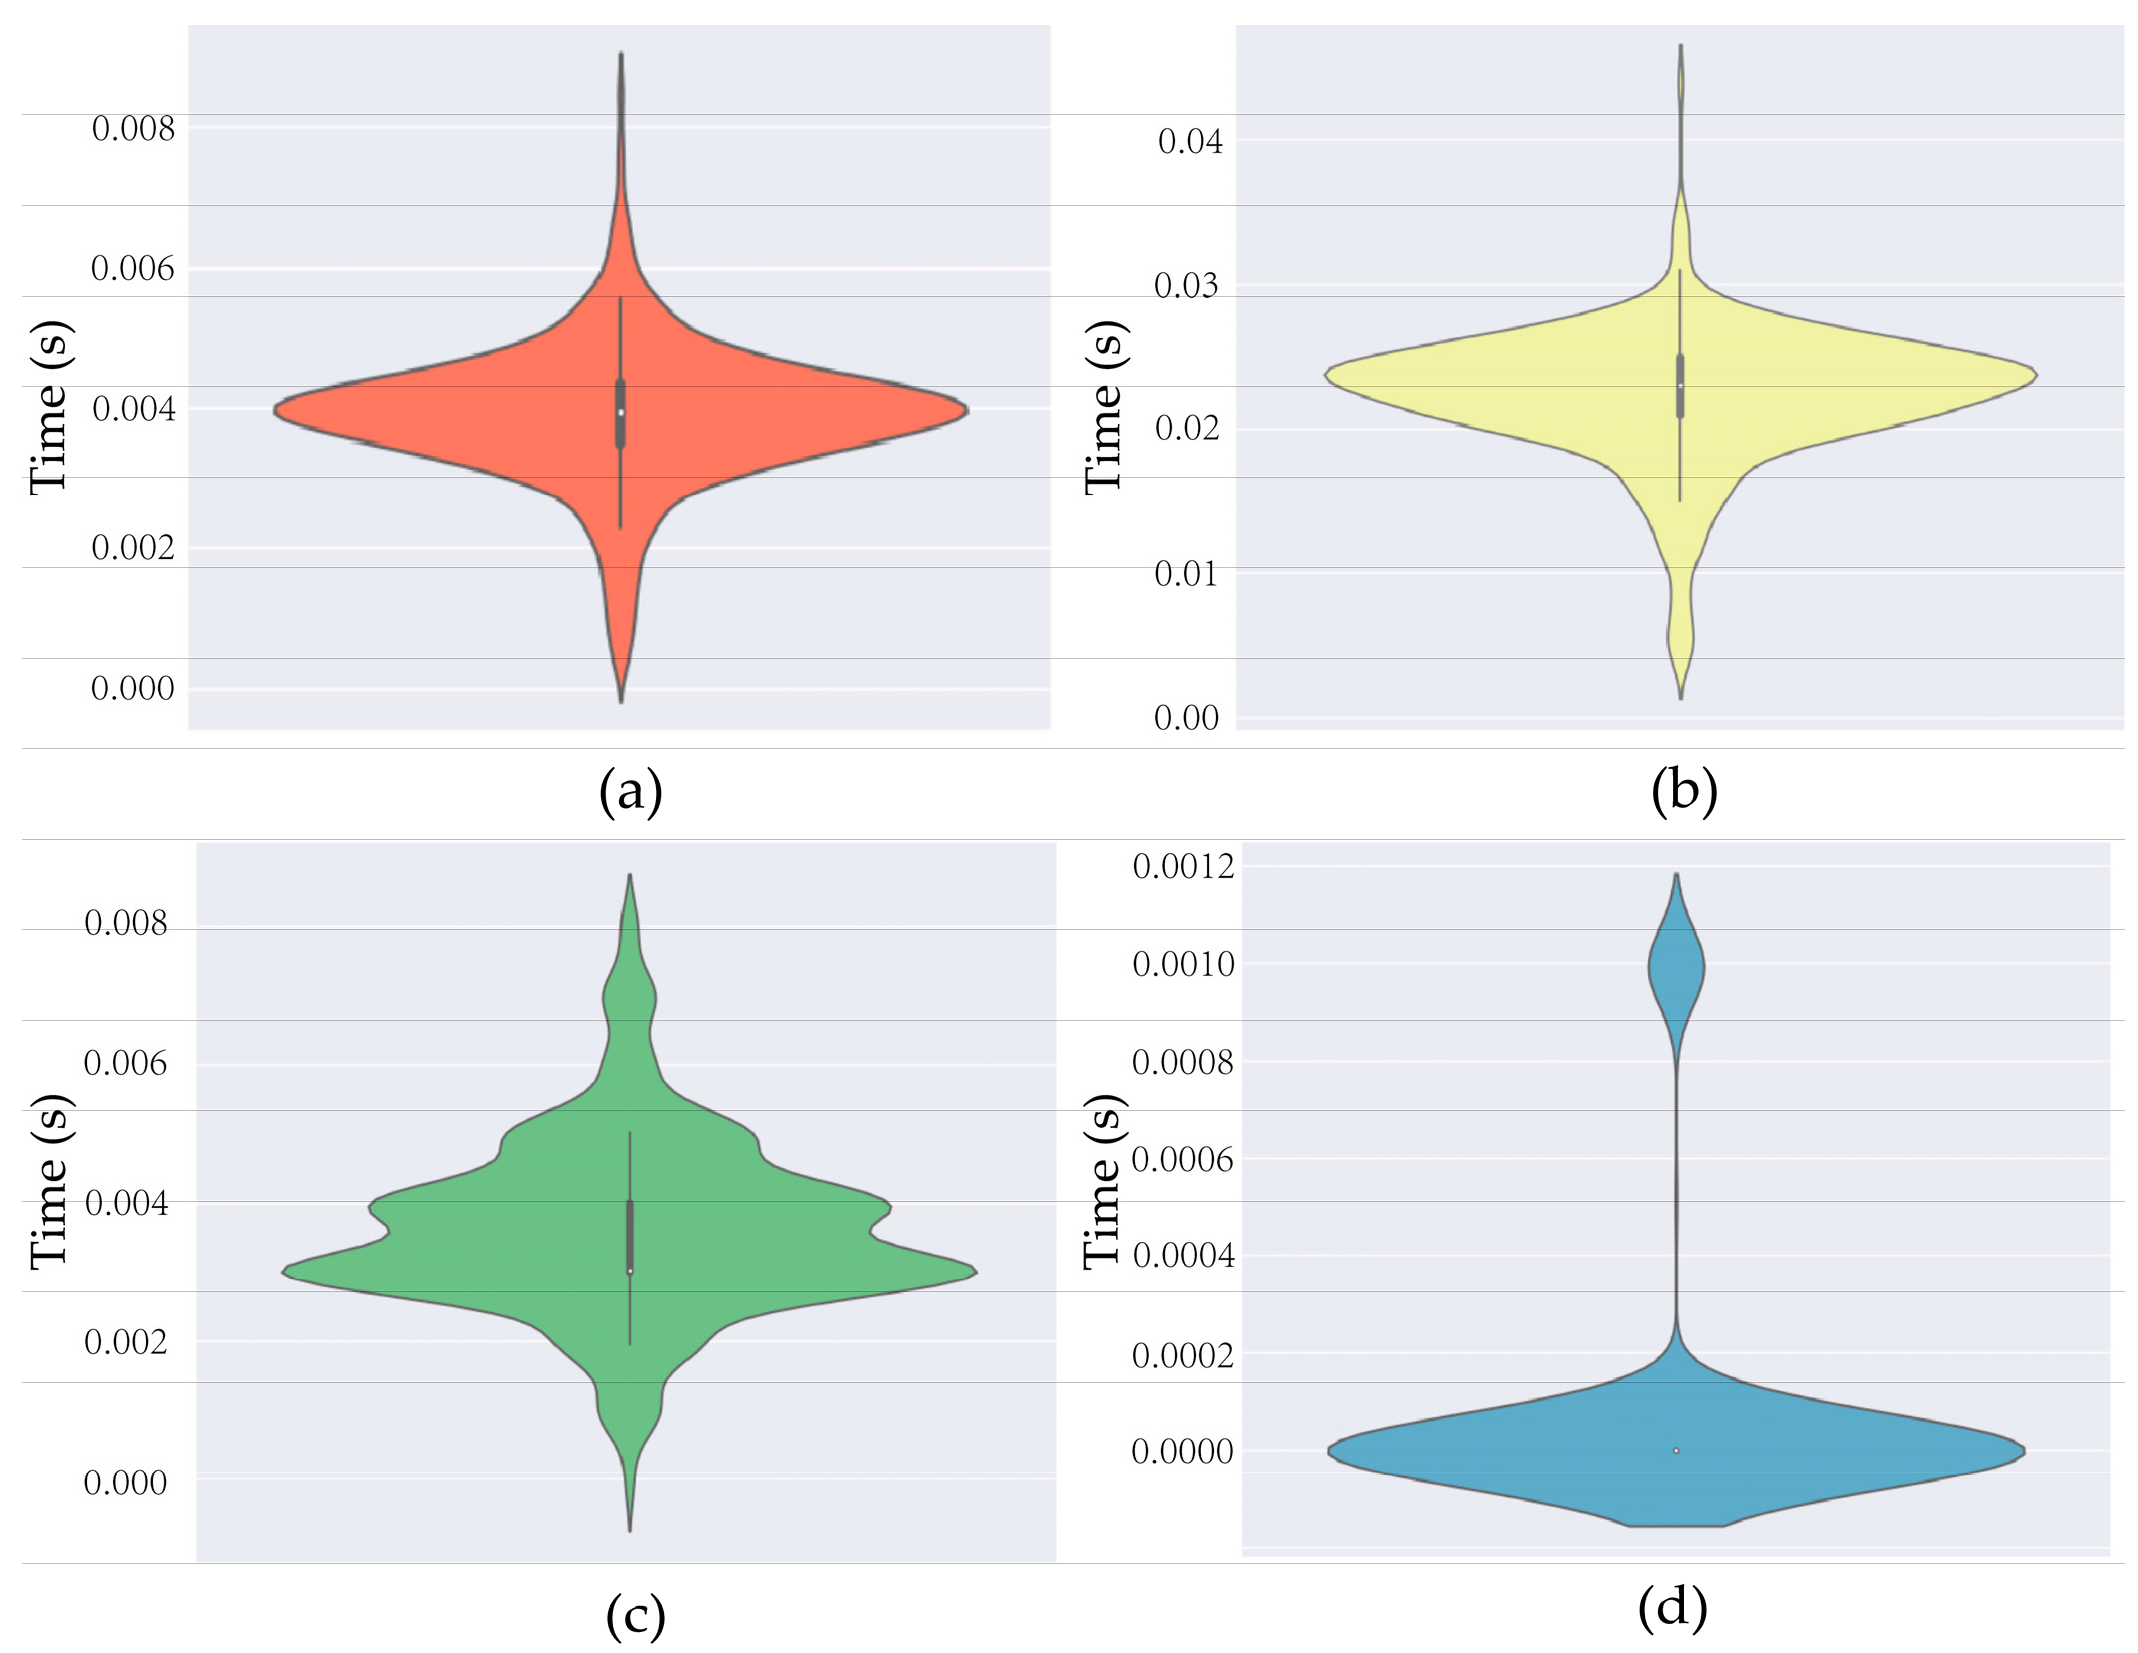
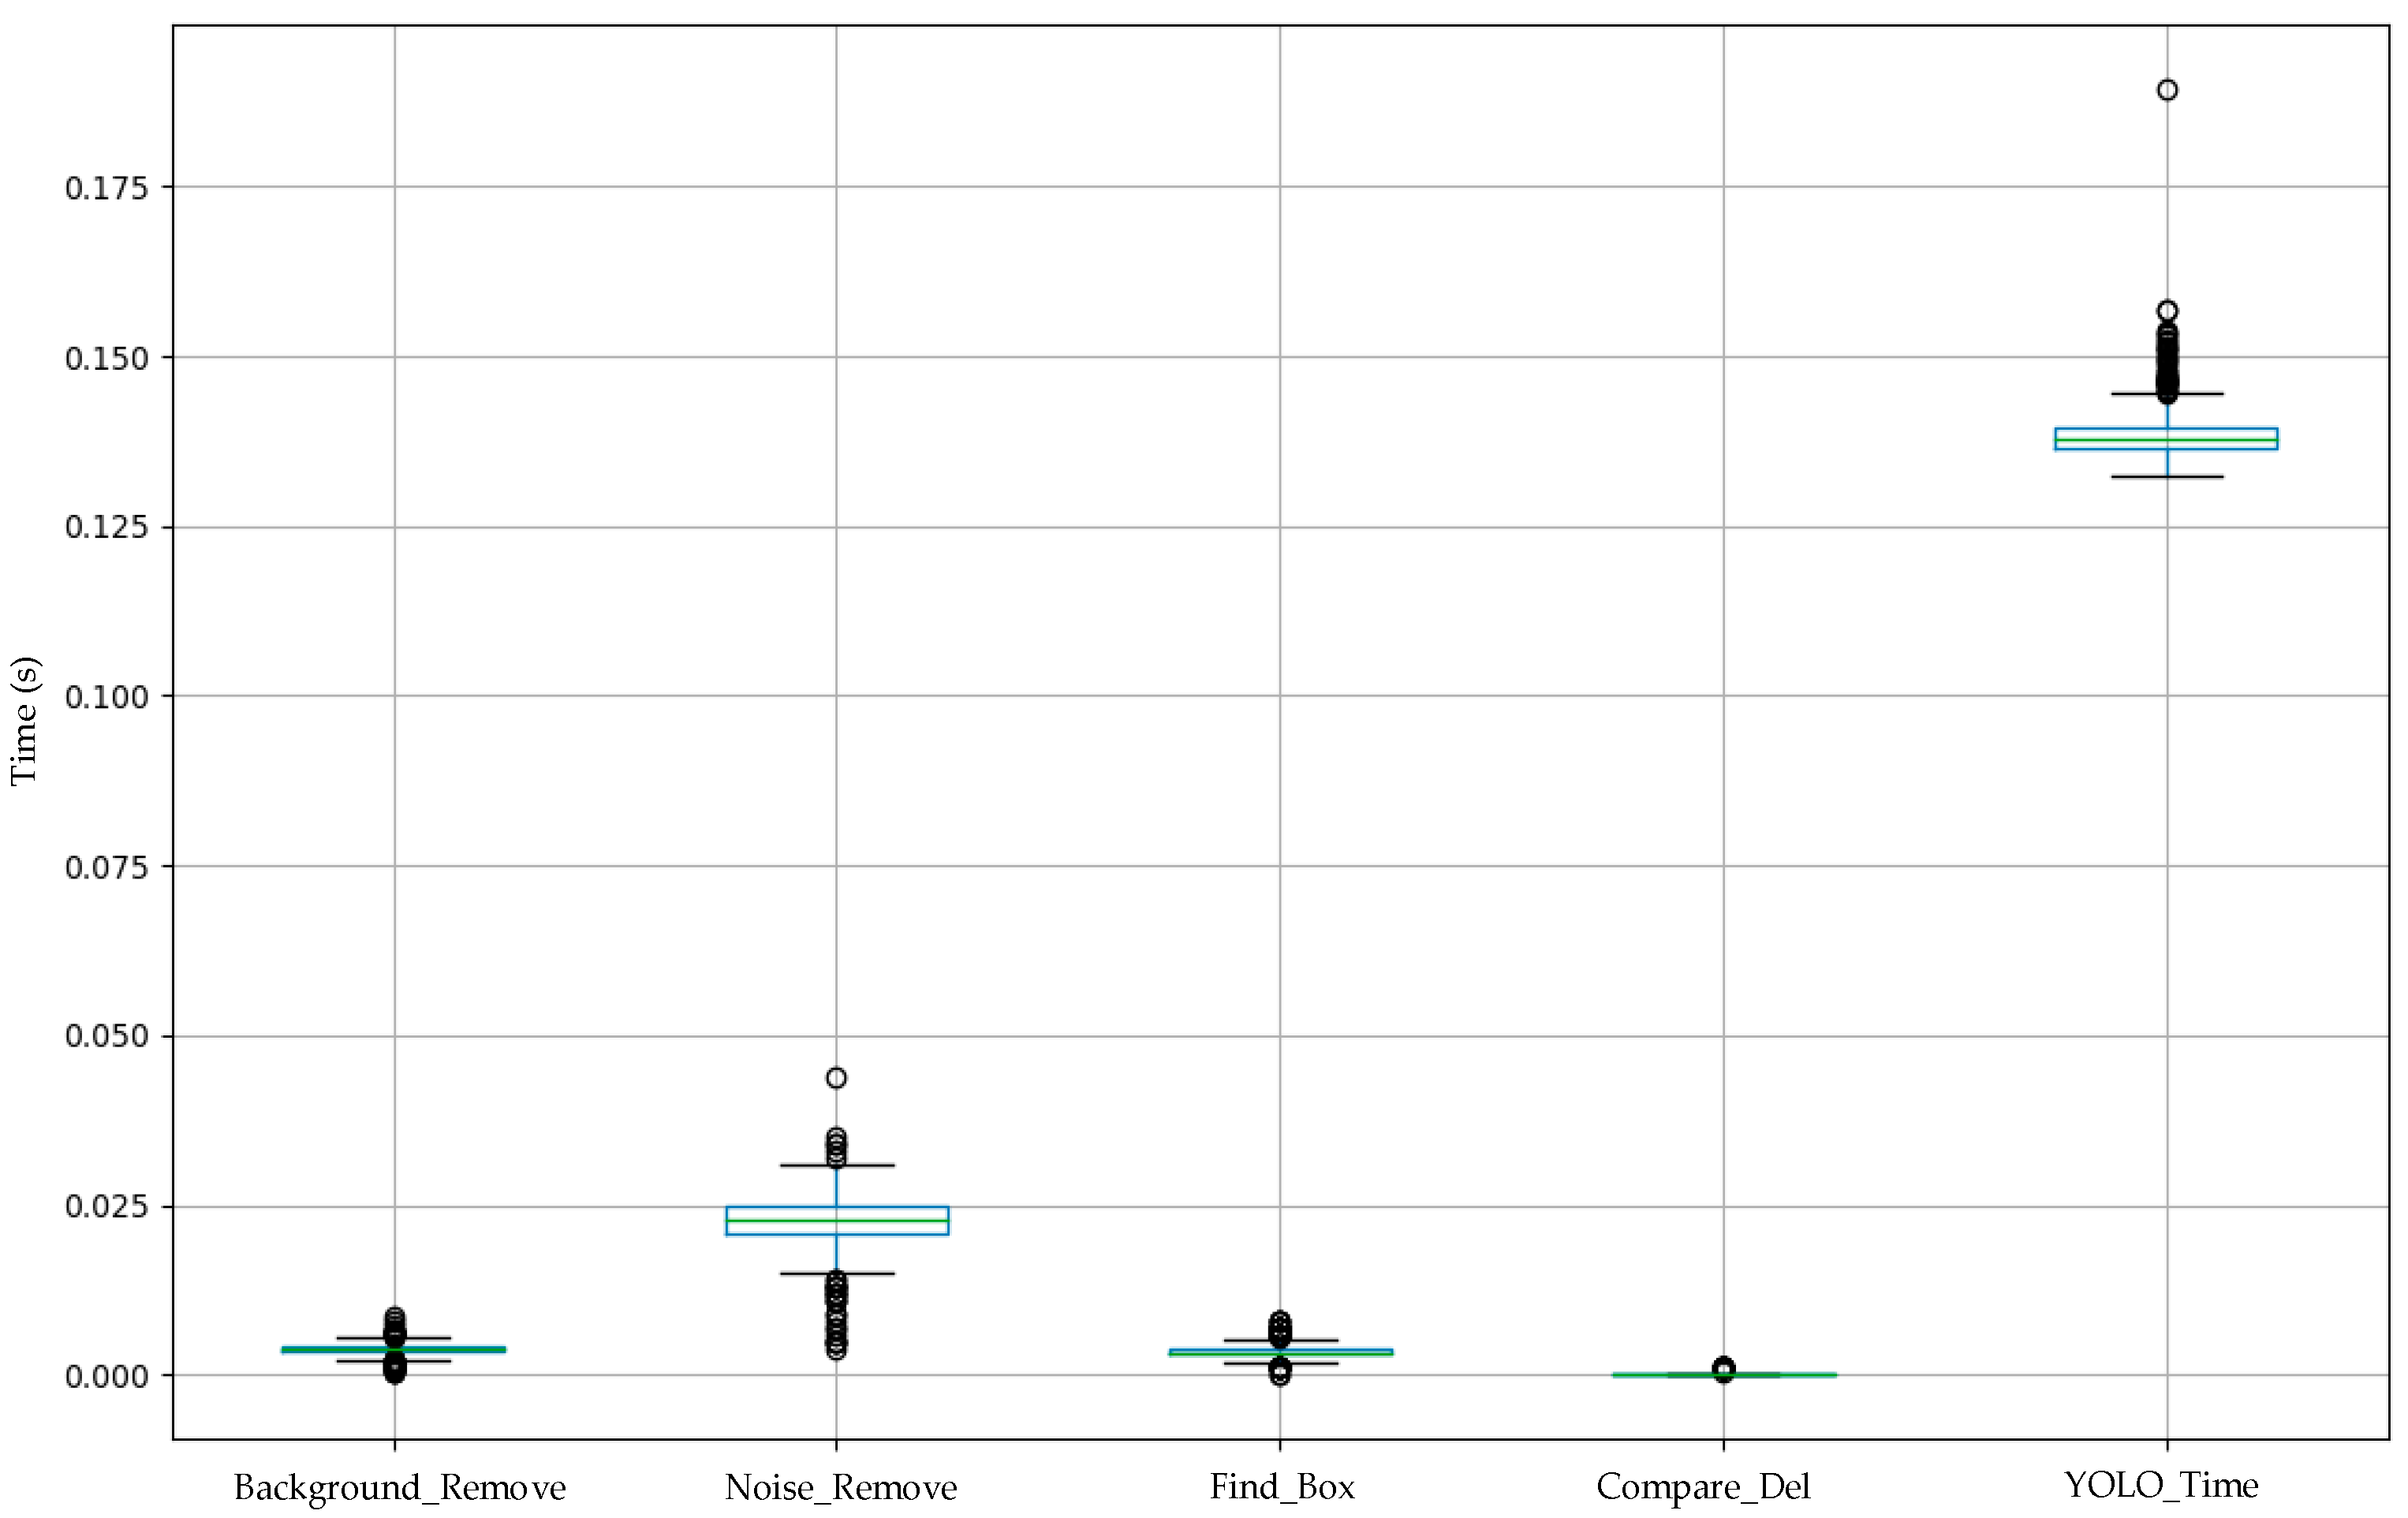
The network is split according to the RoI network extraction steps and based on HSV difference. The network’s step can be divided into background removal based on the HSV difference, noise removal, target frame selection, and the deletion step. For the background removal step based on the HSV difference, it can be seen from Figure 17 that the 400 pieces of test data are all under 0.01s; the time required for the selection step of the target frame is similar to that of the background removal step, which is also under 0.01s. The average time of both of them fluctuates up and down 0.003 s; the longest step of the average time is the noise removal step and the median value is around 0.023. The determinant of its duration is the upper limit value T in switching condition 1. The larger the value of T, the longer the period needed.
Test and record all the pictures in the training sample set to obtain the box diagram shown in Figure 18. It can be seen from the figure that the time required for each step is statistically compared with the time required for the YOLOv3 structure to identify a picture, which is approximately 20% of the time required for YOLOv3.

4. Conclusions

The research presented in this paper shows that a region of interest extraction and preprocessing based on the HSV difference can improve the ship detection accuracy in a relatively short computation time. From the experimental data, it can be observed that this method achieved a good recognition rate and received a better performance compared with its core algorithm. This method is particularly suitable for all detections which have simple background or a continuous color space in a local area. The HSV difference operation is computationally efficient and is a high precision method when pre-extracting a target. The experiments also show that the proposed method can generate high-quality RoIs by sacrificing little computing time. The proposed method also contains the pipeline to deal with noise information and prevent the method from falling into meaningless calculations. This mechanism ensures the efficiency of the proposed method. The method of image processing in the HSV operation module also affects the processing time, and we will compare different processing methods in our future work. The YOLOv3 algorithm used in the network can be deployed as other one-stage algorithms such as SSD, so performance comparison with different framework algorithms will be also be done in further work.

Author Contributions

Conceptualization, G.T. and S.L.; methodology, G.T.; software, G.T.; validation, G.T., S.L. and I.F.; formal analysis, G.T.; investigation, G.T.; resources, G.T.; data curation, G.T.; writing—original draft preparation, G.T.; writing—review and editing, C.C. and Y.W.; visualization, S.L.; supervision, G.T.; project administration, G.T.; funding acquisition, S.M. All authors have read and agreed to the published version of the manuscript.

Funding

This research was funded in part by the Medical Science and Technology Research Foundation of Guangdong under Grant A2020334, in part by the Youth Creative Talent Project (Natural Science) of Guangdong under Grant 2019KQNCX018, in part by the Young Talent Training Project of Guangzhou University of Chinese Medicine under Grant QNYC20190110.

Conflicts of Interest

The authors declare no conflict of interest.

Appendix A

We further show the part statistics of residual noise boxes and ship boxes, as shown in in Table A1 and Table A2. The joint distribution in Figure 9 is created according to the data in these two tables.
Table A1. Part statistics of height and width of residual value noise box.
WidthHeightWidthHeightWidthHeight
8145713
161286351010
5735191253
43263111
7669761415
41336351
1818211957
2310303125
773924134
3230951839
713437241112
2213192063
181816487136
292025432319
553415
126941223
192052921
33214678
1518833
Table A2. Part statistics of height and width of the ship box.
WidthHeightWidthHeightWidthHeight
218138240314120159
208177223164226168
87160215167222162
11988210152202145
172105151190126110
25912113020125790
26410023610311781
114901199811591
132137121241130101
175126108130153236
308206110275292172
20794175174150207
154326251126263121
250111114209121255
14513317910984128
211178150251184154
110206308236153130
175101130241

References

  1. Zou, Z.; Shi, Z. Ship Detection in Spaceborne Optical Image With SVD Networks. IEEE Trans. Geosci. Remote Sens. 2016, 54, 5832–5845. [Google Scholar] [CrossRef]
  2. Zhu, C.; Zhou, H.; Wang, R.; Guo, J. A Novel Hierarchical Method of Ship Detection from Spaceborne Optical Image Based on Shape and Texture Features. IEEE Trans. Geosci. Remote Sens. 2010, 48, 3446–3456. [Google Scholar] [CrossRef]
  3. Chen, H.; Gao, T.; Chen, W.; Zhang, Y.; Zhao, J. Contour Refinement and EG-GHT-Based Inshore Ship Detection in Optical Remote Sensing Image. IEEE Trans. Geosci. Remote Sens. 2019, 57, 8458–8478. [Google Scholar] [CrossRef]
  4. Qi, S.; Ma, J.; Lin, J.; Zhang, Y.; Tian, J. Unsupervised Ship Detection Based on Saliency and S-HOG Descriptor From Optical Satellite Images. IEEE Geosci. Remote Sens. Lett. 2015, 12, 1451–1455. [Google Scholar] [CrossRef]
  5. Yang, X.; Sun, H.; Fu, K.; Yang, J.; Sun, X.; Yan, M.; Guo, Z. Automatic Ship Detection in Remote Sensing Images from Google Earth of Complex Scenes Based on Multiscale Rotation Dense Feature Pyramid Networks. Remote Sens. 2018, 10, 132. [Google Scholar] [CrossRef] [Green Version]
  6. Li, Q.; Mou, L.; Liu, Q.; Wang, Y.; Zhu, X.X. HSF-Net: Multiscale Deep Feature Embedding for Ship Detection in Optical Remote Sensing Imagery. IEEE Trans. Geosci. Remote Sens. 2018, 56, 7147–7161. [Google Scholar] [CrossRef]
  7. Wang, S.; Wang, M.; Yang, S.; Jiao, L. New Hierarchical Saliency Filtering for Fast Ship Detection in High-Resolution SAR Images. IEEE Trans. Geosci. Remote Sens. 2016, 55, 351–362. [Google Scholar] [CrossRef]
  8. Eldhuset, K. An automatic ship and ship wake detection system for spaceborne SAR images in coastal regions. IEEE Trans. Geosci. Remote Sens. 1996, 34, 1010–1019. [Google Scholar] [CrossRef]
  9. Liu, C.; Gierull, C.H. A New Application for PolSAR Imagery in the Field of Moving Target Indication/Ship Detection. IEEE Trans. Geosci. Remote Sens. 2007, 45, 3426–3436. [Google Scholar] [CrossRef]
  10. Tello, M.; Lopez-Martinez, C.; Mallorqui, J. A Novel Algorithm for Ship Detection in SAR Imagery Based on the Wavelet Transform. IEEE Geosci. Remote Sens. Lett. 2005, 2, 201–205. [Google Scholar] [CrossRef]
  11. Margarit, G.; Mallorqui, J.J.; Fortuny-Guasch, J.; Lopez-Martinez, C. Exploitation of Ship Scattering in Polarimetric SAR for an Improved Classification Under High Clutter Conditions. IEEE Trans. Geosci. Remote Sens. 2009, 47, 1224–1235. [Google Scholar] [CrossRef]
  12. Vachon, P.; Campbell, J.; Bjerkelund, C.; Dobson, F.; Rey, M. Ship Detection by the RADARSAT SAR: Validation of Detection Model Predictions. Can. J. Remote Sens. 1997, 23, 48–59. [Google Scholar] [CrossRef]
  13. Morse, A.J.; Protheroe, M.A. Cover Vessel classification as part of an automated vessel traffic monitoring system using SAR data. Int. J. Remote Sens. 1997, 18, 2709–2712. [Google Scholar] [CrossRef]
  14. Ma, M.; Chen, J.; Liu, W.; Yang, W. Ship Classification and Detection Based on CNN Using GF-3 SAR Images. Remote Sens. 2018, 10, 2043. [Google Scholar] [CrossRef] [Green Version]
  15. Ai, J.; Qi, X.; Yu, W.; Deng, Y.; Liu, F.; Shi, L.; Jia, Y. A Novel Ship Wake CFAR Detection Algorithm Based on SCR Enhancement and Normalized Hough Transform. IEEE Geosci. Remote Sens. Lett. 2011, 8, 681–685. [Google Scholar] [CrossRef]
  16. Xu, J.; Sun, X.; Zhang, D.; Fu, K. Automatic Detection of Inshore Ships in High-Resolution Remote Sensing Images Using Robust Invariant Generalized Hough Transform. IEEE Geosci. Remote Sens. Lett. 2014, 11, 2070–2074. [Google Scholar] [CrossRef]
  17. Proia, N.; Page, V. Characterization of a Bayesian Ship Detection Method in Optical Satellite Images. IEEE Geosci. Remote Sens. Lett. 2010, 7, 226–230. [Google Scholar] [CrossRef]
  18. Ojala, T.; Pietikainen, M.; Harwood, D. Performance Evaluation of Texture Measures with Classification Based on Kullback Discrimination of Distributions. In Proceedings of the 12th International Conference on Pattern Recognition, Jerusalem, Israel, 9–13 October 1994; pp. 582–585. [Google Scholar]
  19. Diao, W.; Sun, X.; Zheng, X.; Dou, F.; Wang, H.; Fu, K. Efficient Saliency-Based Object Detection in Remote Sensing Images Using Deep Belief Networks. IEEE Geosci. Remote Sens. Lett. 2016, 13, 137–141. [Google Scholar] [CrossRef]
  20. Liu, G.; Zhang, Y.; Zheng, X.; Sun, X.; Fu, K.; Wang, H. A New Method on Inshore Ship Detection in High-Resolution Satellite Images Using Shape and Context Information. IEEE Geosci. Remote Sens. Lett. 2014, 11, 617–621. [Google Scholar] [CrossRef]
  21. Redmon, J.; Divvala, S.; Girshick, R.; Farhadi, A. You Only Look Once: Unified, Real-Time Object Detection. In Proceedings of the IEEE Conference on Computer Vision and Pattern Recognition (CVPR), Las Vegas, NV, USA, 27–30 June 2016; pp. 779–788. [Google Scholar]
  22. Redmon, J.; Farhadi, A. YOLO9000: Better, Faster, Stronger. In Proceedings of the IEEE Conference on Computer Vision and Pattern Recognition, Honolulu, HI, USA, 21–26 July 2017; pp. 7263–7271. [Google Scholar]
  23. Redmon, J.; Farhadi, A. Yolov3: An incremental improvement. arXiv 2018, arXiv:1804.02767. [Google Scholar]
  24. Bochkovskiy, A.; Wang, C.-Y.; Liao, H.-Y.M. YOLOv4: Optimal Speed and Accuracy of Object Detection. arXiv 2020, arXiv:2004.1093. [Google Scholar]
  25. Ren, S.; He, K.; Girshick, R.; Sun, J. Faster R-Cnn: Towards Real-Time Object Detection with Region Proposal Networks. In Proceedings of the Twenty-Ninth Conference on Neural Information Processing Systems, Montréal, QC, Canada, 7–12 December 2015; pp. 91–99. [Google Scholar]
  26. Cai, Z.; Fan, Q.; Feris, R.S.; Vasconcelos, N. A Unified Multi-scale Deep Convolutional Neural Network for Fast Object Detection. Comput. Vis. 2016, 9908, 354–370. [Google Scholar]
  27. Li, Z.; Peng, C.; Yu, G.; Zhang, X.; Deng, Y.; Sun, J. Light-Head R-Cnn: In Defense of Two-Stage Object Detector. arXiv 2017, arXiv:1711.07264. [Google Scholar]
  28. He, K.; Gkioxari, G.; Dollár, P.; Girshick, R. Mask R-Cnn. In Proceedings of the IEEE International Conference on Computer Vision, Venice, Italy, 22–29 October 2017; pp. 2961–2969. [Google Scholar]
  29. He, K.; Zhang, X.; Ren, S.; Sun, J. Spatial pyramid pooling in deep convolutional networks for visual recognition. IEEE Trans. Pattern Anal. Mach. Intell. 2015, 37, 1904–1916. [Google Scholar]
  30. Girshick, R. Fast R-CNN. In Proceedings of the 2015 IEEE International Conference on Computer Vision (ICCV), Santiago, Chile, 7–13 December 2015; pp. 1440–1448. [Google Scholar]
  31. Girshick, R.; Donahue, J.; Darrell, T.; Malik, J. Rich Feature Hierarchies for Accurate Object Detection and Semantic Segmentation. In Proceedings of the 2014 IEEE Conference on Computer Vision and Pattern Recognition, Columbus, OH, USA, 23–28 June 2014; pp. 580–587. [Google Scholar]
  32. Liu, Z.; Hu, J.; Weng, L.; Yang, Y. Rotated region based CNN for ship detection. In Proceedings of the 2017 IEEE International Conference on Image Processing (ICIP), Beijing, China, 17–20 September 2017; pp. 900–904. [Google Scholar]
  33. Li, L.; Zhou, Z.; Wang, B.; Miao, L.; Zong, H. A Novel CNN-Based Method for Accurate Ship Detection in HR Optical Remote Sensing Images via Rotated Bounding Box. IEEE Trans. Geosci. Remote Sens. 2020, 1–14. [Google Scholar] [CrossRef]
  34. Cucchiara, R.; Crana, C.; Piccardi, M.; Prati, A.; Sirotti, S. Improving shadow suppression in moving object detection with HSV color information. IEEE Intell. Transp. Syst. 2002, 334–339. [Google Scholar] [CrossRef]
  35. Shaik, K.B.; Ganesan, P.; Kalist, V.; Sathish, B.; Jenitha, J.M.M. Comparative Study of Skin Color Detection and Segmentation in HSV and YCbCr Color Space. Procedia Comput. Sci. 2015, 57, 41–48. [Google Scholar] [CrossRef] [Green Version]
  36. Liu, Z.; Yuan, L.; Weng, L.; Yang, Y. A High Resolution Optical Satellite Image Dataset for Ship Recognition and Some New Baselines. In Proceedings of the 6th International Conference on Pattern Recognition Applications and Methods, Porto, Portugal, 24–26 February 2017. [Google Scholar]
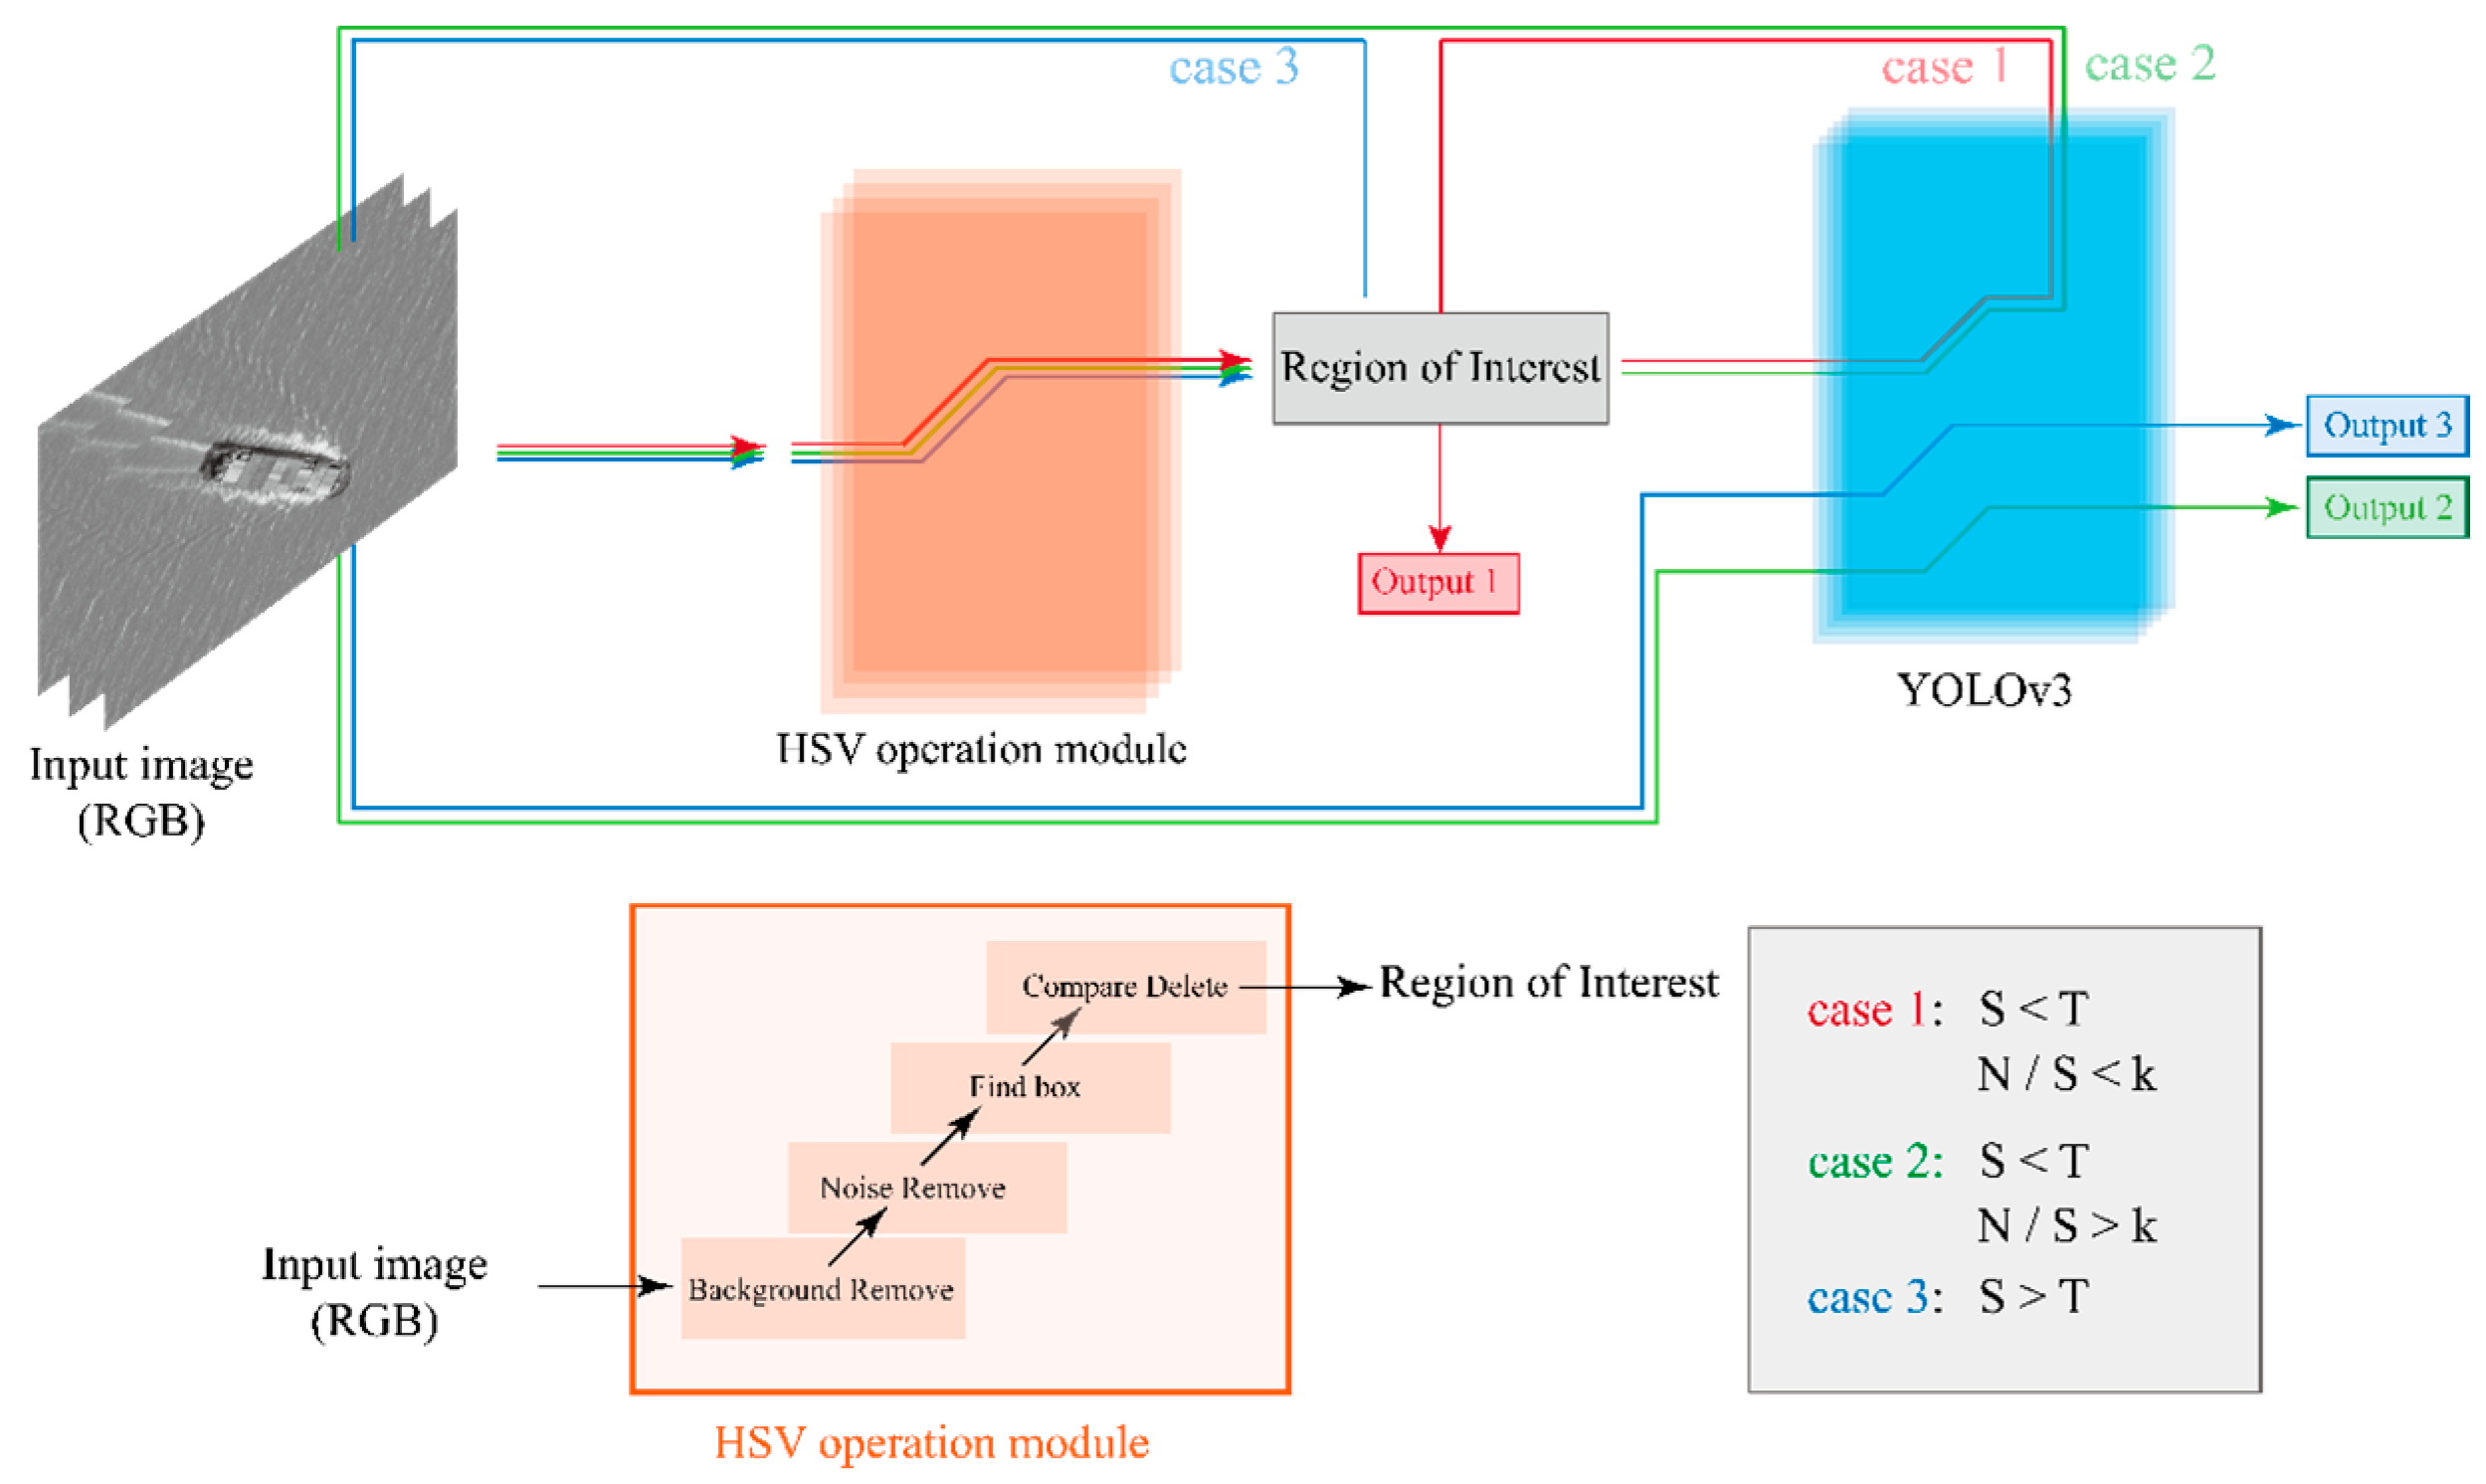
Figure 1. The architecture of the hue, saturation, value (HSV)-based-YOLO-tiny model.
Remotesensing 12 04192 g001
Figure 2. Edge detection of different vessels. (a) Input image. (b) Edge detection outputs.
Remotesensing 12 04192 g002
Figure 3. HSV color space model.
Remotesensing 12 04192 g003
Figure 4. Remote sensing image for each HSV channel. (a) Hue channel. (b) Value channel. (c) Saturation channel.
Remotesensing 12 04192 g004
Figure 5. Background suppression HSV differences. (a) HSV point values. (b) HSV point interval values. (c) HSV value interval removal.
Remotesensing 12 04192 g005
Figure 6. Background comparison of each vessel. HSV values, respectively: (a) H: 101 S: 136, V: 82, (b) H: 29, S: 61, V: 108, (c) H: 94, S: 149, V: 64, (d) H: 79, S: 84, V: 109, (e) H: 12, S: 43, V: 168, (f) H: 118, S: 121, V: 32.
Remotesensing 12 04192 g006
Figure 7. Auto-adaptive HSV background removal. (a) Original image. (b) Background removed image. (c) Target selection using background removed image.
Remotesensing 12 04192 g007
Figure 8. Noise bounding box after denoise operation. (a) Original image. (b) Background removed image. (c) Noise removed image. (d) Target selection using noise removed image.
Remotesensing 12 04192 g008
Figure 9. Joint distribution of height and width values of (a) residual noise boxes, and (b) true vessel boxes.
Remotesensing 12 04192 g009
Figure 10. Comparison of non-optimized and optimized detection boxes. (a) Optimization of image with one noise box. (b) Optimization of image with 54 noise boxes removed. (c) Optimization of image with 79 noise boxes removed.
Remotesensing 12 04192 g010
Figure 11. Different angles of the hull lead to different aspect ratios of the frame: (a) with aspect ratio greater than one, (b) where aspect ratio is smaller than one and (c) where aspect ratio is close to one.
Remotesensing 12 04192 g011
Figure 12. Degree of compression for each aspect ratio. Image compression of ship in (a) vertical position, (b) horizontal position, and (c) tilt position.
Remotesensing 12 04192 g012
Figure 13. Anti-distortion. (a) Input image. (b) Original target box. (c) Find center of the original target box. (d) Obtain the final box using the center of the original target box.
Remotesensing 12 04192 g013
Figure 14. Flowchart of the proposed network: (a) Case 1: Sum of the RoIs is larger than the upper limit. (b) Case 2: Sum of the RoIs is smaller than the upper limit, but the recognition rate is disqualified. (c) Case 3: Sum of the RoIs is more diminutive than the upper limit, and the recognition rate is qualified.
Remotesensing 12 04192 g014
Figure 15. Comparison of tiny and multiple object test results: (a) target not recognized, (b) inaccurate coordinates of the bounding box, (c) incorrect coordinates and class, and (d) inaccurate bounding box coordinates of multiple targets.
Remotesensing 12 04192 g015
Figure 16. Unresolved large object recognition.
Remotesensing 12 04192 g016
Figure 17. Computation times required for RoI extraction steps based on HSV differences. (a) Background removal step. (b) Noise removal step. (c) Target selection step. (d) Noise contrast step.
Remotesensing 12 04192 g017
Figure 18. The RoI extraction steps based on the HSV difference are compared with the YOLOv3 framework recognition time.
Remotesensing 12 04192 g018
Table 1. Overview of the HRSC2016 dataset.
PropertiesValue
Image resolution0.4 m–2 m
Image size300 × 300 − 1500 × 900
Total image1061 (with annotations) 610 (without annotations)
Publisher’s Note: MDPI stays neutral with regard to jurisdictional claims in published maps and institutional affiliations.