Abstract
The feasibility of combining remotely sensed land surface temperature data (LST) and an energy–water balance model for improving evapotranspiration estimates over time distributed in space in the Capitanata irrigation consortium is analysed. The energy–water balance FEST-EWB model (flash flood event-based spatially distributed rainfall–runoff transformation—energy–water balance model) computes continuously in time and is distributed in space soil moisture (SM) and evapotranspiration (ET) fluxes solving for a land surface temperature that closes the energy–water balance equations. The comparison between modelled and observed LST was used to calibrate the model soil parametres with a newly developed pixel to pixel calibration procedure. The effects of the calibration procedure were analysed against ground measures of soil moisture and evapotranspiration. The FEST-EWB model was run at 30 m of spatial resolution for the period between 2013 and 2018. Absolute errors of 2.5 °C were obtained for LST estimates against satellite data; while RMSE around 0.06 and 40 Wm−2 are found for ground measured soil moisture and latent heat flux, respectively.
1. Introduction
Distributed pixelwise knowledge of evapotranspiration (ET) and soil moisture (SM) is of extreme importance for a wide range of applications, especially for estimates of irrigation water needs in agricultural areas. However, their direct measurement at large scale is still not feasible; there exist several estimates from modelling and remote sensing data that are affected by intrinsic errors.
In the last 40 years, several satellites data from passive or active microwave sensors are available for the retrieval of superficial soil moisture (few centimetres) [1,2,3], which is nowadays used for a wide range of applications, even in agriculture water management [4]. However, problems can arise if the satellite images need to be used in conjunction with hydrological models for operational water management applications. In fact, SM estimates from passive sensors have a very low spatial resolution in between 25 and 50 km, which is too coarse for agricultural applications. Soil moisture pixel disaggregation [5,6] based on thermal infrared data is a way to improve the spatial resolution. The second concern is related to the retrieval of the soil water content of a few centimetres depending on the measurements’ wavelength, which is not congruent with the hydrological active soil for flood generation or plant root zone uptake. Moreover, SM estimates from active radars can be affected by problems linked to the saturation of the retrieval algorithms [7] and their ability to detect soil moisture over vegetated surfaces [8].
Satellite land surface temperature (LST) data have been widely used as the main input variable of energy balance models to compute evapotranspiration as the residual term of the energy budget [9,10,11,12,13]. These models have limitations related usually to no consideration of the water mass balance component, to the estimates of ET at satellite overpass time, which may also be influenced by the presence of clouds preventing its computation, and daily ET estimates based on net radiation weights. Another main issue is related to the satellite LST spatial resolution, mainly in between 1000 m for MODIS and 100 m for LANDSAT data, which is lower than Visible Near-Infrared bands. Hence, disaggregation techniques are needed to recover high spatial resolution information, which are able to capture the crop fields dimension [14,15].
Instead, hydrological models based on water and energy balances can provide estimates continuously in time of evapotranspiration and also of soil moisture distributed in space, using the satellite land surface temperature as a control variable [16]. These models can then overcome the limitations related to cloud coverage, typical of visible and thermal infrared satellite images, and to the instantaneous estimates at the time of the satellite overpass. Moreover, the distribution of irrigation volumes into the hydrological model is one of the most uncertain input variables [17,18,19]. In fact, most of the time irrigation over large areas, certainly in Italy where the paper case study is located, is an unknown quantity and, if available, only an integral value is known. In the last years, from the integration of satellite soil moisture data and hydrological modelling, few estimates of distributed irrigation volumes maps are available but still with some uncertainties [4,20,21]. The need for several soil hydraulic parametres, which play a relevant role in water and energy fluxes estimates, can pose another limitation to the application of these models. These parametres are usually available at low spatial resolution for large scales and defined using soil texture maps [22], but problems of representativeness arise due to the pixels’ heterogeneity. The calibration of these parametres may be achieved using satellite data, which allows a pixelwise tuning of these parametres, overcoming the traditional calibration based on a single multiplicative value retrieved from the comparison between observed and simulated ground discharge [23,24] or local ground measurements of soil moisture or evapotranspiration. This is feasible thanks to the distributed models’ structure, which allows a pixel by pixel control of water and energy fluxes [25] (e.g., soil moisture (SM), land surface temperature (LST) and evapotranspiration fluxes (ET)). Even though little effort has been made in this direction, some examples are available [26,27,28]. In particular, references [29,30,31] used remotely sensed LST for calibrating the parametres of the FEST-EWB energy–water balance model showing its potentiality with respect to the traditional calibration with ground river discharge data.
In this study, we further investigate the integration of satellite data and hydrological modelling trying to address the following research questions:
- (1)
- To what extent does the calibration based on LST allow a better representation of the hydrological fluxes (e.g., SM, ET) in terms of spatial and temporal resolutions?
- (2)
- How much do these improvements depend on the ability of the model to reproduce the satellite LST?
- (3)
- What is the effect of a precise irrigation distribution on the LST and ET estimates in highly cultivated and irrigated areas?
Hence, the main paper objective is to improve the accuracy of pixelwise evapotranspiration and soil moisture estimates using remotely sensed LST to calibrate soil and vegetation parametres of an energy–water balance model. Moreover, the effect of the irrigation distribution will also bex evaluated on the pixelwise correctness of land surface temperature estimates. The procedure is then validated against ground measurements of soil moisture and evapotranspiration.
The distributed energy–water balance model, flash-flood event-based spatially-distributed rainfall–runoff transformation—energy–water balance model [16,32], will be implemented over the Capitanata Irrigation Consortium (Italy) for the calibration period, from 2013 to 2016, and for the validation period, from 2017 to 2018.
With respect to previous studies [16,29,30,31], three important innovations are introduced: (1) irrigation volumes as input to the FEST-EWB model are distributed over the consortium area considering only the irrigated crops areas retrieved from satellite data, (2) validation of FEST-EWB results against several eddy covariance data in different crops fields (e.g., tomatoes, cabbage, asparagus, wheat), (3) a different study basin highly irrigated and cultivated with very dry summer seasons, which helps to prove the ability of the FEST-EWB model to be able to correctly simulate ET and SM fluxes over any region of the World, (4) accuracy of satellite downscaled LST for model calibration.
2. Case Study
The case study is the Capitanata Irrigation Consortium, specifically the Sud Fortore district, located in Southern Italy in the Puglia region (Figure 1) and delimited by the Apennines on the west and by the Gargano Promontory on the east side. It covers an area of about 65,000 hectares. Forty-five per cent of the total area is irrigated through the Consortium water distribution network (56,700 ha), while the remaining areas are irrigated with private wells [33]. The role of irrigation is crucial, in fact the mean irrigation volume in the irrigation season from April to October is of about 600 mm, while the seasonal rainfall amount is about 150 mm. Daily irrigation volumes measured in the main aqueduct are available from 2013 to 2018 with values between 2.1 and 6 10^7 m3 with a mean value of 4.6 10^7 m3.
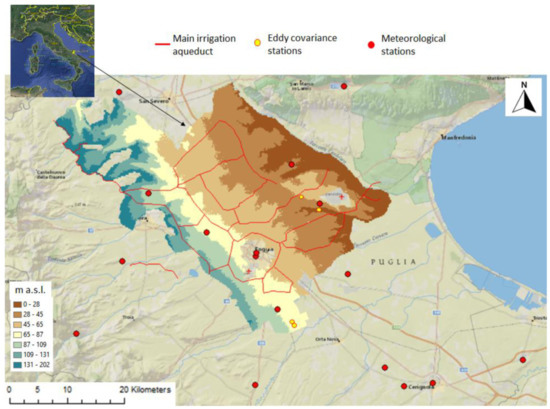
Figure 1.
Case study area location, digital elevation model (DEM), eddy covariance stations locations and the main irrigation aqueduct.
The Sud Fortore district is an intensive cultivation area, mainly devoted to durum wheat and tomatoes during the spring–summer season and fresh vegetables (sown in late summer and harvested October–February).
2.1. Meteorological Data
Meteorological data are available from 21 stations from ARPA-Regione Puglia and from the association Meteonetwork (Figure 1). Then three other stations managed by Politecnico di Milano and farm Agricola Guzzetti s.r.l. are also available. All the measured variables at the stations (precipitation, air temperature and relative humidity, incoming solar radiation and wind speed) are used as input to the model at 1-hour temporal resolution from 2013 to 2018.
2.2. Soil Data
Soil type information are available from Regione Puglia as a shape file, allowing the identification of only two main soil classes for all the analysed area of 55,000 ha: silty clay and gravel sandy soils. This coarse spatial resolution of the soil type data is then reflected in a coarse spatial resolution of the soil hydraulic parametres used as input of the FEST-EWB model. In fact, soil physical and hydraulic properties can have an extremely high variability over space (even in an area of 1 m2) and also time [34] and their correct quantification at high spatial resolution is essential for a correct estimate of the water balance components.
In particular, the soil is characterised by: soil hydraulic parametres, as the saturated hydraulic conductivity (ksat), the field capacity (fc), wilting point (wp), residual (θr) and saturated (θs) soil water content, Brooks–Corey index (BC), bubbling pressure (bp). These properties are defined for the two identified classes according to [22], assigning to each pixel of the analysed area its respective value. Another important parametre to define in the hydrological model is soil depth, which has been modelled as a single layer with an initial mean area value of 0.5 m, considering the predominant growing zone of fresh vegetable roots, relevant for the evapotranspiration process.
In Table 1, the mean and standard deviation (std dev) values of the main parametres are reported.

Table 1.
Soil hydraulic and vegetation parametre means and standard deviations over the whole Capitanata Consortium area from the literature values and after the calibration process with surface temperature data (LST).
The DEM shows a very flat area in the eastern part of the basin and a mountainous area in the west part (Figure 1).
2.3. Eddy Covariance Data
Two eddy covariance stations are installed in the Sud Fortore area. Each year from 2014, the stations are moved in neighbourhood fields to follow different crops cycles [35]:
- -
- Station-1 in an asparagus field with silty clay soil installed in November 2013 till September 2015, in a savoy cabbage field installed in September 2015 till April 2016, in a tomato field with sandy soil installed in May 2016 till October 2016.
- -
- Station-2 in a tomato field with sandy soil installed in May 2016 till October 2016, in a tomato field with sandy silt soil installed in April 2017 till September 2017.
These stations allow to measure primarily the latent (e.g., evapotranspiration) and sensible heat fluxes, but usually also the net radiation, ground heat flux, soil temperature and moisture.
In particular, soil moisture measurements are performed by TDR (Time Domain Reflectometre) soil moisture sensors (CS616, Campbell Sci, UT, USA) that were installed close to the eddy station at depths of 15 cm, considering the predominant growing zone of crops roots.
The turbulent fluxes (e.g., latent and sensible heat) are usually retrieved at high frequency and need to be post-processed applying a series of corrections well assessed in the scientific community [36]. The PEC software (Polimi Eddy Covariance) [37] is used in this study to post-process the turbulent raw data applying all the instrumental and physical corrections. Moreover, latent and sensible heat fluxes usually underestimate the available energy, leading to a non-closure of the energy balance. Hence, these fluxes are modified according to the procedure developed by [38], based on the preservation of the Bowen-ratio method to reach the energy budget closure.
Moreover, due to the intrinsic measurement technique of the eddy covariance station, the footprint (e.g., the source areas) of the measured vertical H and LE fluxes have been computed, following the two-dimensional footprint model of [39]:
where f is the footprint dimension, L is the Obukhov length, D and P are similarity constants for unstable, neutral and stable atmospheric conditions, x is the footprint in the upwind direction and y in the orthogonal one, k is von Karman’s constant, ⌠y is the standard deviation of the cross-wind direction, zm is the height of measurement and zu is a length scale. Hence, FEST-EWB estimates of latent and sensible heat fluxes are integrated as a weighted sum over the footprint area in order to be comparable to eddy covariance measures [39]:
where i is the position of a pixel in an image, F is the flux value in each pixel and is the average flux in the footprint area.
3. Methodology
The developed methodology improves FEST-EWB estimates of soil moisture and evapotranspiration and their spatial representativeness. The different followed steps are: (1) retrieval of high resolution satellite data of vegetation parametres and LST, (2) calibration of soil and vegetation parametres in each pixel of the area independently one from the other by comparing satellite observed and simulated land surface temperature from 2013 to 2016, (3) model validation at regional scale against LST from 2017 to 2018, and also at the local scale by comparison with measured fluxes from eddy covariance stations (e.g., soil moisture, evapotranspiration).
3.1. Satellite Data Retrieval
3.1.1. Land Surface Temperature
LST is computed with two different techniques: Single Channel (SC) and Split Window (SW) algorithms, which have been applied to Landsat-7 Enhanced Thematic Mapper Plus (ETM+) and Landsat-8 Thermal InfraRed Sensor (TIRS) respectively.
The SC algorithm structure has been extracted from [40]. LST for ETM+ is estimated using band 6, as:
where Tsen is the at-sensor brightness temperature, ε is the Land Surface Emissivity (LSE), bγ = c2/λ is equal to 1277 K, and , and are the so-called atmospheric functions, which are directly related to the upwelling and downwelling atmospheric radiances and the atmospheric transmissivity. Fitting these parametres against the total atmospheric water vapour content (w), the SC water vapour approximation is computed as a direct relation between parametres against w:
where matrix coefficients have been retrieved through direct relation between parametres against w. See more information in [15,41].
LST is retrieved from TIRS data following the algorithm developed by [41], which is based on the Split-Window (SW) technique:
where Ti and Tj are the at-sensor brightness temperatures at the SW bands i and j (in K), ε is the mean LSE, ε = 0.5 (εi + εj), Δε is the LSE difference, (Δε = εi − εj), w is the total atmospheric water vapor content (in g·cm−2) and a0 to a6 are the SW coefficients to be determined from simulated data. In the case of TIRS, LST has been estimated using band 10 and 11 with a0 = 16.40, a1 = 0.268, a2 = 1.378, a3 = 0.183, a4 = 54.30, a5 = −2.238 and a6 = −129.20. See [42,43] for more information.
For both algorithms, atmospheric water vapour is estimated by the computation of MOD07 product in MODTRAN radiative transfer code [44]. MOD07 is an atmospheric profile product measured by the MODIS sensor and available at Landsat pass time with a maximal time difference of 1:30 h.
The land surface emissivity (LSE) is computed using the NDVI Thresholds Method (NDVI-THM), originally developed by [45] and revised by [46] to estimate the LSE by the use of Fractional Vegetation Cover (FVC). The soil and vegetation emissivity values have been retrieved from [47,48].
A summary of formulas based on the NDVI-THM method for each Landsat thermal band is shown in Table 2.

Table 2.
Emissivity values for Landsat thermal bands using the Normalised Difference Vegetation Index Thresholds Method (NDVI-THM) method.
Downscaling Based on Nearest Neighbor Temperature Sharpening NNTS Methodology
Land surface temperature data are usually available at lower spatial resolution than data in the visible or near-infrared bands. Especially for agricultural applications, downscaling procedures need to be implemented to increase LST spatial resolution; hence, coarse thermal data are disaggregated to a finer resolution data providing sub-pixel temperatures, using sharpening or unmixing algorithms.
In this paper, LST has been downscaled with the Nearest Neighbor Temperature Sharpening (NNTS) proposed in [15]. The method is based on the local variant model proposed by [49] called Temperature Sharpening (TsHARP), which takes into account similar pixel properties and its distance, both over a sliding N×N window over an LST image using relationships of Normalised Difference Water Index (NDWI) and Normalised Difference Vegetation Index (NDVI) indices versus the LST.
Scheme of downscaling procedure is shown in Figure 2.
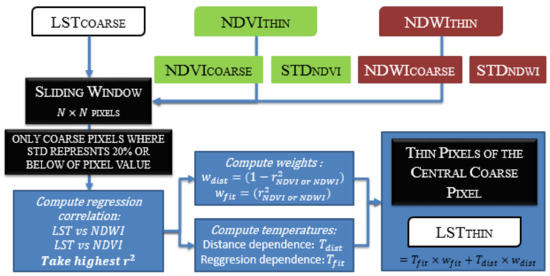
Figure 2.
Chart flow of the Nearest Neighbor Temperature Sharpening (NNTS) method for LST thin resolution pixel retrieval.
The method is based on the assignation of two weights: one, related to the direct relationship between LST and NDVI or NDWI (wfit); and the other one related to proximity of similar NDVI or NDWI pixels (wdist). When poor relation is found in the sliding window, the neighborhood gains more importance in the retrieval of LST thin pixels and when strong relation is obtained, the regression acquires more importance (see Figure 2). Once weights have been computed, temperatures associated to each weight must be estimated as:
where Tdist is the LST value retrieved in the function of pixel inverse distance (di) of sliding window (Equation (6)) and Tfit is the LST retrieved with the relation between the best spectra index fit (NDVI or NDWI highest correlation) versus the LST. If the correlation is poor (r2 < 0.6) Tfit is simply computed as the average value of LST coarse pixels included in the N×N window (Equation (7)).
The averages performed on Equation (6) and 1 in Equation (7) have been computed only for the coarse NDVI/NDWI pixels with values ±20% of thin pixel value to be estimated (similar spectra index pixels). Finally, thin pixel LST is obtained as:
3.1.2. Vegetation Parametres
FVC, as the fraction of the total pixel that is covered by canopy, is estimated from NDVI, according to [50]:
where NDVIs and NDVIv are representative values for bare soil and green vegetation, respectively. These values were estimated as 0.15 and 0.9, respectively. Values of bare soil (FVC = 0) and full vegetation cover (FVC = 1) have been obtained from the NDVI histograms retrieved during the period of maximal vegetation grow. As crop type does not vary a lot year over year, these soil and vegetation NDVI limits tend to be stable every year. FVC estimates are then employed to compute LSE and the Leaf Area Index (LAI).
The LAI is calculated as [51]:
where k(θ) is the light extinction coefficient, which is a measure of attenuation of radiation in the canopy for a given solar zenith angle (θ). This last depends on terrain geometry, solar declination and elevation angle, latitude and day of the year. In our case, it was estimated equal to 0.5.
3.1.3. Albedo
Albedo (α) is computed as the integration of at-surface reflectance across the shortwave spectrum in a different way for Landsat 7 (L7), Landsat 8 (L8) and Sentinel 2 (S2) because of the differences of the three sensors. As S2 and L8 bands have good agreement and high band value correlation [52], albedo was extracted in the same way for both sensors, following the relation proposed by [53]:
where b1 to b12 represents the surface reflectance for each band and, the coefficients, are representative of the surface solar radiation fraction within the spectral range for each band.
αS2 = 0.130b1 + 0.115b2 + 0.143b3 + 0.180b4 + 0.281b8a + 0.108b11 + 0.042b12
αL8 = 0.130b1 + 0.115b2 + 0.143b3 + 0.180b4 + 0.281b5 + 0.108b6 + 0.042b7
αL7 = 0.254b1 + 0.149b2 + 0.147b3 + 0.311b4 + 0.103b5 + 0.036b6
3.2. FEST-EWB Hydrological Modelling
FEST-EWB is a distributed hydrological model based on the energy–water balance system [16], which has been developed from the simple water balance FEST-WB [32], allowing to continuously compute all the main fluxes of the hydrological cycle distributed in space (e.g., evapotranspiration, soil moisture, infiltration, deep percolation, snow dynamic and flow routing). FEST-EWB has been tested in several case studies proving accurate estimates of soil moisture and evapotranspiration against ground measurements from eddy covariance stations [16] and also in agricultural basin scale in comparison with satellite data of LST at low spatial resolution (1 km) [54]. The FEST-EWB model has also been calibrated and validated at the basin scale by comparison with satellite LST and ground discharge data for the Po and the Yangtze river basins [29,30,31]. In this paper, new issues are analysed: (1) providing irrigation volumes as input to the model, which is distributed over space considering only the irrigated crops areas retrieved from satellite data, (2) using high spatial resolution LST data (30 m) for model calibration and validation.
The energy and mass balance equations are solved looking for the representative equilibrium temperature (RET), the temperature that closes the energy budget equation and that regulates the water and energy fluxes. The system of equations, which are linked through evapotranspiration, is the model core:
where is soil moisture over time (-), P is rainfall (mm h−1), R is runoff (mm h−1), PE is drainage (mm h−1), ET is evapotranspiration (mm h−1), z is the soil depth (m), Rn (Wm−2) is the net radiation, G (Wm−2) is the soil heat flux, H (Wm−2) is the sensible heat and LE (Wm−2) the latent heat flux, and ΔW/Δt (Wm−2) encloses the energy storage terms. The energy budget equation estimates all the energy fluxes as a function of RET. Then, the latent heat flux (e.g., evapotranspiration equal to less than two parametres) is used as input to the water balance equation besides the soil moisture at the previous time step, to compute the new soil moisture update.
The main input parametres to the model are: (1) meteorological forcings: air temperature and relative humidity, incoming shortwave radiation, wind speed and rainfall; (2) soil hydraulic parametres, as the saturated hydraulic conductivity (ksat), the field capacity (fc), wilting point (wp), residual (θr) and saturated (θs) soil water content, Brooks–Corey index (BC), bubbling pressure (bp) and (3) vegetation parametres, as leaf area index (LAI), vegetation fraction and minimum stomatal resistance (rsmin); and (4) the digital elevation model (DEM) and land use/cover map.
The simulations are performed continuously in time for the period between 2013 and 2018 at 1-hour temporal resolution and at 30 m spatial resolution. The FEST-EWB model is run in a simplified version without considering the runoff and groundwater flow, which are considered to be not relevant in the case study area. In fact, no major rivers are present in the case study area and the evapotranspiration and SM dynamic processes are not directly related to flow routing; while the groundwater table is not emerging and interacting with the superficial soil layer [33].
3.2.1. Irrigation Distribution into FEST-EWB
The Capitanata irrigation consortium, as previously described, is a highly irrigated area; hence irrigation water distribution needs to be included in the FEST-EWB model to correctly simulate the water and energy fluxes. However, only daily volumes data measured in the distribution aqueduct of Sud Fortore district are available for each of the analysed years. During the different years the volumes ranges over the whole season between 2.1 and 6 · 107 m3 with a mean value of 4.6 · 107 m3. These volumes are distributed over the consortium area as mm/day of irrigation considering only the possible irrigated crop areas. In fact, during spring and summer, the irrigated crops are mainly tomatoes and a few plurennial crops (asparagus, vineyard and olives trees); while during late summer and the beginning of autumn, besides the plurennial crops, the irrigated crops are all the vegetables. These possible irrigated crops areas are then identified using the satellite data of the vegetation fraction to discriminate between bare soil and vegetated areas (FVC > 0.05) and then the NDVI maps are employed to discriminate between tomatoes and wheat. In fact, between April and May NDVI values of a wheat field are much higher (0.7–0.9) than a tomato field with small plants (0.1–0.3) (Figure 3). In fact, wheat is not irrigated and it is harvested at the beginning of June. Hence, the cultivated areas that are irrigated are about 40 % of the whole area during summer. Similar results are obtained for all the four analysed years.
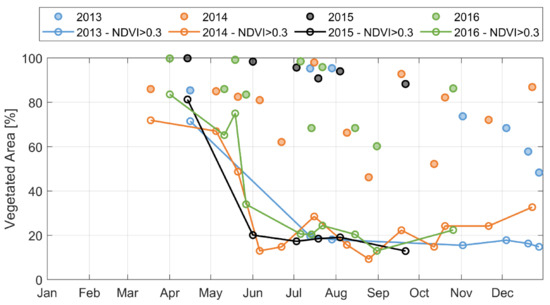
Figure 3.
Percentage of cultivated areas (dots in the figure) and only irrigated areas with NDVI > 0.3 (dots with lines in the figure) over the whole Consortium area for different days during the years from 2013 to 2016.
3.2.2. Calibration Methodology with Satellite Land Surface Temperature
The satellite-based calibration procedure is a physically based process where each single pixel is modified independently from the other; hence, in each pixel of the analysed domain the minimum of the pixel difference between modelled RET and satellite observed LST is searched over the period of calibration. In the case study analysed in this paper, the calibration period is in between 2013 and 2016, meaning that 22 satellite images are employed for calibrating more than 600,000 pixels (e.g., an area of about 55,000 ha at 30 m of spatial resolution). This procedure improves the traditional calibration based on local soil moisture or discharge data, which allows a global calibration of the parametres that are modified by a single factor over the entire basin [29]. The satellite-based technique applied to calibrate the FEST-EWB model guarantees a pixelwise improvement of soil moisture and evapotranspiration estimates.
The calibration is performed with a “trial and error” approach, where the soil hydraulic and vegetation parametres are tuned in each pixel independently from the other according to the mean pixel error for all the analysed images. A sensitivity analysis performed by [29,30] highlighted that the FEST-EWB parametres that have a relevant impact on the water fluxes and thus subjected to calibration are: soil hydraulic conductivity, soil depth, minimum stomatal resistance, soil evaporation resistance, aerodynamic resistance, Brooks–Corey index.
The tuning of the parametres is done step by step modifying each single parametre or combination of parametres until the difference between RET and LST is minimised. The initial run of the FEST-EWB model is performed using literature-suggested values (Section 2.2).
The parametres are then modified in each pixel independently from the other by a percentage that varies in each pixel according to the pixel by pixel difference values between RET and LST. This percentage is modified randomly in each simulation trial. The parametres are always modified keeping their values within their physical ranges of each soil class, as defined by [22]. The simulations are repeated with several combinations of parametre changes until a parametres’ values combination reaches the minimum pixel by pixel difference between RET and LST [55].
The calibration effectiveness of the FEST-EWB model will be evaluated using the common statistical indices: the mean bias error (MBE), the absolute mean bias error (AMBE), the root mean square error (RMSE).
Moreover, the improvement in spatial variability representation of RET, evapotranspiration and the connected water fluxes, and hence of irrigation spatial distribution, is analysed considering the mutual relationship between its values in each pixel through the spatial autocorrelation function (AC). AC allows an analysis of this relationship between different pixel values at a fixed distance:
where µ is the mean and σ2 is the LST variance in the stationary hypothesis, so that a stochastic process, of which the joint probability distribution does not change in time or space, is considered. X1 and X2 are the generic positions at a fixed distance d. The autocorrelation function has been studied under an isotropy hypothesis so that d is a function only of the distance between two points and not of the direction.
The goodness of spatial variability of FEST-EWB estimates is also evaluated studying their temporal relationships using the Pearson correlation analysis (r) (e.g., a measure of linear relationship between two variables [56]).
4. Satellite Estimates and Validation
Satellite data time series have been processed from year 2011 to 2018. Landsat 7 and Landsat 8 data are available every 16 days, while Sentinel 2 data every five days. Visible and Near-Infrared data have been obtained from Operational Land Imager (OLI) and Multispectral Instrument (MSI) sensors performing 16-day composite images for monitoring Albedo, FVC and LAI variables. All images have been downloaded from NASA and ESA servers and have been atmospherically corrected with 6S (Landsat-8 case) or Sen2Corr (Sentinel-2 case) software to estimate the bottom of atmosphere reflectance at a spatial resolution of 30 m. Thermal Infrared (TIR) data have also been extracted from TIRS and ETM+ to estimate the LST two times per 16 days. To meet the VNIR spatial resolution data, a sharpening process was performed to carry the resolution from 100 m (TIRS) and 60 m (ETM+) to 30m.
Figure 4 shows the behaviour of those variables for the period 2011–2016 averaged over the whole Capitanata area (e.g., case study area). The evolution shows FVC and LAI peaks on winter and until the beginning of April, which is expected, as this period is the most intensive cultivation time. Regarding the albedo, the highest values are during the May–June period, which coincides with the wheat ripening. Then of course, the LST peak values are between June and August.
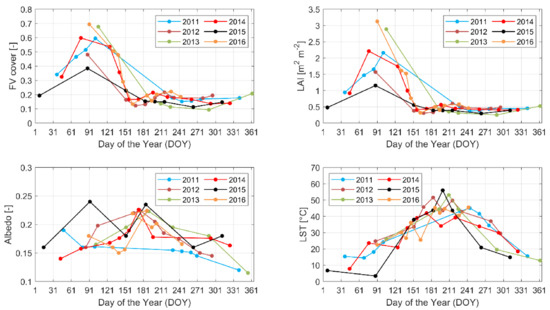
Figure 4.
Seasonal variability of satellite Fractional Vegetation Cover (FVC), leaf area index (LAI), albedo and LST averaged values over the whole Capitanata area.
Satellite Product Validation
The reliability of remotely sensed land surface temperature and albedo estimates was analysed by comparison with ground measures performed at the location of the two eddy covariance stations. The main obstacle in this type of analysis is given by the resolution of satellite imagery, which is lower than the punctual in situ data. The field radiometres have a footprint of about 2–5m2 according its instrument height. This implies the strong hypothesis that in situ data have the same homogenous values in the closer 30m, independently from the conditions of the closer area.
In Figure 5, the comparison between ground and satellite LST and albedo is reported. In the case of LST, MBE values are close to zero with an RMSE of 3.0 K and R2 0.88 and an RMSE of 2.0 K and a R2 of 0.92 for ETM+ and TIRS estimates, respectively. These values are in concordance with other validations performed in [15,52]. In the case of the accuracy of remote sensing albedo, the data were validated against a ground net radiometre. The assessment shows a good agreement with ground data with an MBE of −0.007 and RMSE of 0.033 with a R2 of 0.1.
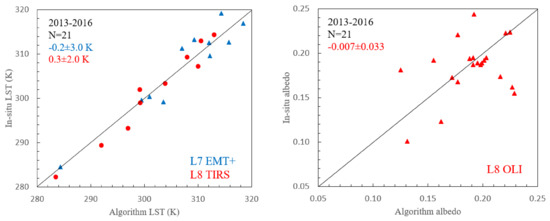
Figure 5.
Comparison between ground and satellite LST (left) and albedo (right) for Capitanata—2013–2016.
5. FEST-EWB Calibration and Validation
RET estimates from FEST-EWB are calibrated against the remotely sensed LST and the effect of the pixel by pixel calibration is also evaluated on the calibrated model parametres. The goodness of the spatial variability of the estimated RET, evapotranspiration and soil moisture are analysed with the AC function and the Pearson coefficient, also considering the effect of irrigation distribution in the model.
Finally, the FEST-EWB model is validated by comparing the simulated energy and water fluxes (LE, SM, H, Rn) and the land surface temperature with the observed ones at the eddy covariance stations location.
5.1. Calibration and Validation against Satellite LST
RET from FEST-EWB with the original parametres generally highly underestimates the remotely sensed LST, with a mean absolute difference pixel by pixel of 5 °C; while after the calibration procedure it is equal to 2.7 °C. In Figure 6a these differences pixel by pixel between LANDSAT LST and the calibrated and not calibrated RET are shown, highlighting the improvement in the LST estimates after the calibration. In Figure 6b, the mean aerial value over the whole Capitanata area of each LANDSAT image is reported along with the mean value of RET before and after the calibration procedure. The two LANDSAT sensors are also considered separately, and similar differences with FEST-EWB RET are obtained with L7 AMBE of 2.9 °C and L8 AMBE of 2.6 °C.
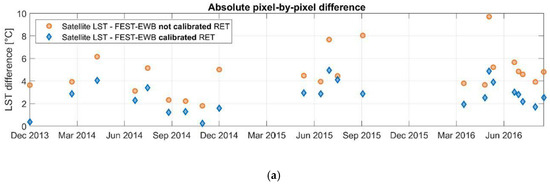
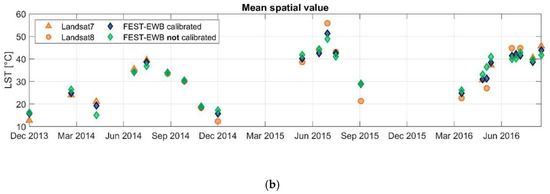
Figure 6.
During the calibration phase: (a) Mean absolute difference pixel by pixel between LANDSAT LST and RET before and after the calibration, (b) mean spatial value of LANDSAT 7 and 8 LST and RET before and after the calibration over the whole Capitanata case study area.
In Figure 7, four examples of RET and LST from LANDSAT8 are reported. For 18 September 2014 at 11:00 UTC+1, a mean area value of 33.5 °C and a standard deviation of 2.5 °C is obtained from satellite image while a mean value of 33.9 °C with a standard deviation of 4.1 °C for FEST-EWB model. For 3 July 2015 at 11:00 UTC+1, LANDSAT LST mean value reaches 43.9°C with a standard deviation of 3.5 °C while FEST-EWB RET reaches 42.3 and 5.2 °C, respectively; for 14 August 2015 the mean value of LST from LANDSAT is 43° C with a deviation of 3.2 °C and the mean value of RET is 42.3 °C with a deviation of 5.6 °C; and for 31 March 2016 at 11:00 UTC+1, LST from LANDSAT has a mean value of 22.6 °C and a deviation of 2.5°C, while RET from calibrated FEST-EWB has a mean value of 24.8 °C and a standard deviation of 4.4°C.
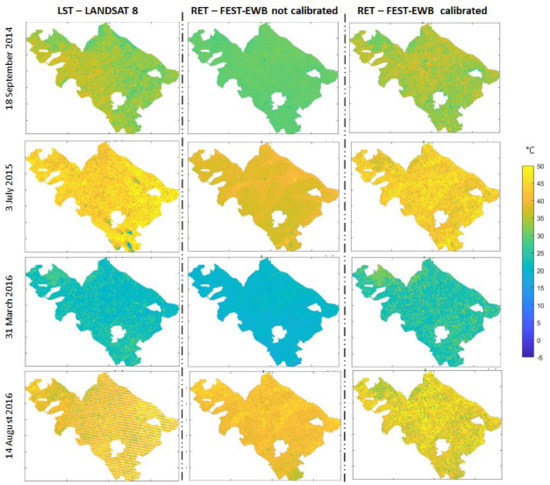
Figure 7.
Comparison between RET estimates before and after calibration and LST from LANDSAT for 18 September 2014, 3 July 2015, 14 August 2016 and 31 March 2016 at 11:00.
The model is then validated during 2017 and 2018 against L7 and L8 land surface temperature data. A mean absolute difference pixel by pixel of 3.5 °C is obtained, with similar values between the two LANDSAT sensors. In Figure 8 the mean spatial value of each LANDSAT LST image is reported along with the mean value of RET and also the mean absolute differences pixel by pixel confirming the goodness of the FEST-EWB model also in the validation phase.
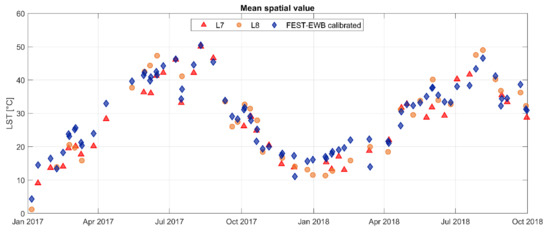
Figure 8.
During the validation phase, the mean spatial value of LANDSAT LST and RET after the calibration.
Soil Hydraulic and Vegetation Parametres
Applying the pixel by pixel calibration procedure, the parametres change their spatial variability increasing their variability. In Table 1, the values of the main parametres are reported before and after the calibration process showing an increase of the standard deviation values after the calibration.
In Figure 9, an example of soil hydraulic and vegetation parametres before and after the calibration is shown, reporting a general decrease in the saturated hydraulic conductivity, an increase in soil depth and a decrease in the minimum stomatal resistance with a global increase in the spatial standard deviation for all parametres: from 2.8*108 to 4.5*107 ms−1 for the saturated hydraulic conductivity, from 0.5 to 0.78 m for the soil depth and from 40.8 to 75 sm−1 for the minimum stomatal resistance.
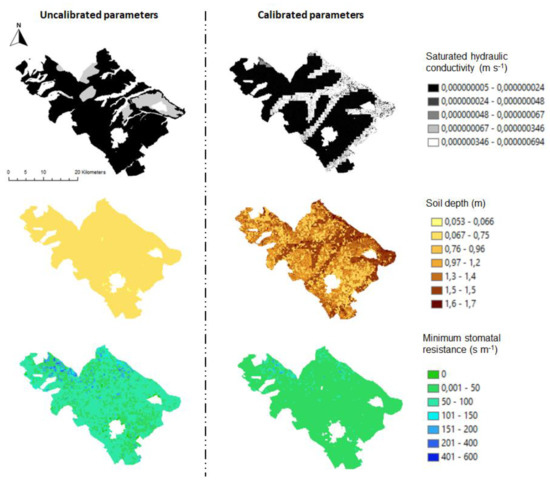
Figure 9.
Example of soil hydraulic and vegetation parametres before and after the calibration.
5.2. Spatial Variability and Correlation
AC functions are computed for all images to understand improvements in fluxes’ spatial variability representation. Figure 10 reports as an example the AC values for LST and NDVI from LANDSAT 8 images, and then for RET, SM and ET from FEST-EWB for a summer and a winter image: 08/07/2017 and 31/12/2017. The autocorrelation functions of satellite and modelled land surface temperature are almost the same till 600 m of distance, confirming the ability of FETS-EWB in reproducing satellite data. The AC values are equal to 1 at a 0 m distance and decreases till values near zero as the distance between the two pixels increases. The autocorrelation is computed till 600 m of distance, because at higher distances a scarce number of points couples are present. The obtained results confirm that the relationship between pixels at different LST is related to the fields dimensions, which are well delineated, and to the presence of bare soil or vegetation types at different growth stages and also to different soil moisture conditions. This is observable either for summer images and for winter images.
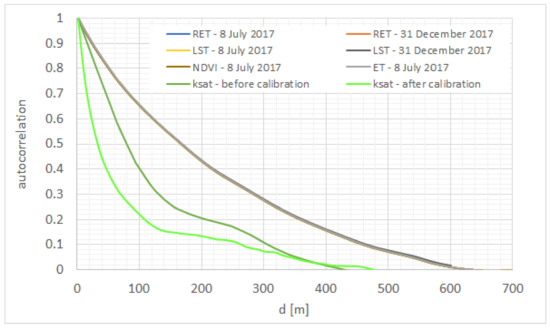
Figure 10.
Autocorrelation function values for: LST and NDVI from LANDSAT 8 images and for RET, SM and ET from FEST-EWB for the summer of 8 July 2017; LANSAT 8 LST and FEST-EWB RET for the winter image of 31 December 2017; saturate hydraulic conductivity ksat.
Similar autocorrelation functions are obtained for the modelled evapotranspiration which have a spatial variability correlated to the RET one.
In Figure 10, as an example, the autocorrelation function is also reported for the saturated hydraulic conductivity ksat, which has been previously calibrated. AC of ksat was less correlated than LST with lower values of AC, as expected. In fact, the soil structure variability is in general independent from the fields shapes and the available information are at a lower scale than the 30 m of resolution of the satellite data. After the pixel by pixel calibration procedure of the FEST-EWB model, the autocorrelation of ksat is correctly increased.
Pearson correlation analysis (r) is then computed among the satellite LST and NDVI with the modelled RET, soil moisture and evapotranspiration (Table 3). As expected high correlation is found between modelled variables, which derives from the interconnected water–energy balances equations. Hence, high correlation (0.75–0.6) is obtained between RET and ET and SM, respectively, during the winter season; while during the irrigated season (e.g., from April to September) the variables are negatively correlated, as expected. Similar correlations are also found between LST from remote sensing the modelled ET and SM, confirming the goodness of the FEST-EWB model in reproducing the LST temporal variability. The high spatial correlation between the modelled SM and respectively the LST and RET is shown in Figure 11 highlighting the ability of FEST-EWB model in also reproducing the spatial variability of LST, with a high positive correlation in almost all vegetated pixels between either modelled and observed LST with soil moisture during the winter season and instead a lower correlation during the summer season. This is mainly due to the main cultivated crops in the Capitanata consortium: the irrigated tomatoes and the non-irrigated wheat.

Table 3.
Pearson correlation coefficient between modelled and observed variables during the irrigation and no irrigation seasons.
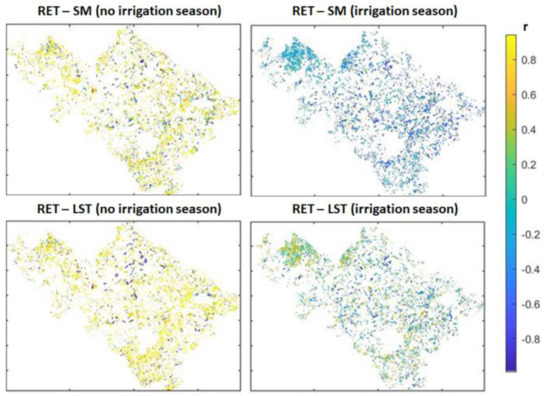
Figure 11.
Pearson correlation coefficient between modelled SM and RET and satellite LST during 2017 for the irrigation and no irrigation seasons.
5.3. Effect of Irrigation Distribution on RET Estimates
The goodness of the irrigation distribution methodology into the FEST-EWB model is evaluated considering the differences between the measured and modelled LST patterns. Besides the simulation performed for the calibration and validation (irrigation distributed considering FVC and NDVI), two other simulations are performed with: (1) a uniform distribution of irrigation over the whole consortium area, (2) a distribution of irrigation considering only the irrigated areas with a vegetation fraction higher than 0.05. The averaged spatial value of the pixel by pixel difference between satellite LST and RET is computed over the irrigation season also for these two irrigation distribution methodologies and values of 4.7 and 4°C are obtained. The AMBE obtained for the original selected irrigation distribution based on both FVC and NDVI was of 2.7 °C. In Table 4, the AMBE values are reported considering vegetated and not vegetated areas separately: in not vegetated areas similar values are obtained for the three configurations (AMBE about 3 °C); while for the vegetated areas high differences among the irrigation configurations are obtained (AMBE from 7.9 to 2.5 °C).

Table 4.
Absolute mean bias error (AMBE) between satellite LST images and RET estimated with different techniques of irrigation distribution, considering only the images during the irrigation season.
As an example in Figure 12, RET estimates with the different irrigation distribution techniques into the FEST-EWB model are compared with satellite LST for the date of 9 July 2017. It is clearly visible that the uniform distribution of irrigation produces an RET estimate higher than the observed one of 7.5 °C, which is due to the less amount of water distributed in the crop pixels; while if irrigation water is distributed only over the vegetated fields and even more considering NDVI, in the RET maps the cooler fields are clearly visible as in the satellite map with a mean difference of 5.7 and 2.6 °C, respectively.
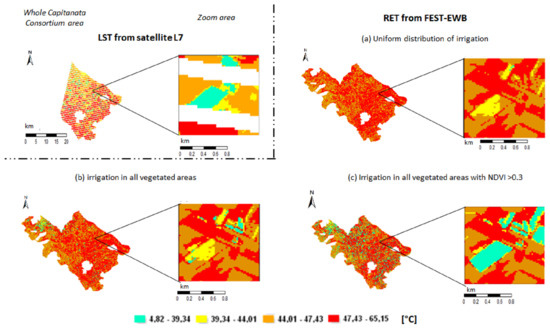
Figure 12.
Comparison among LST and RET estimated with different distribution techniques of irrigation water into the FEST-EWB model for 9 July 2017.
5.4. Evapotranspiration and Energy Fluxes Validation at Local Scale
The calibration of FEST-EWB parametres lead to changes not only in the RET estimates, but also in all the connected variables through the energy–water balance system, as SM and ET. Hence, FEST-EWB is validated by comparing the estimated energy and water fluxes with the measured fluxes at the eddy covariance stations. A general good agreement is observable confirming the ability of the model in producing high spatial resolution and continuous in time estimates of evapotranspiration and soil moisture. In Table 5, the results are shown for the six considered fields (e.g., crop seasons), reporting the RMSE and, the angular coefficient and the coefficient of determination of the regression line between observed and modelled variables.

Table 5.
Errors between ground observed and modelled fluxes after the calibration procedure for all the validation stations.
For the plurennial crop asparagus field, a good agreement is obtained for LE with a coefficient of determination equal to 0.85 and an RMSE of 33.3 W m−2, while for H a R2 of 0.76 and an RMSE of 32.7 W m−2 are obtained. Soil moisture is also correctly reproduced with an RMSE of 0.04. For the cabbage field, an overall good agreement is also obtained not only for LST, but also for the other water and energy fluxes. In particular, soil moisture is correctly reproduced with an RMSE of 0.1, showing the SM increments in correspondence of irrigations and rainfall. The agreement is confirmed for LE by a coefficient of determination equal to 0.7 and an RMSE of 49 W m−2, while for H with R2 of 0.8 and RMSE of 78 W m−2. The final error between observed and simulated cumulated ET is equal to 2.7 %. In the tomato field with sandy soil for the 2016 season, the FEST-EWB model is able to correctly reproduce SM with an RMSE of 0.07. The good performances are also obtained for all the energy fluxes with an RMSE around 50 W m−2 except LE with an RMSE of 43 W m−2. Similar results are also obtained for the tomato field with silty clay soil for the same 2016 season. In fact, an RMSE of 0.06 is obtained for SM, while for LST 3.5 °C and for H and LE 75 and 40 W m−2, respectively. In the same field, for the 2017 tomatoes season, an overall good agreement is obtained not only for LST with the angular coefficient of one and a coefficient of determination of one, but also on the other water and energy fluxes. In particular, SM has an RMSE of 0.04, showing the SM increments in correspondence of irrigations and rainfall. The agreement is confirmed for LE by an angular coefficient equal to 0.92 and an RMSE of 43 W m−2, while for H with m of 0.8 and RMSE of 65 W m−2. Finally, the results for the wheat field confirm the ability of the FEST-EWB model to correctly reproduce SM with an RMSE of 0.04 even in the winter season, LST has an RMSE of 4.1 °C, and LE and H an RMSE of 48 and 67 W m−2, respectively.
In Figure 13, the scatterplots between ground measured LST and the calibrated RET are reported for all the stations. A good agreement is found for the asparagus field with an angular coefficient (m) of the linear regression forced through the origin between RET (x) and LST (y) equal to 0.94 and a R2 of 0.96; m is equal to 1 for the cabbage field with R2 of 0.9; an m of 0.98 is obtained for the tomato field with silty clay soil (R2 = 0.83) while a lower m value of 0.90 is obtained in the tomato field with sandy soil (R2 = 0.90). Both tomato fields in 2017 and the wheat field have an angular coefficient of 1, while R2 is of 1 and 0.4, respectively. The lowest agreement obtained in the wheat field may be due to the different time period of the wheat crop season (from October to May) with respect to the other summer crops and irrigation volumes.
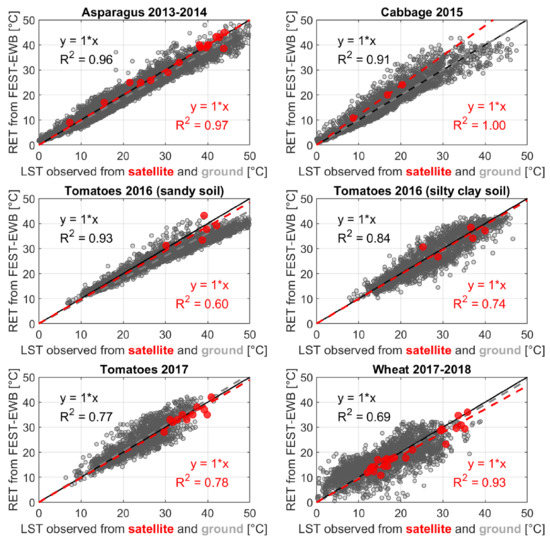
Figure 13.
Scatterplots between RET and ground or satellite LST for asparagus 2013–2014, cabbage 2015, the two tomato fields for 2016 and 2017 and wheat 2017–2018 crop seasons.
Similar results are obtained from the comparison between RET and LST from satellite data in the station pixel with m and R2 around 0.9–1, except for the two tomato fields during 2016 with R2 around 0.4. This may be due to the very few numbers of available satellite images.
The comparison between observed and simulated soil moisture before and after the calibration is shown in Figure 14 for all the validation stations. Similar results are reported for all the fields confirming the ability of FEST-EWB, after its calibration with LST data, to correctly reproduce the observed SM in different soil types, period of the year and irrigation volumes. In fact, cabbage, wheat and partially the asparagus fields are winter crops while tomatoes are summer ones. Similar errors are obtained with RMSE between 0.1 and 0.04.
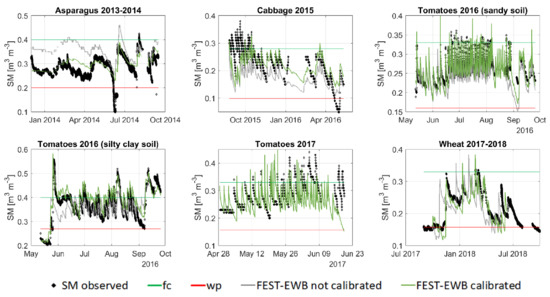
Figure 14.
Comparison between observed and modelled soil moisture at the eddy covariance sites.
The model is also able to follow the soil type variability being capable of correctly reproducing observed SM in sandy soils and as well as silty clay soils for the same crop (tomatoes) with very low RMSE differences (between 0.04 and 0.07).
In Figure 15, observed and modelled latent heat fluxes are shown for all the analysed fields, showing a good correspondence. Ground data have some missing values due to the correction procedures applied to eddy covariance data (paragraph 2.4). As observed for SM, FEST-EWB is able to correctly reproduce LE under different irrigation regimes and season of the year. In particular, low LE is correctly modelled during winter time for the cabbage and wheat fields, while very high LE is computed during the summer period for the tomato fields.
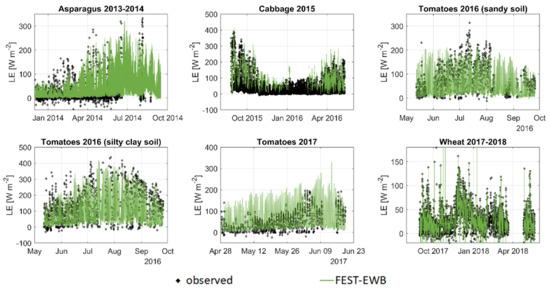
Figure 15.
Comparison between observed and modelled latent heat flux at the eddy covariance sites.
Moreover, if the cumulated fluxes are computed, the final error between observed and simulated cumulated ET ranges between 10% to 1.9%.
6. Discussion
Evapotranspiration estimates computed in this paper with the FEST-EWB model are continuous in time (hourly time step) and at high spatial resolution (30 m). These estimates are at the same resolutions of the ET estimates provided by several remotely-sensed single and two source models which compute evapotranspiration as the residual term of the energy balance equation [9,10,11,12,13]. However, these last models are not able to provide high temporal resolution estimates, but only an instantaneous ET information at satellite overpass time, which may also be influenced by the presence of clouds preventing its computation, or a daily ET estimate based on net radiation weights.
The model has been calibrated against remote sensing data of land surface temperature, which have been preferred over soil moisture information. These seem to be more recommended to calibrate model soil parametres, thanks to their direct estimate of soil moisture and the fact that they do not suffer from cloud coverage problems, but remote sensing SM are usually limited by the few centimetres of soil depth representativeness, the complex reading geometry, the low sensitivity to soil water content above a significant threshold [57], and a low spatial resolution for passive microwave [3,58].
Furthermore, LST image uncertainty should also be taken into account, especially over non-homogeneous areas, where the spatial resolution, scan angle of view of the sensor and emissivity should be considered. For example, a mean bias with ground data equal to 2 K has been evaluated for MODIS land surface temperature data [59], which is comparable to modelled RET errors.
Regarding the FEST-EWB soil parametres, a possible uncertainty on an ET estimate may arise from the soil depth definition, which is a difficult variable to determine. The FEST-EWB model is a single-layer model and in the analysed case study the initial mean area value has been set to 0.5 m, considering the predominant growing zone of fresh vegetable roots, which is relevant for the evapotranspiration process. However, the soil depth is a fixed value over the year, which may lead to an overestimation of evapotranspiration during bare soil period.
Different calibration and optimisation techniques, based on different objective functions as RMSE or the Nash–Sutcliffe criterion and on different minimisation techniques with a local gradient or a global method, may modify the accuracy of the model calibration. The FEST-EWB model has been calibrated with a non-automatic “trial and error” procedure, which is based on several repetitions until the errors do not change anymore but only congruent parametres combinations are tested within their physical values. The topic of model calibration may highlight the unresolved issue of equifinality, which is embedded in all hydrological models [60].
Another remarkable point of attention is the distribution of irrigation into the hydrological model, which is one of the most uncertain input variables in hydrological models. In fact, irrigation plays a crucial role in the Capitanata case study with a relevant impact on soil moisture and in an indirect way on evapotranspiration and on land surface temperature. In this work, irrigation has been distributed according to the satellite FVC and NDVI, thanks to the knowledge of the crop types, showing a better agreement of LST estimates than not considering them, in terms of absolute values and also temporal and spatial variability.
7. Conclusions
The paper showed the feasibility of the combined advantage of satellite data and distributed hydrological model for improving water resources assessment, in particular evapotranspiration estimates at high temporal and spatial resolution. In particular, satellite LST are employed for a pixel by pixel control of water and energy fluxes accuracy into FEST-EWB model. The modelled RET has been calibrated against LST data from LANDSAT data providing a good agreement in the calibration phase (AMBE 2.6 °C) and a slight increase in the validation phase (AMBE 3.5 °C). No relevant differences are found in the RET calibration if L7 or L8 data are used, confirming also the goodness of the retrieval and downscaling algorithms, which are verified against ground data, returning an RMSE of 0.3 ±2 K.
The model has then been validated against soil moisture and evapotranspiration data measured by six ground eddy covariance stations. Similar results to LST are reported for all the fields confirming the ability of FEST-EWB after its calibration with LST data, to correctly reproduce the observed SM and ET in different soil and crop types, period of the year and irrigation importance. An RMSE between 0.1 and 0.04 is found for soil moisture, and an RMSE around 40 Wm-2 for latent heat flux.
Author Contributions
Conceptualization, M.M., C.C., L.N. and J.S.; methodology, M.M., C.C. and J.S.; formal analysis, C.C. and D.S.J.; writing—original draft preparation, C.C. and D.S.J.; project administration, M.M. and J.S. All authors have read and agreed to the published version of the manuscript.
Funding
This work was supported by SIM project “Smart Irrigation from Soil Moisture Forecast Using Satellite and Hydro-Meteorological Modelling” (http://www.sim.polimi.it), funded by the Ministry for Education, University and Research of Italy and of Spain within the EU Water Joint Programming Initiative. This work is also part of the RET-SIF project from ERANETMED European network, funded by the Ministry for Education, University and Research of Italy and of Spain.
Acknowledgments
A special thanks to Stefano and Paolo Guzzetti, Luigi Corbari from Guzzetti Farm, and to Giuseppe de Filippo e Pellegrino Riccio of Futuragri Farm for hosting the field measurements and for helping in maintaining the eddy covariance stations. The authors thank Giuseppe Milleo and Alessandro Ceppi for helping with field stations management, and also Marco Stanganelli, Lorenzo de Pedrini, Giulia Airoldi, Stefano Citterio and Giada Restuccia who helped during their master thesis. Thanks to Nicola Paciolla, who helped in visualizing some results. We thank the anonymous reviewers for improving the paper.
Conflicts of Interest
The authors declare no conflict of interest
References
- Bitar, A.; Leroux, D.; Kerr, Y.H.; Merlin, O.; Richaume, P.; Sahoo, A.; Wood, E.F. Evaluation of SMOS Soil Moisture Products over Continental U.S. Using the SCAN/SNOTEL Network. IEEE Trans. Geosci. Remote Sens. 2012, 50, 1572–1586. [Google Scholar] [CrossRef]
- Kerr, Y.H.; Waldteufel, P.; Wigneron, J.P.; Martinuzzi, J.M.; Font, J.; Berger, M. Soil moisture retrieval from space: The Soil Moisture and Ocean Salinity (SMOS) mission. IEEE Trans. Geosci. Remote Sens. 2001, 39, 1729–1735. [Google Scholar] [CrossRef]
- Wagner, W.; Scipal, K. Large-Scale Soil Moisture Mapping in Western Africa using the ERS Scatterometer. IEEE Trans. Geosci. Remote Sens. 2000, 38, 1777–1782. [Google Scholar] [CrossRef]
- Brocca, L.; Tarpanelli, A.; Filippucci, P.; Dorigo, W.; Zaussinger, F.; Gruber, A.; Fernández-Prieto, D. How much water is used for irrigation? A new approach exploiting coarse resolution satellite soil moisture products. Int. J. Appl. Earth Obs. 2018, 73, 752–766. [Google Scholar] [CrossRef]
- Merlin, O.; Al Bitar, A.; Walker, J.P.; Kerr, Y. An improved algorithm for disaggregating microwave-derived soil moisture based on red near-infrared and thermal-infrared data. Remote Sens. Environ. 2010, 114, 2305–2316. [Google Scholar] [CrossRef]
- Merlin, O.; Rudiger, C.; Al Bitar, A.; Richaume, P.; Walker, J.P.; Kerr, Y. Disaggregation of SMOS Soil Moisture in Southeastern Australia. IEEE Trans. Geosci. Remote Sens. 2012, 50. [Google Scholar] [CrossRef]
- Giacomelli, A.; Bacchiega, U.; Troch, P.A.; Mancini, M. Evaluation of surface soil moisture distribution by means of SAR remote sensing techniques and conceptual hydrological modelling. J. Hydrol. 1995, 166, 445–459. [Google Scholar] [CrossRef]
- Bindlish, R.; Barros, A.P. Parameterization of vegetation backscatter in radar-based, soil moisture estimation. Remote Sens. Environ. 2001, 76, 130–137. [Google Scholar] [CrossRef]
- Bastiaanssen, W.; Noordman, E.; Pelgrum, H.; Davids, G.; Thoreson, B.; Allen, R. SEBAL Model with Remotely Sensed Data to Improve Water-Resources Management under Actual Field Conditions. J. Irrig. Drain. Eng. 2005, 131, 85–93. [Google Scholar] [CrossRef]
- Anderson, M.C.; Norman, J.M.; Diak, G.R.; Kustas, W.P.; Mecikalski, J.R. A two-source time-integrated model for estimating surface fluxes using thermal infrared remote sensing. Remote Sens. Environ. 1997, 60, 195–216. [Google Scholar] [CrossRef]
- Roerink, G.J.; Bastiaanssen, W.G.M.; Chambouleyron, J.; Menenti, M. Relating Crop Water Consumption to Irrigation Water Supply by Remote Sensing. Water Resour. Manag. 1997, 11, 445–465. [Google Scholar] [CrossRef]
- Norman, J.M.; Kustas, W.P.; Humes, K.S. A two-source approach for estimating soil and vegetation energy fluxes from observations of directional radiometric surface temperature. Agric. For. Meteorol. 1995, 77, 263–293. [Google Scholar] [CrossRef]
- Su, Z. The Surface Energy Balance System (SEBS) for estimation of turbulent heat fluxes. Hydrol. Earth Syst. Sc. 2002, 6, 85–100. [Google Scholar] [CrossRef]
- Kustas, W.P.; Norman, J.M.; Anderson, M.C.; French, A.N. Estimating Subpixel Surface Temperatures and Energy Fluxes from the Vegetation Index-Radiometric Temperature Relationship. Remote Sens. Environ. 2003, 85, 429–440. [Google Scholar] [CrossRef]
- Skokovic, D. Calibration and Validation of Thermal Infrared Remote Sensing Sensors and Land/Sea Surface Temperature Algorithms over the Iberian Peninsula. Ph.D. Thesis, Universidad de Valencia, Valencia, Spain, 2017. [Google Scholar]
- Corbari, C.; Ravazzani, G.; Mancini, M. A distributed thermodynamic model for energy and mass balance computation: FEST-EWB. Hydrol. Process. 2011, 25, 1443–1452. [Google Scholar] [CrossRef]
- Alter, R.E.; Im, E.S.; Eltahir, E.A. Rainfall consistently enhanced around the Gezira Scheme in East Africa due to irrigation. Nat. Geosci. 2015, 8, 763–767. [Google Scholar] [CrossRef]
- Döll, P.; Siebert, S. Global modeling of irrigation water requirements. Water Resour. Res. 2002, 38, 8.1–8.10. [Google Scholar] [CrossRef]
- Wada, Y.; Wisser, D.; Bierkens, M.F.P. Global modeling of withdrawal, allocation and consumptive use of surface water and groundwater resources. Earth Syst. Dyn. 2014, 5, 15–40. [Google Scholar] [CrossRef]
- Escorihuela, M.J.; Quintana-Segui, P. Comparison of remote sensing and simulated soil moisture datasets in Mediterranean landscapes. Remote Sens. Environ. 2016, 180, 99–114. [Google Scholar] [CrossRef]
- Kumar, S.V.; Peters-Lidard, C.D.; Santanello, J.A.; Reichle, R.H.; Draper, C.S.; Koster, R.D. Evaluating the utility of satellite soil moisture retrievals over irrigated areas and the ability of land data assimilation methods to correct for unmodeled processes. Hydrol. Earth Syst. Sci. 2015, 19, 4463–4478. [Google Scholar] [CrossRef]
- Rawls, W.J.; Brakensiek, D.L. Prediction of Soil water properties for hydrologic modelling. In Watershed Management in the Eighties; ASCE: Reston, VA, USA, 1985; pp. 293–299. [Google Scholar]
- Rabuffetti, D.; Ravazzani, G.; Corbari, C.; Mancini, M. Verification of operational Quantitative Discharge Forecast (QDF) for a regional warning system-the AMPHORE case studies in the upper Po River. Nat. Hazards Earth Syst. Sci. 2008, 8, 1–13. [Google Scholar] [CrossRef]
- Westerberg, I.K.; Sikorska-Senoner, A.E.; Viviroli, D.; Vis, M.; Seibert, J. Hydrological model calibration with uncertain discharge data. Hydrol. Scien. J. 2020. [Google Scholar] [CrossRef]
- Refsgaard, J.C. Parameterisation, calibration and validation of distributed hydrological models. J. Hydrol. 1997, 198, 69–97. [Google Scholar] [CrossRef]
- Immerzeel, W.W.; Droogers, P. Calibration of a distributed hydrological model based on satellite evapotranspiration. J. Hydrol. 2008, 349, 411–424. [Google Scholar] [CrossRef]
- Crow, W.T.; Wood, E.F.; Pan, M. Multi-objective calibration of land surface model evapotranspiration predictions using streamflow observations and spaceborne surface radiometric temperature retrievals. J. Geophys. Res. Atmos. 2003, 108. [Google Scholar] [CrossRef]
- Gutmann, E.D.; Small, E.E. A method for the determination of the hydraulic properties of soil from MODIS surface temperature for use in land surface models. Water Resour. Res. 2010, 46, W06520. [Google Scholar] [CrossRef]
- Corbari, C.; Mancini, M. Calibration and validation of a distributed energy water balance model using satellite data of land surface temperature and ground discharge measurements. J. Hydrometeorol. 2014, 15, 376–392. [Google Scholar] [CrossRef]
- Corbari, C.; Mancini, M.; Li, J.; Su, Z. Can satellite land surface temperature data be used similarly to ground discharge measurements for distributed hydrological model calibration? Hydrol. Sci. J. 2015, 60, 202–217. [Google Scholar] [CrossRef]
- Corbari, C.; Huber, C.; Yesou, H.; Huang, Y.; Su, Z.; Mancini, M. Multi-Satellite Data of Land Surface Temperature, Lakes Area, and Water Level for Hydrological Model Calibration and Validation in the Yangtze River Basin. Water 2019, 11, 2621. [Google Scholar] [CrossRef]
- Mancini, M. La Modellazione Distribuita della Risposta Idrologica: Effetti della Variabilità Spaziale e della Scala di Rappresentazione del Fenomeno Dell’assorbimento. Ph.D. Thesis, Politecnico di Milano, Milan, Italy, 1990. (In Italian). [Google Scholar]
- INEA. Stato Dell’irrigazione in Puglia; Istituto Nazionale di Economia Agraria: Roma, Italy, 2018; p. 244. (In Italian) [Google Scholar]
- Alletto, L.; Coquet, Y. Temporal and spatial variability of soil bulk density and near-saturated hydraulic conductivity under two contrasted tillage management systems. Geoderma 2009, 152, 85–94. [Google Scholar] [CrossRef]
- Mancini, M.; Corbari, C.; Ceppi, A.; Lombardi, G.; Charfi, I.B.; Paciolla, N.; Ravazzani, G.; Cerri, L.; Sobrino, J.; Skokovic, D.; et al. The SIM operative system for parsimonious irrigation. Agric. Water Manag. 2020. Submitted. [Google Scholar]
- Foken, T.; Wimmer, F.; Mauder, M.; Thomas, C.; Liebethal, C. Some aspects of the energy balance closure problem. Atmos. Chem. Phys. 2006, 6, 4395–4402. [Google Scholar] [CrossRef]
- Corbari, C.; Masseroni, D.; Mancini, M. Effetto delle correzioni dei dati misurati da stazioni eddy covariance sulla stima dei flussi evapotraspirativi. Ital. J. Agrometeorol. 2012, 1, 35–51. [Google Scholar]
- Twine, T.E.; Kustas, W.P.; Norman, J.M. Correcting eddy-covariance flux underestimates over a grassland. Agri. For. Meteorol. 2000, 103, 279–300. [Google Scholar] [CrossRef]
- Detto, M.; Montaldo, N.; Albertson, J.D.; Mancini, M.; Katul, G. Soil moisture and vegetation controls on evapotranspiration in a heterogeneous Mediterranean ecosystem on Sardinia, Italy. Water Resour. Res. 2006, 42, W08419. [Google Scholar] [CrossRef]
- Jiménez-Muñoz, J.C.; Cristóbal, J.; Sobrino, J.A.; Sòria, G.; Ninyerola, M.; Pons, X. Revision of the Single-Channel Algorithm for Land Surface Temperature Retrieval From Landsat Thermal-Infrared Data. IEEE Trans. Geosci. Remote Sens. 2009, 47, 339–349. [Google Scholar] [CrossRef]
- Skokovic, D.; Sobrino, J.A.; Jimenez-Munoz, J.C. Vicarious Calibration of the Landsat 7 Thermal Infrared Band and LST Algorithm Validation of the ETM+ Instrument Using Three Global Atmospheric Profiles. IEEE Trans. Geosci. Remote Sens. 2017, 55, 1804–1811. [Google Scholar] [CrossRef]
- Sobrino, J.A.; Li, Z.L.; Stoll, M.P.; Becker, F. Multi-channel and multi-angle algorithms for estimating sea and land surface temperature with ATSR data. Int. J. Remote Sens. 1996, 17, 2089–2114. [Google Scholar] [CrossRef]
- Jimenez-Munoz, J.C.; Sobrino, J.A.; Skokovic, D.; Mattar, C.; Cristobal, J. Land surface temperature retrieval methods from landsat-8 thermal infrared sensor data. IEEE Geosci. Remote Sens. Lett. 2014, 11, 1840–1843. [Google Scholar] [CrossRef]
- Beck, A.; Anderson, G.P.; Acharya, P.K.; Chetwynd, J.H.; Bernstein, L.S.; Shettle, E.P.; Matthew, M.W.; Adler-Golden, S.M. MODTRAN4 User’s Manual; Air Force Research Laboratory: Hanscom AFB, MA, USA, 1999. [Google Scholar]
- Sobrino, J.A.; Raissouni, N.; Li, Z.-L. A comparative study of land surface emissivity retrieval from NOAA data. Remote Sens. Environ. 2001, 75, 256–266. [Google Scholar] [CrossRef]
- Sobrino, J.A.; Jiménez-Muñoz, J.C.; Sòria, G.; Gómez, M.; Ortiz, A.; Romaguera, M.; Zaragoza, M.; Julien, Y.; Cuenca, J.; Atitar, M.; et al. Thermal remote sensing in the framework of the SEN2FLEX project: Field measurements, airborne data and applications. Int. J. Remote Sens. 2008, 29, 4961–4991. [Google Scholar] [CrossRef]
- Sobrino, J.A.; Jimenez-Muoz, J.C.; Soria, G.; Romaguera, M.; Guanter, L.; Moreno, J.; Plaza, A.; Martinez, P. Land surface emissivity retrieval from different VNIR and TIR sensors. IEEE Trans. Geosci. Remote Sens. 2008, 46, 316–327. [Google Scholar] [CrossRef]
- Skokovic, D.; Sobrino, J.A.; Jiménez Muñoz, J.C.; Soria, G.; Julien, Y.; Mattar, C.; Cristóbal, J. Calibration and validation of land surface temperature for Landsat8-TIRS sensor TIRS Landsat-8 characteristics. Land Prod. Valid. Evol. ESA/ESRIN 2014, 27. Available online: https://earth.esa.int/documents/700255/2126408/ESA_Lpve_Sobrino_2014a.pdf (accessed on 10 November 2020).
- Jeganathan, C.; Hamm, N.A.S.; Mukherjee, S.; Atkinson, P.M.; Raju, P.L.N.; Dadhwal, V.K. Evaluating a thermal image sharpening model over a mixed agricultural landscape in India. Int. J. Appl Earth Obs. 2011, 13, 178–191. [Google Scholar] [CrossRef]
- Gutman, G.; Ignatov, A. The derivation of the green vegetation fraction from NOAA/AVHRR data for use in numerical weather prediction models. Int. J. Remote Sens. 1998, 19, 1533–1543. [Google Scholar] [CrossRef]
- Choudhury, B.J. Relationships between vegetation indices, radiation absorption, and net photosynthesis evaluated by a sensitivity analysis. Remote Sens. Environ. 1987, 22, 209–233. [Google Scholar] [CrossRef]
- Barsi, J.A.; Alhammoud, B.; Czapla-Myers, J.; Gascon, F.; Haque, M.O.; Kaewmanee, M.; Markham, B.L. Sentinel-2A MSI and Landsat-8 OLI radiometric cross comparison over desert sites. Eur. J. Remote Sens. 2018, 51, 822–837. [Google Scholar] [CrossRef]
- Gerace, A.; Montanaro, M. Derivation and validation of the stray light correction algorithm for the thermal infrared sensor onboard Landsat 8. Remote Sens. Environ. 2017, 191, 246–257. [Google Scholar] [CrossRef]
- Corbari, C.; Sobrino, J.A.; Mancini, M.; Hidalgo, V. Mass and energy flux estimates at different spatial resolutions in a heterogeneous area through a distributed energy–water balance model and remote-sensing data. Int. J. Remote Sens. 2013, 34, 3208–3230. [Google Scholar] [CrossRef]
- Brath, A.; Montanari, A.; Moretti, G. Assessing the effect on flood frequency of land use change via hydrological simulation (with uncertainty). J. Hydrol. 2006, 324, 141–153. [Google Scholar] [CrossRef]
- Helsel, D.R.; Hirsch, R.M. Statistical Methods in Water Resources. Techniques of Water Resources Investigations; U.S. Geological Survey: Reston, VA, USA, 2002; Book 4; Chapter A3; p. 522.
- Mancini, M.; Hoeben, R.; Troch, P. Multifrequency radar observation of bare surface soil moisture content: A laboratory experiment. Water Resour. Res. 1999, 35, 1827–1838. [Google Scholar] [CrossRef]
- Kerr, Y.H.; Al-Yaari, A.; Rodriguez-Fernandez, N.; Parrens, M.; Molero, B.; Leroux, D.; Bircher, S.; Mahmoodi, A.; Mialon, A.; Richaume, P. Overview of SMOS performance in terms of global soil moisture monitoring after six years in operation. Remote Sens. Environ. 2016, 180, 40–63. [Google Scholar] [CrossRef]
- Sobrino, J.A.; Kharraz, J.E.; Li, Z.-L. Surface temperature and water vapour retrieval from MODIS data. Int. J. Remote Sens. 2003, 24, 5161–5182. [Google Scholar] [CrossRef]
- Beven, K. Prophesy, reality and uncertainty in distributed hydrological modelling. Adv. Water Resour. 1993, 16, 41–51. [Google Scholar] [CrossRef]
Publisher’s Note: MDPI stays neutral with regard to jurisdictional claims in published maps and institutional affiliations. |
© 2020 by the authors. Licensee MDPI, Basel, Switzerland. This article is an open access article distributed under the terms and conditions of the Creative Commons Attribution (CC BY) license (http://creativecommons.org/licenses/by/4.0/).