Abstract
PM severely affects human health. Remotely sensed (RS) data can be used to estimate PM concentrations and population exposure, and therefore to explain acute respiratory disorders. However, available global PM concentration forecast products derived from models assimilating RS data have not yet been exploited to generate early alerts for respiratory problems in Brazil. We investigated the feasibility of building such an early warning system. For this, PM concentrations on a 4-day horizon forecast were provided by the Copernicus Atmosphere Monitoring Service (CAMS) and compared with the number of severe acute respiratory disease (SARD) cases. Confounding effects of the meteorological conditions were considered by selecting the best linear regression models in terms of Akaike Information Criterion (AIC), with meteorological features and their two-way interactions as explanatory variables and PM concentrations and SARD cases, taken separately, as response variables. Pearson and Spearman correlation coefficients were then computed between the residuals of the models for PM concentration and SARD cases. The results show a clear tendency to positive correlations between PM and SARD in all regions of Brazil but the South one, with Spearman’s correlation coefficient reaching 0.52 (p < 0.01). Positive significant correlations were also found in the South region by previously correcting the effects of viral infections on the SARD case dynamics. The possibility of using CAMS global PM concentration forecast products to build an early warning system for pollution-related effects on human health in Brazil was therefore established. Further investigations should be performed to determine alert threshold(s) and possibly build combined risk indicators involving other risk factors for human respiratory diseases. This is of particular interest in Brazil, where the COVID-19 pandemic and biomass burning are occurring concomitantly, to help minimize the effects of PM emissions and implement mitigation actions within populations.
1. Introduction
Solid and liquid particles in the air come from a variety of sources: transport, residential heating, agriculture, biomass burning (including forest fires), etc. Both long- and short-term exposures to particulate matter (PM) of diameter less than 10 m (PM) and 2.5 m (PM) affect human health.
Based on the converging results of a large body of epidemiological and laboratory studies, PM (PM and PM) from outdoor air pollution was classified by the International Agency for Research on Cancer (IARC) as carcinogenic to humans (IARC Group 1) [1]. Among the PM, PM is considered to be the most dangerous due to its capacity to penetrate deeper into the pulmonary alveoli and the blood. In 2017, long-term exposure to ambient PM was estimated to contribute to 2.9 million deaths (deaths that likely occurred earlier than would be expected in the absence of PM pollution) and to a loss of 83 million disability-adjusted life-years (DALYs, defined as the sum of the years of life lost from early deaths plus the years lived with a disability) worldwide, making PM responsible for 5.2% of all deaths and 3.3% of all DALYs in the world [2]. For this estimation, the study considered ischemic heart disease, cerebrovascular disease (ischemic stroke and hemorrhagic stroke), lung cancer, chronic obstructive pulmonary disease (COPD), and lower-respiratory infections (in particular, pneumonia) and included type 2 diabetes for the first time [3].
In Brazil, 99.8 million people live in metropolitan regions (Regiões Metropolitanas), Integrated economic development regions (Regiões integradas de desenvolvimento econômico), or urban agglomerations with more than 1 million people [4]. This population is potentially exposed to urban pollutants emitted notably by vehicles—vehicular emission is the main contributor to urban air pollution [5]—and industry, and to emissions due to biomass burning, which can be transported to the urban areas [5,6]. Andreão et al. [5] studied four metropolitan areas (MAs) of the Southeast region of Brazil (São Paulo, Rio de Janeiro, Belo Horizonte, and Vitória), corresponding to 102 cities. They estimated the daily PM concentration levels and the number of deaths that would be avoided by satisfying the World Health Organization (WHO) Air Quality Guidelines (AQGs) [7]. Among these 102 cities, 67 presented mean annual PM concentrations above the WHO guideline (10 g m). The total number of all-cause avoidable premature deaths was estimated as 32,000 ± 5300 for the four MAs, representing 6.5% of all-cause deaths. Regarding the consequences of short-term exposure to PM, 3436 ± 2340 hospitalizations of children from one to nine years were attributable to daily mean PM concentrations exceeding the WHO AQG (25 g m daily mean). For circulatory system diseases in the elderly, this number reached 9850 ± 3950 for the four MAs.
More than 10 million people are directly exposed to high levels of pollutants resulting from deforestation and agricultural fires over the Brazilian Amazon [8]. During the biomass burning season, high concentrations of PM (PM including PM) have been measured (ranging from 400 to 600 g m) [9], exceeding the WHO AQG by 8 to 12 times [7,8]. Alves et al. [8] demonstrated that exposure to such emissions causes toxic effects at the molecular and cellular levels in human lung cells, especially through the transportation of retene. However, exposure to PM produced by fires in the Amazon also induces acute health disorders: a 10 g m increase in the exposure levels to PM was associated to 2.9% and 2.6% increases in the number of ambulatory receptions of children for respiratory diseases on the sixth and seventh days following the exposure, respectively [10].
In the municipality of Alta Floresta, Mato Grosso State, Brazil, the effects of the short-term exposure to PM on the lung function of 309 school children between 6 to 15 years were studied during a 4-month period [11]. The mean 24-h PM concentration ranged from 6.39 to 99.91 g m (overall mean: 24.35 g m). A statistically significant reduction in peak expiratory flow (PEF) measures, ranging from 0.26 L min (95% CI: 0.49, 0.04) to 0.38 L min (95% CI: 0.71, 0.04), was observed with an increase in the PM concentration of 10 g m.
In May 2020, the Brazilian space agency (Instituto Nacional de Pesquisa Espacial (INPE)) warned of a forest fire season in 2020 in Brazil (which occurs between August and November, with interannual variations between June and December and with a peak in September [12]) that could overcome that of 2019 in terms of burned surface due to high deforestation rates, dry climate conditions, and the weakening of the control of illegal activities, especially by the Brazilian institute of the environment and renewable natural resources (Instituto Brasileiro do meio ambiente e dos recursos naturais renováveis, IBAMA) [13]. In such context, several Brazilian scientific institutions alerted to the impact of the concomitant biomass burning and the COVID-19 epidemic on population health and health service overcrowding [13,14]. Such a potential disastrous situation is also reported in the United States [15].
Particular matter acts on viral infections in different ways: it is associated with the aggravation or acute events of existing pathologies, especially in children and the elderly; it increases patient susceptibility and immune response to virus infection; and it may enhance exposure, acting as a virus carrier [16,17]. Specific relationships between the exposure to atmospheric PM and COVID-19 have already been noted [18,19,20,21,22]. Andrée et al. [21] considered various confounding factors: population density, health preconditions, and spatial distribution of cases to account for the spread of the disease. They concluded that PM is a strong predictor of the number of confirmed COVID-19 cases in the Netherlands, and that an increase in PM concentration from 10 to 12 g m resulted in a 100% increase in the COVID-19 case number during the study period. By adjusting for 20 county-level covariates in the United States, Wu et al. [22] established that an increase of 1 g.m in the 17-year long-term average PM was significantly associated with a 11% (95% CI, 6 to 17%) increase in the COVID-19 mortality.
The above-mentioned effects of PM on health, as well as the current situation with the COVID-19 pandemic and biomass burning in Brazil, necessitate the creation of an early alert system for the Brazilian population about exposure to PM, to implement urgent actions to reduce emissions, and to mitigate the effects of pollution on health.
The WHO defined AQGs for PM and PM concentrations that “reflect the concentrations at which increased mortality responses due to PM air pollution are expected based on current scientific findings” [7]: daily average exposure of 25 and 50 g m and annual mean exposure of 10 and 20 g m for PM and PM, respectively. The WHO AQG for long-term PM concentration exposure (10 g m) was chosen here as it corresponds to the lower end of the range over which significant effects on mortality due to cardiopulmonary diseases and lung cancer (considering 95% confidence interval) were observed, making use of American Cancer Society’s data [7,23]. The AQG for daily PM concentration exposure (25 g m) is related to the annual mean value of 10 g m, considering the observed relationship between the 99th percentile of the distribution of the daily mean levels and the annual mean [7]. Eventually, AQGs for PM were defined by considering a PM/PM ratio of 0.5, reflecting both the typical and lower values observed for urban areas in developing and developed countries, respectively [7].
However, according to the WHO, given that no evidence exists of a safe level of exposure to PM [24] and that significant interindividual variability can be observed in responses to PM exposure, “the standard-setting process needs to aim at achieving the lowest concentrations possible in the context of local constraints, capabilities and public health priorities” [7]. Thus, countries define their own standards, sometimes supposed to evolve toward increasingly stringent regulations, according to the concentration level observed in their territory and their measurement and control capacities. In Brazil, resolution CONAMA 491/2018, which states the air quality standards, was approved by the National Environmental Council (Conselho Nacional de Meio Ambiente, CONAMA) in 2018. The resolution plans to adopt the WHO air quality reference values in four stages. For PM, the intermediate reference values for the daily average concentration will thus be 60 (currently in application), 50, and 37 g m, before reaching the final reference value of 25 g m. For the annual average concentration, these values are 20, 17, 15, and 10 g m [25]. However, no timetable has been defined for the adoption of the next reference values [25,26]. In addition, countries can define alert thresholds. They relate to high concentration levels over short periods of time and are normally associated with actions to reduce the main emissions to protect the health of the population (restriction of the movement of certain vehicles and/or of certain industrial activities, etc.). In Brazil, levels of attention, alert, and emergency are defined as follows for PM: 125, 210, and 250 g m, respectively. The technical evaluation of the CONAMA 491/2018 resolution by the Brazilian Health and Sustainability Institute (Instituto Saúde e Sustentabilidade, ISS) reported that these values are very high (among the highest worldwide) and will rarely be reached to force immediate measures to protect the population [25].
Monitoring PM in Brazil would require a sufficiently dense and distributed network of PM measurements over the whole territory. However, in 2017, “only 24 Brazilian cities (0.43% of all cities) monitored fine particles with 50 monitoring stations, all located in the southeastern region” [5]. An inventory of the capabilities of air quality monitoring performed in 2018 [25] showed that air pollution was monitored in only 7 of 27 Brazilian states (26%). Among the 319 measurement stations in operation in the country, 298 (93.4%) were present in the Southeast region, 13 (4.1%) in the South, and 4 (1.3%) in the Center West and Northeast regions [25]. Only 186 (58.3%) and 65 (20.4%) stations were able to measure PM and PM concentrations, respectively. No station appeared to be present in the North region (Amazon), which is the region among those most affected by forest fires over the last few years [27].
Satellite-derived PM concentration and composition estimates were proven to be related to respiratory disorders (children’s lung function) [28]. This demonstrates the possibility of overcoming the limits due to the discontinuity of the information provided by ground stations, both in space and time, using remotely sensed products. However, in South America, this data source “is still not much employed in scientific research, and for air quality decision-makers, probably because of access, processing, validation, and interpreting difficulties” [29]. Andreão et al. [5] estimated daily PM concentrations at a 5 km spatial resolution using the weather research and forecasting model coupled with chemistry (WRF-Chem) and remotely sensed data including land use/cover and fire detection. Wu et al. [22] estimated PM concentrations across the United States on a 0.01 × 0.01-degree grid, using a model taking into account remotely sensed aerosol optical depth (AOD), model-based information, and ground-based observations. However, to the best of our knowledge, already available and easily accessible global PM concentration forecast products have not been associated with respiratory disorders to develop an early warning system. PM concentration forecasts provided on regional or global scales by models are of particular interest. Several products already exist, like those provided by the United States National Aeronautics and Space Administration (NASA) Global Monitoring and Assimilation Service (GMAO), the Copernicus Atmosphere Monitoring Service (CAMS) in Europe, or the INPE in Brazil.
In this context, we aimed to evaluate the feasibility of using available global PM concentration forecast data to construct an early warning system for PM exposure and its health consequences in Brazil.
2. Materials and Methods
2.1. Data
2.1.1. Cases of Severe Acute Respiratory Diseases (SARD)
Retrospective data on hospitalizations due to acute respiratory disorders were provided by the InfoGripe surveillance system developed by the Group of Analytical Methods in Epidemiological Surveillance (MAVE, Scientific computation program of the Oswaldo Cruz Foundation, PROCC/Fiocruz, School of Applied Mathematics of the Getúlio Vargas Foundation, EMAp/FGV) and the Influenza Working Group of the Health Surveillance Secretariat of the Ministry of Health (GT-Influenza, SVS, MS) [30] (see Appendix A for all data sources and main features). The InfoGripe system aims to monitor and generate alerts regarding hospitalizations using the Brazilian Notifiable Diseases Information System (Sistema de Informação de Agravos de Notificação, SINAN). It strictly includes severe acute respiratory syndromes (SARS), i.e., viral respiratory diseases caused by coronaviruses, as well as other viral infection types such as seasonal influenza. It also gathers cases satisfying a less restrictive definition: all hospitalization or death cases due to respiratory disorders, without necessarily including the presence of fever or other symptoms related to a viral infection. This broadest definition of the cases in the InfoGripe system was considered in this study and is referred to as severe acute respiratory diseases (SARD) hereafter.
The InfoGripe system provides data by epidemiological week, Brazilian state, age groups, and sex. The total number of positive and negative tests for viral infections are also provided, as well as test results for the main viruses (influenza A, influenza B, SARS-CoV-2, respiratory syncytial virus (RSV), parainfluenza 1, parainfluenza 2, parainfluenza 3, and adenovirus).
Data for the 2015–2019 period were downloaded from the InfoGripe online repository [31]. As the COVID-19 pandemic is considerably affecting the Brazilian health system as a whole and SARD surveillance in particular [14], cases for 2020 were excluded from the study to avoid biases in the analysis.
2.1.2. PM Concentrations
Data on PM concentrations were all provided by the Copernicus Atmosphere Monitoring Service (CAMS). CAMS forecasting is based on the Integrated Forecasting System (IFS) developed by the European Centre for Medium-Range Weather Forecasts (ECMWF). Predictions of atmosphere composition (including PM) are derived from an ensemble modeling approach, which assimilates satellite observations. In particular, the Moderate Resolution Imaging Radiospectrometer (MODIS) instrument aboard the Terra and Aqua satellites (NASA) and the Polar Multi-sensor Aerosol product (PMAp) provided by the MetOp satellites (European Organisation for the Exploitation of Meteorological Satellites, EUMETSAT, and European Space Agency (ESA)) are used to estimate the AOD (https://atmosphere.copernicus.eu/satellite-observations) [32]. MODIS active fire products are also assimilated in the IFS via the Global Fire Assimilation System (GFAS), which estimates emissions from biomass burning [32]. In this study, three different products were used: CAMS reanalysis data, archived CAMS near real-time (NRT) forecast data, and current CAMS NRT forecast data. As detailed below, each product was associated with a specific question.
The CAMS reanalysis data, provided on an ∼80 km spatial resolution regular grid, were used to describe and discuss the surface PM concentration distributions from 2015 to 2019 in Brazil. The CAMS reanalysis system retrospectively applies the last improvements in the models and observations to provide reference and homogeneous data on atmosphere composition over a long past period [33], whereas NRT forecasts are impacted at each IFS upgrade implementation (Figure 1). Reanalysis data were accessed using the Copernicus Atmosphere Data Store.
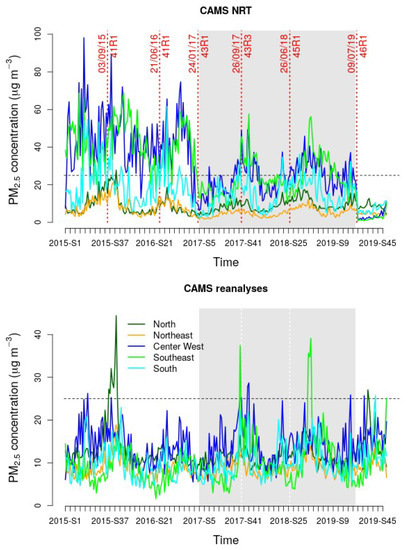
Figure 1.
Weekly mean PM concentrations as a function of the Brazilian regions from 2015 to 2019, provided by the near real time (NRT) forecast archive (4-day forecast horizon) of the Copernicus Atmosphere Monitoring Service (CAMS) (top) and by the CAMS reanalysis database (bottom). Dates of the implementation and the names of successive Integrated Forecasting System (IFS) versions are represented by the vertical red dashed lines. The 41R1 cycle was maintained on 21 June 2016 but with a horizontal resolution change, from ∼80 to ∼40 km. The grey background corresponds to the period considered in this study for investigating the feasibility of an early warning system.
For the retrospective analysis intended to demonstrate the feasibility of an early warning system, by comparing PM concentration forecasts with SARD cases, the archived surface forecasts of PM concentrations were considered (archived CAMS NRT). For each day, the CAMS NRT dataset consists of a 0.4 degree (∼40 km) spatial resolution forecast on a regular grid every 3 h from 00:00 UTC on the current day to 24:00 UTC on the fifth day after. Time steps are coded 0, 3, 6, …, 120 in the data repository. To study the feasibility of an early warning system development, the maximum prediction horizon of the daily mean PM concentrations in Brazil was considered. In other words, the PM concentration values considered for day d were those provided by CAMS NRT on the fourth previous day (d − 4) at the horizon d + 4. In practice, the average of the forecasts from time steps 75 to 96 of the prediction performed four days before was computed (these time steps correspond to the 00:00 UTC–3 to 24:00 UTC–3 interval) to obtain the daily mean PM concentrations in accordance with the main Brazilian time zone (UTC–3). Daily values were then averaged by epidemiological week for comparison with the weekly SARD data.
The successive IFS upgrades significantly impacted the CAMS NRT forecast results and had to be considered to define the study period. This was particularly visible after the implementation of the 43R1 and 46R1 IFS versions on 24 January (4th epidemiological week), 2017, and on 9 July (28th epidemiological week), 2019, respectively (Figure 1). These two dates correspond to significant drops in PM concentration forecast amplitudes in Brazil, especially for the Center West, Southeast, and South regions. During the period between the 5th epidemiological week of 2017 (29 January 2017) and the 27th epidemiological week of 2019 (6 July 2019) (represented by the grey background in Figure 1), CAMS NRT time-series predictions were stationary for all regions: An augmented Dickey–Fuller stationarity test resulted in p-values ≤ 0.01 for all the regions but the Southeast one (p-value = 0.013). During this period, the dynamics of the PM concentrations provided by CAMS NRT and CAMS reanalysis appeared similar. Given that, and despite the CAMS NRT predictions seeming to overestimate the PM concentrations in comparison with the CAMS reanalysis and the newest version of the IFS, this period (from 29 January 2017 to 6 July 2019, i.e., from the 5th epidemiological week of 2017 to the 27th epidemiological week of 2019) was considered in the following to investigate the feasibility of an early warning system.
From the perspective of early warning system development, the forecasts (4-day horizon) of the last IFS cycle (46R1) were considered for one entire year from 10 July 2019 to 9 July 2020. This allowed us to simulate and discuss the effects of the different warning thresholds determined by the CONAMA 491/2018 resolution, considering the IFS version currently in use.
Eventually, an operational early warning system would be based on the PM concentration forecasts for the current and subsequent days. CAMS provides access to such forecasts on a regular ∼40 km spatial resolution grid and for every hour from 03:00 UTM on the present day to 24:00 UTM on the fifth following day. Datasets are accessible through a File Transfer Protocol (FTP) service. From such data, daily mean PM concentrations can be calculated for the four next days from the present one, considering the main Brazilian time zone (UTC–3). This dataset was not strictly included in the analysis but was used to provide an example of indicators upon which an early warning system could be based (Appendix B).
2.1.3. Meteorological Data
Particulate matter concentrations are partly related to meteorological conditions. Notably, precipitation tends to leach suspended particles from the atmosphere; temperature impacts both the emissions of PM and chemical processes in the atmosphere. CAMS includes a meteorological forecasting model to predict the atmosphere composition. On the other hand, extremely low or high air humidity and/or temperature can directly and indirectly induce respiratory problems. For instance, low air humidity can induce respiratory tract irritations and thus increase susceptibility to viral infections; low temperatures tend to increase virus lifetime. As such, meteorological conditions need be considered as possible confounding factors when studying the relationships between PM concentrations and SARD cases.
Precipitation, temperature, and relative humidity were considered in this study. Measurements recorded by the automatic meteorological stations of the National meteorological institute of Brazil (INMET) were downloaded from the Institute’s website. They included minimum and maximum hourly temperature and relative humidity, as well as hourly rainfall. The daily minimum (maximum) was computed for the minimum (maximum) temperature and relative humidity, as well as the daily accumulated rainfall. Then, mean weekly values were computed for each meteorological variable for inclusion in the analysis with the SARD and PM data.
2.2. Data Analysis
2.2.1. Population Exposure to Environmental Factors
The InfoGripe system provides SARD cases by state (the variable is referred here to as SARD), considering the notification health center (and not the patients’ residence) as the case location. As hospitals do not necessarily admit patients who reside in the same state, the putative exposure areas of the patients were defined by considering the recruiting zones of the hospitals (and not the state boundaries). The Brazilian Institute of Geography and Statistics (IBGE) defines the regions of influence of Brazilian cities (REGIC) by considering the patient movements to seek hospitals providing high complexity healthcare, i.e., healthcare that requires a set of procedures that involve high technology and high cost, as is the case for the events gathered by the InfoGripe database. In this study, REGIC were considered to delimit the areas within which the environmental factors possibly impacted SARD case occurrence. Such areas were defined by aggregating the REGIC of the cities that belong to the same state, providing areas that are referred to as statewide REGIC (SREGIC) hereafter.
Weekly mean concentrations of PM were averaged by SREGIC (variable referred to as PM) (Appendix C and Appendix D). Meteorological variable means within the SREGIC were also computed. However, not all the ∼600 automatic meteorological stations of the INMET network were functioning at the same time; even when a station was in operation, missing data produced gaps in the time series. Selecting only stations with complete time-series would have led to too-restrictive data selection and to SREGIC without data. Consequently, a compromise was achieved by selecting, for each SREGIC, the maximum number of stations that simultaneously provided data for at least 80% of the study period (i.e., 29 January 2017 to 6 July 2019). This allowed: (1) maximizing the number of selected stations (to provide an accurate estimation of the mean meteorological conditions within the SREGIC) and (2) minimizing the amount of missing values (up to 20%) for the meteorological variable time series (Appendix E–Appendix G).
2.2.2. Correlation between PM Concentrations and SARD Cases
To consider the confounding effects of the meteorological conditions, the part of the variance (information) of the PM and SARD variables that was explained by meteorological conditions was previously removed from the two variables. The PM and SARD variables were considered separately, and for each SREGIC, the best multivariate linear regression model, in terms of the minimum Akaike information criterion (AIC), was selected by considering all combinations of 1 to 6 explanatory variables. The set of explanatory variables was composed of the 5 meteorological variables and their 10 possible two-way interactions (which corresponds to models tested for each SREGIC). Then, for each SREGIC, the Pearson and Spearman correlation coefficients, to account for linear (Pearson correlation) and nonlinear (rank-based association detected by Spearman correlation) relationships, were computed between the residuals of the best models found for the PM and SARD variables, referred to as uPM and uSARD, respectively. The procedure is schematically presented Figure 2.
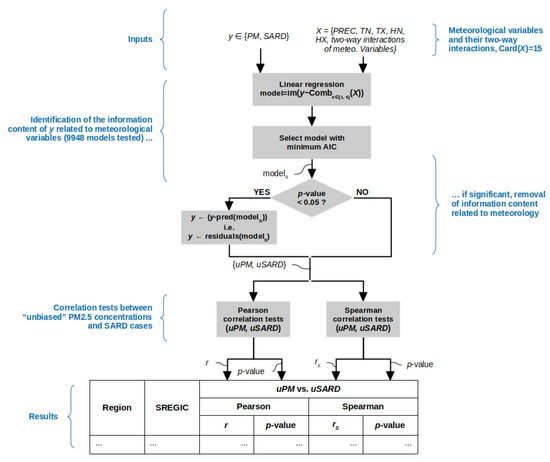
Figure 2.
Method used to consider the confounding effects of the meteorological variables in the computation of the correlation coefficients between PM and SARD. PREC: precipitation; TN: minimum temperature; TX: maximum temperature; HN: minimum relative humidity; HX: maximum relative humidity; SARD: Severe Acute Respiratory Disease case number; PM: particulate matter (PM) concentration.
3. Results
3.1. Characterization of the Exposure to Environmental Factors
The regions of exposure (SREGIC) differed from the state limits, as shown in Figure 3.
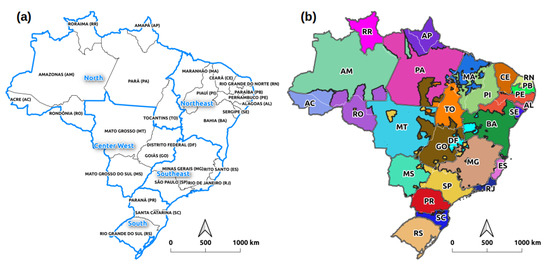
Figure 3.
(a) Brazil states and regions; (b) regions of Influence of cities (REGIC, source: Brazilian Institute of Geography and Statistics (IBGE)) aggregated per state (statewide REGIC (SREGIC)). AC: Acre; AP: Amapá; AM: Amazonas; PA: Pará; RO: Rondônia; RR: Roraima; TO: Tocantins; AL: Alagoas; BA: Bahia; CE: Ceará; MA: Maranhão; PB: Paraíba; PE: Pernambuco; PI: Piauí; RN: Rio Grande do Norte; SE: Sergipe; DF: Distrito Federal; GO: Goiás; MT: Mato Grosso; MS: Mato Grosso do Sul; ES: Espírito Santo; MG: Minas Gerais; RJ: Rio de Janeiro; SP: São Paulo; PR: Paraná; RS: Rio Grande do Sul; SC: Santa Catarina.
We selected 176, 202, and 229 meteorological stations to compute the mean weekly precipitation, relative humidity, and temperature in the SREGIC, respectively (Figure 4).
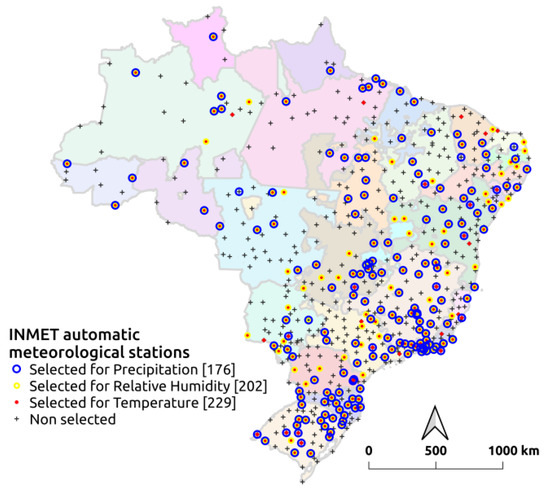
Figure 4.
Distribution of the selected meteorological stations as a function of the meteorological variables.
Distribution of these stations is highly heterogeneous, with 1 to 8 stations in the SREGIC of the North region, 2 to 17 in the Northeast, 6 to 10 in the Center West, 6 to 30 in the Southeast, and 10 to 20 in the South. Only one station was considered in Amapá and Roraima (both in the North region), whereas 30 were selected in Minas Gerais and 16 in the relatively small SREGIC of Rio de Janeiro.
3.2. Spatial Distribution of SARD Cases
The South region was the one the most affected by SARD during the period 2015–2019, with relatively high annual incidence rates (Figure 5).
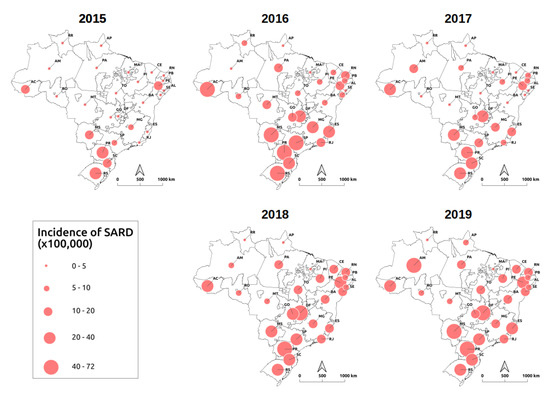
Figure 5.
Severe Acute Respiratory Disease (SARD) annual incidence rate (for 100,000 inhabitants) from 2015 to 2019. For incidence rate computation, 2019 population estimates were used (source: Brazilian Institute of Geography and Statistics (IBGE)).
Acre was the only state of the North region that exhibited a high incidence for the whole period, whereas the incidence tended to increase for the Amazonas state. In the Northeast region, Pernambouco was the only state with a high incidence in 2015, but from 2016, almost all states of the region exhibited relatively high incidences. The distributions of the incidence rates appeared similar in 2018 and 2019, except for the Amazonas state, which experienced an important increase in the SARD case number between 2018 and 2019 from 227 to 1911 cases.
A diagonal constituted of the states of Mato Grosso, Pará, Maranhão, and Amapá seemed less affected by SARD.
3.3. SpatialPM Distribution
Mapping PM concentrations provided by the CAMS reanalysis dataset shows that more than half of the country was exposed to annual mean concentrations of PM that exceeded the WHO AQG (10 g m (Figure 6, left column). High PM concentrations were predicted all year long and for all the considered years in a strip located in the South of the Amazonas state at the border with Acre. In this region, concentrations significantly exceeded 50 g m in some places (five times the WHO AQG). A region associated with high concentrations was also observed in a west–east-oriented strip crossing the Center West and Southeast regions. The states of Amapá, Pará (to the north), Maranhão, Rondônia, Mato Grosso (central), and Bahia (west part) seemed to be the least exposed to high annual mean concentrations, whereas very large states like Amazonas, Pará, Mato Grosso, and Bahia were exposed to heterogeneous levels of PM concentrations in space.
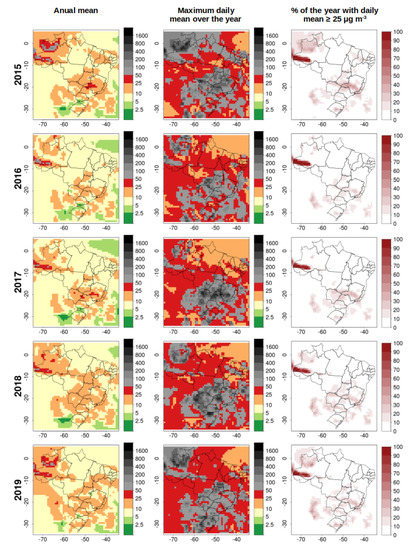
Figure 6.
Annual mean (left column) and maximum (middle column) of the daily PM concentrations and number of days (as percentage of the year) for which the daily mean exceeded the World Health Organization (WHO) Air Quality Guideline (AQG) of 25 g m/24 h (right column).
By studying the maximum daily concentrations observed over the year (middle column in Figure 6), it appears that a main part of the country was punctually exposed to extremely high PM concentrations, especially in comparison with the daily mean concentration reference value defined by the WHO (25 g m). The results showed that the southern region experienced very high maximum concentrations, despite mean annual concentration values being relatively low.
3.4. PM Concentration and SARD Case Correlations
Particulate matter concentrations and SARD cases corrected for the confounding effects of the meteorological conditions, i.e., uPM and uSARD, respectively, were positively correlated in all SREGICs of the Center West, Northeast, and North regions, with the exception of the SREGIC of Rio Grande do Norte, which exhibited a nonsignificant negative correlation (Figure 7 and Figure 8; to visualize corrected variables for each SREGIC, see Appendix H and Appendix I). Significant (p-value < 0.05) positive correlations were obtained for the SREGICs of Amapá, Alagoas, Bahia, Maranhão, Pernambouco, and Mato Grosso, with correlation coefficients varying from 0.24 (Mato Grosso) to 0.35 (Maranhão) considering the maximum of the Pearson and Spearman coefficients (Figure 7 and Figure 8). Correlations were improved by first smoothing the uPM and uSARD variables with a three-week centered moving average. Half of the SREGICs belonging to the previously mentioned regions were associated with a significant correlation coefficient (reaching 0.52 for Maranhão, p-value < 0.01), the others being associated with positive but nonsignificant positive correlations, except for the SREGIC of Rio Grande do Norte, which was still associated with a nonsignificant negative correlation. The majority of the SREGICs that presented significant correlations were situated in a west–east-oriented strip from Mato Grosso to the south of the Northeast region, which coincides with exposures to relatively high PM concentrations (Figure 6) and with high SARD incidences (Figure 5).
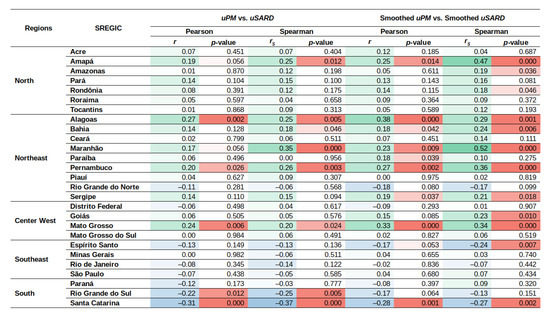
Figure 7.
Pearson and Spearman correlation coefficients between weekly corrected time series of SARD cases and mean PM concentrations: uSARD and uPM. Green and blue colors correspond to positive and negative correlations, respectively, and red corresponds to the test significance level.
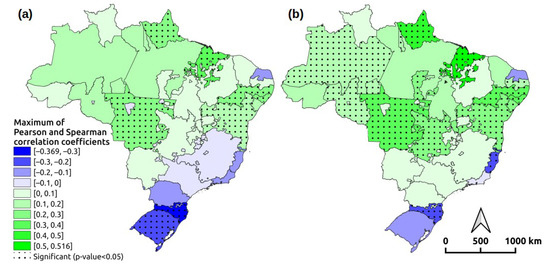
Figure 8.
Cartographic representation of the correlations between (a) uPM and uSARD and (b) smoothed uPM and uSARD using a 3-week centered moving average.
Negative correlations were found for the SREGICs of the Southeast and South regions, with significant values for Espirito Santo (considering the previously smoothed residuals) and for Rio Grande do Sul and Santa Catarina, the two southernmost SREGICs of the country (Figure 7 and Figure 8).
In the SREGICs of Rio Grande do Sul and Santa Catarina, PM concentrations and SARD cases presented a strong seasonality and a clearly opposite dynamic (Figure 9). However, a clear association was observed between the PM concentrations and the negative test proportion in these two SREGICs (Figure 9).
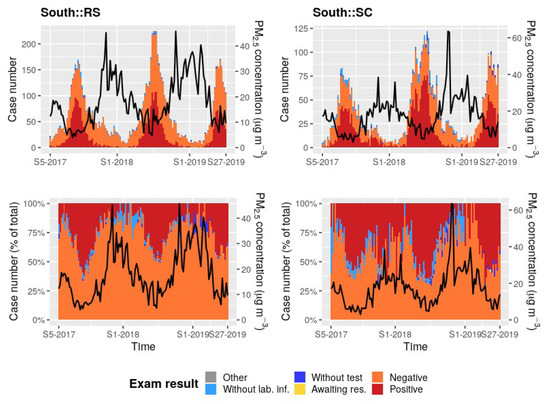
Figure 9.
PM concentration forecasts (archived CAMS NRT) provided 4 days before the current date and averaged per epidemiological week (black line) and weekly case number of SARD as a function of the exam status: cases with laboratory test positive to viral infection in red; cases with negative viral infection laboratory test in orange; cases awaiting test results in yellow; cases without laboratory information in blue; cases without test in light blue; others in grey. Data are presented for Rio Grande do Sul and Santa Catarina from 29 January 2017 to 6 July 2019, i.e., from the 5th epidemiological week of 2017 to the 27th epidemiological week of 2019. For a representation of the results for all SREGICs, see Appendix C and Appendix D.
This observation led us to consider the negative test rate in place of the total number of cases in the analysis. This negative test rate is defined as follows:
where and are the number of negative and positive tests for viral infection by epidemiological week, respectively. By applying the same procedure to remove the information attributable to meteorological conditions, uNR and the correlation coefficients between uNR and uPM were computed. The results showed a tendency to positive correlations for the SREGICs of the South and Southeast regions (Figure 10). Correlations were very significant for three SREGICs: Rio de Janeiro, Rio Grande do Sul, and Santa Catarina.

Figure 10.
Pearson and Spearman correlation coefficients between the corrected negative test rate and mean PM concentrations: and . Green and blue correspond to positive and negative correlations, respectively, and red corresponds to the test significance level.
3.5. An Early Warning System
By considering the archived CAMS NRT forecasts on a four-day horizon from 10 September 2019 to 9 September 2020, i.e., for an entire year associated with the latest IFS version (46R1), we found that the daily mean PM concentrations per municipality exceeded the WHO AQG of 25 g m at least one day over the entire year for 2071 municipalities (37%; Figure 11). Two municipalities (Eirunepé and Itamarati), situated in the south of the Amazonas state, were exposed to concentrations exceeding 25 g m for more than 120 days (∼4 months) in the year. The eight municipalities exposed to concentrations above 25 g m for more than 60 days (∼2 months) were all situated in the Amazonas state, except for the municipality of Serra do Ramalho in the state of Bahia.
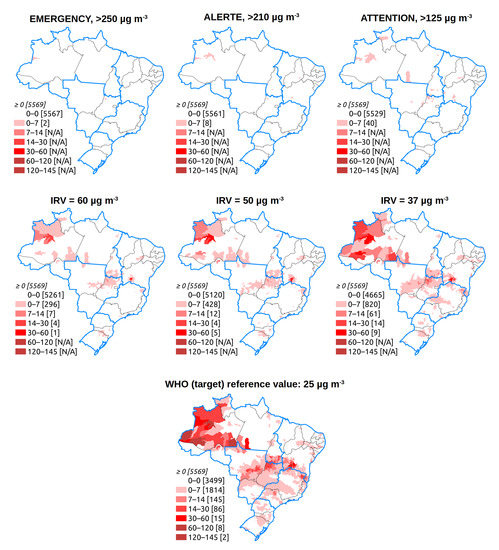
Figure 11.
Number of days from 10 July 2019 to 9 July 2020 (one year) that the municipalities of Brazil exceeded the different alert and intermediate reference values (IRVs) established by the CONAMA 491/2018 resolution for daily mean PM concentration. Numbers in square brackets correspond to the numbers of municipalities.
A total of 309, 450 and 905 municipalities had mean PM concentrations exceeding, at least one day during the considered period, the intermediate reference values (established by the CONAMA 491/2018 resolution) of 60, 50, and 37 g m, respectively. A low number of municipalities exceeded, at least one day during the considered period, the alert thresholds established by the CONAMA 491/2018 resolution: 40, 8, and 2 municipalities for the attention, alert, and emergency levels, respectively (Figure 11).
4. Discussion
4.1. General Approach
We aimed at establishing if the SARD case numbers and the four-day horizon forecasts of PM concentrations evolve similarly in Brazil to determine the ability to use the PM forecasts to predict respiratory disorders in the Brazilian population and consequently the feasibility of building an early warning system for PM-related health problems. Simple correlation coefficients, accounting for both linear (Pearson correlation) and nonlinear (Spearman rank-based correlation) relationships between the SARD cases and the PM concentrations corrected from the confounding effects of meteorological conditions, were found to be sufficient for this purpose. The modeling of such relationships through, for instance, linear regression, generalized additive models (GAMs), or case-crossover models, was not considered. In fact, such models could provide additional information but would have been relevant for the study period only (from the 5th epidemiological week of 2017 to the 27th epidemiological week of 2019) due to the significant and frequent changes observed in the amplitudes of the PM concentrations due to the updates of the IFS (Figure 1).
4.2. Early Warning System Feasibility
When analysing data, the application of a three-week centered moving average was justified by a potential time lag occurring between the PM and SARD time series, in both directions. A 6- to 7-day lag was observed between exposure to PM and significant increases in ambulatory admissions of children [10], indicating that one week can separate the peaks of exposure and hospital admission. On the other hand, PM concentrations with a four-day forecast horizon are based on the assimilation of information (AOD and occurrence of events including fire events) observed by satellites four days before. This could result in a delay of up to four days in the detection of PM concentration peaks related to fire events, which could lead, in our study, to a one-week delay between the hospital admission and the predicted PM peak.
Negative correlations found in the South region may appear counterintuitive. However, complex interactions between virus type, climate, and population behavior in this region can explain this result. A significant part of the SARD case dynamics and magnitude in the South could have been driven more by viral infections than by outdoor environmental factors, despite the meteorological variables explaining 78% ( = 0.78) and 65% of the total variance of the SARD cases in the SREGICs of Rio Grande do Sul and Santa Catarina, respectively (values ranked first and third among all SREGIC). Respiratory syncytial virus (RSV) circulates particularly during the winter (July to September) in the South and Southeast regions, with test positivity being twice to three times higher than in the other regions for children under five years old [34]. RSV infections were found to be not associated with meteorological factors in Kentucky, the United States [35]. The authors argued, in particular, that patients were not exposed to particular outdoor temperature or humidity levels (and we can add particular outdoor PM concentration levels here), with people living more indoor during the winter season. Even if climate differs between Kentucky and the southern Brazilian region, comparable population behavior can be assumed, especially among young children that are the most affected by RSV. This may be the reason why outdoor environmental factors do not fully explain the SARD seasonality in the South region and, to a lesser extent, in the Southeast region of Brazil. However, PM concentration and negative test rate being significantly correlated demonstrated that PM tended to explain nonviral infections in these regions, and that PM is an accurate indicator of SARD case increase.
The delimitation of the areas of exposure to environmental factors is probably the weakest point of the study and possibly contributed to reducing the significance of the results. This delimitation was based on the REGIC, aggregated by state. It was used to consider the recruiting basins of the hospitals but led to fragmented areas, which, for some states, had different environmental and socioeconomic contexts and different PM concentration levels, pollution source types, population activities, etc., leading to different exposure risks. This was, for instance, the case for the São Paulo SREGIC, which includes a non-negligible part of the Mato Grosso state (Figure 3). Moreover, large SREGIC like those associated with Pará and Amazonas exhibited heterogeneous spatial distributions of PM concentrations. The mean, chosen as the summary value for SREGICs, tended to smoothing information both in space and time. However, by testing other summary statistics (median, max, and number of days of the epidemiological week above WHO reference value), the mean appeared the more robust to extreme values, significantly linked to SARD cases, and easy to interpret. Eventually, an early warning system would not consider such a high aggregation level (state level). As shown in the example provided in Appendix B, this system should be based on mean PM concentrations at the municipality or autochthonous territory (Terra Indígena) level, or even at the 40 km pixel level, which would result in a more accurate estimation of exposure.
The different sources of PM, and thus its chemical composition and toxicity, could have been considered in this study, as Brazil is exposed to different pollution sources and types. The Amazon region is mostly affected by forest fires, and Central and Southern Brazil are mainly influenced by urban activities (industry and transportation). More generally, PM concentration should be considered as one of the components of air quality indexes, which should also integrate meteorological conditions. This issue should be investigated in the future.
Nevertheless, we succeeded in demonstrating the possibility of using PM concentration forecasts provided by CAMS to predict respiratory disorders in the Brazilian population and, consequently, of developing an early warning system in Brazil based on this product.
4.3. Alert Thresholds
When building an early warning system, alert threshold(s) associated with PM concentrations must be defined. This definition was outside the scope of our initial objectives and will constitute the main issue of further works, but some considerations can be outlined here.
This definition is partly related to the ability of the CAMS products to provide an accurate absolute estimation of the PM concentrations. CAMS is supposed to predict reliable absolute PM concentration values, and accuracy and biases are regularly estimated (see, for example, Ref. [36]).
However, the predicted PM concentration levels reported in this study for the Center West region seem to be underestimated considering that this region is particularly affected by fires. This demonstrates the need for a more specific evaluation of the products in South America, and in Brazil in particular, that would help identify local biases, associated correction factors, and reference values from a public health perspective. The impacts of the successive IFS upgrades on the amplitudes of the predictions (Figure 1) cast doubt on the product’s absolute accuracy. In particular, the IFS underwent a major upgrade on 9 July 2019 (IFS cycle 46R1), associated with changes in the vertical resolution (from 60 vertical levels for the previous models to 137 levels for the new one) and in the model components. This upgrade led to “pronounced improvement of surface PM and PM forecasts, especially during night time, by changes to the diurnal cycle of emissions and the introduction of injection heights for biomass burning emissions” (https://atmosphere.copernicus.eu/node/472). More specifically, overestimation of near-surface PM during fire events was reduced by changes in the biomass-burning injection heights from the Global Fire Assimilation System (GFAS) and the updated diurnal cycle. Simultaneously, the anthropogenic Secondary Organic Aerosol (SOA) emission was updated with a diurnal cycle and regionally-varying ratio to carbon monoxide (CO) emissions, resulting in a significant reduction in night-time near surface PM concentration in polluted regions [36]. These changes are important for Brazil due to the extent of biomass burning events, the presence of industrial activities, and mega-cities like São Paulo and Rio de Janeiro. As a consequence, a significant drop in the estimated PM concentrations was observed, especially in the Center West, Southeast, and South regions.
However, another perspective on the alert threshold definition issue can be adopted. The results showed how the definition of different thresholds highly impacts the number of municipalities experiencing an alert (Figure 11). Accurate predictions associated with an alert threshold that meets national and international guidelines would theoretically be ideal but can potentially generate a high number of alerts that would be difficult for local authorities to manage, notably due to limited public service resources and population acceptability. This consequently could lead to the impossibility of actually and systematically implementing the necessary prevention and mitigation actions. Moreover, no threshold effect has been associated with the health-related impact of PM exposure [24]. In that sense, a pragmatical method is required to define local alert thresholds according to local public authority and population capacities. This definition would require a highly interdisciplinary approach involving epidemiology, environmental science, human science, and public health.
5. Conclusions
In this study, we demonstrated the possibility of using PM concentration forecasts provided by CAMS to predict SARD cases in Brazil up to four days in advance and, consequently, to be part of an early warning system of the health-related impacts of PM. Through the relationship to different pollution types, this system could be effective for the whole Brazilian territory and beyond. PM has been proven to aggravate COVID-19 symptoms. The mobilization of researchers, public health actors, and the general population in the fight against the pandemic, particularly during the current environmental disasters related to deforestation and forest fires, could provide an opportunity to develop an alert system and implement both PM emission reduction actions and mitigation measures, such as the wearing of adapted masks. This also would contribute to achieving the United Nation Sustainable Development Goals 3.9: by 2030, substantially reduce the number of deaths and illnesses from hazardous chemicals and air, water, and soil pollution and contamination.
Author Contributions
Conceptualization, E.R., E.I., N.B., H.B., T.C., N.D., R.G., H.G., S.d.S.H., M.d.A.F.M.M., A.M.V.M., C.R., D.A.M.V., D.X. and C.B.; methodology, E.R., E.I., A.M.V.M., D.A.M.V.; software, E.R.; validation, E.R., E.I., A.M.V.M., D.A.M.V.; formal analysis, E.R.; investigation, E.R.; resources, E.R.; data curation, E.R.; writing–original draft, E.R.; visualization, E.R.; supervision, E.R.; writing–review and editing, E.R., E.I., N.B., H.B., T.C., N.D., R.G., H.G., S.d.S.H., M.d.A.F.M.M., A.M.V.M., C.R., D.A.M.V., D.X. and C.B. All authors have read and agreed to the published version of the manuscript.
Funding
This research was supported by the MARIONETTE3 project, funded by the Observations of Natural Environments and Global Changes (OMNCG) Research Federation of the Observatory of Universe Sciences of Reunion Island (OSU-Réunion) and Reunion University.
Acknowledgments
We want to thank the Copernicus Helpdesk at ECMWF for all the answers to our questions on CAMS.
Conflicts of Interest
The authors declare no conflict of interest.
Abbreviations
The following abbreviations are used in this manuscript:
| AIC | Akaike information criterion |
| AOD | Aerosol Optical Depth |
| CAMS | Copernicus Atmosphere Monitoring Service |
| CONAMA | Conselho Nacional de Meio Ambiente |
| ECMWF | European Centre for Medium-Range Weather Forecasts |
| EMAp | Escola de Matemática Aplicada |
| ESA | European Space Agency |
| EUMETSAT | European Organisation for the Exploitation of Meteorological Satellites |
| FGV | Fundação Getulio Vargas |
| Fiocruz | Fundação Oswaldo Cruz |
| FTP | File Transfer Protocol |
| GMAO | Global Monitoring and Assimilation Service |
| HN | minimum relative humidity |
| HX | maximum relative humidity |
| IBAMA | Instituto Brasileiro do meio ambiente e dos recursos naturais renováveis |
| IBGE | Instituto Brasileiro de Geografia e Estatistica |
| IFS | Integrated Forecasting System |
| INMET | Instituto nacional de meteorologia |
| INPE | Instituto Nacional de Pesquisa Espacial |
| MODIS | Moderate Resolution Imaging Radiospectrometer |
| NASA | National Aeronautics and Space Administration |
| NRT | Near Real Time |
| PM | Particulate Matter |
| PMAp | Polar Multi-sensor Aerosol product |
| PREC | precipitation |
| PROCC | Programa de computação científica |
| RSV | Respiratory syncytial virus |
| REGIC | Regiões de Influência das Cidades |
| SREGIC | Statewide REGIC |
| SARD | Severe Acute Respiratory Diseases |
| SARS | Severe Acute Respiratory Syndromes |
| SINAN | Sistema de Informação de Agravos de Notificação |
| SOA | Secondary Organic Aerosol |
| TN | minimum temperature |
| TX | maximum temperature |
| UTC | Coordinated Universal Time |
| WHO | World Health Organization |
Appendix A. Data Sources and Description

Table A1.
Data used in the study: sources and description.
Table A1.
Data used in the study: sources and description.
| Data | Spatial Resolution/ Spatial Unit | Source | Type of Access (File Format) | Question Addressed in the Study |
|---|---|---|---|---|
| PM concentration reanalyses | ∼80 km | CAMS reanalyses, Copernicus Atmosphere Data Store https://ads.atmosphere.copernicus.eu/#!/home | HTTPS (GRIB or NETCDF) | Description of the past PM concentration distribution, in space and time |
| Archived PM concentration forecasts (every 3 h) | ∼40 km | CAMS near real-time database: https://apps.ecmwf.int/datasets/data/cams-nrealtime/levtype=sfc/ | ECMWF API (GRIB or NETCDF) | Feasibility study of an early warning system; simulation of alert threshold definition |
| PM hourly concentration forecasts up to 5 days after the current day | ∼40 km | CAMS Global forecast data https://confluence.ecmwf.int/display/CKB/FTP+access+to+CAMS+global+data | FTP (GRIB) | Proposition for PM concentration indicators to be included in an early warning system (Appendix F) |
| States of Brazil | State | brazilmaps R package | (R object) | Cartography of administrative units of Brazil |
| Municipalities of Brazil (Municípios) | Municipalities | brazilmaps R package | (R object) | Simulation of alert threshold definition |
| 2019 population estimate in Brazil | State | brazilmaps R package | (R object) | SARD annual incidence |
| REGIC | REGIC | IBGE: https://www.ibge.gov.br/geociencias/cartas-e-mapas/redes-geograficas/15798-regioes-de-influencia-das-cidades.html?edicao=27334&t=downloads | HTTP (ESRI ShapeFile) | Exposure to environmental factors |
| SARD | State | InfoGripe database http://info.gripe.fiocruz.br/; https://gitlab.procc.fiocruz.br/mave/repo/tree/master/Dados/InfoGripe | HTTP (text .CSV) | Epidemiological situation related to SARD in Brazil |
Appendix B. Examples of PM2.5 Concentration Forecasts Obtained from CAMS NRT on Which an Early Warning System Could Be Based
Figure A1 and Figure A2 show the daily mean PM concentration forecasts for the next four days from the current date (15 September 2020) at pixel (Figure A1) and municipality (Figure A2) levels. The municipality of Cujubim (RO) is supposed to exceed the WHO AQG for the daily mean PM concentration on each of the next four days, with a predicted concentration above 50 g m on 18 September 2020. This municipality regularly experiences forest fires. Four farmers were arrested for illegal deforestation and fires in August 2020 (https://globoplay.globo.com/v/8796016/), and the municipality was among those most affected by fires in the state of Rondônia in the first week of September 2020, along with the municipality of Porto Velho (https://g1.globo.com/ro/rondonia/natureza/amazonia/noticia/2020/09/08/rondonia-acumula-mais-de-mil-focos-de-queimadas-nos-primeiros-7-dias-de-setembro-de-2020-alta-e-de-70percent.ghtml). The other municipalities predicated to exceed the WHO AQGs for the next four days after the 15 September 2020 were Minaçu (GO), Itamarati (AM), Alvorada (BA, for two consecutive days), Eirunepé (AM), Envia (AM), and Atalaia do Norte (AM).
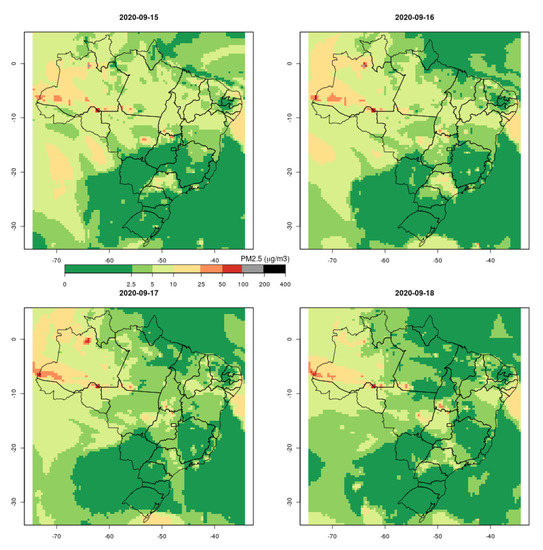
Figure A1.
Daily predicted mean concentration of PM in Brazil, for 15–18 September, 2020 at the pixel level.
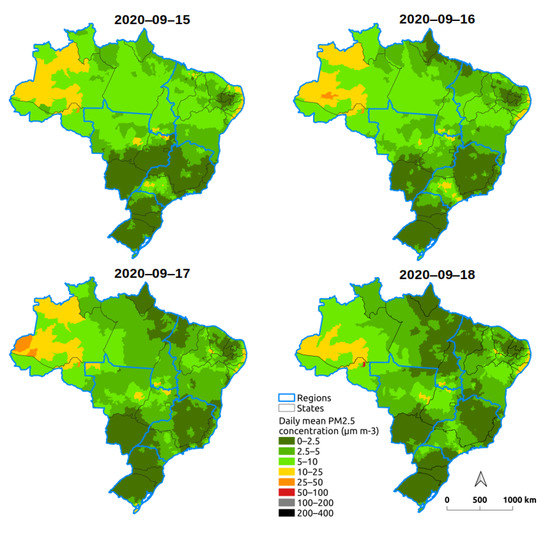
Figure A2.
Daily predicted mean concentration of PM in Brazil per municipality for 15–18 September 2020 at the municipality level.
Appendix C. PM2.5 Concentration Forecasts and Weekly Case Number of SARD
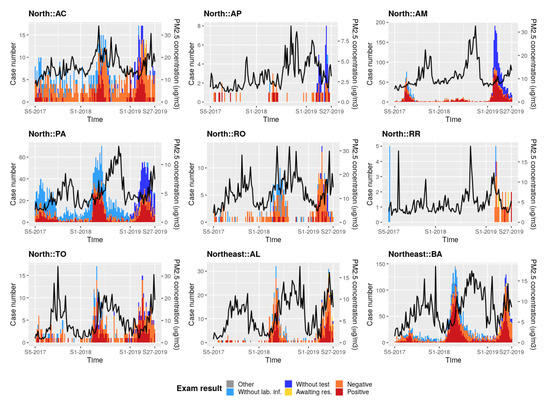
Figure A3.
PM concentration forecasts (archived CAMS NRT) provided four days before the current date and averaged per epidemiological week (black line) and weekly case number of SARD as a function of the exam status: cases with positive viral infection laboratory test (red); cases with negative viral infection laboratory test (orange); cases awaiting test results (yellow); cases without laboratory information (blue); cases without test (light blue); others (grey). Data are presented by SREGIC from 29 January 2017 to 6 July 2019, i.e., from the 5th epidemiological week of 2017 to the 27th epidemiological week of 2019.
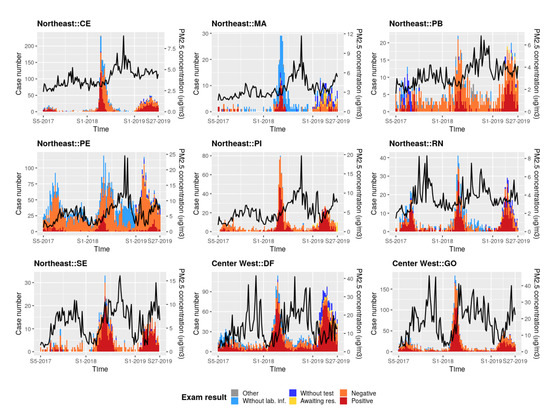
Figure A4.
PM concentration forecasts (archived CAMS NRT) provided four days before the current date and averaged per epidemiological week (black line) and weekly case number of SARD as a function of the exam status: cases with positive viral infection laboratory test (red); cases with negative viral infection laboratory test (orange); cases awaiting test results (yellow); cases without laboratory information (blue); cases without test (light blue); others (grey). Data are presented by SREGIC from 29 January 2017 to 6 July 2019, i.e., from the 5th epidemiological week of 2017 to the 27th epidemiological week of 2019.
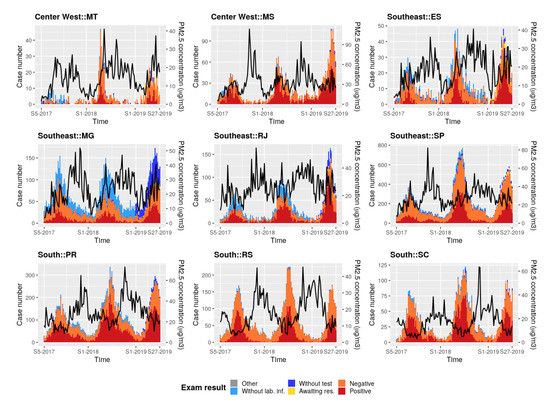
Figure A5.
PM concentration forecasts (archived CAMS NRT) provided four days before the current date and averaged per epidemiological week (black line) and weekly case number of SARD as a function of the exam status: cases with positive viral infection laboratory test (red); cases with negative viral infection laboratory test (orange); cases awaiting test results (yellow); cases without laboratory information (blue); cases without test (light blue); others (grey). Data are presented by SREGIC from 29 January 2017 to 6 July 2019, i.e., from the 5th epidemiological week of 2017 to the 27th epidemiological week of 2019.
Appendix D. PM2.5 Concentration Forecasts and Weekly Case Number of SARD (in %)
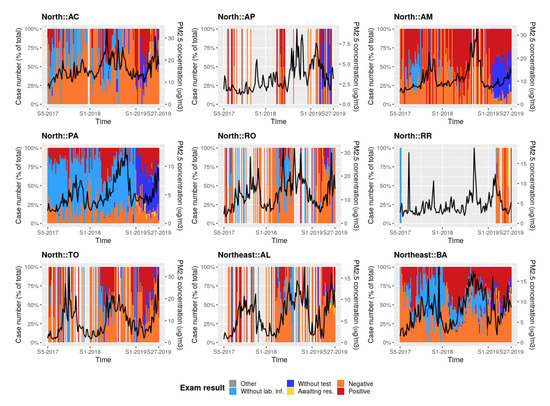
Figure A6.
PM concentration forecasts (archived CAMS NRT) provided four days before the current date and averaged per epidemiological week (black line) and weekly case number of SARD expressed as a percentage of the total number of reported cases and as a function of the exam status: cases with positive viral infection laboratory test (red); cases with negative viral infection laboratory test (orange); cases awaiting test results (yellow); cases without laboratory information (blue); cases without test (light blue); others (grey). Data are presented by SREGIC from 29 January 2017 to 6 July 2019, i.e., from the 5th epidemiological week of 2017 to the 27th epidemiological week of 2019.
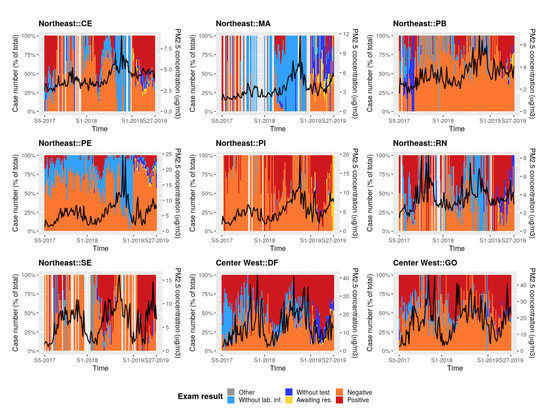
Figure A7.
PM concentration forecasts (archived CAMS NRT) provided four days before the current date and averaged per epidemiological week (black line) and weekly case number of SARD expressed as a percentage of the total number of reported cases and as a function of the exam status: cases with positive viral infection laboratory test (red); cases with negative viral infection laboratory test (orange); cases awaiting test results (yellow); cases without laboratory information (blue); cases without test (light blue); others (grey). Data are presented by SREGIC from 29 January 2017 to 6 July 2019, i.e., from the 5th epidemiological week of 2017 to the 27th epidemiological week of 2019.
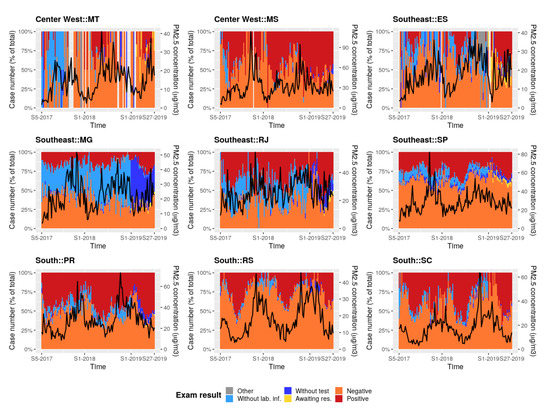
Figure A8.
PM concentration forecasts (archived CAMS NRT) provided four days before the current date and averaged per epidemiological week (black line) and weekly case number of SARD expressed as a percentage of the total number of reported cases and as a function of the exam status: cases with positive viral infection laboratory test (red); cases with negative viral infection laboratory test (orange); cases awaiting test results (yellow); cases without laboratory information (blue); cases without test (light blue); others (grey). Data are presented by SREGIC from 29 January 2017 to 6 July 2019, i.e., from the 5th epidemiological week of 2017 to the 27th epidemiological week of 2019.
Appendix E. Rainfall and Weekly Case Number of SARD
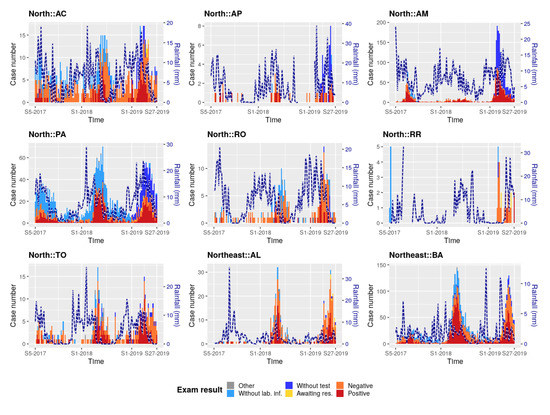
Figure A9.
Rainfall averaged per epidemiological week, and weekly case number of SARD as a function of the exam status: cases with positive viral infection laboratory test (red); cases with negative viral infection laboratory test (orange); cases awaiting test results (yellow); cases without laboratory information (blue); cases without test (light blue); others (grey). Data are presented by SREGIC, from 29 January 2017 to 6 July 2019, i.e., from the 5th epidemiological week of 2017 to the 27th epidemiological week of 2019.
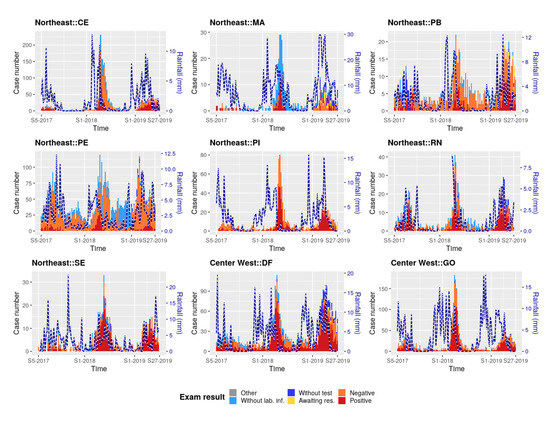
Figure A10.
Rainfall averaged per epidemiological week, and weekly case number of SARD as a function of the exam status: cases with positive viral infection laboratory test (red); cases with negative viral infection laboratory test (orange); cases awaiting test results (yellow); cases without laboratory information (blue); cases without test (light blue); others (grey). Data are presented by SREGIC, from 29 January 2017 to 6 July 2019, i.e., from the 5th epidemiological week of 2017 to the 27th epidemiological week of 2019.
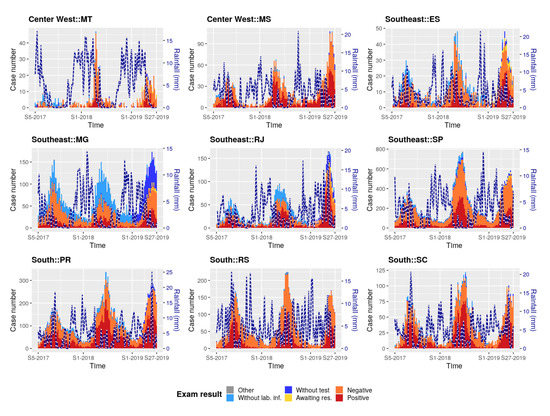
Figure A11.
Rainfall averaged per epidemiological week, and weekly case number of SARD as a function of the exam status: cases with positive viral infection laboratory test (red); cases with negative viral infection laboratory test (orange); cases awaiting test results (yellow); cases without laboratory information (blue); cases without test (light blue); others (grey). Data are presented by SREGIC, from 29 January 2017 to 6 July 2019, i.e., from the 5th epidemiological week of 2017 to the 27th epidemiological week of 2019.
Appendix F. Temperature and Weekly Case Number of SARD
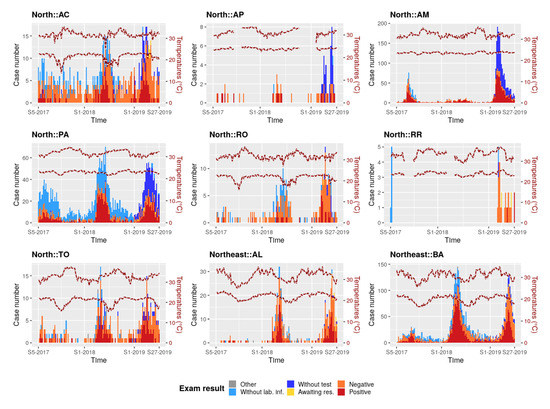
Figure A12.
Minimum and maximum temperatures averaged per epidemiological week and weekly case number of SARD as a function of the exam status: cases with positive viral infection laboratory test (red); cases with negative viral infection laboratory test (orange); cases awaiting test results (yellow); cases without laboratory information (blue); cases without test (light blue); others (grey). Data are presented by SREGIC, from 29 January 2017 to 6 July 2019, i.e., from the 5th epidemiological week of 2017 to the 27th epidemiological week of 2019.
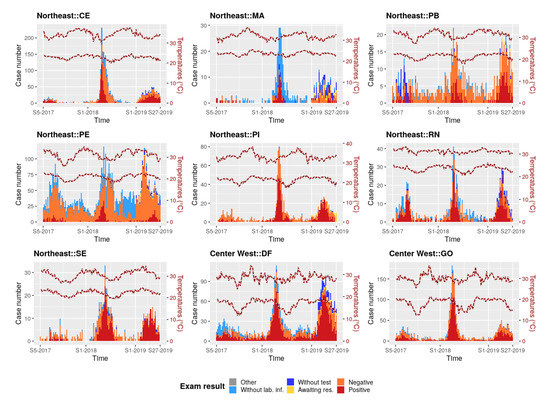
Figure A13.
Minimum and maximum temperatures averaged per epidemiological week and weekly case number of SARD as a function of the exam status: cases with positive viral infection laboratory test (red); cases with negative viral infection laboratory test (orange); cases awaiting test results (yellow); cases without laboratory information (blue); cases without test (light blue); others (grey). Data are presented by SREGIC, from 29 January 2017 to 6 July 2019, i.e., from the 5th epidemiological week of 2017 to the 27th epidemiological week of 2019.
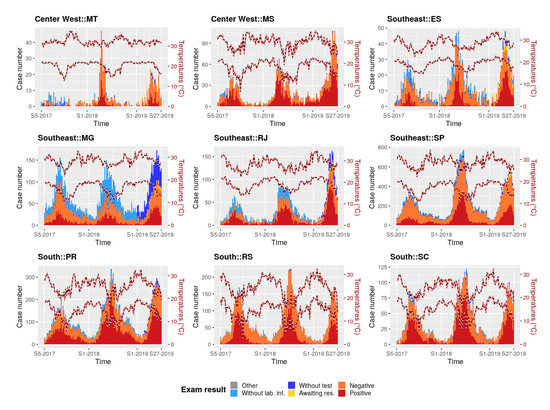
Figure A14.
Minimum and maximum temperatures averaged per epidemiological week and weekly case number of SARD as a function of the exam status: cases with positive viral infection laboratory test (red); cases with negative viral infection laboratory test (orange); cases awaiting test results (yellow); cases without laboratory information (blue); cases without test (light blue); others (grey). Data are presented by SREGIC, from 29 January 2017 to 6 July 2019, i.e., from the 5th epidemiological week of 2017 to the 27th epidemiological week of 2019.
Appendix G. Relative Humidity and Weekly Case Number of SARD
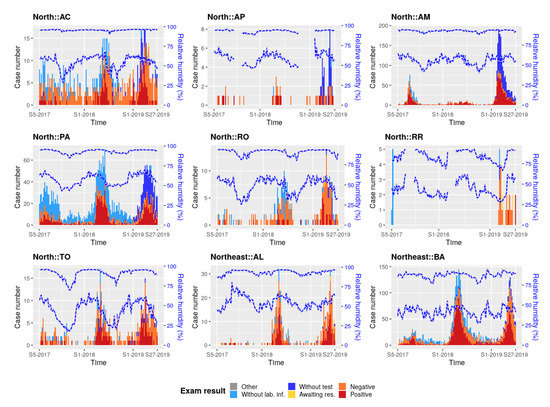
Figure A15.
Minimum and maximum relative humidity averaged per epidemiological week and weekly case number of SARD as a function of the exam status: cases with positive viral infection laboratory test (red); cases with negative viral infection laboratory test (orange); cases awaiting test results (yellow); cases without laboratory information (blue); cases without test (light blue); others (grey). Data are presented by SREGIC, from 29 January 2017 to 6 July 2019, i.e., from the 5th epidemiological week of 2017 to the 27th epidemiological week of 2019.
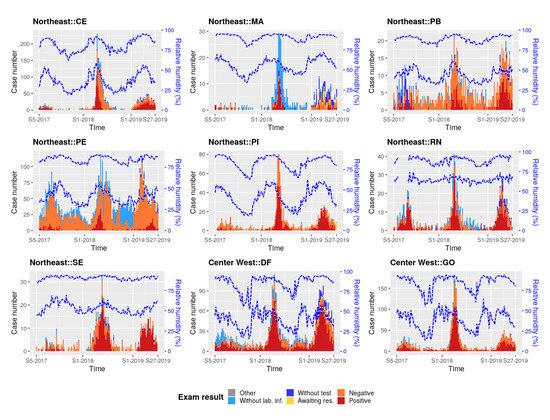
Figure A16.
Minimum and maximum relative humidity averaged per epidemiological week and weekly case number of SARD as a function of the exam status: cases with positive viral infection laboratory test (red); cases with negative viral infection laboratory test (orange); cases awaiting test results (yellow); cases without laboratory information (blue); cases without test (light blue); others (grey). Data are presented by SREGIC, from 29 January 2017 to 6 July 2019, i.e., from the 5th epidemiological week of 2017 to the 27th epidemiological week of 2019.
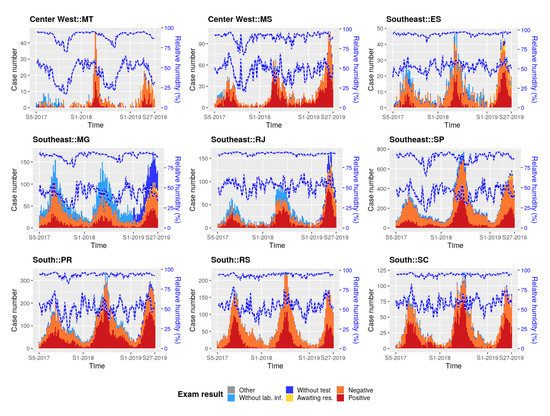
Figure A17.
Minimum and maximum relative humidity averaged per epidemiological week and weekly case number of SARD as a function of the exam status: cases with positive viral infection laboratory test (red); cases with negative viral infection laboratory test (orange); cases awaiting test results (yellow); cases without laboratory information (blue); cases without test (light blue); others (grey). Data are presented by SREGIC, from 29 January 2017 to 6 July 2019, i.e., from the 5th epidemiological week of 2017 to the 27th epidemiological week of 2019.
Appendix H. Residuals of the Multivariate Linear Regression Models for PM2.5 Concentrations and Case Number of SARD
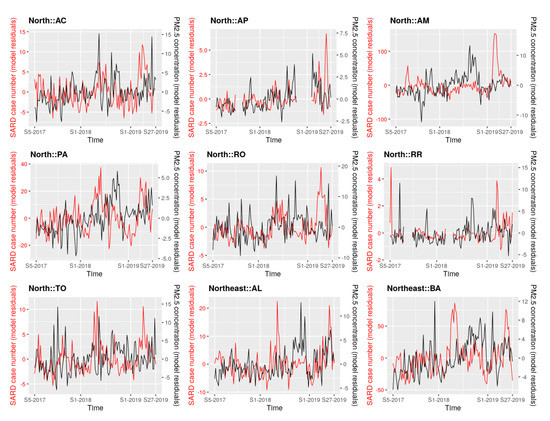
Figure A18.
uPM (black line) and uSARD (red line) by SREGIC, from 29 January 2017 to 6 July 2019, i.e., from the 5th epidemiological week of 2017 to the 27th epidemiological week of 2019.
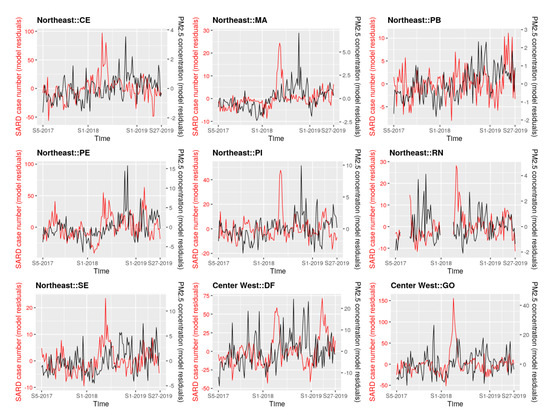
Figure A19.
uPM (black line) and uSARD (red line) by SREGIC, from 29 January 2017 to 6 July 2019, i.e., from the 5th epidemiological week of 2017 to the 27th epidemiological week of 2019.
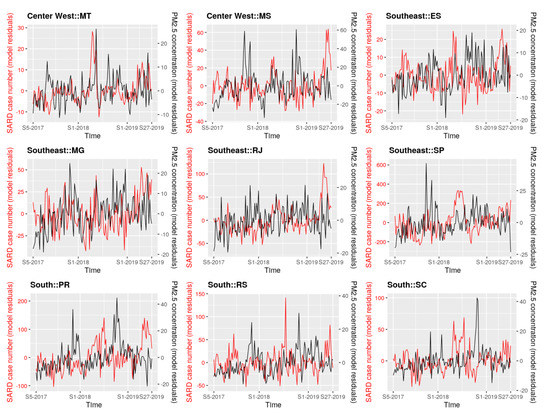
Figure A20.
uPM (black line) and uSARD (red line) by SREGIC, from 29 January 2017 to 6 July 2019, i.e., from the 5th epidemiological week of 2017 to the 27th epidemiological week of 2019.
Appendix I. Residuals of the Multivariate Linear Regression Models for PM2.5 Concentrations and SARD Negative Test Rate
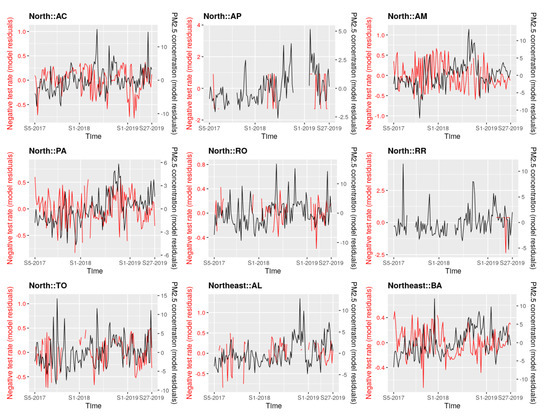
Figure A21.
uPM (black line) and uNR (red line) by SREGIC from 29 January 2017 to 6 July 2019, i.e., from the 5th epidemiological week of 2017 to the 27th epidemiological week of 2019.
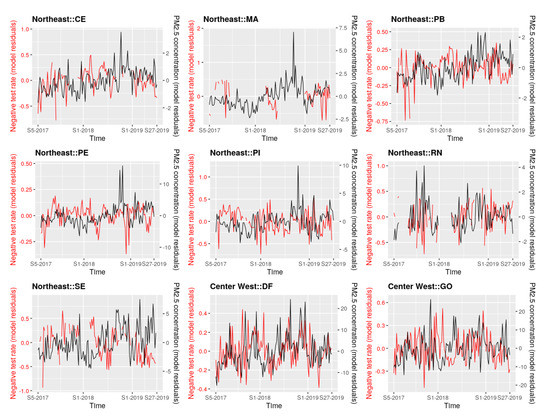
Figure A22.
uPM (black line) and uNR (red line) by SREGIC from 29 January 2017 to 6 July 2019, i.e., from the 5th epidemiological week of 2017 to the 27th epidemiological week of 2019.
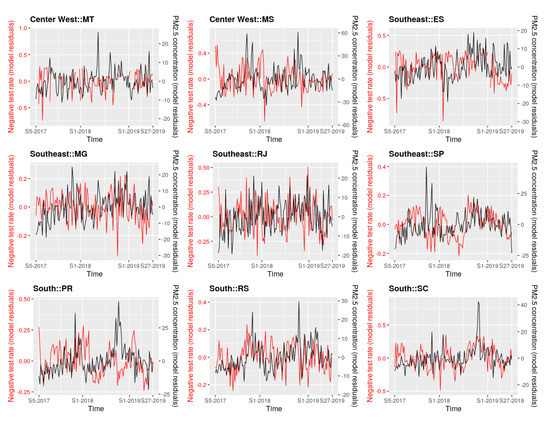
Figure A23.
uPM (black line) and uNR (red line) by SREGIC from 29 January 2017 to 6 July 2019, i.e., from the 5th epidemiological week of 2017 to the 27th epidemiological week of 2019.
References
- Loomis, Y.; Lauby-Secretan, B.; El Ghissassi, F.; Bouvard, V.; Benbrahim-Tallaa, L.; Guha, N.; Baan, R.; Mattock, H.; Straif, K. on behalf of the International Agency for Research on Cancer Monograph Working Group IARC. The carcinogenicity of outdoor air pollution. Lancet 2013, 14, 1262–1263. [Google Scholar] [CrossRef]
- Health Effects Institute (HEI). State of Global Air 2019; Special Report; Health Effects Institute: Boston, MA, USA, 2019; Available online: https://www.stateofglobalair.org/sites/default/files/soga_2019_report.pdf (accessed on 9 November 2020).
- Rao, X.; Patel, P.; Puett, R.; Rajagopalan, S. Air pollution as a risk factor for type 2 diabetes. Toxicilogical Sci. 2015, 143, 231–241. [Google Scholar] [CrossRef] [PubMed]
- IBGE. IBGE Divulga as Estimativas da População dos Municípios para 2019. 2019. Available online: https://agenciadenoticias.ibge.gov.br/agencia-sala-de-imprensa/2013-agencia-de-noticias/releases/25278-ibge-divulga-as-estimativas-da-populacao-dos-municipios-para-2019 (accessed on 9 November 2020).
- Andreão, W.L.; Pinto, J.A.; Pedruzzi, R.; Kumar, P.; Albuquerque, T.T.A. Quantifying the impact of particle matter on mortality and hospitalizations in four Brazilian metropolitan areas. J. Environ. Manag. 2020, 270, 110840. [Google Scholar] [CrossRef] [PubMed]
- Reddington, C.L.; Butt, E.W.; Ridley, D.A.; Artaxo, P.; Morgan, W.T.; Coe, H.; Spracklen, D.V. Air quality and human health improvements from reductions in deforestation-related fire in Brazil. Nat. Geosci. 2015, 8, 768–771. [Google Scholar] [CrossRef]
- World Health Organization (WHO). WHO Air Quality Guidelines for Particulate Matter, Ozone, Nitrogen Dioxide and Sulfur Dioxide—Global Update 2005—Summary of Risk Assessment. 2005. Available online: https://apps.who.int/iris/handle/10665/69477 (accessed on 9 November 2020).
- Alves, N.O.; Vessoni, A.T.; Quinet, A.; Fortunato, R.S.; Kajitani, G.S.; Peixoto, M.S.; de Souza Hacon, S.; Artaxo, P.; Saldiva, P.; Menck, C.F.M.; et al. Biomass burning in the Amazon region causes DNA damage and cell death in human lung cells. Sci. Rep. 2017, 7, 10937. [Google Scholar] [CrossRef]
- Artaxo, P. Physical and chemical properties of aerosols in the wet and dry seasons in Rondônia, Amazonia. J. Geophys. Res. 2002, 107, LBA 49-1–LBA 49-14. [Google Scholar] [CrossRef]
- do Carmo, C.N.; Hacon, S.; Longo, K.M.; Freitas, S.; Ignotti, E.; Ponce de Leon, A.; Artaxo, P. Associação entre material particulado de queimadas e doenças respiratórias na região sul da Amazônia brasileira. Rev. Panam Salud Publica 2010, 27, 10–16. [Google Scholar] [CrossRef]
- Jacobson, L.S.V.; Hacon, S.S.; Castro, H.A.; Ignotti, E.; Artaxo, P.; Ponce de Leon, A.C.M. Association between fine particulate matter and the peak expiratory flow of schoolchildren in the Brazilian subequatorial Amazon: A panel study. Environ. Res. 2012, 117, 27–35. [Google Scholar] [CrossRef]
- Aragão, L.E.O.C.; Anderson, L.O.; Fonseca, M.G.; Rosan, T.M.; Vedovato, L.B.; Wagner, F.H.; Silva, C.V.; Junior, C.H.S.; Arai, E.; Aguiar, A.P. 21st Century drought-related fires counteract the decline of Amazon deforestation carbon emissions. Nat. Commun. 2018, 9, 536. [Google Scholar] [CrossRef]
- Aragão, L.E.O.C.; Silva Junior, C.H.L.; Anderson, L.O. Brazil’s Challenge to Restrain Deforestation and Fires in the Amazon during COVID-19 Pandemic in 2020: Environmental, Social Implications and Their Governance; Technical Note; Instituto Nacional de Pesquisas Espaciais (INPE): São José dos Campos, Brazil, 2020; 34p. [Google Scholar] [CrossRef]
- Observatório de Clima e Saúde (ICIC/Fiocruz). Covid-19 e Queimadas na Amazônia Legal e no Pantanal: Aspectos Cumulativos e Vulnerabilidades. Technical Note. 2020. Available online: https://www.icict.fiocruz.br/sites/www.icict.fiocruz.br/files/nota_queimadascovid_out2020.pdf (accessed on 13 November 2020).
- Henderson, S.B. The Covid-19 Pandemic and Wildfire Smoke: Potentially Concomitant Disasters. Am. J. Public Health 2020, 110, e1–e3. [Google Scholar] [CrossRef]
- Sedlmaier, N.; Hoppenheidt, K.; Krist, H.; Lehmann, S.; Lang, H. Generation of avian influenza virus (AIV) contaminated fecal fine particulate matter (PM): Genome and infectivity detection and calculation of immission. Vet. Microbiol. 2009, 139, 156–164. [Google Scholar] [CrossRef] [PubMed]
- Després, V.R.; Huffman, J.A.; Burrows, S.M.; Hoose, C.; Safatov, A.S.; Buryak, G.; Fröhlich-Nowoisky, J.; Elbert, W.; Andreae, M.O.; Pöschl, U.; et al. Primary biological aerosol particles in the atmosphere: A review. Tellus B Chem. Phys. Meteorol. 2012, 64, 15598. [Google Scholar] [CrossRef]
- Setti, L.; Passarini, F. Relazione Circa l’Effetto Dell’inquinamento da Particolato Atmosferico e la Diffusione di Virus Nella Popolazione. Actu-Environnement Website, 2020. Available online: https://www.actu-environnement.com/media/pdf/news-35178-covid-19.pdf (accessed on 13 October 2020).
- Gaddi, A.V.; Capello, F. Particulate Does Matter: Is Covid-19 Another Air Pollution Related Disease? Preprint 2020. Available online: https://doi.org/10.13140/RG.2.2.22283.85286/2 (accessed on 11 December 2020).
- Han, Y.; Lam, J.C.K.; Li, V.O.K.; Guo, P.; Zhang, Q.; Wang, A.; Crowcroft, J.; Wang, S.; Fu, J.; Gilani, Z.; et al. The effects of outdoor air pollution concentrations and lockdowns on Covid-19 infections in Wuhan and other provincial capitals in China. Preprint 2020. Available online: https://doi.org/10.20944/preprints202003.0364.v1 (accessed on 11 December 2020).
- Andrée, B.P.J. Incidence of COVID-19 and Connections with Air Pollution Exposure: Evidence from the Netherlands; Policy Research Working Paper No. 9221; World Bank: Washington, DC, USA, 2020. [Google Scholar]
- Wu, X.; Nethery, R.C.; Sabath, M.B.; Braun, D.; Dominici, F. Air pollution and COVID-19 mortality in the United States: Strengths and limitations of an ecological regression analysis. Sci. Adv. 2020, 6, eabd4049. [Google Scholar] [CrossRef] [PubMed]
- Pope, C.A., III; Burnett, R.T.; Thun, M.J.; Calle, E.E.; Krewski, D.; Ito, K.; Thurston, G.D. Lung cancer, cardiopulmonary mortality, and long-term exposure to fine particulate air pollution. JAMA 2002, 287, 1132–1141. [Google Scholar] [CrossRef]
- World Health Organization (WHO) Regional Office for Europe. Review of Evidence on Health Aspects of Air Pollution—REVIHAAP Project. Technical Report. 2013. Available online: https://www.euro.who.int/__data/assets/pdf_file/0004/193108/REVIHAAP-Final-technical-report-final-version.pdf (accessed on 9 November 2020).
- Vormittag, E.; Almeida, R. Avaliação da RESOLUção 491/2018 Quanto à sua Efetividade para Proteção da Saúde e Sobre os Mecanismos de Informação à Sociedade. Technical Report of the Instituto Saúde e Sustentabilidadet. 2019. Available online: https://www.saudeesustentabilidade.org.br/wp-content/uploads/2019/06/Avaliacao-491.18-rev3final.pdf (accessed on 13 October 2020).
- Siciliano, B.; Dantas, G.; da Silva, C.M.; Arbilla, G. The Updated Brazilian National Air Quality Standards: A Critical Review. J. Braz. Chem. Soc. 2020, 31, 523–535. [Google Scholar] [CrossRef]
- Lizundia-Loiola, J.; Pettinari, M.L.; Chuvieco, E. Temporal Anomalies in Burned Area Trends: Satellite Estimations of the Amazonian 2019 Fire Crisis. Remote Sens. 2020, 12, 151. [Google Scholar] [CrossRef]
- Chau, K.; Franklin, M.; Gauderman, W.J. Satellite-Derived PM2.5 Composition and Its Differential Effect on Children’s Lung Function. Remote Sens. 2020, 12, 1028. [Google Scholar] [CrossRef]
- Peláez, L.M.G.; Santos, J.M.; de Almeida Albuquerque, T.T.; Reis, N.C., Jr.; Andreão, W.L.; de Fátima, A.M. Air quality status and trends over large cities in South America. Environ. Sci. Policy 2020, 114, 422–435. [Google Scholar] [CrossRef]
- Grupo de Métodos Analíticos de Vigilância Epidemiológica (MAVE). PROCC/Fiocruz e EMap/FGV, e GT-Influenza da Secretaria de Vigilância em Saúde do Ministério da Saúde. InfoGripe Website. Available online: http://info.gripe.fiocruz.br/ (accessed on 13 October 2020).
- Grupo de Métodos Analíticos de Vigilância Epidemiológica (MAVE). PROCC/Fiocruz e EMap/FGV, e GT-Influenza da Secretaria de Vigilância em Saúde do Ministério da Saúde. InfoGripe Online Repository. Available online: https://gitlab.procc.fiocruz.br/mave/repo/-/tree/master/Dados/InfoGripe (accessed on 13 October 2020).
- Rémy, S.; Kipling, Z.; Flemming, J.; Boucher, O.; Nabat, P.; Michou, M.; Bozzo, A.; Ades, M.; Huijnen, V.; Benedetti, A.; et al. Description and evaluation of the tropospheric aerosol scheme in the European Centre for Medium-Range Weather Forecasts (ECMWF) Integrated Forecasting System (IFS-AER, cycle 45R1). Geosci. Model Dev. 2019, 12, 4627–4659. [Google Scholar] [CrossRef]
- Inness, A.; Ades, M.; Agustí-Panareda, A.; Barré, J.; Benedictow, A.; Blechschmidt, A.-M.; Dominguez, J.J.; Engelen, R.; Eskes, H.; Flemming, J.; et al. The CAMS reanalysis of atmospheric composition. Atmos. Chem. Phys. 2019, 19, 3515–3556. [Google Scholar] [CrossRef]
- Freitas, A.R.R.; Donalisio, M.R. Respiratory syncytial virus seasonality in Brazil: Implications for the immunisation policy for at-risk populations. Mem. Inst. Oswaldo Cruz 2016, 111. [Google Scholar] [CrossRef] [PubMed]
- Wiemken, T.L.; Mattingly, W.A.; Furmanek, S.P.; Guinn, B.E.; English, C.L.; Carrico, R.; Peyrani, P.; Ramirez, J.A. Impact of Temperature Relative Humidity and Absolute Humidity on the Incidence of Hospitalizations for Lower Respiratory Tract Infections Due to Influenza, Rhinovirus, and Respiratory Syncytial Virus: Results from Community-Acquired Pneumonia Organization (CAPO) International Cohort Study. Univ. Louisville J. Respir. Infect. 2017, 1, 7. [Google Scholar] [CrossRef]
- Basart, S.; Benedictow, A.; Bennouna, Y.; Blechschmidt, A.-M.; Chabrillat, S.; Christophe, Y.; Cuevas, E.; Eskes, H.J.; Hansen, K.M.; Jorba, O. Upgrade Verification Note for the CAMS Real-Time Global Atmospheric Composition Service: Evaluation of the E-suite for the CAMS Upgrade of July 2019; Copernicus Atmosphere Monitoring Service (CAMS) Report; ECMWF—Shinfield Park: Reading, UK, 2019; Available online: https://doi.org/10.24380/fcwq-yp50 (accessed on 11 December 2020).
Publisher’s Note: MDPI stays neutral with regard to jurisdictional claims in published maps and institutional affiliations. |
© 2020 by the authors. Licensee MDPI, Basel, Switzerland. This article is an open access article distributed under the terms and conditions of the Creative Commons Attribution (CC BY) license (http://creativecommons.org/licenses/by/4.0/).